general assessment problems - college of...
TRANSCRIPT

1
General Assessment Problems
Name (Print) ___________________________________
INSTRUCTIONS: These problems are used as a general assessment of your current
statistical knowledge. Please try your best to finish it. There are 65 questions. I highly encourage you to go through these questions carefully in order to review the materials with which you should be familiar, and to pinpoint places where you need some help. You may leave a problem unanswered if it is from an unfamiliar topic for you. You only need to hand in the first page.
1 2 3 4 5 6 7 8 9 10
11 12 13 14 15 16 17 18 19 20
21 22 23 24 25 26 27 28 29 30
31 32 33 34 35 36 37 38 39 40
41 42 43 44 45 46 47 48 49 50
51 52 53 54 55 56 57 58 59 60
61 62 63 64 65

2
1 For the following study, decide if the two samples are independent samples or paired samples. A group of 100 students were randomly assigned to receive vitamin C (50 students) or a placebo
(50 students). The groups were followed for 2 weeks and the proportions with colds were
compared.
a. Independent samples
b. Paired samples
2 Which of the following correlation values indicates the strongest linear relationship between two
quantitative variables?
a. r = -0.65
b. r = -0.30
c. r = 0.00
d. r = 0.50
3 A national polling organization wants to estimate the percentage of all teenagers who believe
social security will ’be there’ for them. The organization surveys a random sample of 1500
teenagers, and 37% of this sample says that they believe social security will ’be there’ for them.
In this survey, what is the population of interest?
a. The 1500 teenagers who were surveyed.
b. Teenagers who believe social security will ’be there’ for them.
c. All teenagers.
d. The people in the sample who believe social security will ’be there’ for them.
4 A regression line is used for all of the following except one. Which one is not a valid use of a
regression line?
a. to estimate the average value of y at a specified value of x.
b. to predict the value of y for an individual, given that individual’s x-value.
c. to estimate the change in y for a one-unit change in x.
d. to determine if a change in x causes a change in y.
5 The table below provides a statistical summary of the number of CDs owned as reported by
students in a class survey done at Penn State University. Based on the summary shown, which of
the following statements most likely describes the shape of the CDs owned dataset?
a. The summary is evidence that the data are symmetric and bell-shaped.
b. The summary is evidence that the data are symmetric but not bell-shaped.
c. The summary is evidence that the data are skewed to the left.
d. The summary is evidence that the data are skewed to the right.
6 A regression between foot length (response variable in cm) and height (explanatory variable in
inches) for 33 students resulted in the following regression equation: One student in the sample was 73 inches tall with a foot length of 29 cm. What is the residual for
this student?
a. 29 cm
b. 1.31 cm
c. 0.00 cm
d. -1.31 cm

3
7 Which of the following is an example of a binomial random variable?
a. The number of games your favorite baseball team will win this coming season.
b. The number of questions you would get correct on a multiple-choice test if you
randomly guessed on all questions.
c. The number of siblings a randomly selected student has.
d. The number of coins a randomly selected student is carrying.
8 If one card is randomly picked from a standard deck of 52 cards, the probability that the card
will be a red suit (Heart or Diamond), or a face card (Jack, Queen, or King), or both, is
a. 50.0% (26/52)
b. 61.5% (32/52)
c. 76.9% (40/52)
d. 88.5% (46/52)
9 A counselor wants to show that for men who are married by the time they are 30, = average
age when the men are married is not 21 years old. A random sample of 10 men who were
married by age 30 showed an average age at marriage of 22.2, with a sample standard deviation
of 1.9 years. Assume that the age at which this population of men get married for the first time is
normally distributed. What are the appropriate null and alternative hypotheses?
a. H0: = 21 and Ha: < 21
b. H0: = 21 and Ha: >21.
c. H0: = 21 and Ha: 21.
d. H0: 21 and Ha: = 21.
10 Suppose that a polling organization surveys n = 400 people about whether they think the federal
government should give financial aid to the airlines to help them avoid bankruptcy. In the poll,
300 people say that the government should provide aid to the airlines. Which choice gives the
correct notation and value for the sample proportion in this survey?
a. = 0.30
b. p = 0.30
c. = 0.75
d. p =0.75
11 A sample of n = 200 college students is asked if they believe in extraterrestrial life and 120 of
these students say that they do. The data are used to test H0: p = 0.5 versus Ha: p > 0.5, where p
is the population proportion of college students who say they believe in extraterrestrial life. The
following Minitab output was obtained:
What is the correct description of the area that equals the p-value for this problem?
a. The area to the right of 0.60 under a standard normal curve.
b. The area to the right of 2.83 under a standard normal curve.
c. The area to the right of -2.83 under the standard normal curve.
d. The area between 0.532105 and 0.667895 under a standard normal curve.
12 When people get married for the first time, the husband is, on average, 2 years older than the
wife. The standard deviation of the difference in age is roughly 2.5 years. Suppose it is
reasonable to assume that the distribution of the difference in age between the husband and the
wife is normal. Twelve recently married couples (all first marriages) are to be selected and the
average difference in age is to be calculated. What is the correct notation for the statistic of
interest?
a.
b.
c.
d.
4
13 Based on her past experience, a professor knows that the probability distribution for X = number
of students who come to her office hours on Wednesday is given below.
k 0 1 2 3 4
P(X = k) 0.10 0.20 0.50 0.15 0.05
What is the probability that at least 2 students come to office hours on Wednesday?
a. 0.50
b. 0.70
c. 0.80
d. 0.90
14 We wish to conduct a hypothesis test to determine if, on average, the mother in a family spends
more time doing house work per week than the father, for families where both parents have a
full time job. What is the correct notation for the parameter that is tested about?
a.
b.
c.
d.
15 Many undergraduate students are thinking about getting a graduate degree. Do male and female
students have equal opinions about this? A survey of undergraduate students at public
universities in the state of California revealed the following results: Out of 265 female students,
131 were seriously thinking about applying to graduate school. Out of 233 male students, 130
were seriously thinking about applying to graduate school. We wish to compare the proportions
of male and female students who are thinking about getting a graduate degree by calculating a
confidence interval for the difference between males and females.
What is the correct notation for the difference ?
a.
b.
c.
d.
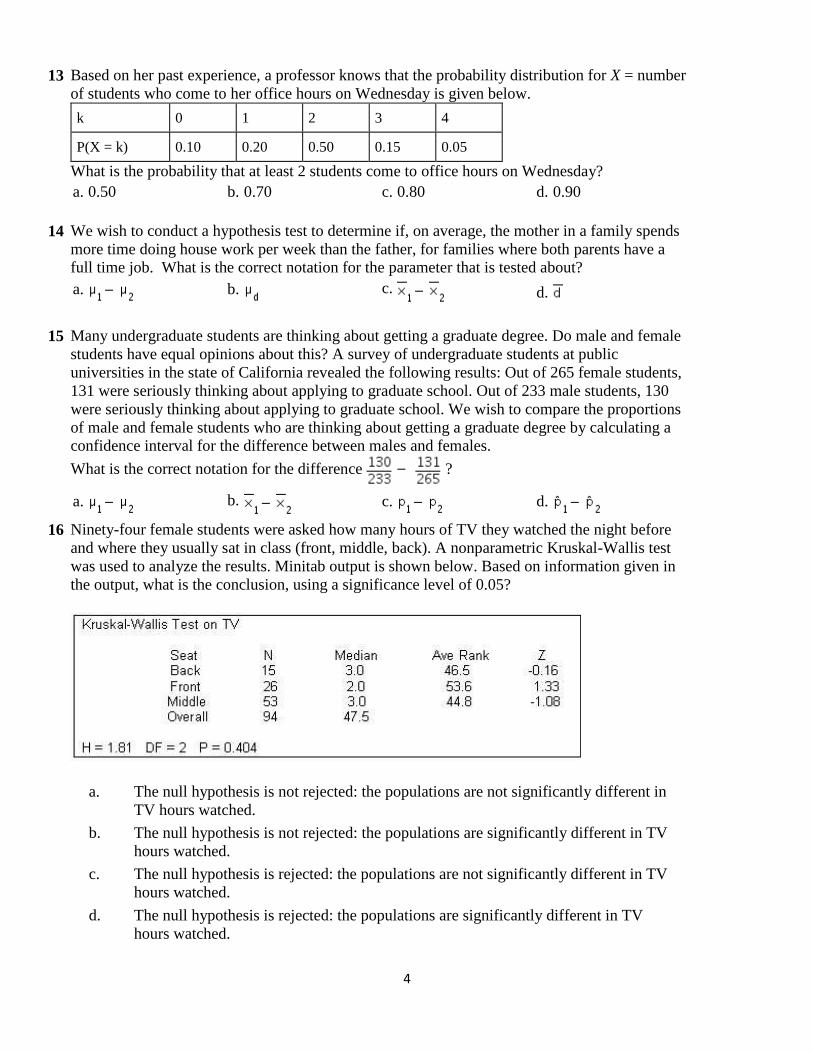
16 Ninety-four female students were asked how many hours of TV they watched the night before
and where they usually sat in class (front, middle, back). A nonparametric Kruskal-Wallis test
was used to analyze the results. Minitab output is shown below. Based on information given in
the output, what is the conclusion, using a significance level of 0.05?
a. The null hypothesis is not rejected: the populations are not significantly different in
TV hours watched.
b. The null hypothesis is not rejected: the populations are significantly different in TV
hours watched.
c. The null hypothesis is rejected: the populations are not significantly different in TV
hours watched.
d. The null hypothesis is rejected: the populations are significantly different in TV
hours watched.
5
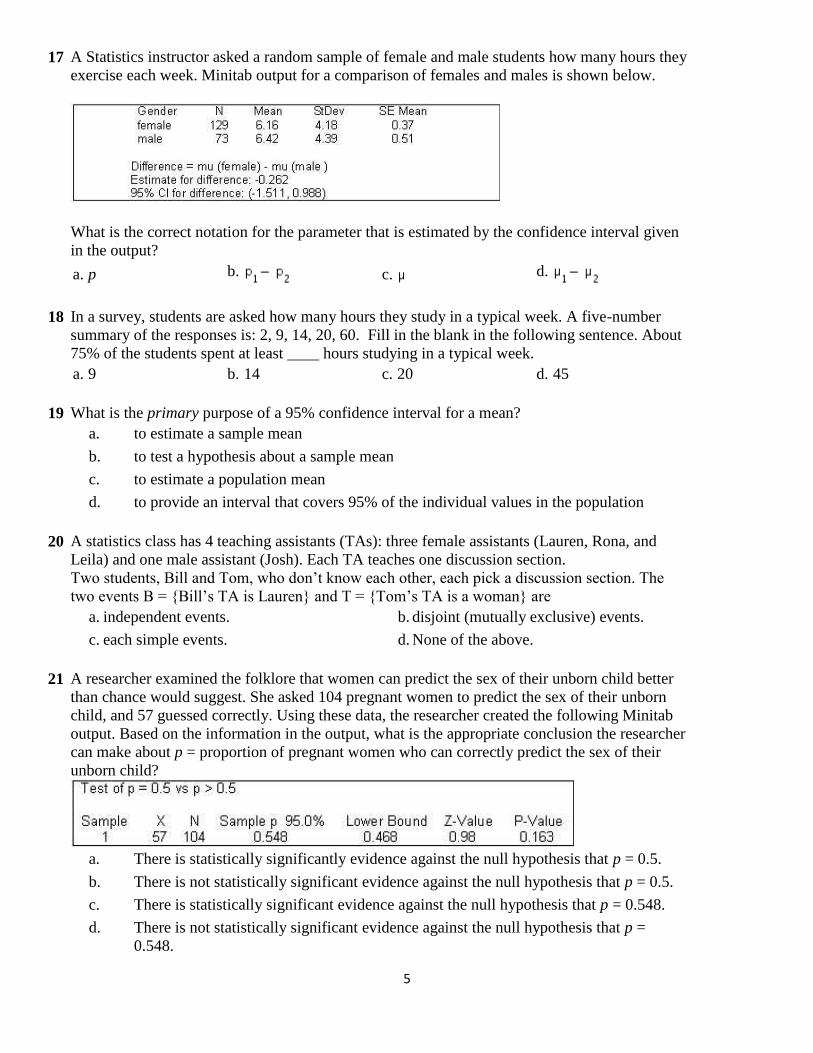
17 A Statistics instructor asked a random sample of female and male students how many hours they
exercise each week. Minitab output for a comparison of females and males is shown below.
What is the correct notation for the parameter that is estimated by the confidence interval given
in the output?
a. p
b.
c.
d.
18 In a survey, students are asked how many hours they study in a typical week. A five-number
summary of the responses is: 2, 9, 14, 20, 60. Fill in the blank in the following sentence. About
75% of the students spent at least ____ hours studying in a typical week.
a. 9
b. 14
c. 20
d. 45
19 What is the primary purpose of a 95% confidence interval for a mean?
a. to estimate a sample mean
b. to test a hypothesis about a sample mean
c. to estimate a population mean
d. to provide an interval that covers 95% of the individual values in the population
20 A statistics class has 4 teaching assistants (TAs): three female assistants (Lauren, Rona, and
Leila) and one male assistant (Josh). Each TA teaches one discussion section. Two students, Bill and Tom, who don’t know each other, each pick a discussion section. The
two events B = {Bill’s TA is Lauren} and T = {Tom’s TA is a woman} are
a. independent events.
b. disjoint (mutually exclusive) events.
c. each simple events.
d. None of the above.
21 A researcher examined the folklore that women can predict the sex of their unborn child better
than chance would suggest. She asked 104 pregnant women to predict the sex of their unborn
child, and 57 guessed correctly. Using these data, the researcher created the following Minitab
output. Based on the information in the output, what is the appropriate conclusion the researcher
can make about p = proportion of pregnant women who can correctly predict the sex of their
unborn child?
a. There is statistically significantly evidence against the null hypothesis that p = 0.5.
b. There is not statistically significant evidence against the null hypothesis that p = 0.5.
c. There is statistically significant evidence against the null hypothesis that p = 0.548.
d. There is not statistically significant evidence against the null hypothesis that p =
0.548.
6
22 For the following study, decide if the two samples are independent samples or paired samples.
A group of 50 students had their blood pressures measured before and after watching a movie
containing violence. The mean blood pressure before the movie was compared with the mean
pressure after the movie.
a. Independent samples
b. Paired samples
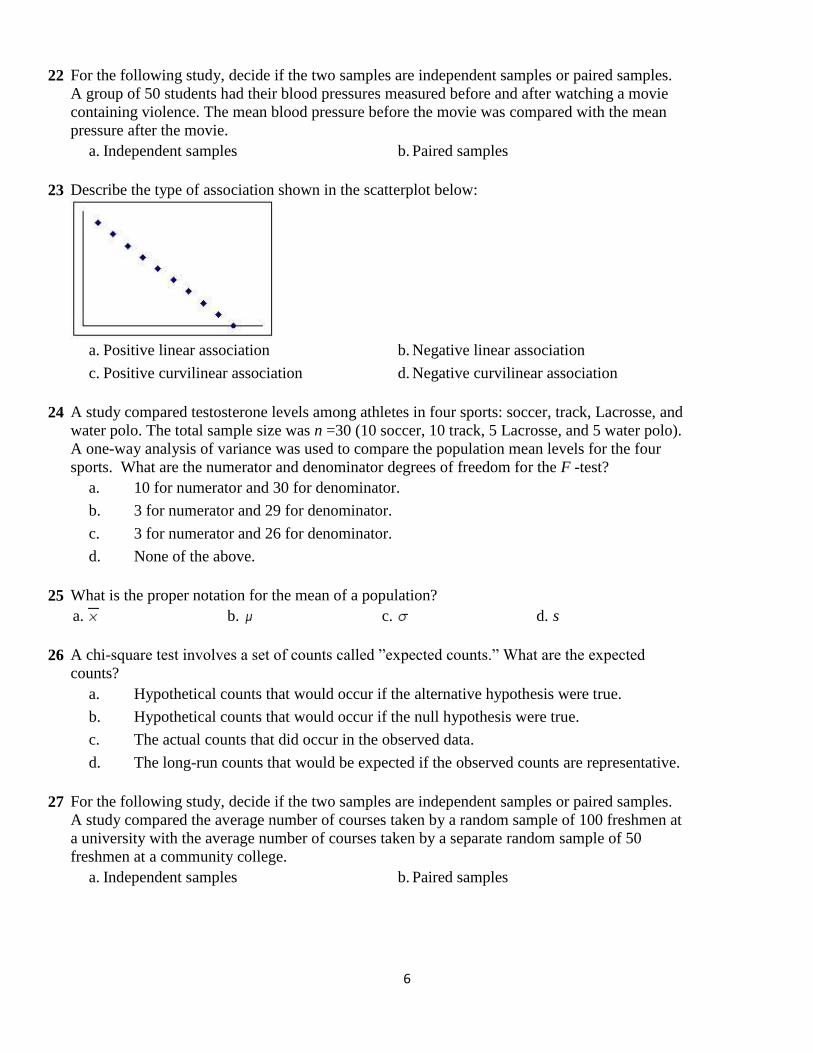
23 Describe the type of association shown in the scatterplot below:
a. Positive linear association
b. Negative linear association
c. Positive curvilinear association
d. Negative curvilinear association
24 A study compared testosterone levels among athletes in four sports: soccer, track, Lacrosse, and
water polo. The total sample size was n =30 (10 soccer, 10 track, 5 Lacrosse, and 5 water polo).
A one-way analysis of variance was used to compare the population mean levels for the four
sports. What are the numerator and denominator degrees of freedom for the F -test?
a. 10 for numerator and 30 for denominator.
b. 3 for numerator and 29 for denominator.
c. 3 for numerator and 26 for denominator.
d. None of the above.
25 What is the proper notation for the mean of a population?
a.
b.
c.
d. s
26 A chi-square test involves a set of counts called ”expected counts.” What are the expected
counts?
a. Hypothetical counts that would occur if the alternative hypothesis were true.
b. Hypothetical counts that would occur if the null hypothesis were true.
c. The actual counts that did occur in the observed data.
d. The long-run counts that would be expected if the observed counts are representative.
27 For the following study, decide if the two samples are independent samples or paired samples.
A study compared the average number of courses taken by a random sample of 100 freshmen at
a university with the average number of courses taken by a separate random sample of 50
freshmen at a community college.
a. Independent samples
b. Paired samples

7
28 A regression analysis done with Minitab for left foot length (y variable) and right foot length (x
variable) for 55 college students gave the following output.
The regression equation for left foot length (y variable) and right foot length (x variable) is
a. = 0.89756 + 2.516x.
b. = 1.116 + 0.04217x.
c. = 2.25 + 20.797x.
d. = 2.516 + 0.89756x.
29 Determine if the statement is a typical null hypothesis (H0) or alternative hypothesis (Ha).
The average time to graduate for undergraduate English majors is less than the average time to
graduate for undergraduate history majors.
a. Null hypothesis
b. Alternative hypothesis
30 Which one of the following variables is not categorical?
a. Age of a person.
b. Gender of a person: male or female.
c. Choice on a test item: true or false.
d. Marital status of a person (single, married, divorced, other).
31 In the 1994 General Social Survey, a nationwide survey done every other year in the United
States, the 1,185 respondents who had ever been married were asked the age at which they first
wed and whether they had ever been divorced. The two-way table below summarizes the
observed counts for the relationship between ”age first wed” (categorized into four age groups)
and ”ever divorce” (no or yes). A chi-square value and p-value are given below the table.
What is the expected count for the “Under 20” and “No” cell?
a. (323)(1/3)
b. 150
c. (323)(722)/1185
d. (1185)(1/8)

8
32 In the General Social Survey, respondents were asked ”If your party nominated a woman for
President, would you vote for her if she were qualified for the job?” Minitab output for 953
respondents, by race, is shown below. At a significance level of 0.05, what is the conclusion?
a. Reject the null hypothesis and conclude there is no relationship between the
variables.
b. Reject the null hypothesis and conclude there is a relationship between the variables.
c. Do not reject the null hypothesis and conclude the evidence is not strong enough to
show a relationship between the two variables.
d. Do not reject the null hypothesis and conclude there is a relationship between the
variables.
33 A hypothesis test for a population proportion p is given below:
H0: p = 0.10 Ha: p 0.10
For sample size n and sample proportion compute the value of the z-statistic.
Sample size n = 500 and sample proportion = 0.04. z-statistic = ?
a. -6.84
b. -4.47
c. 4.47
d. 6.84
34 Pulse rates of adult men are approximately normal with a mean of 70 and a standard deviation of
8. Which choice correctly describes how to find the proportion of men that have a pulse rate
greater than 78?
a. Find the area to the left of z = 1 under a standard normal curve.
b. Find the area between z = -1 and z = 1 under a standard normal curve.
c. Find the area to the right of z =1 under a standard normal curve.
d. Find the area to the right of z = -1 under a standard normal curve.
35 A study compared grade point averages (GPA) among students in 4 different majors (English,
History, Statistics, and Art) using analysis of variance. A total sample size of 20 students (5 in
each major) was studied. The sum of squares for groups is SS Groups = 60. What is the Mean
Square for groups (MS Groups)?
a. 3
b. 15
c. 20
d. None of the above.
9
36 When constructing a confidence interval for the difference in two population means, it is
appropriate to use the pooled standard error only when
a. the population standard deviations can be assumed to be equal.
b. the sample standard deviations are exactly equal.
c. the population means can be assumed to be equal.
d. the sample means are exactly equal.
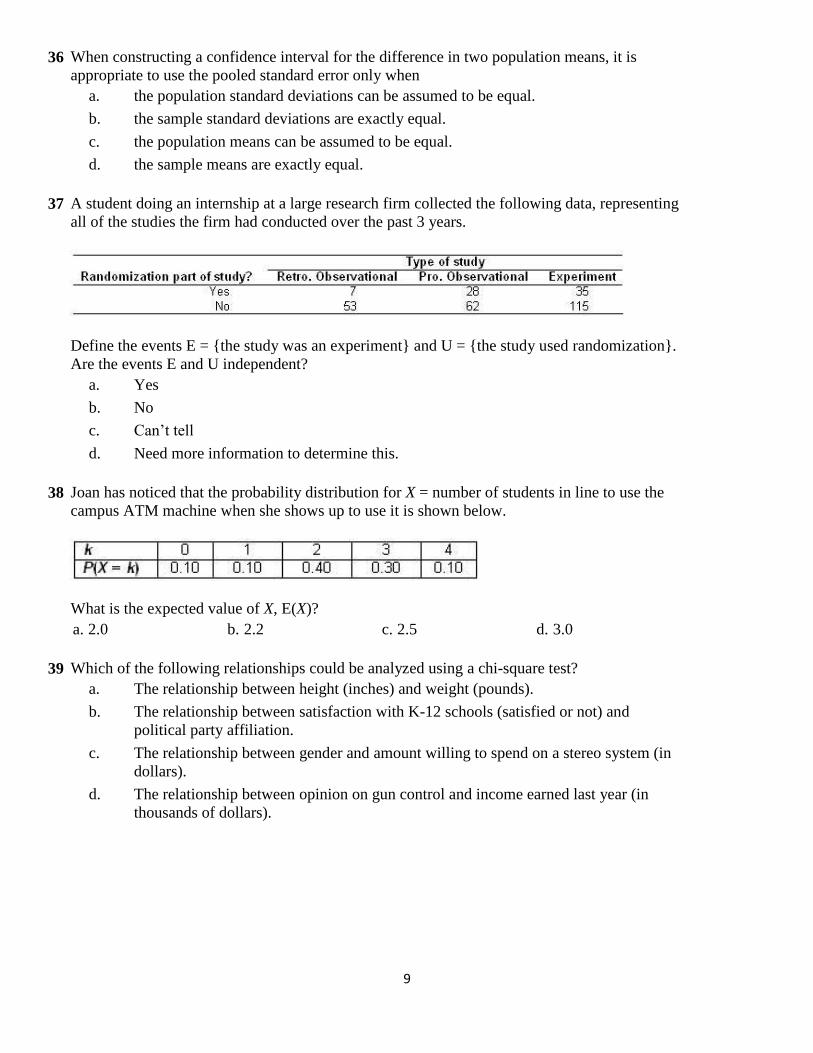
37 A student doing an internship at a large research firm collected the following data, representing
all of the studies the firm had conducted over the past 3 years.
Define the events E = {the study was an experiment} and U = {the study used randomization}.
Are the events E and U independent?
a. Yes
b. No
c. Can’t tell
d. Need more information to determine this.
38 Joan has noticed that the probability distribution for X = number of students in line to use the
campus ATM machine when she shows up to use it is shown below.
What is the expected value of X, E(X)?
a. 2.0
b. 2.2
c. 2.5
d. 3.0
39 Which of the following relationships could be analyzed using a chi-square test?
a. The relationship between height (inches) and weight (pounds).
b. The relationship between satisfaction with K-12 schools (satisfied or not) and
political party affiliation.
c. The relationship between gender and amount willing to spend on a stereo system (in
dollars).
d. The relationship between opinion on gun control and income earned last year (in
thousands of dollars).
10
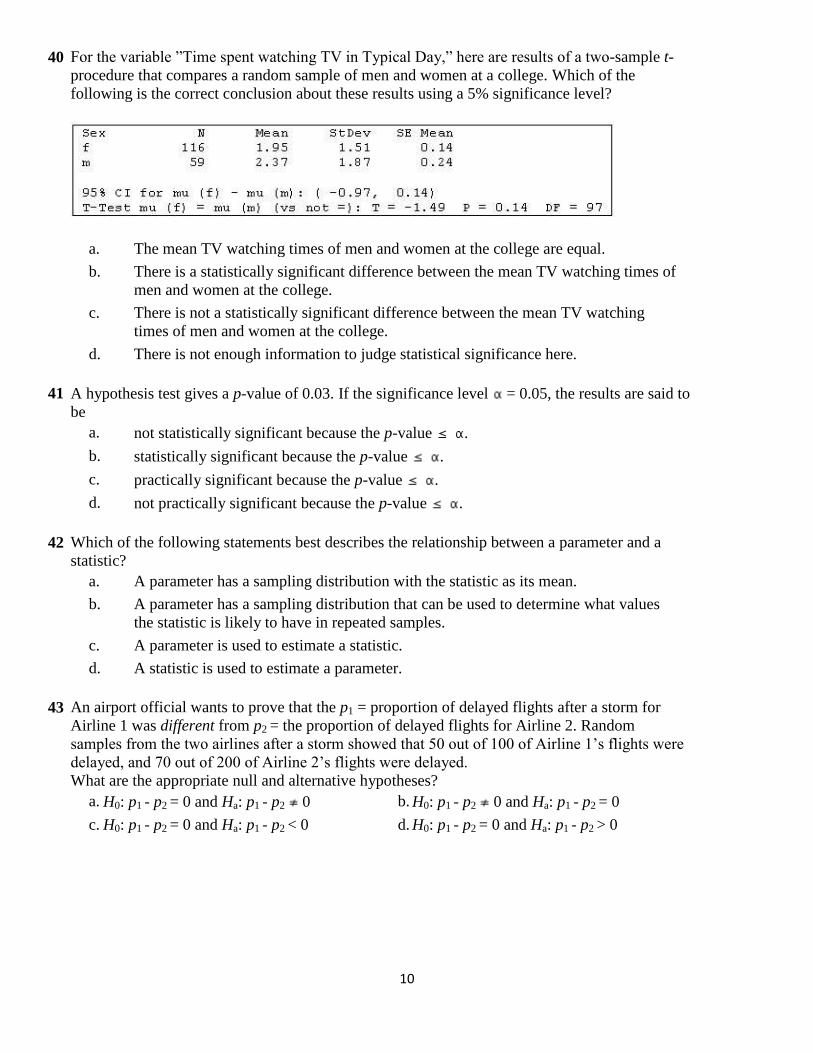
40 For the variable ”Time spent watching TV in Typical Day,” here are results of a two-sample t-
procedure that compares a random sample of men and women at a college. Which of the
following is the correct conclusion about these results using a 5% significance level?
a. The mean TV watching times of men and women at the college are equal.
b. There is a statistically significant difference between the mean TV watching times of
men and women at the college.
c. There is not a statistically significant difference between the mean TV watching
times of men and women at the college.
d. There is not enough information to judge statistical significance here.
41 A hypothesis test gives a p-value of 0.03. If the significance level = 0.05, the results are said to
be
a. not statistically significant because the p-value .
b. statistically significant because the p-value .
c. practically significant because the p-value .
d. not practically significant because the p-value .
42 Which of the following statements best describes the relationship between a parameter and a
statistic?
a. A parameter has a sampling distribution with the statistic as its mean.
b. A parameter has a sampling distribution that can be used to determine what values
the statistic is likely to have in repeated samples.
c. A parameter is used to estimate a statistic.
d. A statistic is used to estimate a parameter.
43 An airport official wants to prove that the p1 = proportion of delayed flights after a storm for
Airline 1 was different from p2 = the proportion of delayed flights for Airline 2. Random
samples from the two airlines after a storm showed that 50 out of 100 of Airline 1’s flights were
delayed, and 70 out of 200 of Airline 2’s flights were delayed. What are the appropriate null and alternative hypotheses?
a. H0: p1 - p2 = 0 and Ha: p1 - p2 0
b. H0: p1 - p2 0 and Ha: p1 - p2 = 0
c. H0: p1 - p2 = 0 and Ha: p1 - p2 < 0
d. H0: p1 - p2 = 0 and Ha: p1 - p2 > 0

11
44 Data were collected by giving a survey to a random sample of students at a university. One
question asked was: ”Do you believe in extraterrestrial life?” Here is a comparison of the
proportions of males and females that said ”yes”:
How is the p-value for this test found?
a. The area to the left of -2.64 under the standard normal distribution.
b. The area to the right of -2.64 under the standard normal distribution.
c. The area to the left of -2.64 under a t distribution with 72 degrees of freedom.
d. The area to the right of -2.64 under a t distribution with 72 degrees of freedom.
45 A researcher conducts a study to determine whether or not taking Vitamin C prevents colds.
What is the explanatory variable in this study?
a. Whether or not one takes Vitamin C.
b. Whether or not one gets colds.
c. Whether or not one is a participant in the study.
d. Whether or not one knows which treatment one is taking.
46 The percent of data which lie between the lower and upper quartiles is
a. 10%.
b. 25%.
c. 50%.
d. 75%.
47 For the following situation, is the given percent a statistic or a parameter?
A customs inspector sampled 5 boxes among 20 boxes being shipped from out of the country.
He found that one of the five boxes (20%) contained an illegal food item.
a. Statistic
b. Parameter
48 A reviewer rated a sample of fifteen wines on a score from 1 (very poor) to 7 (excellent). A
correlation of 0.92 was obtained between these ratings and the cost of the wines at a local store.
In plain English, this means that
a. in general, the reviewer liked the cheaper wines better.
b. having to pay more caused the reviewer to give a higher rating.
c. wines with low ratings are likely to be more expensive (probably because fewer will
be sold).
d. in general, as the cost went up so did the rating.

12
49 In a hypothesis test the decision was made to not reject the null hypothesis. Which type of
mistake could have been made?
a. Type 1.
b. Type 2.
50 Lauren wants to wear something warm when she leaves for class. She reaches into her coat
closet without looking and grabs a hanger. Based on what she has in her coat closet, she has a
30% chance of picking a sweater, a 50% chance of picking a coat, and a 20% chance of picking
a jacket. What is the probability that she will pick a sweater or a coat?
a. 15%
b. 30%
c. 50%
d. 80%
51. A machine has 7 identical components which function independently. The probability that a
component will fail is 0.2. The machine will stop working if more than three components fail. Find
the probability that the machine will be working.
A) 0.8853 B) 0.1147 C) 0.9667 D) 0.0333
52. The probability that a radish seed will germinate is 0.7. A gardener plants seeds in batches of 11.
Find the standard deviation for the random variable X, the number of seeds germinating in each
batch.
A) 1.52 B) 1.502 C) 1.449 D) 1.432
53. Three random variables X, Y, and Z, are described below. In which of these situations would it be
acceptable to use the binomial distribution?
A: A bag contains 4 blue marbles and 8 red marbles. Five marbles are drawn at random with
replacement. The random variable X is the number of blue marbles drawn.
B: A bag contains 4 blue marbles and 8 red marbles. Six marbles are drawn at random without
replacement. The random variable Y is the number of blue marbles drawn.
C: A bag contains 30 blue marbles and 38 red marbles. Three marbles are drawn at random
without replacement. The random variable Z is the number of blue marbles drawn.
A) A and C B) B and C C) A only D) A, B, and C
54. The variable X is normally distributed. The mean is μ = 60.0 and the standard deviation is σ = 4.0.
Find P(X < 53.0).
A) 0.0802 B) 0.9599 C) 0.0401 D) 0.5589
55. The lengths of human pregnancies are normally distributed with a mean of 268 days and a standard
deviation of 15 days. What is the probability that a pregnancy lasts at least 300 days?
A) 0.0179 B) 0.0166 C) 0.9834 D) 0.4834
56. The lifetimes of light bulbs of a particular type are normally distributed with a mean of 263 hours
and a standard deviation of 8 hours. Find the first quartile Q1.
A) 261 B) 268.36 C) 265 D) 257.64
57. True or false, areas under the standard normal curve cannot be negative, whereas z-scores can be
positive or negative.
A) True B) False

13
58. Scores on an aptitude test are distributed with a mean of 220 and a standard deviation of 30. The
shape of the distribution is unspecified. What is the probability that the sampling error made in
estimating the population mean by the mean of a random sample of 50 test scores will be at most 5
points?
A) 0.881 B) 0.762 C) 0.135
D) Cannot be determined, because the distribution of the population is not known to be normal.
59. The amount of coffee that a filling machine puts into an 8-ounce jar is normally distributed with a
mean of 8.2 ounces and a standard deviation of 0.18 ounce. Determine the percentage of samples of
size 16 that will have mean amounts of coffee within 0.1 ounce of the population mean of 8.2
ounces.
A) 42.46% B) 71.23% C) 98.68% D) 97.36%
60. The monthly earnings of a group of business students are normally distributed with a standard
deviation of 545 dollars. A researcher wants to estimate the mean monthly earnings of all business
students. Find the sample size needed to have a confidence level of 95% and a margin of error of 128
dollars.
A) 70 B) 5 C) 61 D) 2
61. A random sample of 30 households was selected from a particular neighborhood. The number of
cars for each household is shown below. Estimate the mean number of cars per household for the
population of households in this neighborhood. Give the 95% confidence interval.
A) 1.3 to 1.7 cars B) 1.1 to 1.9 cars C) 1.5 to 1.9 cars D) 1 to 2 cars
62. If the P-value for a hypothesis test is P = 0.057. Determine the strength of the evidence against the
null hypothesis.
A) Moderate B) Very strongC) Strong D) Weak or none
63. I collect a random sample of size n from a population and from the data collected
compute a 95% confidence interval for the mean of the population. Which of the
following would produce a new confidence interval with larger width (larger margin of
error) based on these same data?
A) Use a smaller confidence level.
B) Use a larger confidence level.
C) Use the same confidence level, but compute the interval n times. Approximately
5% of these intervals will be larger.
D) Nothing can guarantee absolutely that you will get a larger interval. One can only
say the chance of obtaining a larger interval is 0.05.
14
64. You plan to construct a 99% confidence interval for the mean of a Normal population
with (known) standard deviation . By using a sample size of 400 rather than 100, you
can reduce the margin of error by a factor of
A) 2 (the new margin of error will be half that of the one based on 100 observations).
B) 4 (the new margin of error will be 1/4 that of the one based on 100 observations).
C) 16 (the new margin of error will be 1/16 that of the one based on 100
observations).
D) none of the above.
65. A medical researcher wishes to investigate the effectiveness of exercise versus diet in
losing weight. Two groups of 25 overweight adult subjects are used, with a subject in
each group matched to a similar subject in the other group on the basis of a number of
physiological variables. One group is placed on a regular program of vigorous exercise,
but with no restriction on diet, and the other group on a strict diet, but with no
requirement to exercise. The weight losses after 20 weeks are determined for each
subject, and the difference between matched pairs of subjects (weight loss of subject in
exercise group – weight loss of matched subject in diet group) is computed. The mean
of these differences in weight loss is found to be –2 lbs. with standard deviation s = 6
lbs. Is this evidence of a difference in mean weight loss for the two methods? To test
this, consider the population of differences (weight loss overweight adult would
experience after 20 weeks on the exercise program) – (weight loss the same adult would
experience after 20 weeks on the strict diet). Let be the mean of this population of
differences and assume their distribution is approximately Normal. We test the
hypotheses H0: = 0 versus Ha: 0, using the matched pairs t test. The P-value for
this test is
A) larger than .10.
B) between .10 and .05.
C) between .05 and .01.
D) below .01.