general description - · pdf file2 worldwide, the mitre corporation, mantech international,...
TRANSCRIPT

\28587041.1
CERTAIN FINANCIAL, ECONOMIC AND DEMOGRAPHIC INFORMATION CONCERNING FAIRFAX COUNTY, VIRGINIA
Set forth below is certain financial, economic and demographic information describing generally the underlying conditions that may affect the performance and value of retail and commercial property in Fairfax County. The success of any retail or commercial venture, and the value of the real property on which such venture is located, is subject to many factors. Further no assurance can be given that any particular measurement of financing, economic or demographic factor in Fairfax County will necessarily correlate with the performance and value of any particular retail or commercial establishment within the District. The following information should not be read with a view to the creditworthiness of Fairfax County, which is not obligated to pay debt service on the 2011A Bonds.
GENERAL DESCRIPTION
Overview
Fairfax County is located in the northeastern corner of the Commonwealth of Virginia (the “Commonwealth”) and encompasses an area of 407 square miles. Its current estimated population is approximately one million. The County is part of the Washington, D.C. metropolitan area, which includes jurisdictions in Maryland, the District of Columbia, and Northern Virginia.
The Fairfax County government is organized under the Urban County Executive form of government (as defined under Virginia law). The governing body of Fairfax County is the Board of Supervisors, which makes policies for the administration of Fairfax County (the “County”). The Board of Supervisors is comprised of ten members: the Chairman, elected at large for a four year term, and one member from each of nine districts, each elected for a four year term by the voters of the district in which the member resides. The Board of Supervisors appoints a County Executive to act as the administrative head of the County. The County Executive serves at the pleasure of the Board of Supervisors, carries out the policies established by the Board of Supervisors, directs business and administrative procedures, and recommends officers and personnel to be appointed by the Board of Supervisors.
ECONOMIC FACTORS
Economic Development
Economic development activities of the County are carried out through the Fairfax County Economic Development Authority (“EDA”), whose seven commissioners are appointed by the Board of Supervisors. The EDA promotes Fairfax County as a premier location for business start-up, relocation and expansion, and capital investment. It works with new and existing businesses to help identify their facility and site needs, and assist in resolving County-related issues and provide other business assistance. Pursuant to its enabling legislation, the EDA encourages investment in the County with tax-exempt conduit revenue bond financing.
The total inventory of office space in the County was estimated at 113 million square feet in the first half of 2010. Nearly 2.5 million square feet of new office space was available; more than half of this space was in the Chantilly and Dulles submarkets. Industrial/hybrid space in the County was estimated at 38.8 million square feet as of mid-year 2010. The direct vacancy rates for the office and industrial/hybrid markets were 13.3% and 12.7%, respectively, as of June 30, 2010. Including sublet space, the office vacancy rate and the industrial/hybrid vacancy rate were 15.7% and 13.7%, respectively, in the first half of 2010.
The base of technology-oriented companies, particularly in computer software development, computer systems integration, telecommunications, and Internet-related services, has served as a strong magnet for the expansion and attraction of business and professional services. Government contractors, as well as diversified business and financial services, have added to the demand for prime office space in a number of key employment centers throughout the County. Major corporations such as Booz Allen Hamilton, Capital One Financial, CSC, Federal Home Loan Mortgage Corporation (Freddie Mac), Gannett (USA Today), General Dynamics, Hilton
Attachment 6: Appendix I
2
Worldwide, The MITRE Corporation, ManTech International, SAIC, TASC, and Volkswagen Group of America are headquartered in Fairfax County. In addition, defense contractor Northrop Grumman will move its corporate headquarters from Los Angeles to Fairfax County beginning in summer 2011.
As of midyear 2010, there were 96 hotels, each with 75 or more rooms completed or under construction in the County, totaling 17,242 hotel rooms and nearly 11 million square feet of space. Two hotels that were under construction at year-end 2009—the 91-room SpringHill Suites Alexandria and the 86-room Holiday Inn Express & Suites Alexandria/Fort Belvoir—have delivered, each adding 58,000 square feet to the County’s hotel inventory. Hotel development parallels commercial construction in terms of diversity of concept and design with a variety of product and service mixes (all-suites, business meeting facilities, and leisure facilities) in the marketplace. National chains such as AmeriSuites, Best Western, Comfort Inn, Doubletree, Embassy Suites, Hampton Inn, Hilton, Holiday Inn, Hyatt, Marriott, Ritz-Carlton, Sheraton and Westin offer a wide range of hotel options in the County.
The 16-mile Dulles Toll Road provides access from Washington, D.C. through Tysons Corner and Reston-Herndon (the largest business centers in the County) to Dulles Airport, on the County’s western edge. Pursuant to legislation enacted by the Virginia General Assembly at its 1995 session, the Commonwealth sold $45.2 million in bonds for the construction of two additional lanes (for a total of eight lanes) for the Dulles Toll Road between Interstate 495 in Fairfax County and Route 28 (Sully Road) in Fairfax and Loudoun Counties. Additionally, a 14-mile extension of the Dulles Toll Road, the privately-financed Dulles Greenway, connects Dulles Airport with Leesburg, in Loudoun County west of Fairfax County.
Washington Dulles International Airport has experienced a significant increase in service levels and demand in recent years, serving as a catalyst for corporate activities dependent on immediate access to air travel. Dulles Airport is served by 32 airlines and offers nonstop flights to 82 domestic and 45 international destinations. The airport is the second largest international gateway on the east coast. Dulles Airport reported more than 23 million passengers, more than 340,000 takeoffs and landings, and moved nearly 646,000 pounds of mail and freight in 2009. In 2000, the Metropolitan Washington Airports Authority initiated Dulles Development (D2), the second phase of its ongoing capital construction program. The nearly $4 billion development program includes the completed AeroTrain, a new passenger conveyance system; construction of a new fourth north-south runway; and expansion of Concourse B. Future projects include expansion of the International Arrivals Building in the Main Terminal, and construction of a fifth east-west runway and a new concourse beyond the existing Concourses C and D.
Metrorail service is planned to be extended approximately 23 miles from an area east of West Falls Church station, along the median of the Dulles Connector Road through Tysons Corner, then further out the Dulles International Airport Access Road, through Dulles Airport, to Route 772 in Loudoun County. The total cost of the unofficially named Silver Line project to Dulles Airport currently is estimated at more than $5.8 billion to $6.5 billion. The project is currently expected to be completed in two phases. Phase I, which is underway, is expected to cost approximately $2.64 billion for the segment from the Metrorail Orange line to Wiehle Avenue in Reston, including construction of five new stations. The cost will be shared by the federal government, the Metropolitan Washington Airports Authority (MWAA), Dulles Toll Road revenues and Fairfax County. Relocation of 21 utilities in the Tysons Corner area is progressing. Phase II construction will be funded by Fairfax and Loudoun Counties, Virginia and MWAA. Final cost estimates for Phase II (which includes six Metro stations between Wiehle Avenue, Dulles Airport and Loudoun County) are expected to be developed at a later date.
In December 2003, the Smithsonian Institution opened the new National Air and Space Museum Dulles Center for the display and collection of rare and historic aviation and space artifacts. The Steven F. Udvar-Hazy Center, a 761,000-square-foot building located on 177 acres at Dulles Airport, is home to more than 200 aircraft and 135 spacecraft, including the space shuttle Enterprise and the B-29 Superfortress “Enola Gay.” The museum welcomed more than one million visitors in FY 2009.
The Board of Supervisors and the County actively support the revitalization and redevelopment throughout the County, particularly in its more mature business areas. Enhancements to the residential and commercial neighborhoods in Annandale, Bailey Crossroads/Seven Corners, the Lake Anne section of Reston, the Springfield and McLean central business districts, Merrifield, and the Richmond Highway corridor in the southeastern portion
3
of the County are progressing, and a number of capital improvement projects and other construction in process or already completed have improved the appearance and quality of life of these communities. Most notably, Tysons Corner—Fairfax County’s “downtown”—is undergoing a transformative land-use replanning effort. Spurred by the Metrorail project, the County is working to set the stage for Tysons’s evolution into a more urban-scale, pedestrian-friendly environment, with additional housing and open space in addition to more-dense office and retail development.
Employment
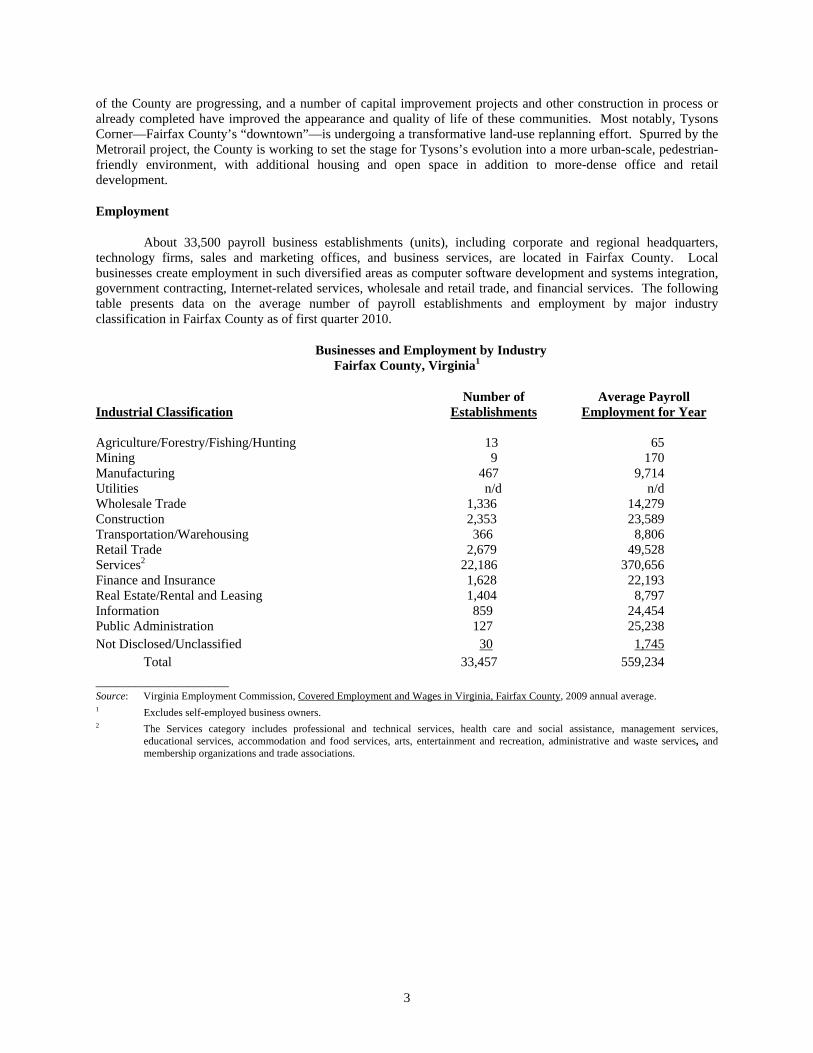
About 33,500 payroll business establishments (units), including corporate and regional headquarters, technology firms, sales and marketing offices, and business services, are located in Fairfax County. Local businesses create employment in such diversified areas as computer software development and systems integration, government contracting, Internet-related services, wholesale and retail trade, and financial services. The following table presents data on the average number of payroll establishments and employment by major industry classification in Fairfax County as of first quarter 2010.
Businesses and Employment by Industry Fairfax County, Virginia1
Industrial Classification Number of
Establishments Average Payroll
Employment for Year Agriculture/Forestry/Fishing/Hunting
13
65
Mining 9 170 Manufacturing 467 9,714 Utilities n/d n/d Wholesale Trade 1,336 14,279 Construction 2,353 23,589 Transportation/Warehousing 366 8,806 Retail Trade 2,679 49,528 Services2 22,186 370,656 Finance and Insurance 1,628 22,193 Real Estate/Rental and Leasing 1,404 8,797 Information 859 24,454 Public Administration 127 25,238 Not Disclosed/Unclassified 30 1,745 Total 33,457 559,234
____________________ Source: Virginia Employment Commission, Covered Employment and Wages in Virginia, Fairfax County, 2009 annual average. 1 Excludes self-employed business owners. 2 The Services category includes professional and technical services, health care and social assistance, management services,
educational services, accommodation and food services, arts, entertainment and recreation, administrative and waste services, and membership organizations and trade associations.

4
The following is a list of the 25 largest private, base sector (non-retail) employers in Fairfax County as of June 2010.
Company Name Type of Business
County Employment Range*
Inova Health System Health Care 7,000 – 10,000 Booz Allen Hamilton, Inc. Professional, Scientific, and Technical
Services 7,000 – 10,000
Northrop Grumman Professional, Scientific, and Technical Services
7,000 – 10,000
SAIC Professional, Scientific, and Technical Services
4,000 – 6,999
Lockheed Martin Professional, Scientific, and Technical Services
4,000 – 6,999
Federal Home Loan Mortgage Corporation (Freddie Mac) Finance and Insurance 4,000 – 6,999 General Dynamics Navy Federal Credit Union
Professional, Scientific, and Technical Services Finance and Insurance
1,000 -- 3,999
1,000 -- 3,999
Sprint
Information/Telecom 1,000 -- 3,999
Deloitte Fannie Mae
Professional, Scientific, and Technical Services Finance and Insurance
1,000 – 3,999
1,000 -- 3,999 CSC Professional, Scientific, and Technical
Services 1,000 – 3,999
Accenture Professional, Scientific, and Technical Services
1,000 – 3,999
CACI International Professional, Scientific, and Technical Services/Telecom
1,000 – 3,999
Greenspring Health Care and Social Assistance 1,000 – 3,999 BAE Systems Professional, Scientific, and Technical
Services/Transportation Equipment 1,000 – 3,999
IBM Professional, Scientific, and Technical
Services/Computers, Peripherals Equipment
1,000 – 3,999
ExxonMobil Wholesale Trade (Petroleum Products) 1,000 – 3,999 HP Enterprise Services Information/Data Processing Services 1,000 – 3,999 Verizon Information/Telecom 1,000 – 3,999 Cox Communications ITT Industries
Information/Telecom Professional, Scientific, and Technical Services
1,000 - 3,999 1,000 – 3,999
Gannett Company Information/Newspaper Publishers 1,000 – 3,999 Administaff ICF International
Administrative and Support Services Professional, Scientific, and Technical Services
1,000 – 3,999 1,000 – 3,999
____________________________________________________ Sources: Fairfax County Economic Development Authority and the Virginia Employment Commission.
* Note: Employment estimates for separate facilities of the same firm have been combined. Broad employment ranges are given to ensure confidentiality and are based on quarterly employer reports to the Virginia Employment Commission. Type of Business is based on 2 digit North American Industry Classification System (NAICS) codes.

5
Unemployment in the County has historically been, and continues to be, well below national averages even in challenging economic times. The average unemployment rate in Fairfax from January through November 2010 was 5.0%. Virginia and U.S. average unemployment rates during this same period were 7.0% and 9.7%, respectively. Reflecting the global recession that began in late 2007 and escalated a year later, Fairfax County’s unemployment rate had risen to a high of 5.5% in early 2010, but had dropped to a low of 4.6% November 2010, reflecting an overall “leveling out” of the economic downturn. The following table shows the average annual unemployment rate in Fairfax County as compared with Virginia and national averages in the past decade:
Average Annual Unemployment Rates
Calendar Year
Fairfax County
Virginia
United States
2000 1.6% 2.3% 4.0% 2001 2.5 3.2 4.7 2002 3.4 4.2 5.8 2003 3.1 4.1 6.0 2004 2.7 3.7 5.5 2005 2.5 3.5 5.1 2006 2.2 3.0 4.6 2007 2.1 3.0 4.6 2008 2009 2010 (through November)
2.8 4.7 5.0
4.0 6.7 7.0
5.8 9.3 9.7
____________ Source: Virginia Employment Commission.
According to the Virginia Employment Commission, the number of jobs in the County was 562,674 in March 2010, and averaged 574,600 for second quarter 2010. This number of jobs does not include self-employed persons. The following table presents total non-agricultural payroll employment in recent years:
Non-agricultural Employment
As of March
Non-agricultural Employment in Fairfax County % Change As of March
Non-agricultural Employment in Fairfax County % Change
2001 541,132 4.3 2006 567,781 2.2 2002 524,298 (3.1) 2007 579,045 2.0 2003 524,232 0.0 2008 588,373 1.6 2004 533,562 1.8 2009 568,185 (3.6) 2005 555,473 4.1 2010 562,674 (1.0)
_____________ Source: Virginia Employment Commission.
Population
Fairfax County government estimated the County’s 2010 population at 1,056,435. In 1980, Fairfax County was the third most populous jurisdiction in the Washington, D.C. primary metropolitan statistical area, as defined by the U.S. Bureau of the Census. By 1990, Fairfax County, with 818,584 residents, had become the most populous jurisdiction in the Washington, D.C. area, adding an average of 22,000 persons per year in the 1980s. Population growth during the 1990s and 2000s has slowed in Fairfax County; on average, about 8,700 persons per year have been added to the population during 2000-2010.

6
Fairfax County Population
Calendar Year Population
1940 40,929 1950 98,557 1960 248,897 1970 454,275 1980 596,901 1990 818,584 2000 969,749
2001 984,366 2002 1,004,435 2003 1,012,090 2004 1,022,298 2005 1,033,646 2006 1,037,311 2007 1,041,507 2008 2009 2010
1,045,694 1,051,990 1,056,435
_________________ Sources: U.S. Bureau of the Census (1940-2000) and the Fairfax County Department of Systems Management for Human Services.
The following table reflects the population age distribution of County residents, based on the U.S. Census Bureau’s 2009 American Community Survey. The survey estimated the County’s total population at 1,037,605.
Household Population Age Distribution Fairfax County
2009 Age Group Number Percent (%) Under 20 years ...................................................................................................... 283,085 27.3 20 – 34 .................................................................................................................. 203,675 19.6 35 – 54 .................................................................................................................. 323,957 31.2 55 – 64 .................................................................................................................. 125,588 12.1 65 and Over ......................................................................................................... 101,300 9.8 Total ............................................................................................................. 1,037,605 100.0 ________________ Source: U.S. Bureau of the Census, 2009 American Community Survey.

7
Based on income data released in September 2010 by the U.S. Census Bureau Fairfax County’s median household income in 2009 was $102,499. The estimated median family income in Fairfax County was $122,651 in 2009. Nearly 31% of the County households and just over 38% of families had annual incomes of $150,000 or more. The following table illustrates the 2009 household and family income distribution in the County.
Annual Household and Family Income Distribution (by Percentage) Fairfax County, 2009
Income Level Household Family Under $25,000 7.6% 5.6% $25,000 – 49,999 11.6 9.7 $50,000 – 74,999 15.0 11.7 $75,000 – 99,999 14.1 12.3 $100,000 – 149,999 21.3 22.6 $150,000 or more 30.4 38.2 Median Income $102,499 $122,651
____________________________ Sources: Fairfax County Department of Systems Management for Human Services; Population Division, U.S. Bureau of the
Census.
Note: In 2009, the Population-Division, U.S. Bureau of the Census estimated that there were 371,129 households and 260,241 families in Fairfax County. “Families” are defined as those households containing two or more persons related by blood, marriage, or adoption.
The following table shows that total taxable retail sales in the County rose from 1999 through third quarter 2010, reflecting rising income levels and the County’s increasing dominance as a regional commercial and retail center. Declining per capita taxable retail sales in 2001, 2002, 2005, 2008 and 2009 reflect general economic downturns. The global economic recession that began in fall 2007 is responsible for the most recent decline.
Per Capita Taxable Sales
Calendar Year Taxable
Sales (in Billions) Population Per Capita
Taxable Sales
1999 $10.62 946,371 $11,220 2000 11.32 969,749 11,676 2001 11.01 984,366 11,180 2002 11.13 1,004,435 11,080 2003 11.68 1,012,090 11,538
2004 12.66 1,022,298 12,387 2005 11.60 1,033,646 11,221 2006 13.29 1,037,311 12,812 2007 13.88 1,041,507 13,328 2008 2009
13.55 12.93
1,045,694 1,051,990
12,958 12,293
2010 (through third
quarter) 9.67 1,056,435 9,145
_______________________________ Sources: Virginia Department of Taxation, Taxable Sales Based on Retail Sales Tax Revenues, Fairfax County Department of Systems Management for Human Services, U.S. Bureau of the Census, and Fairfax County Department of Management and Budget.
8
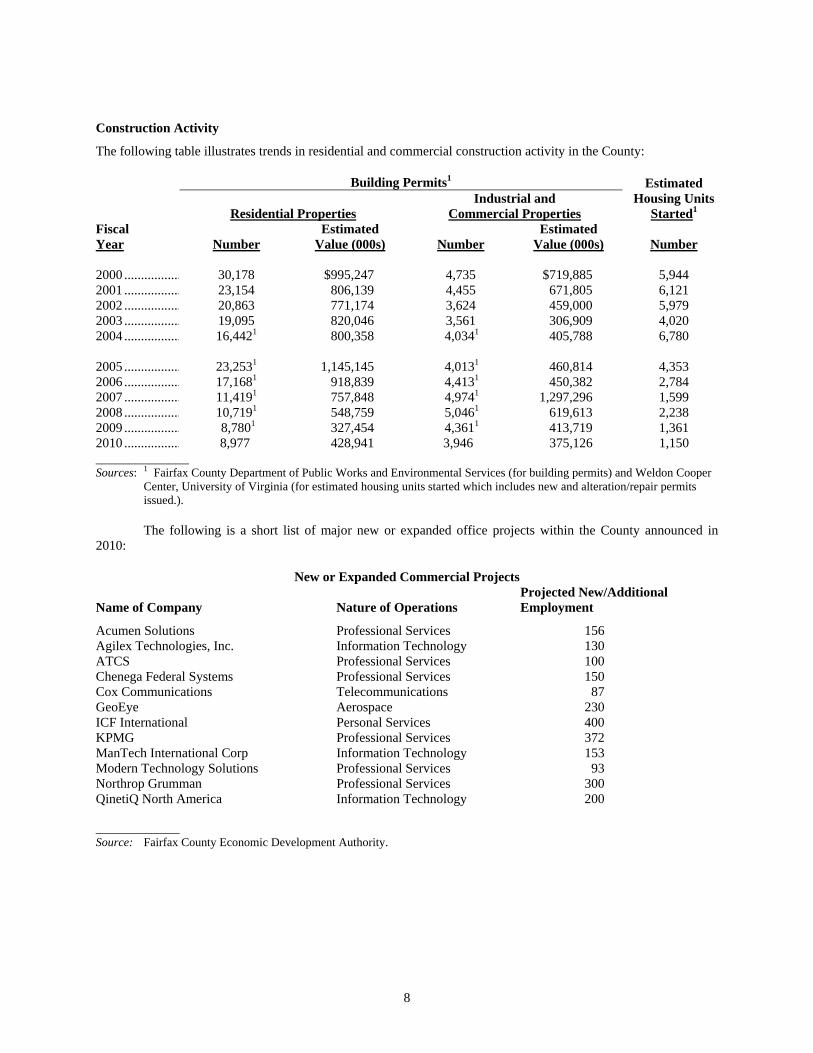
Construction Activity
The following table illustrates trends in residential and commercial construction activity in the County:
Building Permits1 Estimated Housing Units
Started1 Residential Properties Industrial and
Commercial Properties Fiscal Year Number
Estimated Value (000s) Number
Estimated Value (000s) Number
2000 ................. 30,178 $995,247 4,735 $719,885 5,944 2001 ................. 23,154 806,139 4,455 671,805 6,121 2002 ................. 20,863 771,174 3,624 459,000 5,979 2003 ................. 19,095 820,046 3,561 306,909 4,020 2004 ................. 16,4421 800,358 4,0341 405,788 6,780 2005 ................. 23,2531 1,145,145 4,0131 460,814 4,353 2006 ................. 17,1681 918,839 4,4131 450,382 2,784 2007 ................. 11,4191 757,848 4,9741 1,297,296 1,599 2008 ................. 10,7191 548,759 5,0461 619,613 2,238 2009 ................. 8,7801 327,454 4,3611 413,719 1,361 2010 ................. 8,977 428,941 3,946 375,126 1,150 ______________ Sources: 1 Fairfax County Department of Public Works and Environmental Services (for building permits) and Weldon Cooper
Center, University of Virginia (for estimated housing units started which includes new and alteration/repair permits issued.).
The following is a short list of major new or expanded office projects within the County announced in
2010:
New or Expanded Commercial Projects
Name of Company Nature of Operations Projected New/Additional Employment
Acumen Solutions Agilex Technologies, Inc. ATCS Chenega Federal Systems
Professional Services Information Technology Professional Services Professional Services
156 130 100 150
Cox Communications GeoEye
Telecommunications Aerospace
87 230
ICF International Personal Services 400 KPMG Professional Services 372 ManTech International Corp Information Technology 153 Modern Technology Solutions Professional Services 93 Northrop Grumman Professional Services 300 QinetiQ North America
Information Technology
200
______________ Source: Fairfax County Economic Development Authority.
9
Housing
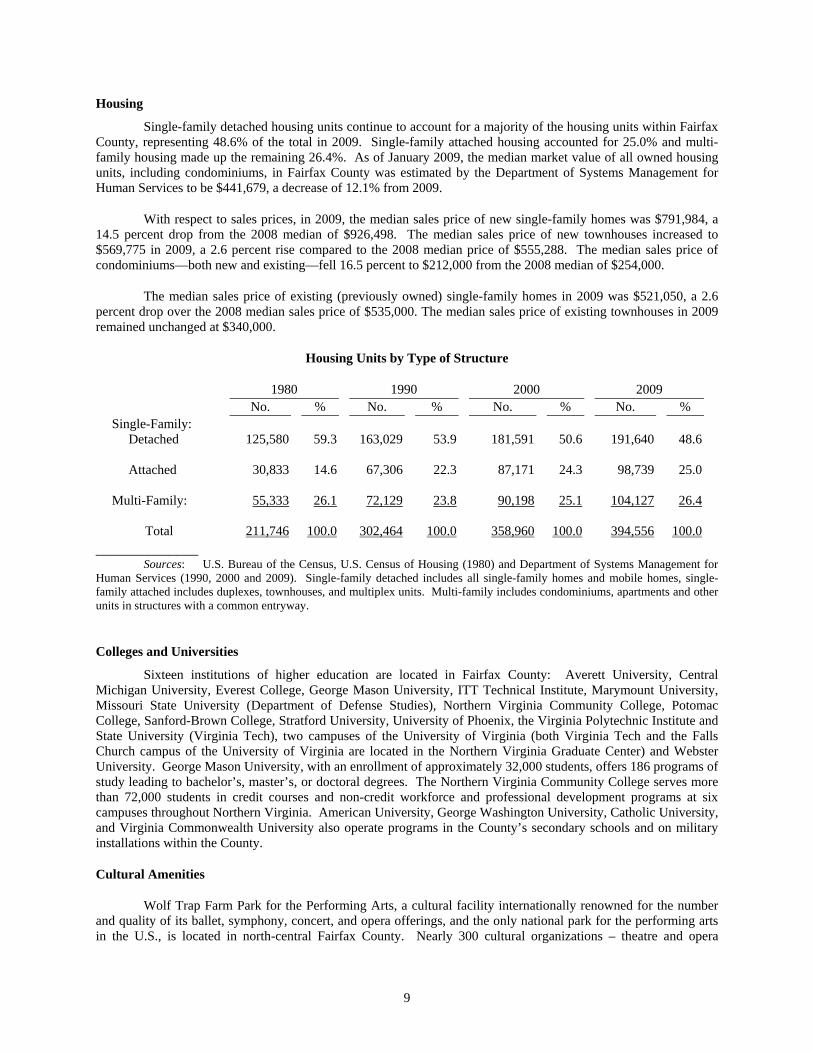
Single-family detached housing units continue to account for a majority of the housing units within Fairfax County, representing 48.6% of the total in 2009. Single-family attached housing accounted for 25.0% and multi-family housing made up the remaining 26.4%. As of January 2009, the median market value of all owned housing units, including condominiums, in Fairfax County was estimated by the Department of Systems Management for Human Services to be $441,679, a decrease of 12.1% from 2009.
With respect to sales prices, in 2009, the median sales price of new single-family homes was $791,984, a 14.5 percent drop from the 2008 median of $926,498. The median sales price of new townhouses increased to $569,775 in 2009, a 2.6 percent rise compared to the 2008 median price of $555,288. The median sales price of condominiums—both new and existing—fell 16.5 percent to $212,000 from the 2008 median of $254,000.
The median sales price of existing (previously owned) single-family homes in 2009 was $521,050, a 2.6 percent drop over the 2008 median sales price of $535,000. The median sales price of existing townhouses in 2009 remained unchanged at $340,000.
Housing Units by Type of Structure
1980 1990 2000 2009 No. % No. % No. % No. % Single-Family: Detached
125,580
59.3
163,029
53.9
181,591
50.6
191,640
48.6
Attached 30,833 14.6 67,306 22.3 87,171 24.3 98,739 25.0 Multi-Family: 55,333 26.1 72,129 23.8 90,198 25.1 104,127 26.4 Total 211,746 100.0 302,464 100.0 358,960 100.0 394,556 100.0
______________ Sources: U.S. Bureau of the Census, U.S. Census of Housing (1980) and Department of Systems Management for
Human Services (1990, 2000 and 2009). Single-family detached includes all single-family homes and mobile homes, single-family attached includes duplexes, townhouses, and multiplex units. Multi-family includes condominiums, apartments and other units in structures with a common entryway.
Colleges and Universities
Sixteen institutions of higher education are located in Fairfax County: Averett University, Central Michigan University, Everest College, George Mason University, ITT Technical Institute, Marymount University, Missouri State University (Department of Defense Studies), Northern Virginia Community College, Potomac College, Sanford-Brown College, Stratford University, University of Phoenix, the Virginia Polytechnic Institute and State University (Virginia Tech), two campuses of the University of Virginia (both Virginia Tech and the Falls Church campus of the University of Virginia are located in the Northern Virginia Graduate Center) and Webster University. George Mason University, with an enrollment of approximately 32,000 students, offers 186 programs of study leading to bachelor’s, master’s, or doctoral degrees. The Northern Virginia Community College serves more than 72,000 students in credit courses and non-credit workforce and professional development programs at six campuses throughout Northern Virginia. American University, George Washington University, Catholic University, and Virginia Commonwealth University also operate programs in the County’s secondary schools and on military installations within the County.
Cultural Amenities
Wolf Trap Farm Park for the Performing Arts, a cultural facility internationally renowned for the number and quality of its ballet, symphony, concert, and opera offerings, and the only national park for the performing arts in the U.S., is located in north-central Fairfax County. Nearly 300 cultural organizations – theatre and opera
10
companies, music and dance groups, community arts centers, festivals, and other activities – are based in and around the County. The County also assists in supporting the Fairfax Symphony, an internationally recognized 94-member orchestra that provides a variety of musical programs and outreach services to County residents. Other well-known attractions in the County include Mount Vernon, the home of George Washington; Woodlawn Plantation, George Washington’s wedding gift to his nephew; and Gunston Hall, home of George Mason, author of the U.S. Bill of Rights and the first Constitution of Virginia. The region also boasts professional baseball, basketball, football, ice hockey, and soccer.
TAX BASE DATA
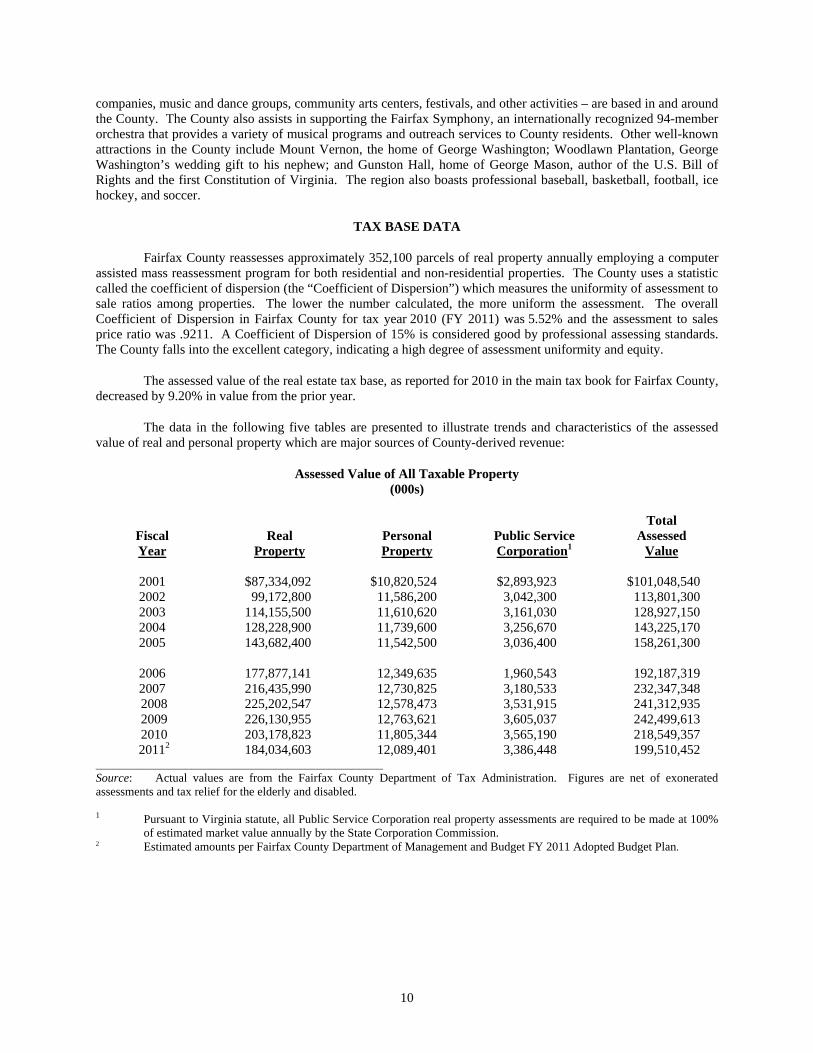
Fairfax County reassesses approximately 352,100 parcels of real property annually employing a computer assisted mass reassessment program for both residential and non-residential properties. The County uses a statistic called the coefficient of dispersion (the “Coefficient of Dispersion”) which measures the uniformity of assessment to sale ratios among properties. The lower the number calculated, the more uniform the assessment. The overall Coefficient of Dispersion in Fairfax County for tax year 2010 (FY 2011) was 5.52% and the assessment to sales price ratio was .9211. A Coefficient of Dispersion of 15% is considered good by professional assessing standards. The County falls into the excellent category, indicating a high degree of assessment uniformity and equity.
The assessed value of the real estate tax base, as reported for 2010 in the main tax book for Fairfax County, decreased by 9.20% in value from the prior year.
The data in the following five tables are presented to illustrate trends and characteristics of the assessed value of real and personal property which are major sources of County-derived revenue:
Assessed Value of All Taxable Property (000s)
Fiscal Year
Real Property
Personal Property
Public Service Corporation1
Total Assessed
Value
2001 $87,334,092 $10,820,524 $2,893,923 $101,048,540 2002 99,172,800 11,586,200 3,042,300 113,801,300 2003 114,155,500 11,610,620 3,161,030 128,927,150 2004 128,228,900 11,739,600 3,256,670 143,225,170 2005 143,682,400 11,542,500 3,036,400 158,261,300
2006 177,877,141 12,349,635 1,960,543 192,187,319 2007 216,435,990 12,730,825 3,180,533 232,347,348 2008 225,202,547 12,578,473 3,531,915 241,312,935 2009 226,130,955 12,763,621 3,605,037 242,499,613 2010 203,178,823 11,805,344 3,565,190 218,549,357 20112 184,034,603 12,089,401 3,386,448 199,510,452
________________________________________________ Source: Actual values are from the Fairfax County Department of Tax Administration. Figures are net of exonerated assessments and tax relief for the elderly and disabled. 1 Pursuant to Virginia statute, all Public Service Corporation real property assessments are required to be made at 100%
of estimated market value annually by the State Corporation Commission. 2 Estimated amounts per Fairfax County Department of Management and Budget FY 2011 Adopted Budget Plan.

11
Tax Rates per $100 Assessed Value (Fiscal Year)
2002 2003 2004 2005 2006 2007 2008 2009 2010 2011
Real Estate – Regular and Public Service .........................
$1.23 $1.21 $1.16 $1.13 $1.00 $ .89 $ .89 $ .92 $1.04 $1.09
Personal Property – Regular ... 4.57 4.57 4.57 4.57 4.57 4.57 4.57 4.57 4.57 4.57
Personal Property – Public Service .................................... 1.23
1.21 1.16 1.13 1.00 .89 .89 .92
1.04
1.09
Personal Property – Mining and Manufacturing, Machinery and Tools ................................ 4.57 4.57 4.57 4.57
4.57
4.57
4.57
4.57
4.57
4.57
Personal Property – Research and Development .................... 4.57 4.57 4.57 4.57 4.57 4.57 4.57 4.57
4.57
4.57
Personal Property – Mobile Homes ..................................... 1.23
1.21 1.16 1.13 1.00 .89 .89 .92
1.04
1.09
Personal Property – Antique Cars ......................................... .01
.01 .01 .01
.01 .01 .01 .01
.01
.01
Personal Property – Special1 ... .01 .01 .01 .01 .01 .01 .01 .01 .01 .01
_________________________ Source: Fairfax County Approved Fiscal Plans, FY 2002-2011. 1 Includes vehicles specially equipped for the handicapped, privately owned vans used for van pools, vehicles belonging
to volunteer fire and rescue squad members, vehicles owned by auxiliary police and reserve deputy sheriffs, certain property of homeowners associations, aircraft, including flight simulators, and motor vehicles owned by qualified elderly or disabled individuals, and boats.
Commercial-Industrial Percentage of the Total Assessed Value of Real Property
Fiscal Year1 Percent (%)2 2002 24.84 2003 21.97 2004 19.14 2005 18.20 2006 17.36
2007 17.22 2008 19.23 2009 21.06 2010 22.67 2011 19.70
____________________ Source: Fairfax County Department of Tax Administration. Assessed values are reported by State of Virginia Land Use Codes. Vacant land is defined according to zoning classification. 1 Fiscal year property taxes are levied on prior year assessments. 2 Includes the Towns of Vienna, Herndon, and Clifton.
12
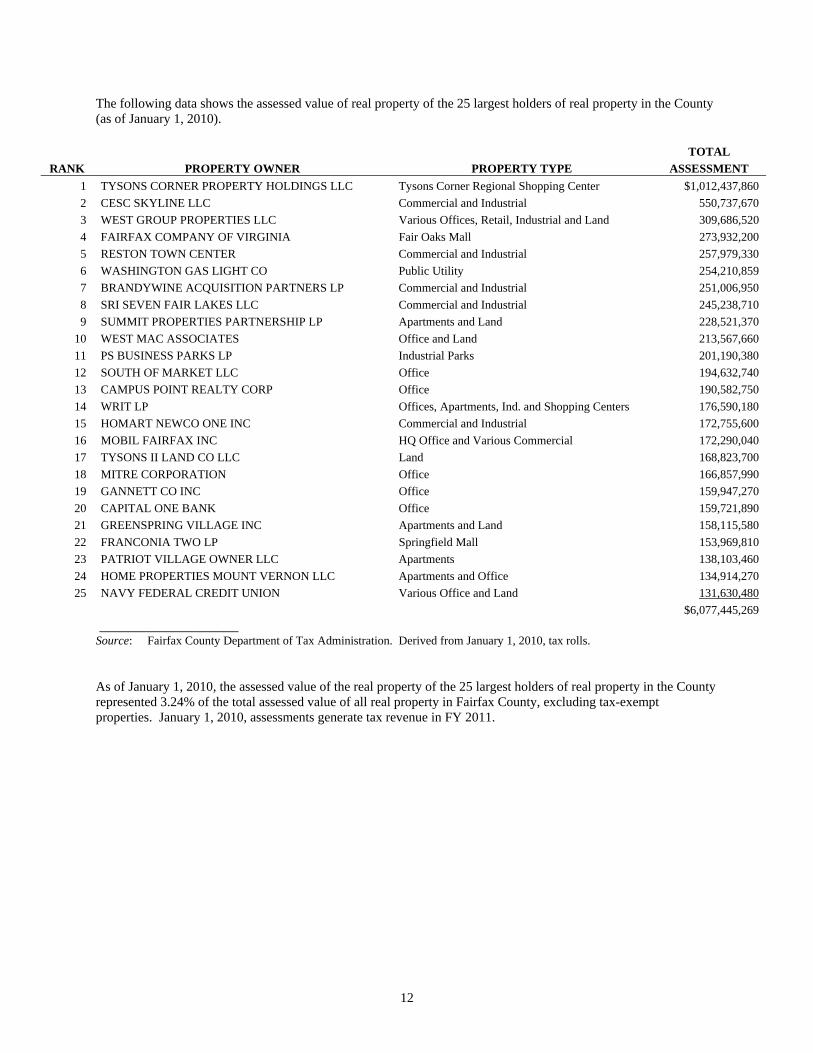
The following data shows the assessed value of real property of the 25 largest holders of real property in the County (as of January 1, 2010).
TOTAL
RANK PROPERTY OWNER PROPERTY TYPE ASSESSMENT
1 TYSONS CORNER PROPERTY HOLDINGS LLC Tysons Corner Regional Shopping Center $1,012,437,860
2 CESC SKYLINE LLC Commercial and Industrial 550,737,670
3 WEST GROUP PROPERTIES LLC Various Offices, Retail, Industrial and Land 309,686,520
4 FAIRFAX COMPANY OF VIRGINIA Fair Oaks Mall 273,932,200
5 RESTON TOWN CENTER Commercial and Industrial 257,979,330
6 WASHINGTON GAS LIGHT CO Public Utility 254,210,859
7 BRANDYWINE ACQUISITION PARTNERS LP Commercial and Industrial 251,006,950
8 SRI SEVEN FAIR LAKES LLC Commercial and Industrial 245,238,710
9 SUMMIT PROPERTIES PARTNERSHIP LP Apartments and Land 228,521,370
10 WEST MAC ASSOCIATES Office and Land 213,567,660
11 PS BUSINESS PARKS LP Industrial Parks 201,190,380
12 SOUTH OF MARKET LLC Office 194,632,740
13 CAMPUS POINT REALTY CORP Office 190,582,750
14 WRIT LP Offices, Apartments, Ind. and Shopping Centers 176,590,180
15 HOMART NEWCO ONE INC Commercial and Industrial 172,755,600
16 MOBIL FAIRFAX INC HQ Office and Various Commercial 172,290,040
17 TYSONS II LAND CO LLC Land 168,823,700
18 MITRE CORPORATION Office 166,857,990
19 GANNETT CO INC Office 159,947,270
20 CAPITAL ONE BANK Office 159,721,890
21 GREENSPRING VILLAGE INC Apartments and Land 158,115,580
22 FRANCONIA TWO LP Springfield Mall 153,969,810
23 PATRIOT VILLAGE OWNER LLC Apartments 138,103,460
24 HOME PROPERTIES MOUNT VERNON LLC Apartments and Office 134,914,270
25 NAVY FEDERAL CREDIT UNION Various Office and Land 131,630,480
$6,077,445,269 ___________________ Source: Fairfax County Department of Tax Administration. Derived from January 1, 2010, tax rolls.
As of January 1, 2010, the assessed value of the real property of the 25 largest holders of real property in the County represented 3.24% of the total assessed value of all real property in Fairfax County, excluding tax-exempt properties. January 1, 2010, assessments generate tax revenue in FY 2011.
13
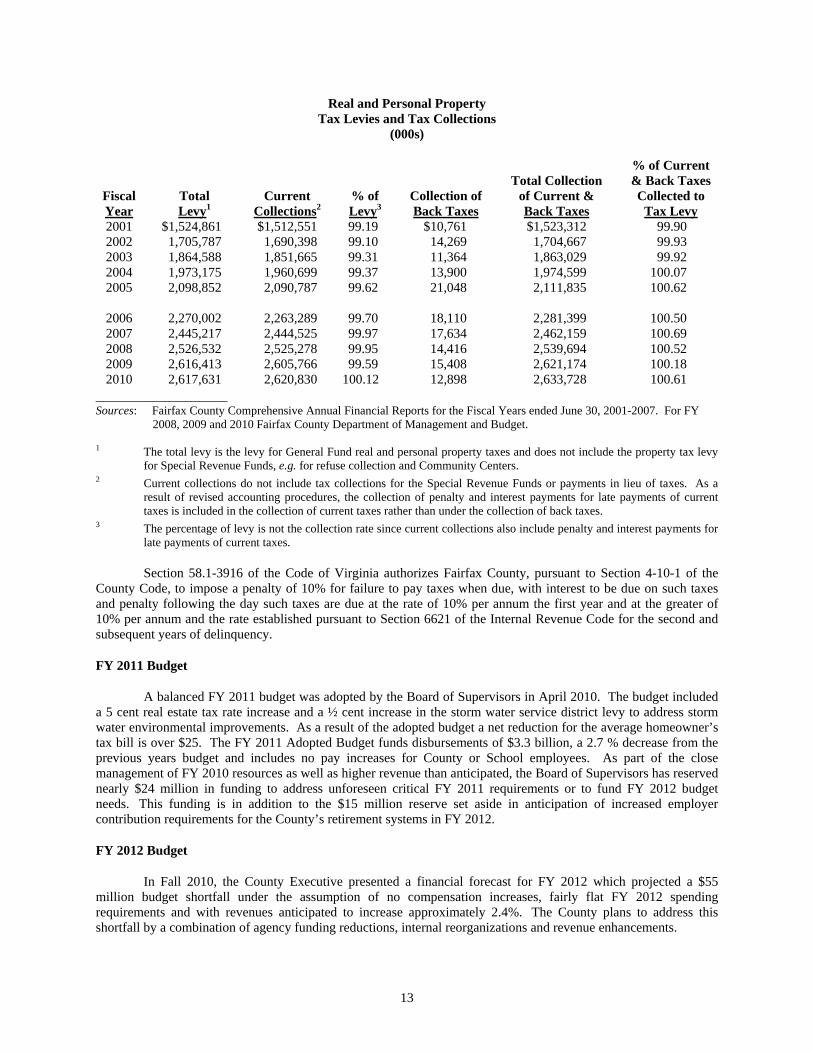
Real and Personal Property Tax Levies and Tax Collections
(000s)
Fiscal Year
Total Levy1
Current Collections2
% of Levy3
Collection of Back Taxes
Total Collection of Current & Back Taxes
% of Current & Back Taxes Collected to
Tax Levy 2001 $1,524,861 $1,512,551 99.19 $10,761 $1,523,312 99.90 2002 1,705,787 1,690,398 99.10 14,269 1,704,667 99.93 2003 1,864,588 1,851,665 99.31 11,364 1,863,029 99.92 2004 1,973,175 1,960,699 99.37 13,900 1,974,599 100.07 2005 2,098,852 2,090,787 99.62 21,048 2,111,835 100.62
2006 2,270,002 2,263,289 99.70 18,110 2,281,399 100.50 2007 2,445,217 2,444,525 99.97 17,634 2,462,159 100.69 2008 2,526,532 2,525,278 99.95 14,416 2,539,694 100.52 2009 2,616,413 2,605,766 99.59 15,408 2,621,174 100.18 2010 2,617,631 2,620,830 100.12 12,898 2,633,728 100.61
__________________ Sources: Fairfax County Comprehensive Annual Financial Reports for the Fiscal Years ended June 30, 2001-2007. For FY 2008, 2009 and 2010 Fairfax County Department of Management and Budget. 1 The total levy is the levy for General Fund real and personal property taxes and does not include the property tax levy
for Special Revenue Funds, e.g. for refuse collection and Community Centers. 2 Current collections do not include tax collections for the Special Revenue Funds or payments in lieu of taxes. As a
result of revised accounting procedures, the collection of penalty and interest payments for late payments of current taxes is included in the collection of current taxes rather than under the collection of back taxes.
3 The percentage of levy is not the collection rate since current collections also include penalty and interest payments for late payments of current taxes.
Section 58.1-3916 of the Code of Virginia authorizes Fairfax County, pursuant to Section 4-10-1 of the County Code, to impose a penalty of 10% for failure to pay taxes when due, with interest to be due on such taxes and penalty following the day such taxes are due at the rate of 10% per annum the first year and at the greater of 10% per annum and the rate established pursuant to Section 6621 of the Internal Revenue Code for the second and subsequent years of delinquency.
FY 2011 Budget
A balanced FY 2011 budget was adopted by the Board of Supervisors in April 2010. The budget included a 5 cent real estate tax rate increase and a ½ cent increase in the storm water service district levy to address storm water environmental improvements. As a result of the adopted budget a net reduction for the average homeowner’s tax bill is over $25. The FY 2011 Adopted Budget funds disbursements of $3.3 billion, a 2.7 % decrease from the previous years budget and includes no pay increases for County or School employees. As part of the close management of FY 2010 resources as well as higher revenue than anticipated, the Board of Supervisors has reserved nearly $24 million in funding to address unforeseen critical FY 2011 requirements or to fund FY 2012 budget needs. This funding is in addition to the $15 million reserve set aside in anticipation of increased employer contribution requirements for the County’s retirement systems in FY 2012.
FY 2012 Budget
In Fall 2010, the County Executive presented a financial forecast for FY 2012 which projected a $55 million budget shortfall under the assumption of no compensation increases, fairly flat FY 2012 spending requirements and with revenues anticipated to increase approximately 2.4%. The County plans to address this shortfall by a combination of agency funding reductions, internal reorganizations and revenue enhancements.