general disclaimer one or more of the following …...to give an air mass flow of 0.181 kg/sec (0.4...
TRANSCRIPT

General Disclaimer
One or more of the Following Statements may affect this Document
This document has been reproduced from the best copy furnished by the
organizational source. It is being released in the interest of making available as
much information as possible.
This document may contain data, which exceeds the sheet parameters. It was
furnished in this condition by the organizational source and is the best copy
available.
This document may contain tone-on-tone or color graphs, charts and/or pictures,
which have been reproduced in black and white.
This document is paginated as submitted by the original source.
Portions of this document are not fully legible due to the historical nature of some
of the material. However, it is the best reproduction available from the original
submission.
Produced by the NASA Center for Aerospace Information (CASI)
https://ntrs.nasa.gov/search.jsp?R=19830002795 2020-05-16T12:12:17+00:00Z
NASA CR 167994
THREE-DIMENSIONAL FLOW MEASUREMENTS IN A
VANELESS RADIAL TURBINE SCROLL
I r_ ^^ 1,^^_a
pII^A
S tV.̂^'/ n ^f``^
T •?\ •
iJ
V
U^
W. TABAKOFF, B. WOOD AND B.V.R. VITTAL
Supported by:
NATIONAL AERONAUTICS AND SPACE ADMINISTRATION
Lewis Research Center
Grant No. NAG3-26
(NASA-CH-167994) THREE-JIMENSIUNAL kLOW Nz3J-11Ub5BEASUREdENTS IN A VANELESS hADIAL TUabishSCROLL (CiLcinn4ti UniV.) 4 pdC AUJ/CF A01 CSCL 01A Unclas
GJ/U2 U IU41
BY

NASA CR 167994
THREE-DIMENSIONAL FLOW MEASUREMENTS IN A
VANELESS RADIAL TURBINE SCROLL
by
W. Tabakoff, B. Wood and B.V.R. Vittal
Department of Aerospace Engineering and Applied MechanicsUniversity of CincinnatiCincinnati, Ohio 45221
Supported by:
NATIONAL AERONAUTICS AND SPACE ADMINISTRATION
Lewis Research Center
Grant No. NAG3-26

1. Report No. 2. Government Accmion No. 3. Recipient's Catalog No.CR 167994
4. Title vnd Subtitle S. Report DateAugust 1982
THREE-DIMENSIONAL FLOW MEASUREMENTS IN A g. Performing Organization CodeVANELESS RADIAL TURBINE SCROLL
7. Author(s) 8. Performing Organization Report No iW. TABAKOFF, B. WOOD and A.V.R. VITTAL
10. Work Unit No. —i8. Performing Organization Name and Aodrs
DEPT. OF AEROSPACE ENGINEERING 6 APPLIED MECHANICS 11. Contract or Grant No.UNIVERSITY OF CINCINNATICINCINNATI, OHIO 45221 NAG3-26
13. Type of Report and Period Covered12. Sponsoring Agency Name and Address Contractor Report
NATIONAL AERONAUTICS AND SPACE ADMINISTRATIONLEWIS RESEARCH CENTER 14. Sponsoring Agency CodeCLEVELAND, OHIO 44135
15. Supplementary NotesProject Manager, K.L. McLallin, Turbine Aerodynamics Section,NASA Lewis Research Center, Cleveland, Ohi3 44135
16. Abstract
A study was conducted to determine experimentally the flow behavior invaneless radial turbine scroll. The data for this investigation was obtainedusing the slant sensor technique of hot film anemometry. This method usedthe unsymmetric heat transfer characteristics of a constant temperature hotfilm sensor to detect the flow direction and magnitude. This was achievedby obtaining a velocity vector measurement at three sensor positions withrespect to the f:.ow. The true magnitude and direction of the velocity vectorwas then found s.;ing these three values and a Newton-Raphson numericaltechnique. The through flow and secondary flow velocity components aremeasured at various points in three scroll sections.
i
i
i
17. Key Words (Suggested by Author(sl l 18. Distribution StatementRadial Turbine Unclassified - unlimitedAerodynamics STAR Category 02
18. Security Clasaif. (of this report) 20. Security Classic (of this page) 21. No. of Pages 22. Price'
UNCLASSIFIED UNCLASSIFIED 37
For sale by the National Technical Information Service, Springfield.
NASA-C-168 (Rev. 10-75)
TABLE OF CONTENTS
Page
INTRODUCTION. . . . . . . . . . . . . . . . . . . . . . . 1
RESEARCH SCROLL FACILITY . . . . . . . . . . . . . . . . . 2
EXPERIMENTAL APPARATUS . . . . . . . . . . . . . . . . . . 3
Scroll Geometry . . . . . . . . . . . . . . . . . . . 3
Instrumentation . . . . . . . . . . . . . . . . . . . 4
Probe Mount and Flow Measurement . . . . . . . . . . 4
Procedure . . . . . . . . . . . . . . . . . . . . . . 5
RESULTS AND DISCUSSION . . . . . . . . . . . . . . . . . . 7
CONCLUSIONS . . . . . . . . . . . . . . . . . . . . . . . 9
ACKNOWLEDGEMENT . . . . . . . . . . . . . . . . . . . . . 11
REFERENCES. . . . . . . . . . . . . . . . . . . . . . . . 11
NOMENCLATURE. . . . . . . . . . . . . . . . . . . . . . . 12
APPENDIX A . . . . . . . . . . . . . . . . . . . . . . . . 13
APPENDIXB . . . . . . . . . . . . . . . . . . . . . . . . 17
FIGURES . . . . . . . . . . . . . . . . . . . . . . . . . 20
i

LIST OF FIGURES
Figure Page
1 Schematic Diagram of the Experimental Set-Up . . . 20
2 Scroll Assembly with the Port Plates forthe Probe . . . . . . . . . . . . . . . . . . . 21
2 Scroll Assembly . . . . . . . . . . . . . . . . . 22
4 Scroll Platform . . . . . . . . . . . . . . . . . 23
5 Probe Geometry . . . . . . . . . . . . . . . . . . 24
6 Inlet Velocity Profile . . . . . . . . . . . . . . 25
7 Through Flow Velocities, Cross Section 1 . . . . . 26
8 Through Flow Velocities, Cross Section 2 . . . . . 27
9 Through Flow Velocities, Cross Section 3 . . . . . 28
10 Secondary Flow Resultant Vectors, CrossSection 1 . . . . . . . . . . . . . . . . . . . 29
11 Secondary Flow Horizontal Components,Cross Section 1 . . . . . . . . . . . . . . . . 30
12 Secondary Flow Resultant Vectors,Cross Section 2 . . . . . . . . . . . . . . . . 31.
13 Secondary Flow Horizontal Components,Cross Section 2 . . . . . . . . . . . . . . . . 32
14 Secondary Flow Direction, Scroll Section 2 33
15 Secondary Flow Resultant Vectors,Cross Section 3 . . . . . . . . . . . . . . . . 34
16 Secondary Flow Horizontal Components,Cross Section 3 . . . . . . . . . . . . . . . . 35
17 Secondary Flow Direction, Cross Section 3 . . . . 36
18 Measurement Technique . . . . . . . . . . . . . . 37
ii

SUMMARY
A study was conducted to determine experimentally the flow
behavior in a vaneless radial turbine scroll. The data for this
investigation was obtained using the slant sensor technique of
hot film anemometry. This method used the unsymmetric heat
transfer characteristics of a constant temperature hot film
sensor to detect the flow direction and magnitude. This was
achieved by obtaining a velocity vector measurement at three
sensor positions with respect to the flow. The true magnitude
and direction of the velocity vector was then found using these
three values and a Npwton-Raphson numerical technique. The
through flow and secondary flow velocity components are measured
at various points in three scroll sections.
iii
INTRODUCTION
The experimental investigation of flow behavior in the turbine
scroll is an essential phase in the development of more efficient
volute passages. Until recently very little has been known concert-
ing flow behavior in such passages. However, one of the earliest
of such investigations was conducted at the University of Cincinnati
scroll research facility in 1579. In this experiment (Ref. 1) the
through flow velocities of a turbine scroll, with circular passage
cross-sections, were measured using a two dimensional hot wire
x-probe. These results clearly demonstrated that the high speed
through flow consistantly remained near the nozzle inlet. Further
interpretation of the results suggested that the flow may pass
through the volute with some degree of helical m.`-ion. In a latter
experiment, using a three dimensional hot wire slant probe, (Ref. 2)
this conjecture was confirmed. In this test both the secondary
velocity vectors and the through flow velocities were measured in
three passage cross-sections similar to those of the 1979 test.
Although the through flow velocity data was as expected,*the
secondary velocity vectors formed a surprisingly interesting pattern.
Two zones of secondary flow circulation were found to exist in each of
':he three volute cross-sections. These zones formed a split diagonally
across the volute which was found to rotate clockwise with increasing
distance from the inlet, thus supporting the earlier conjecture.
Most recently another set of experiments at the University of
Cincinnati test facility has yielded equally interesting results.
In order for the geometric influences of volute passages to be more
clearly understood a turbine volute of another geometry was chosen,
in this case from the Cummins Engine Company.

RESEARCH SCROLL FACILITY
The test facility was designed to incorporate a complete
radial inflow turbine scroll for testing using cold air. The
most recent phase of experimental investigation was concernedwith the measurement of the through flow -and secondary flow
velocities at different scroll cross sections. It is hoped
that with this data a better understanding of the scroll flow
behavior will be obtained. The scroll used was vaneless wj-.th
rectangular cross sections and rounded corners. The turbine
rotor was modified in such a way that the blades were removed
and only the rotor hub was used in its place.
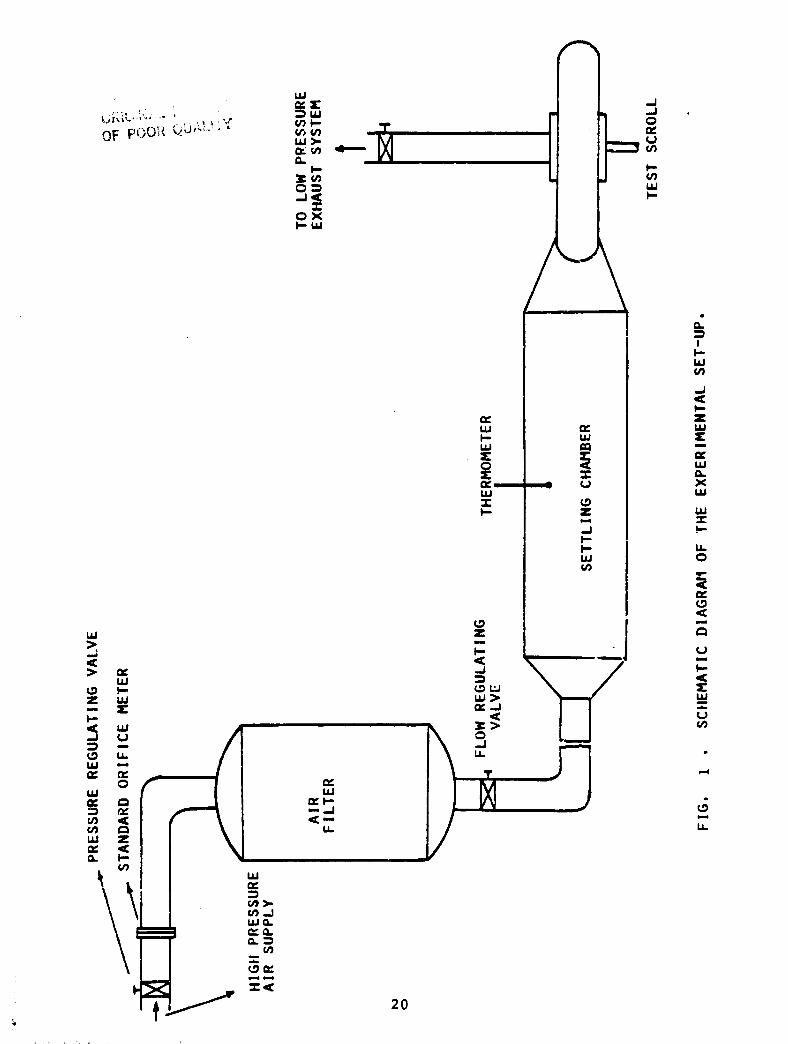
Figure 1 shows the schematic diagram of experimental set-up.
High pressure air was supplied from four large storage tanks.
She air passed through a remotely controlled pressure regulating
valve, standard orifice meter, filter and a flow regulating valve
before entering the settling chamber. The temperature of the airwas measured in the settling chamber. The filter was used to
trap dust particles up to a nominal diameter of about three
microns. This prolonged the operating life of the hot film
sensor.
The air supply was regulated by the flow regulating valve
to give an air mass flow of 0.181 kg/sec (0.4 lb/sec). The
air mass flow was measured by a standard orifice meter. The
air from the settling chamber was fed to the scroll inlet
through a convergent duct. The duct was circular in shape and
blended smoothly into the inlet of the scroll.
2

EXPERIMENTAL APPARATUS
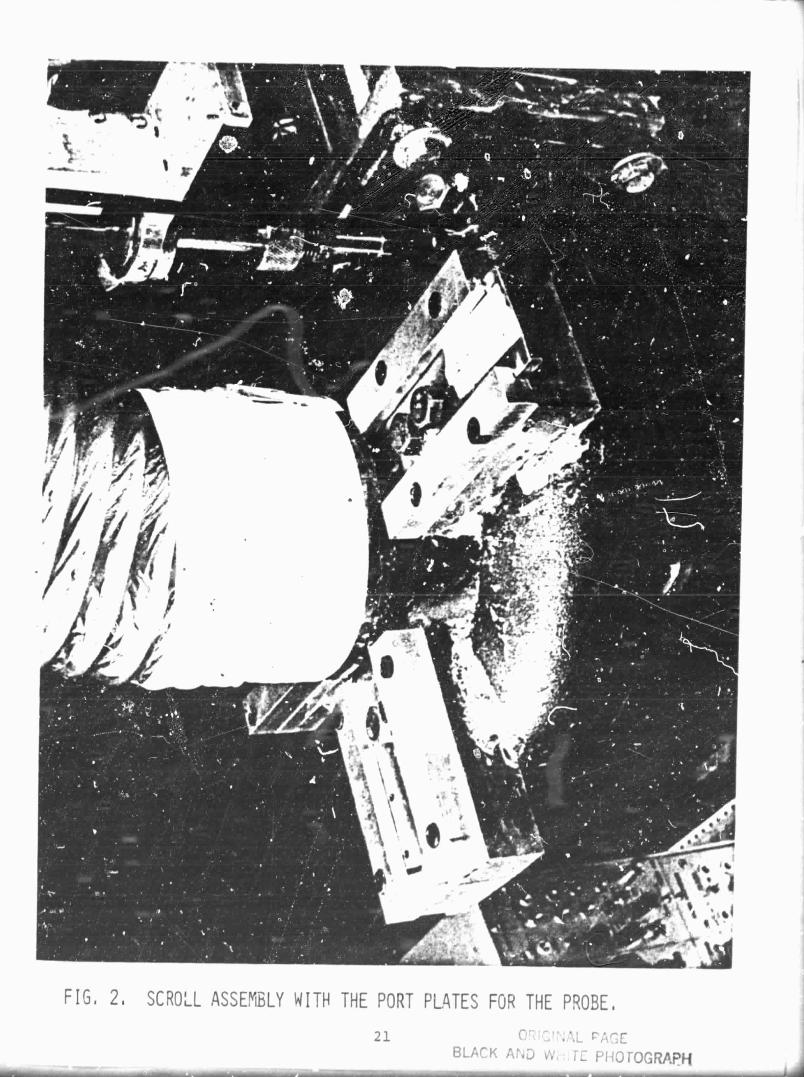
The volute geometry was such that a slot cut in the upper
volute wall allowed the probe to access any point within a passage.
The slot was then covered with a moveable plate mounted on teflon
bearings. The plate was fabricated with a special port which
allowed the probe and its associated traversing apparatus to be
attached. This entire assembly allowed the probe to reach any
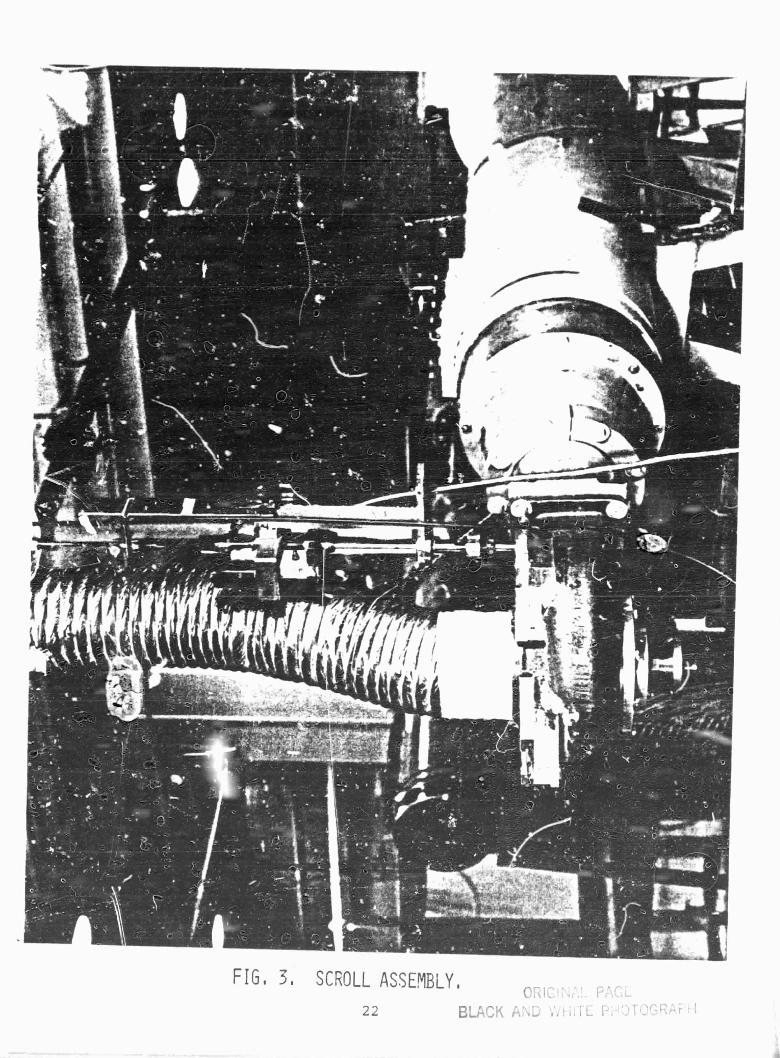
desired point within a passage while (Figs. 2 and 3) at the same
time providing an air tight seal. The slot and air seal con-
struction was such that the volute flow was not disturbed. This
was achieved by minimizing the slot dimensions and eliminating
any unnecessary protrusions into the flow path.
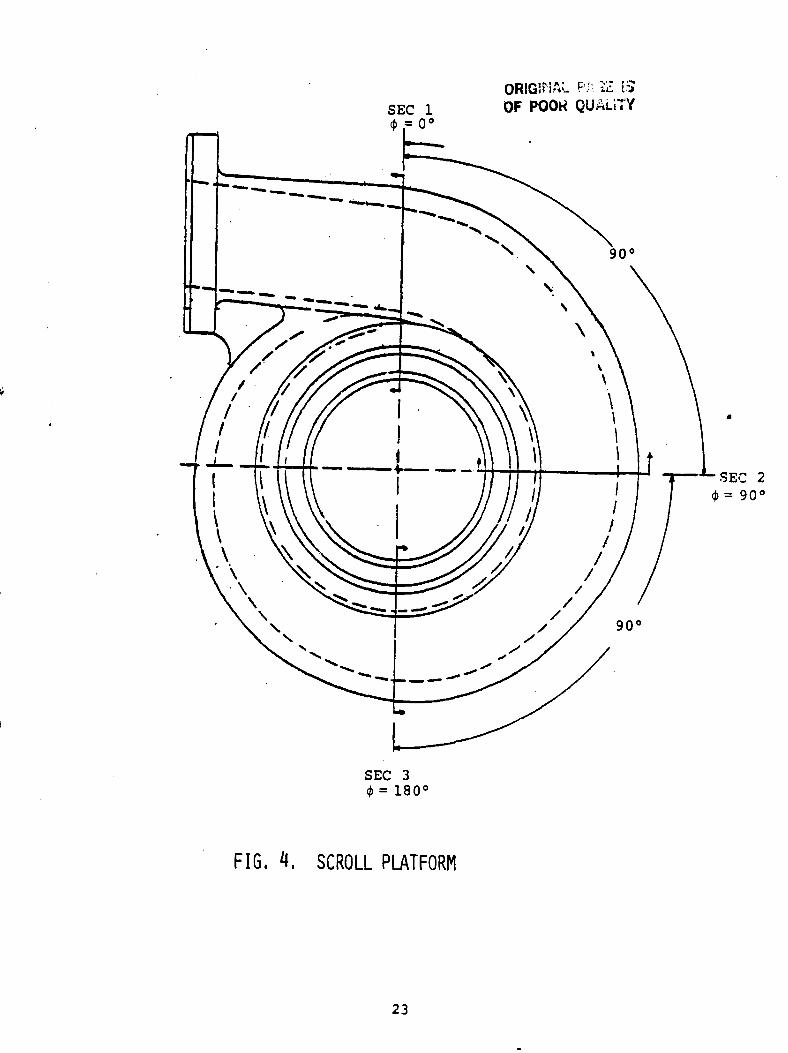
Three widely spaced cross sections were chosen for the
tests. The first position was located just downstream of the
tongue location and-the subsequent two positions were at 90
degree intervals (Fig. 4). This permitted the possible variations
in scroll flow due to geometric effects to be evident. The
turbine blades were also removed and replaced with a smooth
center-beady which was modeled from the turbine hub. This allowed
flow variations due only to volute passage geometry to be studied.
Scroll Geometry:
Since curvilinear flow channels with variable cross-sections
offer no characteristic length, Reynolds number (Vd/v) alone
based on the average velocity V of steady flow ceases to be a
criterion of describing the flow, as it is used for straight
pipe flow. However, a simple dimensional analysis carried out
suggests that such flow can be geometrically and dynamically
3
compared by defining two nondimensional numbers, namely:
(pQ/ud) and R/d where Q is the volume flow rate. The former is
nothing but a modified Reynolds number. In this work the scroll
inlet mass flow Reynolds number was defined as (P Vevedh /4) and
was equal to 2.044 x 10 5 and the paramets^: R/dh was equal to 2.3.
Figure 4 shows three scroll section locations. The first cross
section is at m - 0°, the second at 0- 90 0 and the third at 0 - 1e0°.
Instrumentation:
The air mass flow was measured using a standard orifice
meter. The temperature of the air was measured in the settling
chamber using a simple commercial dial t:pe thermometer with a
stem. No pressure measurements were made except at the orifice
meter. The velocity measurements inside the scroll were made
using the TS1 model 1213-20 hot film slant sensor. The schematic
diagram of the sensor is shown in Fig. 5. The cylindrical
sensor element is 0.0508 mm (0.002 in.) in diameter, 1.016 mm
(0.040 in.) long, and is at a slant angle of 45°. It is coated
with alumina and gold plated at the ends where it is fixed to
the prongs. The prongs are 12.7 mm (0.5 in.) long.
Probe Mount and Flow Measurement:
The positions of three scroll cross sections where the
measurements have been taken are shown in Fig. 4. At each sec-
tion, a specially designed probe traversing fixture to suit
the section geometry, was used. Narrow slots were cut in the
upper cross sectional walls, which allowed the probe to access
any point within a particular cross section. Flat sliding
plates, to which the traversing mechanism was attached, were
4
mounted on bearings over the slots. This system allowed the
probe to be positioned at any depth, using the traversing
mechanism, and at any distance from the side walls, using the
sliding plates.
Procedures:
The high pressure air supply from air storage tanks was
regulated to a pressure of 2.0684 x 10 5 N/m2 gauge (30 psig)
at the orifice meter using a prebiure regulating valve. The
air supply was passed through an air filter to a settling chamber
where the temperature was measured. The pressure drop across
the orifice meter was varied with the flow regulating valve
to give an actual air mass flow of 0.181 kg/sec (0.4 lb/aec).
The air temperature did not vary appreciably from the nominal
temperature of 22°C (72°F).
The flow velocity measurements inside the scroll were made
using a hot film slant sensor. It was advantageous to use
this sensor for three dimensional flow measurements since it
required only one channel of electronic. circuitry, when compared
to two or three for cross wire probes. This consequently
minimized measurement errors. Also, the obstruction to the
flow field was reduced. The operation, calibration and the
evaluation of velocities from the anemometer output signals
are explained in Appendix A.
5
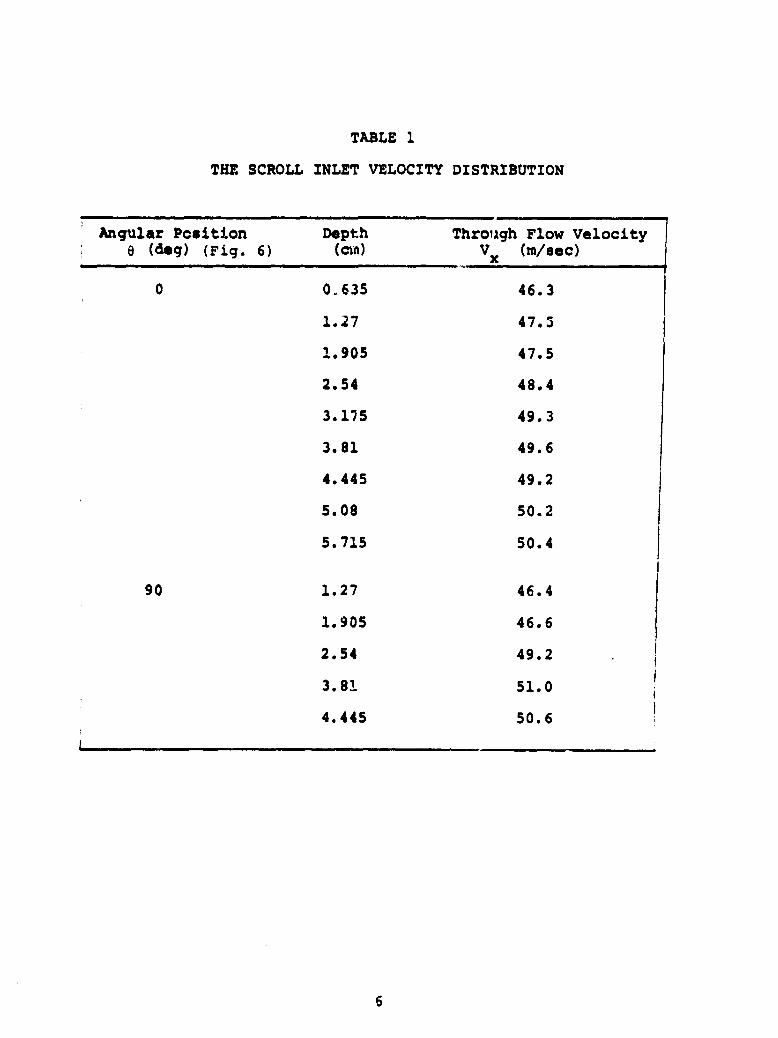
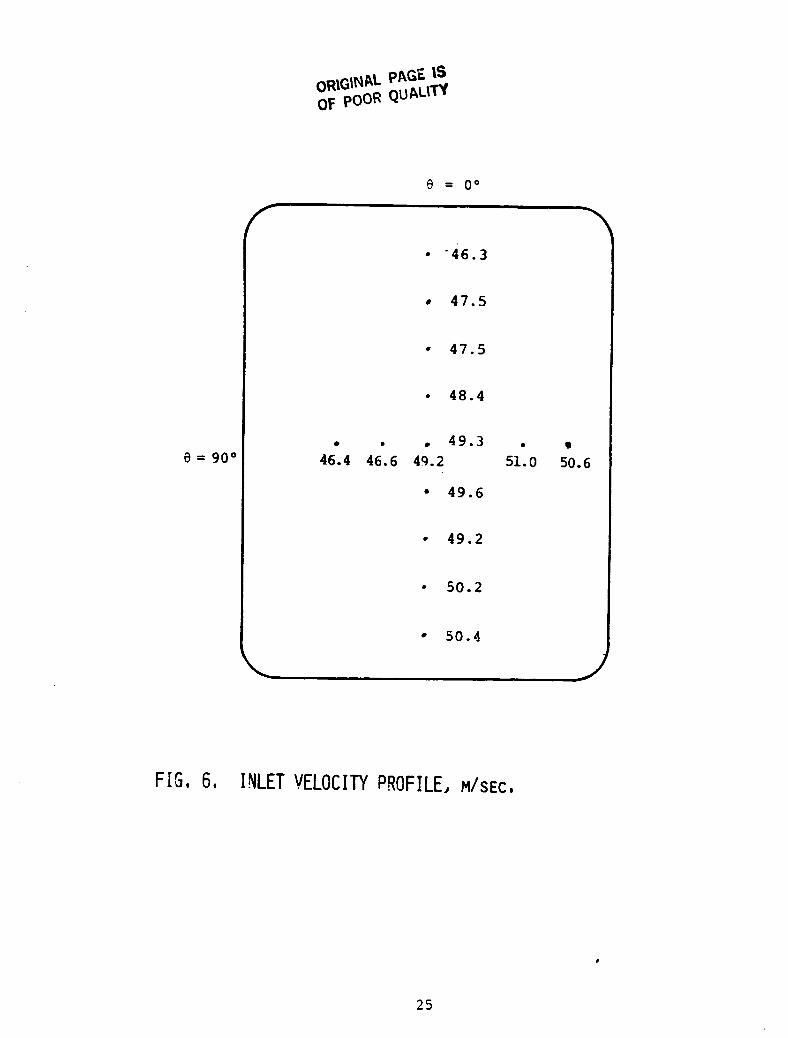
TABLE 1
THE SCROLL INLET VELOCITY DISTRIBUTION
Angular Position Depth Through Flow Velocitye (deg) (Fig. 6) (MA) V (m/sec)
0 0.635 46.3
1.27 47.5
► .905 47.5
2.54 48.4
3.175 49.3
3.81 49.6
4.445 49.2
5.08 50.2
5.715 50.4
90 1.27 46.4
1.905 46.6
2.54 49.2
3.81 51.0
4.445 50.6
L
6
RESULTS AND DISCUSSION
The scroll inlet velocity measurements were .nade at two
port locations. The results are shown in Fig. 6 and Table 1.
The inlet velocities did not vary much (within ±5%). The ve:,o-
cities tend to be higher near the outside wall of the scroll.
The total velocity vector at every point of meas , ire:nent in the
scroll Cross sections was resolved into three components. The
through f7.ow component, Vx , and the two secondary flow components
V and Vv . Figures 7, 8 and 9 show the measured through flow
velocities in each of the three sections. For all the measure-
ments, the mass flow rate was maintained at 0.1811 kg/sec (0.4
lb/sec). The numerical values of the flow velocity components
at various locations in the scroll are given in Appendix B.
The ;secondary flow vectors have been presented graphically
in two forms. The resultant velocity vectors and their hori-
zontal components have been superimposed on twice scale drawings
of each test section. All of the velocity vectors have been
presented at a scale of 1. cm - 12 m/sec. For the cases which
have complicated secondary flow paths, estimations of the flow
paths have been dzawn. The through flow velocity contours have
been plot ed in cross-sectional drawings of twice scale. In
all cross-sectional drawings the through flow velocity vectors
pointed into the cross-sectional plane.
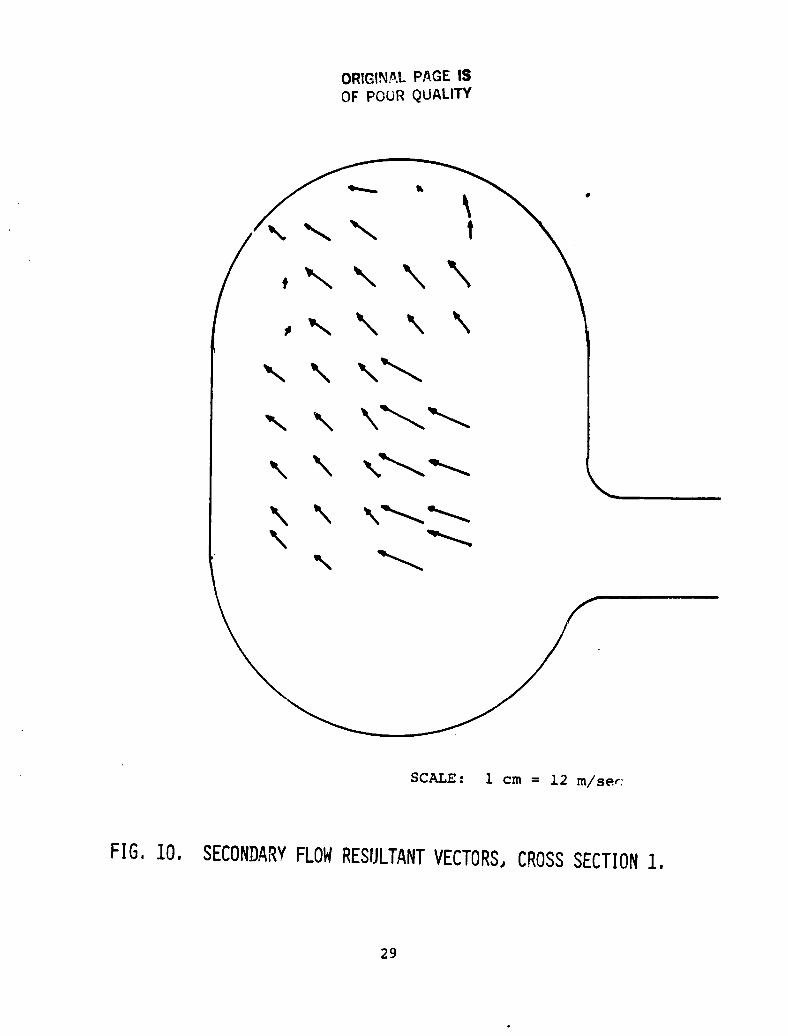
The data obtained from the first test cross-section demon-
strated the flow's immediate response to the nozzle discharge.
Although the first series of tests were conducted only 1 cm
downstream from the tongue location, the high speed flow had
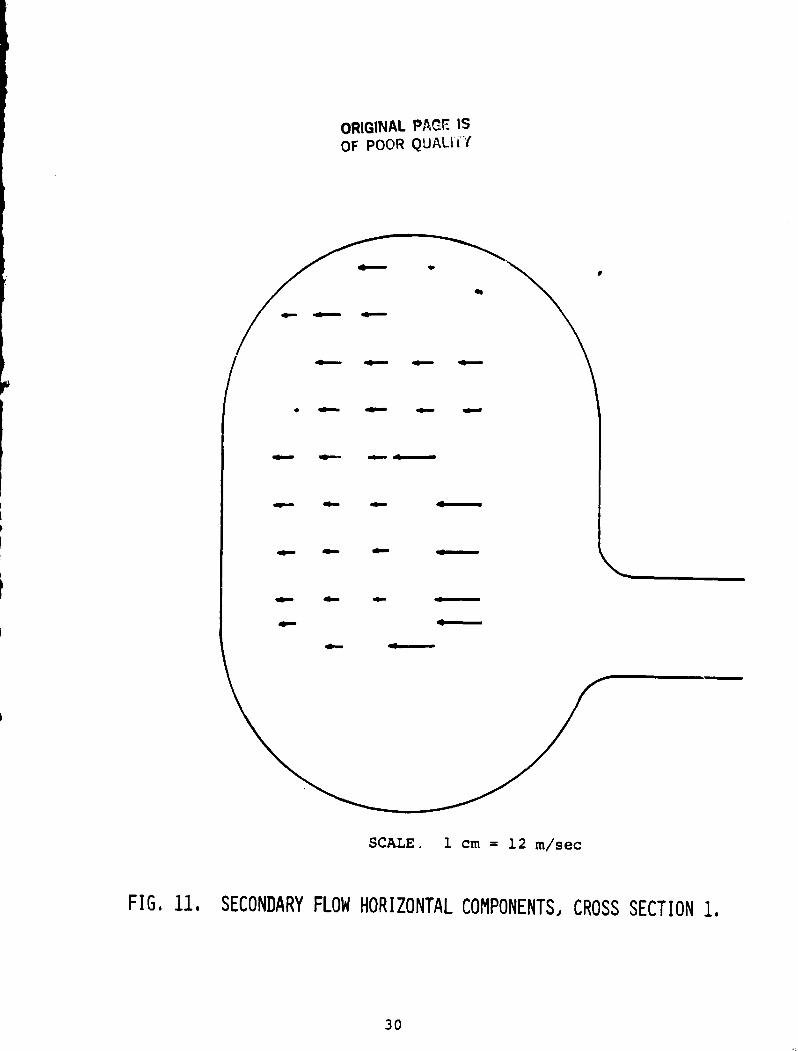
already adjusted its position. The secondary flow resultant
7
vectors (Fig. 10) and their horizontal components (Fig. 11)
snowed a uniform secondary motion towa-d the outer volute
wall. It should be noticed, however, that the fluid at this
point had not yet passad through the curved portion of the
volute passage.
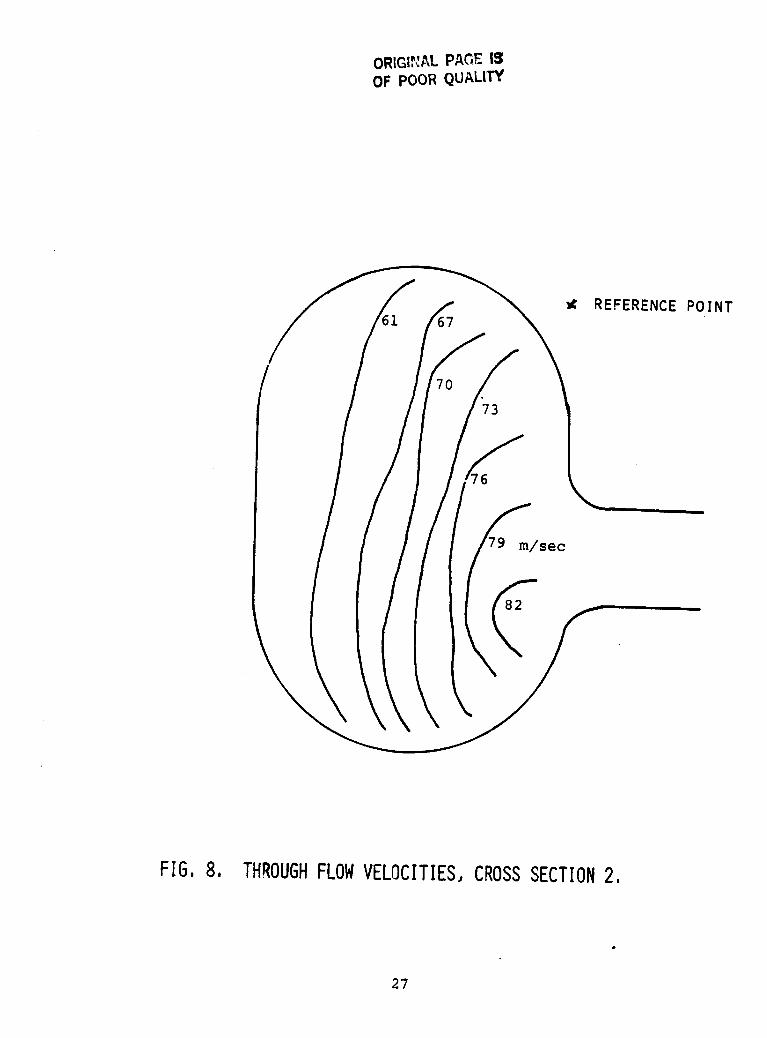
The second test cross-section, however, was located
90 degrees from the first. The fluid had, therefore, adjusted
both to the nozzle's discharge and the 90 degree passage bend.
The through flow velocity contour (Fig. 8) shows little change
from the pattern of the first test section, although a
substantial increase in velocity has occurred. However, the
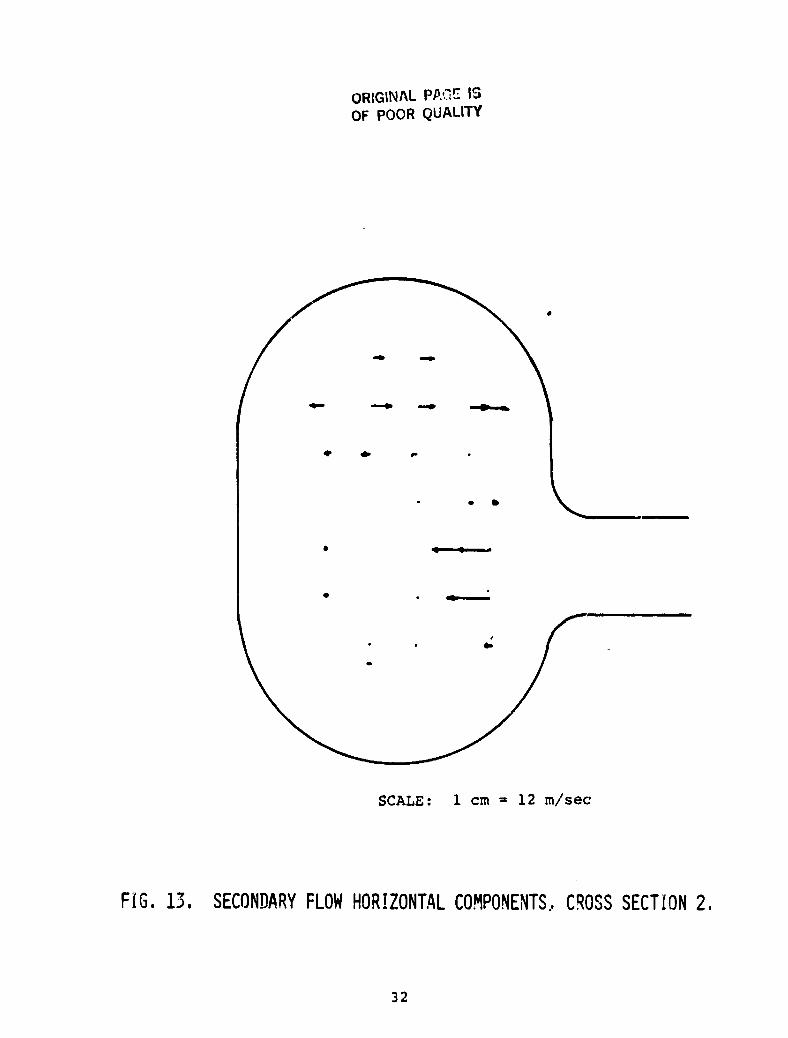
secondary vectors show a dramatic change. The resultant vectors
(Fig. i2) show that two zones of secondary circulation have
formed in response to the forces imposed on the fluid at this
point. The vertical split which separated the circulation
zones can clearly be seen from the secondary flow horizontal
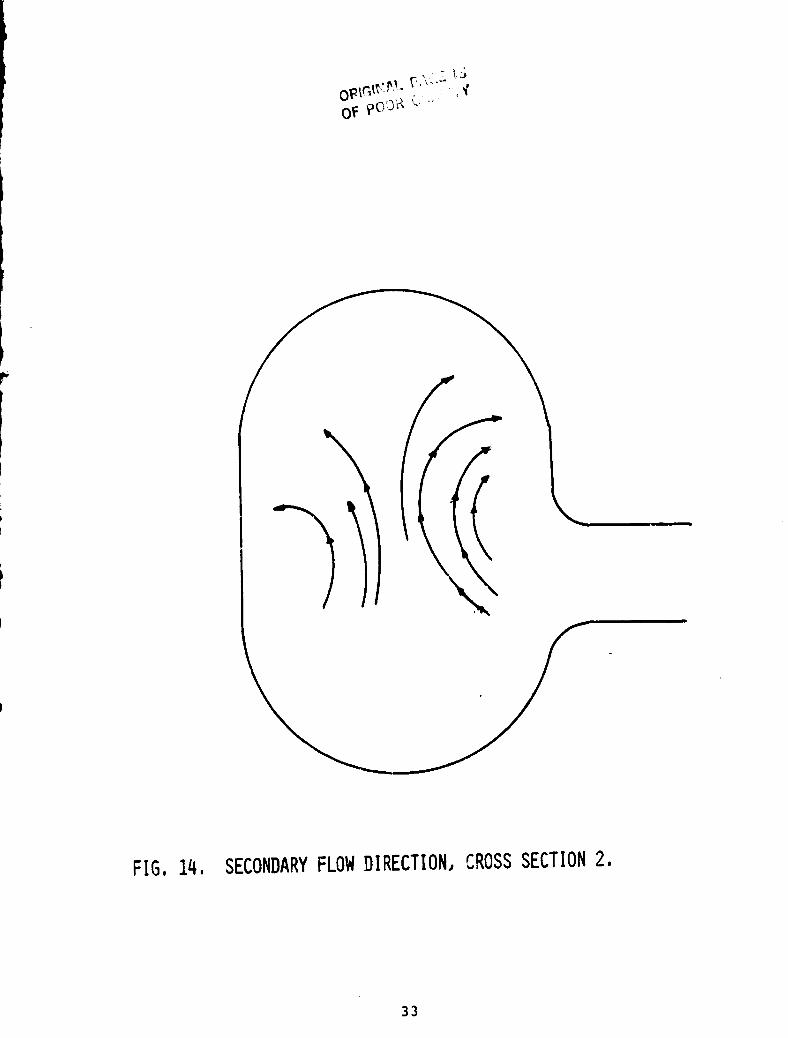
components (Fig. 13). The zones appear to have rotated in a
counter clockwise direction near the cuter volute wall and in
a clockwise direction near the inner wall. The estimated path
of thes e circulation zones is shown in Fig. 14. The formation
of the zones of circulation is undoubtedly due to the nozzle
discharge as well as the centrifugal forces imposed by the
passage turning angle.
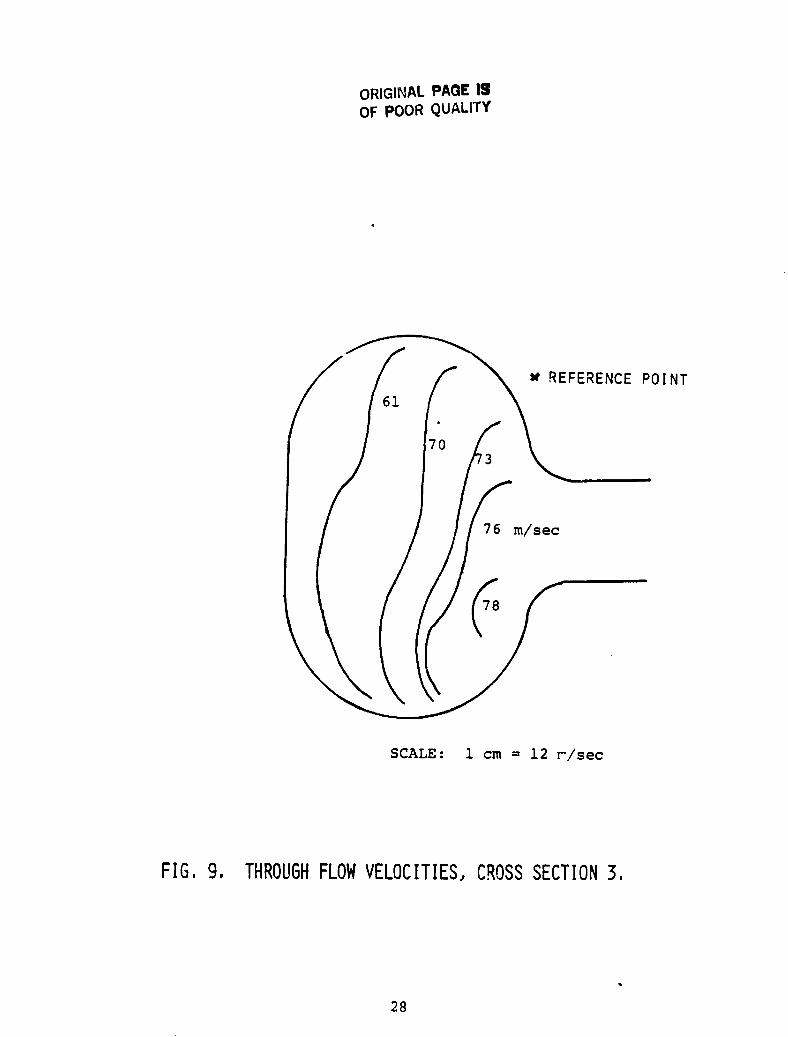
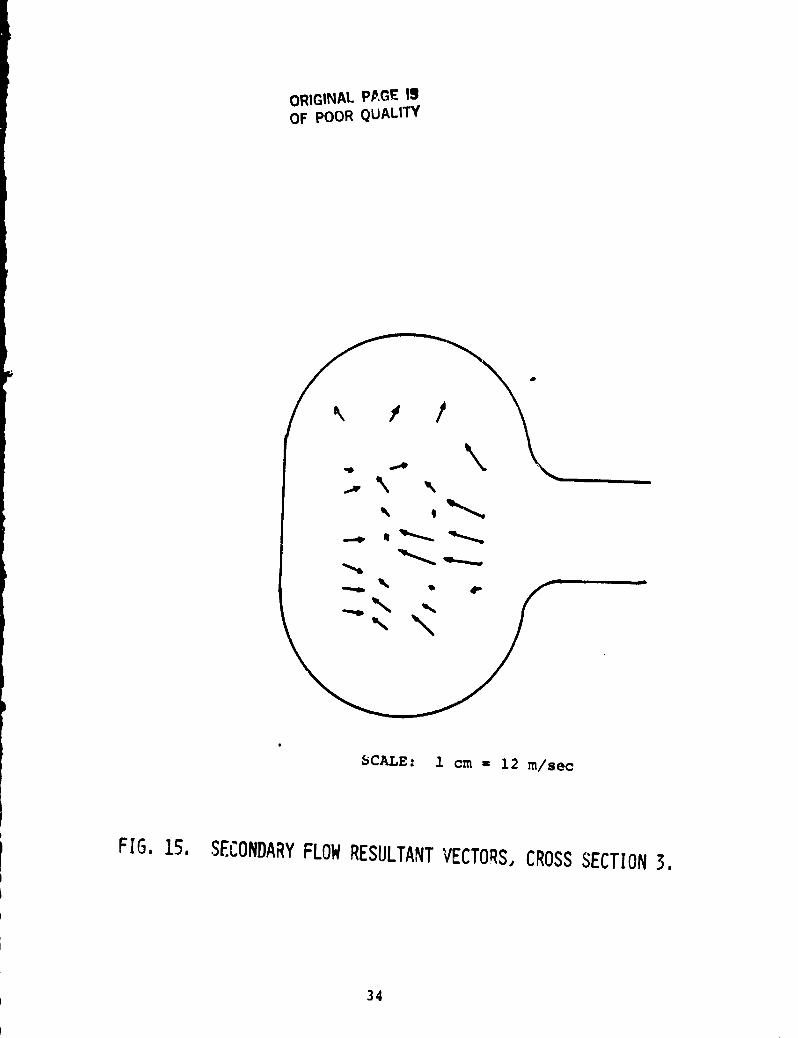
The test readings obtained 180 degrees from the first test
cross section indicated that the turbulence level had greatly
increased. The flow characteristics, however, werF -imilar in
nature to those of the second section tested. As illustrated by
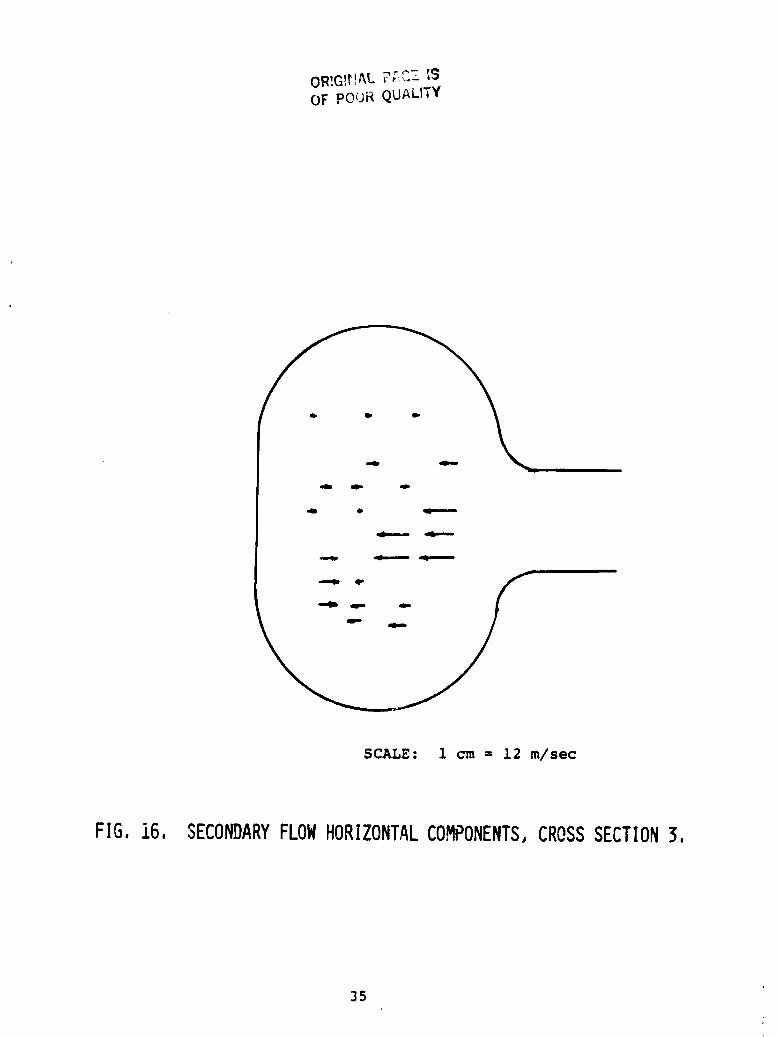
8
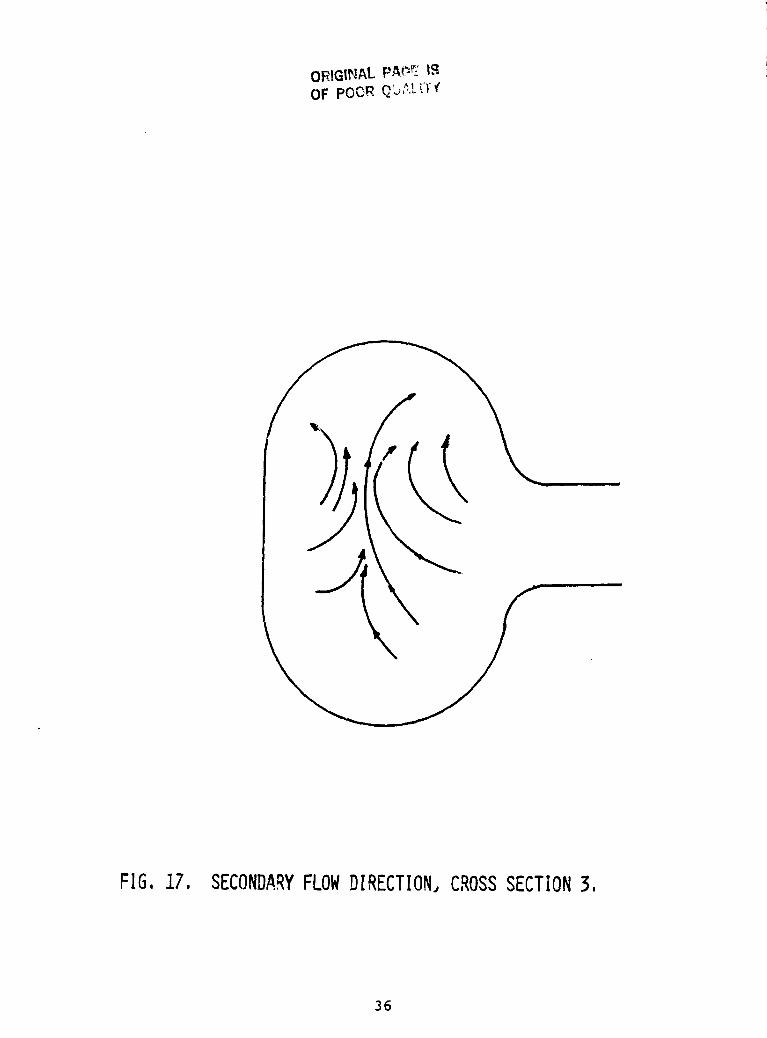
the secondary flow resultant vectors and their horizontal
components (Figs. 15 and 16), a reasonably stable flow pattern
seems to have formed. The split location and the secondary
flow path (Fig. 17) were virtually identical to those of the
second cross section tested. The same clockwise and counter-
clockwise secondary motion e.;isted near the volute's inside
and outside walls respectively. However, + 'sere appears to
have been a shift in the location of maximum secondary
velocity. This was no doubt due to the nozzle's more vertically
symmetric position on the inside wall. The through flow
velocities were again highest near the scroll inner wall
(Fig. 9), although the maximum velocities were somewhat less
than those of the second test section. Tha through flow
profiles were also much less uniform immediately before the
nozzle in this case. This may also be attributed to the
variation of nozzle position.
CONCLUSIONS
This series of tests has again demonstrated the great
influence which volute geometry has on flow behavior. Several
of the conjectures proposed in the earlier turbine volute
research projects have been reinforced by this latest work.
For example, both the first and second experiments c-_)nducted at
the University of Cincinnati's test facility strcngly suggested
that a helical motion was present in flow through turbine
volutes of circular cross-sections. This test series, since
the scroll cross-section geometry was nearly rectangular,
9

has by contrast demonstrated that this motion was apparently
induced by the passage's cross-sectional shape. For example,
there was no evident rotational motion of the secondary flow
split location between the 90 degree and the 180 degree test
cross-sections of this latest series of tests. Con-l'_rary to
this, the earlier tests at the University of Cincinnati have
shown significant rotational motion of the secondary flow
split location.
The absence of a secondary flow split in the first test
cross-section and its dramatic appearance at the 90 degree
location, of this latest work, also tends to confirm earlier
speculation that the secondary flow split was for-,ned in
reaction to both the forces imposed by the nozzle and the
centrifugal forces imposed by the passage bend.
Smaller variations in the secondary flow patterns of the
latest volute tests appear to have been largely due to varia-
tions of the nozzle position on t%e volute wall. For example,
directly in front of the nozzle the secondary flow velocities
were typically higher than at other locations within a test
cross-section. Due to the construction of this volute, the
nozzle position increased in altitude along the inside volute
wall with increasing depth into the scroll. This of course
affected the location of maximum secondary flow and to some
extent the pattern of secondary flow.
10

ACKNOWLEDGEMENT
The University of Cincinnati and the authors wish to
thank the administrators and the technical personnel of
the Cummins Engine Company, Columbus, Indiana, for the
donation of the scroll geometry and their useful
discussions in regard to this research work.
REFERENCES
1. Tabakoff, W., Sheoran, Y., Kroll, K., "Flow Measurements
in a Turbine Scroll," ASME Journal of Fluids Engineering,
September 1980, Vol. 102.
2. Tabakoff, W., Vittal, B.V.R. and Wood, B., "Three
Dimensional Flow Measurements in a Turbine Scroll,"
NASA CR-167920 Report, 1982.
3. Schmidt, D.P. and Okiishi, T.H., "Multistage Axial-Flow
Turbomachine Wake Production, Transport, and Inte_action,"
Engineering Research Institute, Iowa State University,
Ames, Iowa 50010.
11
__-A
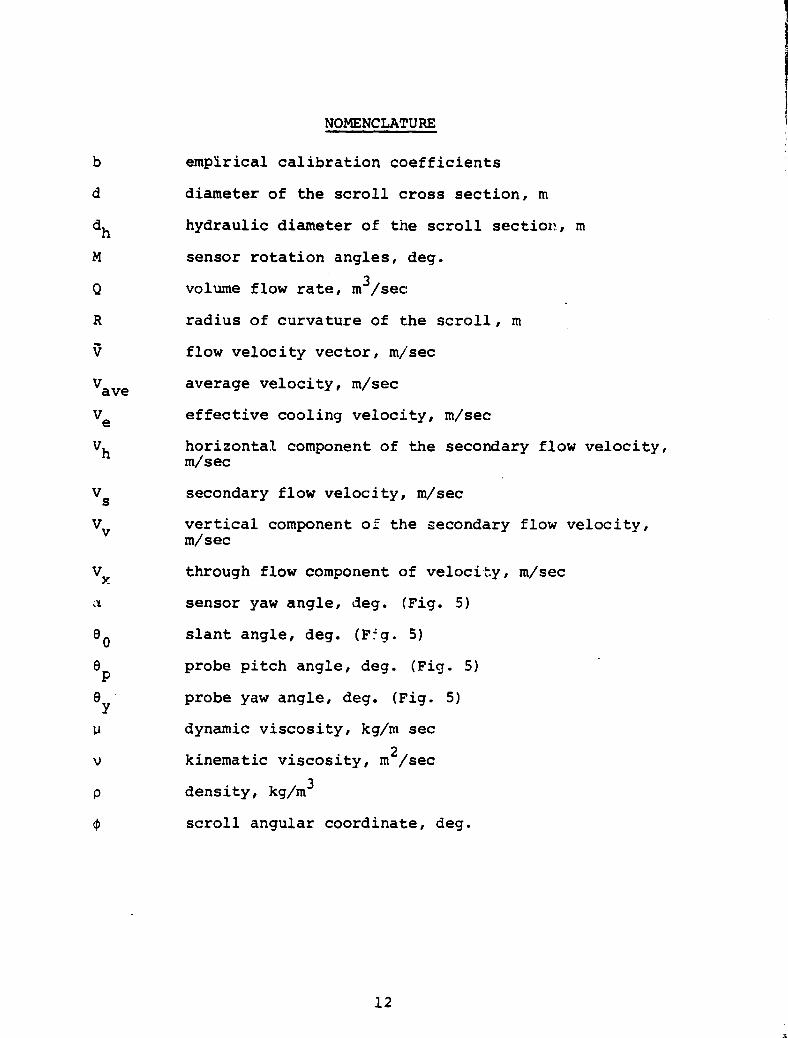
NOMENCLATURE
b empirical calibration coefficients
d diameter of the scroll cross section, m
d hydraulic diameter of the scroll section., m
M sensor rotation angles, deg.
Q volume flow rate, m3/sec
R radius of curvature of the scroll, m
V flow velocity vector, m/sec
Vave average velocity, m/sec
V effective cooling velocity, m/sec
V horizontal component of the secondary flow velocity,m/sec
Vssecondary flow velocity, m/sec
Vvvertical component of the secondary flow velocity,m/sec
VXthrough flow component of velocity, m/sec
A sensor yaw angle, deg. (Fig. 5)
9 0slant angle, deg. (F=g. 5)
6 probe pitch angle, deg. (Fig. 5)
8yprobe yaw angle, deg. (Fig. 5)
u dynamic viscosity, kg/m sec
V kinematic viscosity, m2/sec
P density, kg/m3
0 scroll angular coordinate, deg.
12
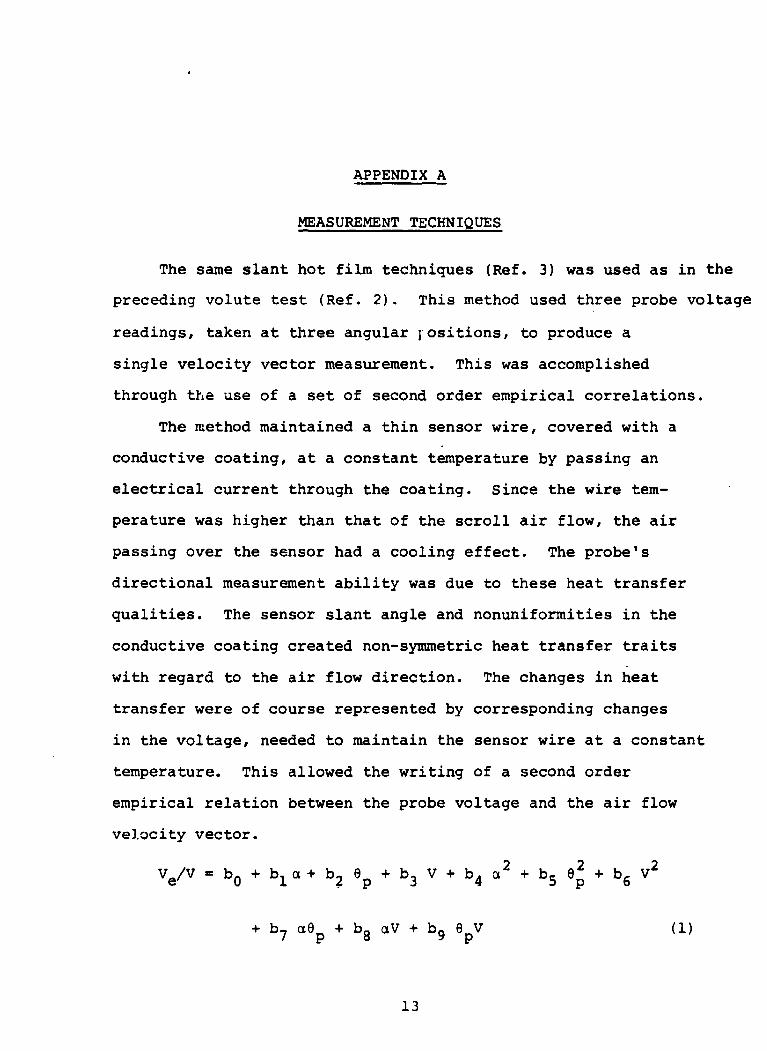
APPENDIX A
MEASUREMENT TECHNIQUES
The same slant hot film techniques (Ref. 3) was used as in the
preceding volute test (Ref. 2). This method used three probe voltage
readings, taken at three angular j-ositions, to produce a
single velocity vector measurement. This was accomplished
through the use of a set of second order empirical correlations.
The method maintained a thin sensor wire, covered with a
conductive coating, at a constant temperature by passing an
electrical current through the coating. Since the wire tem-
perature was higher than that of the scroll air flow, the air
passing over the sensor had a cooling effect. The probe's
directional measurement ability was due to these heat transfer
qualities. The sensor slant angle and nonuniformities in the
conductive coating created non-symmetric heat transfer traits
with regard to the air flow direction. The changes in heat
transfer were of course represented by corresponding changes
in the voltage, needed to maintain the sensor wire at a constant
temperature. This allowed the writing of a second order
empirical relation between the probe voltage and the air flow
velocity vector.
Ve/V = b 0 + b 1 a + b 2 9p +b3 V + b 4 a 2 + b 5 0 2 +b6 V2
+ b7 aep + b8 aV + b 9 6 p V (1)
13
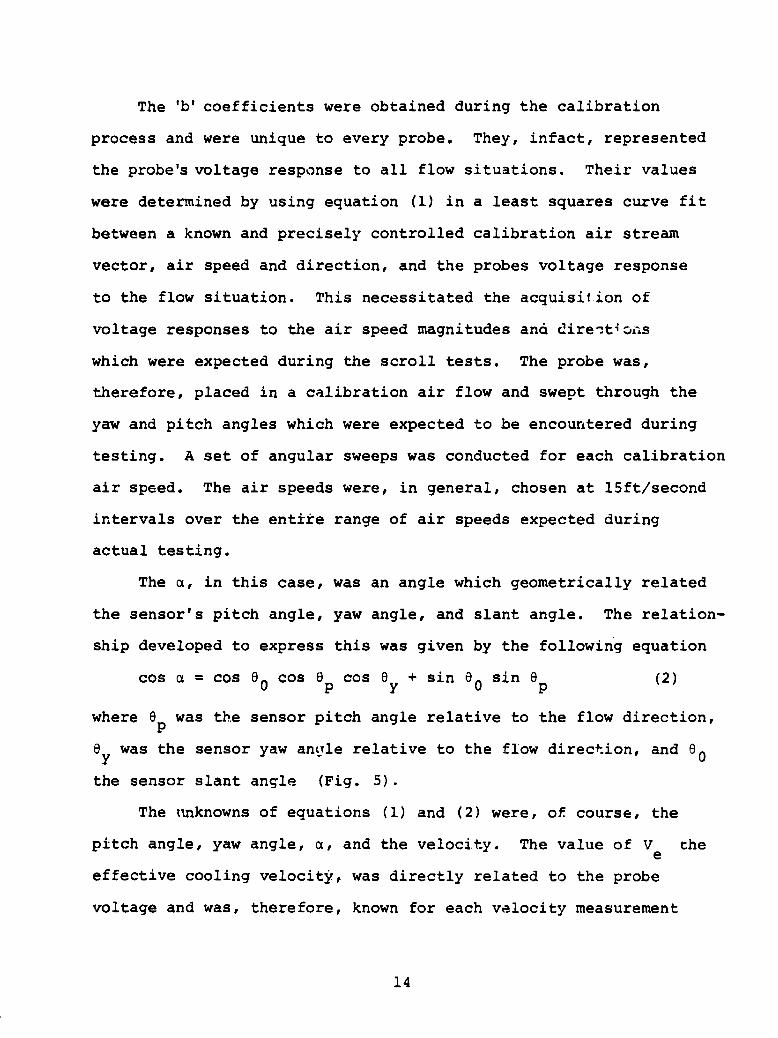
The 'b' coefficients were obtained during the calibration
process and were unique to every probe. They, infact, represented
the probe's voltage response to all flow situations. Their values
were determined by using equation (1) in a least squares curve fit
between a known and precisely controlled calibration air stream
vector, air speed and direction, and the probes voltage response
to the flow situation. This necessitated the acquisition of
voltage responses to the air speed magnitudes and `ire^.t4ors
which were expected during the scroll tests. The probe was,
therefore, placed in a calibration air flow and swept through the
yaw and pitch angles which were expected to be encountered during
testing. A set of angular sweeps was conducted for each calibration
air speed. The air speeds were, in general, chosen at 15ft/second
intervals over the entire range of air speeds expected during
actual testing.
The a, in this case, was an angle which geometrically related
the sensor's pitch angle, yaw angle, and slant angle. The relation-
ship developed to express this was given by the following equation
cos a = cos 6 0 cos e cos e + sin 6 0 sin 6p(2)
where 6p was the sensor pitch angle relative to the flow direction,
e was the sensor yaw an(Tle relative to the flow direction, and 60
the sensor slant angle (Fig. 5).
The unknowns of equations (1) and (2) were, of course, the
pitch angle, yaw angle, a, and the velocity. The value of Ve
the
effective cooling velocity, was directly related to the probe
voltage and was, therefore, known for each velocity measurement
14
p.<;^• l
OF Fit
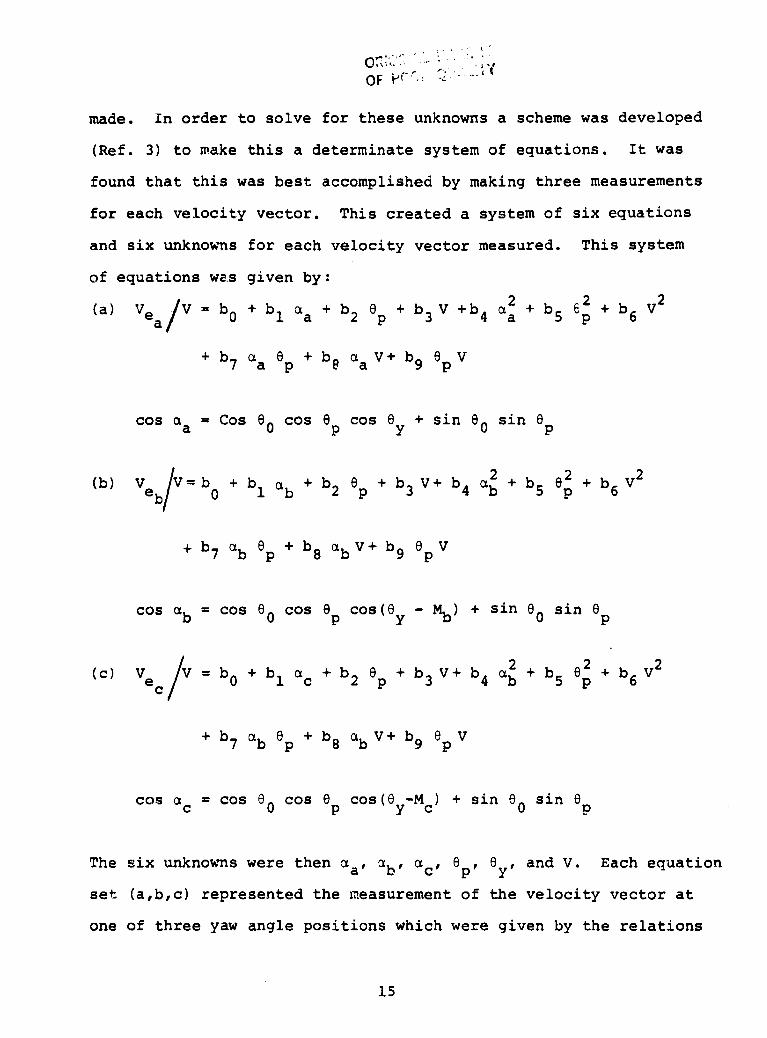
made. In order to solve for these unknowns a scheme was developed
(Ref. 3) to make this a determinate system of equations. It was
found that this was best accomplished by making three measurements
for each velocity vector. This created a system of six equations
and six unknowns for each velocity vector measured. This system
of equations was given by:
(a) Ve /V = b o + b l as + b2 ep + b 3 V +b4 as + b 5 6p + b6 V2a
+ b7 as 6p + b as V+ b9 6p V
cos as = Cos 6 o cos 6 p cos 6y + sin 6 o sin 6p
(b) Ve V= bo + bl ab + b2 6p + b 3 V+ b 4 ab + b 5 e 2 + b6 V2b
+ b 7 a 6p + b 8 a V+ b 9 6 p V
cos a = cos 6 o Cos 6p cos(ey - Mb ) + sin e o sin ep
(c) V V = bo + bl ac + b2 6p + b3 V+ b4 ab + b5 62 +b6 V2eC /
+ b7 ab 6p + b 8 a V+ b9 ep V
cos ac = cos e o cos e cos(6y-Mc ) + sin e o sin 6p
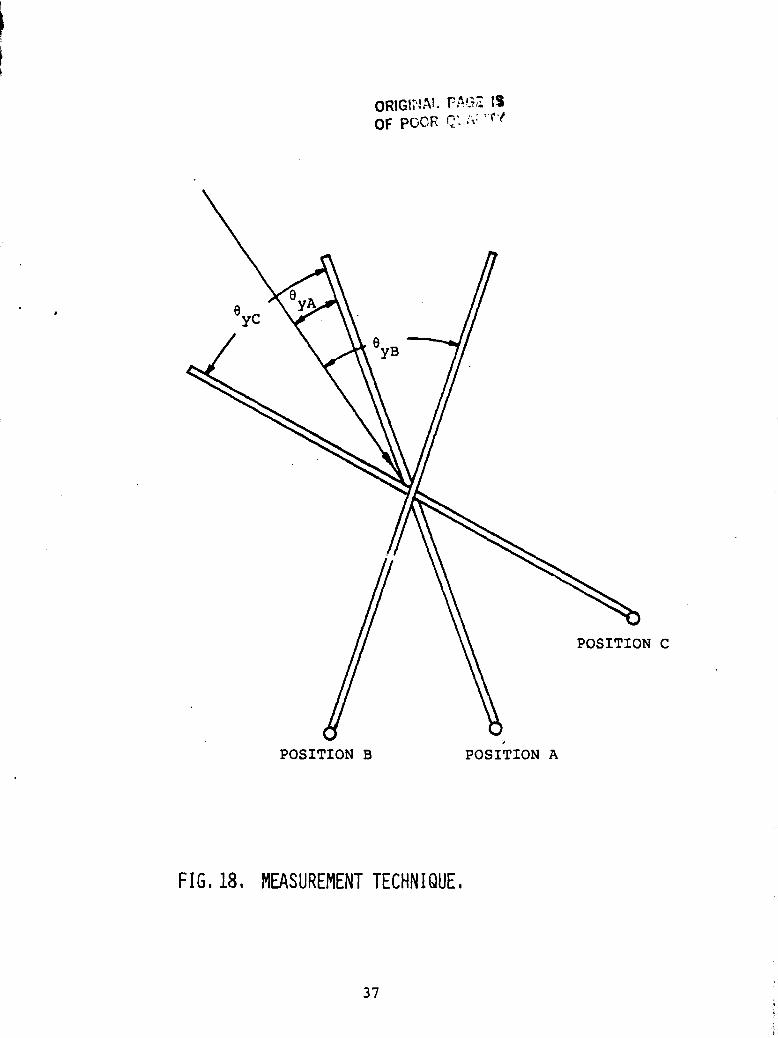
The six unknowns were then a a , ar , ac , 6p , 6 y , and V. Each equation
set (a,b,c) represented the measurement of the velocity vector at
one of three yaw angle positions which were given by the relations
L

A y , ey - Mb , and Ay - Mc (Fig.18). Although the exact yaw angle
was not known until completion of the data reduction process, the
first probe V reading was taken with the sensor turned to a five
degree yaw angle position with respect to the air glow. There-
fore, the first V reading was taken at a yaw angle, 9 y , ofa
five degrees. This was accomplished through the observation
of probe voltage characteristics. V readings were then taken
at a positive angular. position 6 yb = 9 ya b+ M and at a negative
angular position 9yc ya
= 9 - Mc . In this experiment Mb and Mc
were chosen to be 30 degrees in the clockwise and counter-
clockwise directions respectively. The corresponding effective
cooling velocities were then used in the above system of empirical
relations to determine the six unknown quantities. This, of
course, was sufficient to produce the velocity vector's direction
and magnitude relative to the sensor wire. A Newton-Raphson
numerical technique was developed to solve this sytem of
equations providing that an estimation of pitch angle, yaw angle,
and total velocity was given. It was found that a eery rough
estimate was sufficient to assure convergence of the scheme. A
set of trigonometric relations was then used to transfer the
velocity vectors from the coordinate system relative to the sensor
wire to the secondary and through flow scroll air flow velocity
components.
16
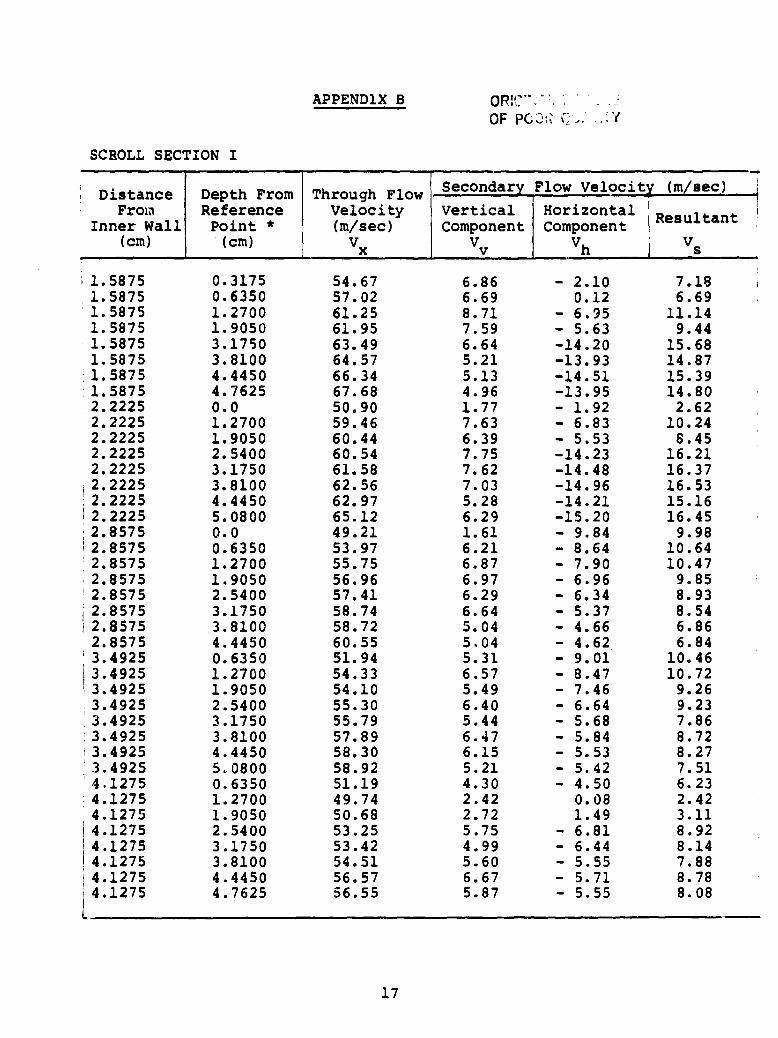
APPENDIX B OR;w`':"OF PC A "(
SCROLL SECTION I
DistanceFron
Depth FromReference
Through FlowVelocity
Secondar Flow Velocit (m sec)
Vertical Horizontal 1 ResultantInner Wall Point * (m/sec) Component Component(cm) I(cm) Vx Vv V
Vs
1.5875 0.3175 54.67 6.86 - 2.10 7.181.5875 0.6350 57.02 6.69 0.12 6.691.5875 1.2700 61.25 8.71 - 6.95 11.141.5875 1.9050 61.95 7.59 - 5.63 9.441.5875 3.1750 63.49 6.64 -14.20 15.681.5875 3.8100 64.57 5.21 -13.93 14.87
;1.5875 4.4450 66.34 5.13 -14.51 15.391.5875 4.7625 67.68 4.96 -13.95 14.802.2225 0.0 50.90 1.77 - 1.92 2.622.2225 1.2700 59.46 7.63 - 6.83 10.242.2225 1.9050 60.44 6.39 - 5.53 8.452.2225 2.5400 60.54 7.75 -14.23 16.212.2225 3.1750 61.58 7.62 -14.48 16.372.2225 3.8100 62.56 7.03 -14.96 16.532.2225 4.4450 62.97 5.28 -14.21 15.16
1 2.2225 5.0800 65.12 6.29 -15.20 16.45;2.8575 0.0 49.21 1.61 - 9.84 9.9812.8575 0.6350 53.97 6.21 - 8.64 10.64. 2.8575 1.2700 55.75 6.87 - 7.90 10.471 2.8575 1.9050 56.96 6.97 - 6.96 9.85'2.8575 2.5400 57.41 6.29 - 6.34 8.932.8575 3.1750 58.74 6.64 - 5.37 8.54
;2.8575 3.8100 58.72 5.04 - 4.66 6.862.8575 4.4450 60.55 5.04 - 4.62 6.84
'3.4925 0.6350 51.94 5.31 - 9.01 10.463.4925 1.2700 54.33 6.57 - 8.47 10.723.4925 1.9050 54.10 5.49 - 7.46 9.263.4925 2.5400 55.30 6.40 - 6.64 9.233.4925 3.1750 55.79 5.44 - 5.68 7.86
;3.4925 3.8100 57.89 6.47 - 5.84 8.7213.4925 4.4450 58.30 6.15 - 5.53 8.27'3.4925 5.0800 58.92 5.21 - 5.42 7.514=1275 0.6350 51.19 4.30 - 4.50 6.234.1275 1.2700 49.74 2.42 0.08 2.424.1275 1.9050 50.68 2.72 1.49 3.11
.4.1275 2.5400 53.25 5.75 - 6.81 8.92'4.1275 3.1750 53.42 4.99 - 6.44 8.1414.1275 3.8100 54.51 5.60 - 5.55 7.88
14.1275 4.4450 56.57 6.67 - 5.71 8.78
j4.1275 4.7625 56.55 5.87 - 5.55 8.08
17i
3
OR OT, i^ F ry,i yip ^
QIJaLVIYOF POOR
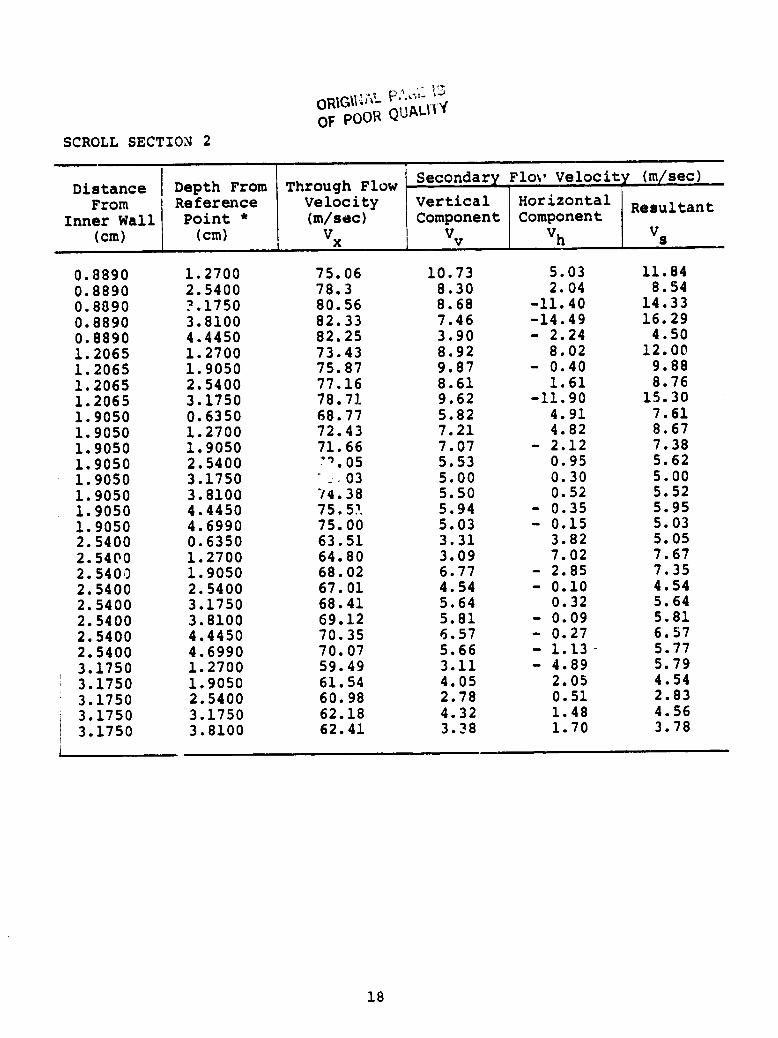
SCROLL SECTION 2
Secondary Floe Velocit (m sec)Distance I Depth From Through Flow
From Reference Velocity Vertical Horizontal ResultantInner Wall Point * (m/sec) Component Component
(cm) (cm) Vx Vv V Vs -
0.8890 1.2700 75.06 10.73 5.03 11.84
0.8890 2.5400 78.3 8.30 2.04 8.54
0.8890 ?.1750 80.56 8.68 -11.40 14.33
0.8890 3.8100 82.33 7.46 -14.49 16.29
0.8890 4.4450 82.25 3.90 - 2.24 4.50
1.2065 1.2700 73.43 8.92 8.02 12.00
1.2065 1.9050 75.87 9.87 - 0.40 9.88
1.2065 2.5400 77.16 8.61 1.61 8.76
1.2065 3.1750 78.71 9.62 -11.90 15.30
1.9050 0.6350 68.77 5.82 4.91 7.61
1.9050 1.2700 72.43 7.21 4.82 8.67
1.9050 1.9050 71.66 7.07 - 2.12 7.38
1.9050 2.5400 9'.05 5.53 0.95 5.62
1.9050 3.1750 Y.03 5.00 0.30 5.00
1.9050 3.8100 74.38 5.50 0.52 5.52
1.9050 4.4450 75.51. 5.94 - 0.35 5.95
1.9050 4.6990 75.00 5.03 - 0.15 5.032.5400 0.6350 63.51 3.31 3.82 5.05
2.5400 1.2700 64.80 3.09 7.02 7.67
2.5400 1.9050 68.02 6.77 - 2.85 7.35
2.5400 2.5400 67.01 4.54 - 0.10 4.54
2.5400 3.1750 68.41 5.64 0.32 5.64
2.5400 3.8100 69.12 5.81 - 0.09 5.81
2.5400 4.4450 70.35 6.57 - 0.27 6.57
2.5400 4.6990 70.07 5.66 - 1.13- 5.77
3.1750 1.2700 59.49 3.11 - 4.89 5.79
3.1750 1.9050 61.54 4.05 2.05 4.54
3.1750 2.5400 60.98 2.78 0.51 2.83
3.1750 3.1750 62.18 4.32 1.48 4.56
3.17501
3.8100 62.41 3.38
-
1.70 3.78
18
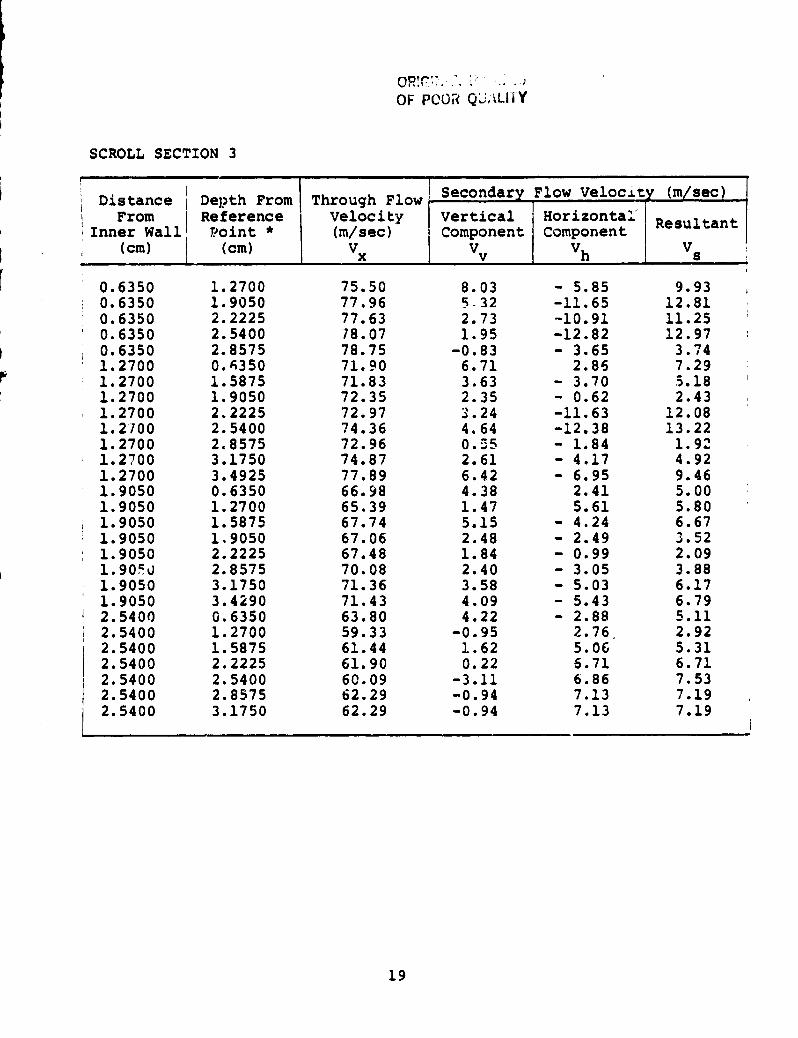
OF PCOR Q; 1 Y
SCROLL SECTION 3
Distance Depth From Through FlowFrom Reference Velocity Vertical Horizontal
Secondary Flow Velocit (m sec)
:Inner Wall; Point * (m/sec) Component ComponentResultant
(cm) (cm) VX Vv Vh Vs
0.6350 1.2700 75.50 8.03 - 5.85 9.930.6350 1.9050 77.96 5-32 -11.65 12.810.6350 2.2225 77.63 2.73 -10.91 11.250.6350 2.5400 78.07 1.95 -12.82 12.970.6350 2.8575 78.75 -0.83 - 3.65 3.74
' 1.2700 0.F350 71.90 6.71 2.86 7.291.2700 1.5875 71.83 3.63 - 3.70 5.181.2700 1.9050 72.35 2.35 - 0.62 2.431.2700 2.2225 72.97 3.24 -11.63 12.081.2700 2.5400 74.36 4.64 -12.38 13.221.2700 2.8575 72.96 0.,5 - 1.84 1.9"1.2700 3.1750 74.87 2.61 - 4.17 4.921.2700 3.4925 77.89 6.42 - 6.95 9.461.9050 0.6350 66.98 4.38 2.41 5.001.9050 1.2700 65.39 1.47 5.61 5.801.9050 1.5875 67.74 5.15 - 4.24 6.671.9050 1,9050 67.06 2.48 - 2.49 3.521.9050 2.2225 67.48 1.84 - 0.99 2.091.90 i 2.8575 70.08 2.40 - 3.05 3.881.9050 3.1750 71.36 3.58 - 5.03 6.171.9050 3.4290 71.43 4.09 - 5.43 6.792.5400 0.6350 63.80 4.22 - 2.88 5.112.5400 1.2700 59.33 -0.95 2.76. 2.922.5400 1.5875 61.44 1.62 5.06 5.312.5400 2.2225 61.90 0.22 6.71 6.712.5400 2.5400 60.09 -3.11 6.86 7.532.5400 2.8575 62.29 -0.94 7.13 7.1944.34UU 3.1/7U OZ.zv -U.y4 /.13 /.J.J
iL
19
JJO
UNF-NW
a
WN
JQHZW
d'WCLxWWS
U.O
C9Q
Q
UF-Q
WT_
UN
6
U.
l^t<<L^
OF F
W
QLL!
C9 ^-Z uWY^ra WJ U
U lLW .r
ccO
W
N QNOW ZCG Qa t-N
4
1
r ^•
Iwo .r lb
' rs
• v+
{r
r
— t
J
FIG. 2, SCROLL ,ASSEMBLY WITH THE PORT PLATES FOR THE PROBE,
21 C '-L PA^EBLACK AND V, C PHOTOGRAPH
'!T
.r- u
t
1
p!
i
Ii
f
FIG, SCROLL ASSEMBLY,
22 BLACK A",,G kTE C
SEC 2b = 90°
OaiG,
SEC 1 OF POOR QUALi T Y= 0°
SEC 30 = 180°
FIG, 4, SCROLL PLATFORM
23
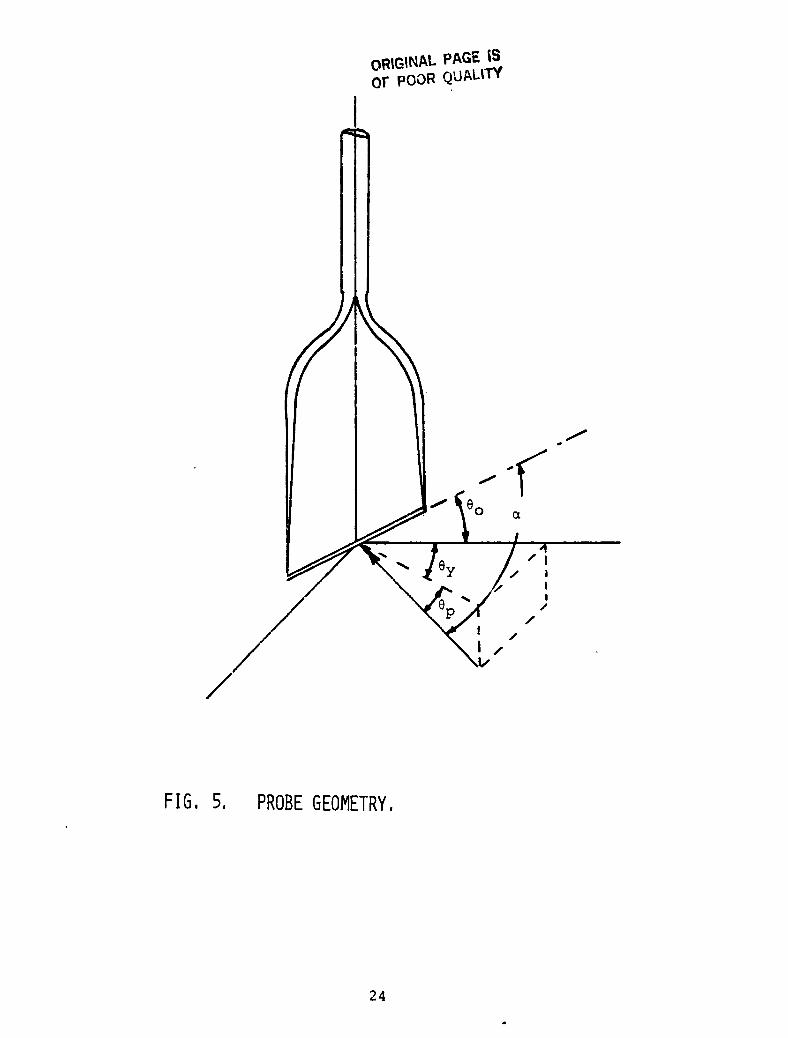
FIG, 5, PROBE GEOMETRY,
24
ORIGINAL PAG" ISOF POOR QUALITY
9 = 00
• '46.3
47.5
. 47.5
• 48.4
o 49.3 0 08=90°
46.4 46.6 49.2 51.0 50.6
• 49.6
• 49.2
• 50.2
• 50.4
FIG. 6. INLET VELOCITY PROFILE, M/SEC.
25

ec
ppAll 1S
OFt p^00R QtJ pL'V
x REFERENCE POINT
FIG, 7, THROUGH FLOW VELOCITIES, CROSS SECTION 1,
26
INT
ORIGIINAL PAGE 13
OF POOR QUALITY
FIG, 8, THROUGH FLOW VELOCITIES, CROSS SECTION 2.
27
'0I NT
ORIGINAL PAGE ISOF POOR QUALITY
SCALE: 1 cm = 12 r/sec
FIG, 9. THROUGH FLOW VELOCITIES, CROSS SECTION 3.
28
ORIGINAL PAGE IS
OF POUR QUALITY
SCALE: 1 cm = 12 m/see:
FIG. 10. SECONDARY FLOW RESULTANT VECTORS, CROSS SECTION 1.
29
ORIGINAL PACE ISOF POOR Q'UAL1 i -f
SCALE. 1 cm = 12 m/sec
FIG. 11. SECONDARY FLOW HORIZONTAL COMPONENTS, CROSS SECTION 1.
30

OF P001 QUfj '.1TY
SCALE: 1 cm = 12 m/sec
FIG. 12, SECONDARY FLOW RESULTANT VECTORS, CROSS SECTION 2,
31
ORIGINAL PA,:.E- 1OF POOR QUALITY
SCALE: 1 cm = 12 m/sec
FIG, 13), SECONDARY FLOW HORIZONTAL COMPONENTS: CROSS SECTION 2,
32
of
FIG, 14. SECONDARY FLOW DIRECTION, CROSS SECTION 2,
33
34
ORIGINAL. PAGE 1'
OF POOR QUALITY
SCALE: 1 cm - 12 m/sec
FIG, 15, SECONDARY FLOW RESULTANT 'VECTORS, CROSS SECTION 3,
OR'Glr!;aL t
OF P O" %R ^f Y
SCALE: 1 cm = 12 m/sec
FIG, 16. SECONDARY FLOW HORIZONTAL COMPONENTS, CROSS SECTION 3.
35
ORIGii•IAL PAW 1
OF POOP: .^ _.'1
FIG. 17. SECONDARY FLOW DIRECTION, CROSS SECTION 3,
36
N C
OF POO"
v
POSITION B POSITION A
FIG,18, MEASUREMENT TECHNIQUE,
37