general education learning outcomes - surry.edugeneral education learning outcomes 2013-2014...
TRANSCRIPT

General EducationLearning Outcomes
2013-2014 Analysis of Results
ommunity ollegec c TM
Writ
ing
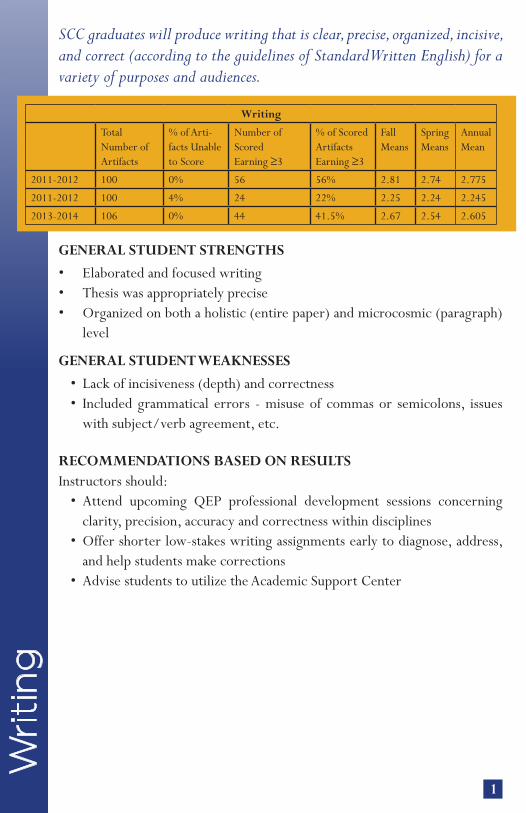
SCC graduates will produce writing that is clear, precise, organized, incisive, and correct (according to the guidelines of Standard Written English) for a variety of purposes and audiences.
GENERAL STUDENT STRENGTHS • Elaborated and focused writing• Thesis was appropriately precise• Organized on both a holistic (entire paper) and microcosmic (paragraph)
level
GENERAL STUDENT WEAKNESSES• Lack of incisiveness (depth) and correctness• Included grammatical errors - misuse of commas or semicolons, issues
with subject/verb agreement, etc.
RECOMMENDATIONS BASED ON RESULTSInstructors should:
• Attend upcoming QEP professional development sessions concerning clarity, precision, accuracy and correctness within disciplines
• Offer shorter low-stakes writing assignments early to diagnose, address, and help students make corrections
• Advise students to utilize the Academic Support Center
Writing
Total Number of Artifacts
% of Arti-facts Unable to Score
Number of ScoredEarning ≥3
% of Scored Artifacts Earning ≥3
Fall Means
Spring Means
Annual Mean
2011-2012 100 0% 56 56% 2.81 2.74 2.775
2011-2012 100 4% 24 22% 2.25 2.24 2.245
2013-2014 106 0% 44 41.5% 2.67 2.54 2.605
1

SCC graduates will think about their thinking in order to improve it. They will be able (1) to analyze thought (their own and that of others) by identifying, examining, and employing the essential elements of reasoning; (2) to assess thought by applying intellectual standards; and (3) to think ethically and fairly by cultivating intellectual traits. They will demonstrate thinking that is clear, accurate, precise, relevant, logical, deep, broad, and fair, while analyzing, synthesizing, and evaluating.
GENERAL STUDENT STRENGTHS• Demonstrated depth of thought and breadth of discussion• Met the standard of accuracy in their responses, if not precision
GENERAL STUDENT WEAKNESSES• Did not cite sources precisely• For assignments meant to analyze or critique personal experiences, relied
on summary or relating a process rather than discussing the “why” element• Did not follow logical organization• Lacked clarity in making a logical argument or main point• Did not recognize the significance or range of possible implications
and consequences when consideration of multiple causes or effects was required
RECOMMENDATIONS BASED ON RESULTSInstructors should:
• Utilize group activities which encourage problem-solving, diagnoses, or debate
• Introduce students to the definition of Critical Thinking and the Paul and Elder model
• Require application of elements of thought to an analysis of an advertisement, scientific journal article, video, poster, etc.
• Encourage habit of incorporating elements of thought, as well as defense of student responses, with all verbal and written discussions, analyses, or project
Critical Thinking
Total Number of Artifacts
% of Arti-facts Unable to Score
Number of Scored Earning ≥3
% of Scored Artifacts Earning ≥3
Fall Means
Spring Means
Annual Mean
2011-2012 101 0% 29 28.7% 2.48 1.98 2.23
2012-2013 100 0% 30 30.0% 2.28 2.29 2.285
2013-2014 92 4.3% 24 27.3% 2.28 2.37 2.325
2 C
ritic
al T
hin
kin
g

SCC graduates will read actively and analytically at the college level and synthesize and apply information across disciplines.
GENERAL STUDENT STRENGTHS/WEAKNESSES• Demonstrated reading comprehension by identifying author’s key question
and main point for writing the text• Distinguished between facts and opinions• Identified main conclusions and implications/applications of the text to
real life situations
GENERAL STUDENT WEAKNESSES• Lacked synthesis of reading materials• Failed to successfully link text evidence to explaining the relevance of text
evidence to author’s assumptions and logic
RECOMMENDATIONS BASED ON RESULTSInstrutors should:
• Include assignments which ask for specific responses and result in artifacts that clearly demonstrate reading comprehension
• Include low-stakes assignments/activities that address individual parts of the reading rubric which lead to a culminating assignment that addresses all components necessary to assess student’s ability to demonstrate reading comprehension, analysis, and synthesis
Reading
Total Number of Artifacts
% of Arti-facts Unable to Score
Number of Scored Earning ≥3
% of Scored Artifacts Earning ≥3
Fall Means
Spring Means
Annual Mean
2011-2012 62 9.7% 37 59.7% 2.92 2.92 2.92
2012-2013 89 30.0% 57 70.4% 3.11 3.34 3.225
2013-2014 78 7.7% 48 66.7% 2.72 2.92 2.82
3 R
ea
din
g

SCC graduates should be able to apply college-level mathematical concepts and methods to understand, analyze, and communicate in quantitative terms.
GENERAL STUDENT STRENGTHS• Demonstrated proficiency in performing calculations correctly and
completely
GENERAL STUDENT WEAKNESSES• Lacked ability to give correct evaluation, interpretation, and analysis of
results of calculations in context of assignment• Explanations lacked depth and showed a lack of connection and
understanding of assignment questions
RECOMMENDATIONS BASED ON RESULTSInstructors should:
• Give students a copy of the rubric and outcome sheet at the beginning of the course, and emphasize (and model) those concepts throughout the course.
• Address the relationship between variables and require students to write about the consequences of calculations. Have class- led discussions concerning the implications and consequences of the calculations.
• Utilize in-class writing activities which require students to write about current concepts and give responses that require explanations.
• Build student competency by utilizing simpler quantitative literacy assignments on a repetitive basis.
Quantitative Literacy
Total Number of Artifacts
% of Arti-facts Unable to Score
Number of Scored Earning ≥3
% of Scored Artifacts Earning ≥3
Fall Means
Spring Means
Annual Mean
2011-2012 100 9% 33 36.3% 2.49 2.40 2.445
2012-2013 91 0% 54 59.3% 2.73 2.89 2.81
2013-2014 80 5% 47 61.9% 2.80 2.96 2.88
4 Q
ua
ntit
ativ
e L
itera
cy

SCC graduates should be able to effectively use technology as a tool for research, problem solving, communication, and career enrichment.
GENERAL STUDENT STRENGTHS• Implemented specific and complex software• Used creativity to formulate and communicate findings
GENERAL STUDENT WEAKNESSES• Included grammatical and spelling errors• Incoherent sentences were present
RECOMMENDATIONS BASED ON RESULTSInstructors should:
• Discuss expectations and address any confusion on the day the assignment is given• Have students create a checklist related to the assignment (and based on a rubric)• Post assignments on a Moodle supplementary site• Require drafts of extensive assignments and provide feedback before final
submission (or incorporate student peer reviews with part of student’s grade based on quality of feedback)
Information Literacy
Total Number of Artifacts
% of Arti-facts Unable to Score
Number of Scored Earning ≥3
% of Scored Artifacts Earning ≥3
Fall Means
Spring Means
Annual Mean
2011-2012 75 37.3% 8 17.02% 1.94 2.25 2.095
2012-2013 101 6.9% 21 22.3% 2.23 2.26 2.245
2013-2014 90 2.2% 25 28.4% 2.50 2.27 2.385
5 In
form
atio
n L
itera
cy

SCC graduates should be able to speak in a manner that is clear, precise, coherent, perceptive, audience-aware, and correct (according to Standard Written English) in both small and large group settings.
GENERAL STUDENT STRENGTHS • Demonstrated understanding of the assignment
GENERAL STUDENT WEAKNESSES• Lacked depth• Did not provide oral citation of credible, relevant, current, or appropriate
sources to support claims• Did not demonstrate critical thinking through application of all intellectual
standards• Read speeches from either PowerPoint slides or notes
RECOMMENDATIONS BASED ON RESULTSInstructors should:
• Require current and valid supporting evidence for all high stakes program assignments
• Within instructions, require citation of credible sources• Continue to improve presentation assignment alignment to Speaking
rubric
Speaking
Total Number of Artifacts
% of Arti-facts Unable to Score
Number of Scored Earning ≥3
% of Scored Artifacts Earning ≥3
Fall Means
Spring Means
An-nual Mean
2011-2012 54 3% 28 51.9% 2.68 2.69 2.685
2012-2013 47 17.2% 26 66.7% 3.00 3.05 3.025
2013-2014 47 6.4% 18 40.9% 2.72 2.57 2.645
6 S
pe
aki
ng

SCC graduates should be able to effectively use technology as a tool for research, problem solving, communication, and career enrichment.
GENERAL STUDENT STRENGTHS• Implemented specific and complex software• Interpreted technical materials to formulate logical, evidence-based
solutions in verbal, written, or visual form
GENERAL STUDENT WEAKNESSES• Included grammatical and spelling errors• Incoherent sentences were present
RECOMMENDATIONS BASED ON RESULTSInstructors should:
• Use explicit instructions• Encourage students to thoroughly read directions• Ask students to create a checklist related to their assignments (perhaps
basing this on a rubric)• Consider implementing a supplementary Moodle page and posting
assignments well in advance
Technology Skills
Total Number of Artifacts
% of Arti-facts Unable to Score
Number of Scored Earning ≥3
% of Scored Artifacts Earning ≥3
Fall Means
Spring Means
Annual Mean
2011-2012 84 23.8% 43 67.2% 3.13 2.65 2.89
2012-2013 105 10.5% 60 57.1% 3.14 2.94 3.06
2013-2014 66 1.5% 57 87.7% 3.64 3.06 3.35
7 T
ec
hn
olo
gy
Skill
s
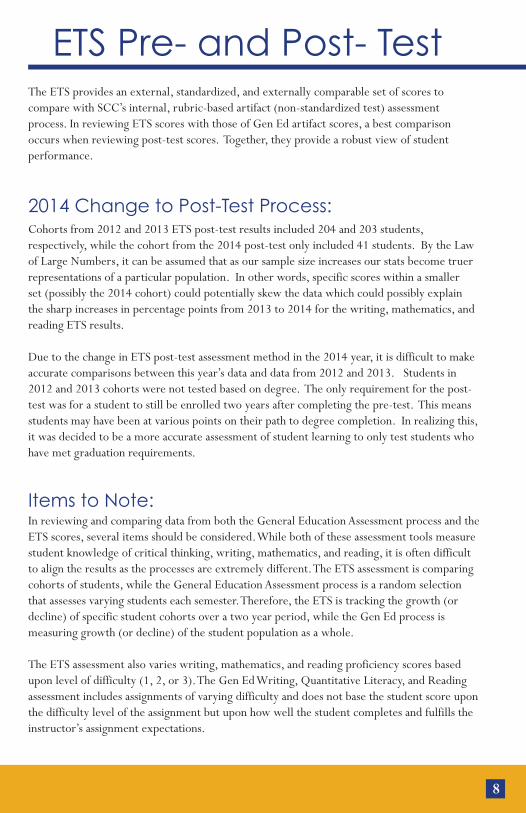
ETS Pre- and Post- Test
2014 Change to Post-Test Process:
Items to Note:
8
The ETS provides an external, standardized, and externally comparable set of scores to compare with SCC’s internal, rubric-based artifact (non-standardized test) assessment process. In reviewing ETS scores with those of Gen Ed artifact scores, a best comparison occurs when reviewing post-test scores. Together, they provide a robust view of student performance.
Cohorts from 2012 and 2013 ETS post-test results included 204 and 203 students, respectively, while the cohort from the 2014 post-test only included 41 students. By the Law of Large Numbers, it can be assumed that as our sample size increases our stats become truer representations of a particular population. In other words, specific scores within a smaller set (possibly the 2014 cohort) could potentially skew the data which could possibly explain the sharp increases in percentage points from 2013 to 2014 for the writing, mathematics, and reading ETS results.
Due to the change in ETS post-test assessment method in the 2014 year, it is difficult to make accurate comparisons between this year’s data and data from 2012 and 2013. Students in 2012 and 2013 cohorts were not tested based on degree. The only requirement for the post-test was for a student to still be enrolled two years after completing the pre-test. This means students may have been at various points on their path to degree completion. In realizing this, it was decided to be a more accurate assessment of student learning to only test students who have met graduation requirements.
In reviewing and comparing data from both the General Education Assessment process and the ETS scores, several items should be considered. While both of these assessment tools measure student knowledge of critical thinking, writing, mathematics, and reading, it is often difficult to align the results as the processes are extremely different. The ETS assessment is comparing cohorts of students, while the General Education Assessment process is a random selection that assesses varying students each semester. Therefore, the ETS is tracking the growth (or decline) of specific student cohorts over a two year period, while the Gen Ed process is measuring growth (or decline) of the student population as a whole.
The ETS assessment also varies writing, mathematics, and reading proficiency scores based upon level of difficulty (1, 2, or 3). The Gen Ed Writing, Quantitative Literacy, and Reading assessment includes assignments of varying difficulty and does not base the student score upon the difficulty level of the assignment but upon how well the student completes and fulfills the instructor’s assignment expectations.

MathematicsETS Level 1 ETS Level 2 ETS Level 3 General Education
2012 Post-test: 44%
2012 Post-test: 15%
2012 Post-test: 2%
2011-2012: 36.3% of scored artifacts earning ≥ 3
2013 Post-test: 45%
2013 Post-test: 15%
2013 Post-test: 3%
2012-2013: 59.3% of scored artifacts earning ≥ 3
2014 Post-test: 71%
2014 Post-test: 41%
2014 Post-test: 10%
2013-2014: 61.9% of scored artifacts earning ≥ 3
Critical ThinkingETS General Education2012 Post-test: 5% 2011-2012: 28.7% of scored artifacts earning ≥ 3
2013 Post-test: 3% 2012-2013: 30.0% of scored artifacts earning ≥ 3
2014 Post-test: 2% 2013-2014: 27.3% of scored artifacts earning ≥ 3
Conclusions: The ETS post-test scores as compared to the Gen Ed Writing scores show that writing is an area of concern for SCC and provides support that our QEP topic was well chosen. Results also indicate that our initial year of QEP emphasis on student skills had a marked impact on student writing abilities. Results from both assessments provide evidence that we are on target to meeting QEP benchmark goals.
Conclusions: The ETS post-test scores as compared to the Gen Ed Critical Thinking scores show that little impact was made over the course of time. Over the three academic years, a 3% point decline in ETS scores is minimal (while still concerning), as was the 1.4% point decrease in Gen Ed scores. Therefore, the results from ETS and the Gen Ed Critical Thinking assessment collectively show our students consistently struggle with critical thinking.
9

WritingETS Writing Level 1
ETS Writ-ing Level 2
ETS Writing Level 3
General Education
2012 Post-test: 46%
2012 Post-test: 8%
2012 Post-test: 3%
2011-2012: 56.0% of scored artifacts earning ≥ 3
2013 Post-test: 43%
2013 Post-test: 10%
2013 Post-test: 5%
2012-2013: 22.0% of scored artifacts earning ≥ 3
2014 Post-test: 68%
2014 Post-test: 15%
2014 Post-test: 10%
2013-2014: 41.5% of scored artifacts earning ≥ 3
ReadingETS Level 1 ETS Level 2 General Education
2012 Post-test: 52%
2012 Post-test: 23%
2011-2012: 59.7% of scored artifacts earning ≥ 3
2013 Post-test: 49%
2013 Post-test: 19%
2012-2013: 70.4% of scored artifacts earning ≥ 3
2014 Post-test: 73%
2014 Post-test: 44%
2013-2014: 66.7% of scored artifacts earning ≥ 3
Conclusions: Based on the three year period, both ETS (all levels) and General Education show significant growth. This data indicates we are well on our way to meeting benchmark proficiency for the mathematics/quantitative literacy outcome.
Conclusions: The slight decline in ETS results based on the two cohorts from 2012 to 2013 contradict those of the Gen Ed results which shows a substantial growth of 10.7%. ETS results indicate a substantial increase from 2013 to 2014 while Gen Ed results are more consistent. Reading is the one outcome in which the results do not seem to correlate.
10

ommunity ollege ommunity ollegewww.surry.edu
c c TM
Contact Information:
Sara McMillenGeneral Education Learning Outcomes Chair
ext. 3393
Kayla T. CollinsDirector, Academic Support Center
ext. 3526
For more information and resources on the General
Education Learning Outcomes, please visit the Faculty
Resource Moodle page.