general instructions - meimei.org.uk/files/papers/all packs/ms_mei_s2.pdfgeneral instructions ......
TRANSCRIPT

GENERAL INSTRUCTIONS Marks in the mark scheme are explicitly designated as M, A, B, E or G. M marks ("method") are for an attempt to use a correct method (not merely for stating the method). A marks ("accuracy") are for accurate answers and can only be earned if corresponding M mark(s) have been earned. Candidates are expected to give answers to a sensible level of accuracy in the context of the problem in hand. The level of accuracy quoted in the mark scheme will sometimes deliberately be greater than is required, when this facilitates marking. B marks are independent of all others. They are usually awarded for a single correct answer. Typically they are available for correct quotation of points such as 1.96 from tables. E marks ("explanation") are for explanation and/or interpretation. These will frequently be sub divisible depending on the thoroughness of the candidate's answer. G marks ("graph") are for completing a graph or diagram correctly.
• Insert part marks in right-hand margin in line with the mark scheme. For fully correct parts tick the answer. For partially complete parts indicate clearly in the body of the script where the marks have been gained or lost, in line with the mark scheme.
• Please indicate incorrect working by ringing or underlining as appropriate.
• Insert total in right-hand margin, ringed, at end of question, in line with the mark
scheme.
• Numerical answers which are not exact should be given to at least the accuracy shown. Approximate answers to a greater accuracy may be condoned.
• Probabilities should be given as fractions, decimals or percentages.
• FOLLOW-THROUGH MARKING SHOULD NORMALLY BE USED
WHEREVER POSSIBLE. There will, however, be an occasional designation of 'c.a.o.' for "correct answer only".
• Full credit MUST be given when correct alternative methods of solution are used.
If errors occur in such methods, the marks awarded should correspond as nearly as possible to equivalent work using the method in the mark scheme.
• The following notation should be used where applicable:

Question 1 (i)
Uniform average rate of occurrence;
Successive arrivals are independent.
Suitable arguments for/against each assumption: Eg Rate of occurrence could vary depending on the weather (any reasonable suggestion)
E1,E1 for suitable assumptions E1, E1 must be in context
4
(ii)
Mean = xfnΣ = 39 40 36 32 15
100+ + + + =162
100 = 1.62
Variance = ( )2211
fx nxn
Σ −−
= ( 21 430 100 1.6299
− × )= 1.69 (to 2 d.p.)
B1 for mean NB answer given M1 for calculation
A1
3
(iii) Yes, since mean is close to variance B1FT 1
(iv) P(X = 2) = e−1.62
21.622!
= 0.260 (3 s.f.)
Either: Thus the expected number of 2’s is 26 which is reasonably close to the observed value of 20.
Or: This probability compares reasonably well with the relative frequency 0.2
M1 for probability calc. M0 for tables unless interpolated A1 B1 for expectation of 26 or r.f. of 0.2 E1
4
(v)
λ = 5×1.62 = 8.1
Using tables: P(X ≥ 10) = 1 – P(X ≤ 9)
= 1 – 0.7041 = 0.2959
B1FT for mean (SOI)
M1 for probability from using tables to find 1 – P(X 9) ≤ A1 FT
3
(vi)
Mean no. of items in 1 hour = 360 × 1.62 = 583.2
Using Normal approx. to the Poisson,
X ~ N(583.2, 583.2):
P(X ≤ 550.5) = P 550.5 583.2583.2
Z −⎛ ≤⎜⎝ ⎠
⎞⎟
= P(Z ≤ -1.354) = 1 - Φ(1.354) = 1 – 0.9121
B1 for Normal approx. with correct parameters (SOI)
B1 for continuity corr. M1 for probability
4

= 0.0879 (3 s.f.)
using correct tail A1 CAO, (but FT wrong or omitted CC)
19
Question 2 (i)
X ~ N(38.5,16)
P(X > 45) = 45 38.5P4
Z −⎛ ⎞>⎜ ⎟⎝ ⎠
= P( Z > 1.625)
= 1 - Φ(1.625) = 1 – 0.9479 = 0.0521 (3 s.f.) or 0.052 (to 2 s.f.)
M1 for standardizing
A1 for 1.625
M1 for prob. with tables and correct tail A1 CAO (min 2 s.f.)
4
(ii) From tables Φ-1 ( 0.90 ) = 1.282
38.5 1.2824
x −= −
x = 38.5 – 1.282 × 4 = 33.37
So 33.4 should be quoted
B1 for 1.282 seen M1 for equation in x and negative z-value A1 CAO
3
(iii)
Y ~ N(51.2, σ2)
From tables Φ-1 ( 0.75 ) = 0.6745
55 51.2 0.6745σ−
=
3.8 = 0.6745 σ
σ = 5.63
B1 for 0.6745 seen M1 for equation in σ with z-value A1 NB answer given
3
(iv)
G1 for shape G1 for means, shown explicitly or by scale G1 for lower max height in diesel G1 for higher variance in diesel
4
(v)
P(Diesel > 45) = 45 51.2P5.63−⎛ ⎞>⎜ ⎟
⎝ ⎠Z
M1 for prob. calc. for diesel

= P( Z > -1.101) = Φ(1.101) = 0.8646 P(At least one over 45) = 1 – P(Both less than 45) = 1 - (1 - 0.0521) x (1 - 0.8646) = 1 - 0.9479 x 0.1354 = 0.8717 NB allow correct alternatives based on: P(D over, P under)+P(D under, P over)+ P(both over) or P(D over) + P(P over) – P(both over)
M1 for correct structure M1dep for correct probabilities A1 CAO (2 s.f. min)
4
18 Question 3 (i)
x = 4.5, y = 26.85
b = SxySxx
=2
983.6 36 214.8 / 8204 36 / 8− ×
− = 17
42 = 0.405
OR b = 2
983.6 / 8 4.5 26.85204 / 8 4.5
− ×
− = 2.125
5.25 = 0.405
hence least squares regression line is: y − y = b(x − x ) y – 26.85 = 0.405(x – 4.5) ⇒ y = 0.405x + 25.03 ⇒
B1 for x and y used
(SOI) M1 for attempt at
gradient (b) A1 for 0.405 cao M1 indep for equation
of line A1FT for complete equation
5
(ii) x = 4 ⇒ predicted y = 0.405 × 4 + 25.03 = 26.65 Residual = 27.5 – 26.65 = 0.85
M1 for prediction A1FT for ± 0.85 B1FT for sign (+)
3
(iii) The new equation would be preferable, since the equation in part (i) is influenced by the unrepresentative point (4,27.5)
B1 E1
2
(iv)
H0: ρ = 0; H1: ρ > 0 where ρ represents the population correlation coefficient
Critical value at 5% level is 0.3783
Since 0.209 < 0.3783, there is not sufficient evidence to reject H0, i.e. there is not sufficient evidence to conclude that there is any correlation between cycling and swimming times.
B1 for H0 and H1
B1 for defining ρ
B1 for 0.3783
M1 for comparison leading to conclusion A1dep on cv for conclusion in words
5

in context (v) Underlying distribution must be bivariate normal.
The distribution of points on the scatter diagram should be approximately elliptical.
B1 E1
2
17 Question 4 (a) (i)
H0: μ = 166500; H1: μ > 166500 Where μ denotes the mean selling price in pounds of the population of houses on the large estate
B1 for both correct B1 for definition of μ
2
(ii) n = 6, Σx = 1018500, x = £169750
Test statistic = 169750 166500 3250579714200 / 6
−=
= 0.5606 5% level 1 tailed critical value of z = 1.645 0.5606 < 1.645 so not significant. There is insufficient evidence to reject H0 It is reasonable to conclude that houses on this estate are not more expensive than in the rest of the suburbs.
B1CAO M1 must include √6 A1FT B1 for 1.645 M1 for comparison
leading to a conclusion
A1 for conclusion in
words in context
6

(b) H0: no association between customer and drink types; H1: some association between customer and drink types;
Type of drink Observed Alcoholic Soft drinks
Row totals
Business 54 63 117
Tourist 95 41 136 Type of customer Local 71 76 147
Column totals 220 180 400
Type of drink Expected Alcoholic Soft drinks
Row totals
Business 64.35 52.65 117
Tourist 74.80 61.20 136 Type of customer Local 80.85 66.15 147
Column totals 220 180 400
Type of drink Chi squared contribution Alcoholic Soft drinks
Row totals
Business 1.665 2.035 3.699
Tourist 5.455 6.667 12.122 Type of customer Local 1.200 1.467 2.667 X 2 = 18.49 Refer to X2
2 Critical value at 5% level = 5.991 Result is significant There is some association between customer type and type of drink. NB if H0 H1 reversed, or ‘correlation’ mentioned, do not award first B1or final B1 or final E1
B1 M1 A1 for expected
values (to 2dp) M1 for valid attempt
at (O-E)2/E M1dep for summation A1CAO for X2
B1 for 2 deg of f B1 CAO for cv B1dep on cv E1
6 4
18

4767 Mark Scheme January 2006 Question 1 (i)
Faults are detected randomly and independently
Uniform (mean) rate of occurrence
B1 B1
2
(ii) (A) P(X = 0) = e−0.15
00.150!
= 0.8607
(B) P(X ≥ 2) = 1 – 0.8607 – e−0.1510.15
1!
= 1 – 0.8607 – 0.1291 = 0.0102
M1 for probability
calc. M0 for tables unless
interpolated A1 M1 A1
4
(iii) λ = 30 × 0.15 = 4.5
Using tables: P(X ≤ 3) = 0.3423
B1 for mean (SOI)
M1 attempt to find
P(X ≤ 3)
A1
3
(iv) Poisson distribution with λ = 10 × (0.15 + 0.05) = 2
P(X = 5) = e−252
5! = 0.0361 (3 s.f.)
or from tables = 0.9834 – 0.9473 = 0.0361
B1 for Poisson stated
B1 for λ = 2
M1 for calculation or use of tables A1 FT
4
(v)
Mean no. of items in 200 days = 200 × 0.2 = 40
Using Normal approx. to the Poisson,
X ~ N(40,40):
P(X ≥ 50) = P 49.5 4040
Z⎛ ⎞−>⎜ ⎟
⎝ ⎠
= P(Z > 1.502) = 1 - Φ(1.502) = 1 – 0.9334 = 0.0666 (3 s.f.)
B1 for Normal approx. (SOI)
B1 for both parameters
B1 for continuity corr. M1 for probability using correct tail A1 cao, (but FT wrong or omitted CC)
5
18

4767 Mark Scheme January 2006 Question 2 (i) (A)
X ~ N(42,32)
P(X > 50.0) = 50.0 42.0P3.0
Z −⎛ ⎞>⎜ ⎟⎝ ⎠
= P( Z > 2.667)
= 1 - Φ(2.667) = 1 – 0.9962 = 0.0038
M1 for standardizing M1 for prob. calc. with correct tail A1 NB answer given
3
(i) (B)
P( not positive) = 0.9962 P(At least one is out of 7 is positive) = 1 – 0.99627 = 1 – 0.9737 = 0.0263
B1 for use of 0.9962 in binomial expression M1 for correct method
A1 CAO
3
(i) (C)
If an innocent athlete is tested 7 times in a year there is a reasonable possibility (1 in 40 chance) of testing positive. Thus it is likely that a number of innocent athletes may come under suspicion and suffer a suspension so the penalty could be regarded as unfair. Or this is a necessary evil in the fight against performance enhancing drugs in sport.
E1 comment on their probability in (i) B E1 for sensible contextual conclusion consistent with first comment
2
(ii) (A)
B(1000, 0.0038)
B1 for B( , ) or Binomial B1 dep for both parameters
2
(ii) (B)
A suitable approximating distribution is Poisson(3.8)
P(at least 10 positive tests) = P(X ≥ 10) = 1 – P(X ≤ 9) = 1 – 0.9942 = 0.0058 NB Do not allow use of Normal approximation.
B1 for Poisson soi
B1FT dep for λ = 3.8
M1 for attempt to use
1 – P(X ≤ 9)
A1 FT
4
(iii) P( not testing positive) = 0.995 From tables z = Φ-1 ( 0.995 ) = 2.576
48.0 2.5762.0
h −=
h = 48.0 + 2.576 × 2.0 = 53.15
B1 for 0.995 seen (or implied by 2.576) B1 for 2.576 (FT their 0.995) M1 for equation in h and positive z-value A1 CAO
4
18

4767 Mark Scheme January 2006 Question 3 (i)
2
2
6 6 601 110 99( 1)s
drn n
Σ ×= − = −
×−
= 0.636 (to 3 s.f.) [ allow 0.64 to 2 s.f.]
M1 for ranking (allow all ranks reversed) M1 for d2 A1 CAO for Σd2
M1 for structure of rs
using their Σd2
A1 f.t. for |rs| < 1 NB No ranking scores zero
5
(ii)
H0: no association between x and y
H1: positive association between x and y
Looking for positive association (one-tail test):
Critical value at 5% level is 0.5636
Since 0.636 > 0.5636, there is sufficient evidence to reject H0, i.e. conclude that there appears to be positive association between temperature and nitrous oxide level.
B1 for H0
B1 for H1 NB H0 H1 not ito rho
B1 for ± 0.5636
(FT their H1)
M1 for comparison with c.v., provided |rs| < 1 A1 for conclusion in words f.t. their rs and sensible cv
5
(iii)
Underlying distribution must be bivariate normal. If the distribution is bivariate normal then the scatter diagram will have an elliptical shape. This scatter diagram is not elliptical and so a PMCC test would not be valid. (Allow comment indicating that the sample is too small to draw a firm conclusion on ellipticity and so on validity)
B1 CAO for bivariate normal B1 indep for elliptical shape E1 dep for conclusion
3
(iv) n=60, PMCC critical value is r = 0.2997
So the critical region is r ≥ 0.2997
B1 B1 FT their sensible
c.v.
2
(v)
Any three of the following: • Correlation does not imply causation; • There could be a third factor (causing the
correlation between temperature and ozone level); • the claim could be true; • increased ozone could cause higher temperatures.
E1 E1 E1
3
18
Rank x 1 5 4 7 6 8 10 3 9 2 Rank y 2 4 5 8 9 7 10 6 3 1
d -1 1 -1 -1 -3 1 0 -3 6 1 d2
1 1 1 1 9 1 0 9 36 1

4767 Mark Scheme January 2006 Question 4 (i) H0: no association between method of travel and type
of school; H1: some association between method of travel and type of school;..
B1 for both 1
(ii) Expected frequency = 120/200 × 70 = 42 Contribution = (21 – 42)2 / 42 = 10.5
M1 A1 M1 for valid attempt
at (O-E)2/E A1 FT their 42
provided O = 21 (at least 1 dp)
4
(iii) X 2 = 42.64 Refer to X2
2 Critical value at 5% level = 5.991 Result is significant There appears to be some association between method of travel and year group. NB if H0 H1 reversed, or ‘correlation’ mentioned, do not award first B1or final E1
B1 for 2 deg of f(seen) B1 CAO for cv B1 for significant (FT
their c.v. provided consistent with their d.o.f.
E1
4
(iv)
H0: μ = 18.3; H1: μ ≠ 18.3 Where μ denotes the mean travel time by car for the whole population.
Test statistic z = 22.4 18.3 4.11.7898.0 / 20
−=
= 2.292 10% level 2 tailed critical value of z is 1.645 2.292 > 1.645 so significant. There is evidence to reject H0 It is reasonable to conclude that the mean travel time by car is different from that by bus.
B1 for both correct B1 for definition of μ M1 (standardizing
sample mean) A1 for test statistic B1 for 1.645 M1 for comparison leading to a conclusion A1 for conclusion in words and context
7
(v) The test suggests that students who travel by bus get to school more quickly. This may be due to their journeys being over a shorter distance. It may be due to bus lanes allowing buses to avoid congestion. It is possible that the test result was incorrect (ie implication of a Type I error). More investigation is needed before any firm conclusion can be reached.
E1, E1 for any two
valid comments
2 18

4767 Mark Scheme January 2006 Question 4 chi squared calculations H0: no association between method of travel and type
of school; H1: some association between method of travel and type of school;
Type of school Row Observed Year 6 Year 11 totals
Bus 21 49 70 Car 65 15 80 Method
of travel Cycle/Walk 34 16 50 Column totals 120 80 200
Type of school Row
Expected Year 6 Year 11 totals Bus 42 28 70 Car 48 32 80 Method
of travel Cycle/Walk 30 20 50 Column totals 120 80 200
Type of school Row Chi Squared
Contribution Year 6 Year 11 totals Bus 10.50 15.75 26.25 Car 6.02 9.03 15.05 Method
of travel Cycle/Walk 0.53 0.80 1.33 Column totals 17.05 25.58 42.64

4767 Mark Scheme June 2006
(i)
P(X = 1) = 8 ¬ 0.11 ¬ 0.97 = 0.383
M1 for binomial probability P(X=1) A1 (at least 2sf) CAO
2
(ii)
λ = 30 ¬ 0.1 = 3
(A) P(X = 6) = e−363
6! = 0.0504(3 s.f.)
or from tables = 0.9665 – 0.9161 = 0.0504
(B) Using tables: P(X ≥ 8) = 1 – P(X ≤ 7)
= 1 – 0.9881 = 0.0119
B1 for mean SOI
M1 for calculation or use of tables to obtain P(X=6) A1 (at least 2sf) CAO
M1 for correct
probability calc’
A1 (at least 2sf) CAO
1
2
2
(iii) n is large and p is small B1, B1 Allow appropriate numerical ranges
2
(iv) μ = np = 120 ¬ 0.1 = 12 σ2 = npq = 120 ¬ 0.1 ¬ 0.9 = 10.8
B1 B1
2
(v)
P(X > 15.5) = P15.5 12
10.8Z⎛ ⎞−
>⎜ ⎟⎝ ⎠
= P(Z > 1.065) = 1 - Φ(1.065) = 1 – 0.8566
= 0.1434 NB Allow full marks for use of N(12,12) as an approximation to Poisson(12) leading to 1 - Φ(1.010) = 1 – 0.8438 = 0.1562
B1 for correct continuity correction. M1 for probability using correct tail A1 cao, (but FT wrong or omitted CC)
3
(vi)
From tables Φ-1 ( 0.99 ) = 2.326
0.5 12 2.32610.8
x + −≥
x = 11.5 + 2.326 × 10.8 ≥ 19.14 So 20 breakfasts should be carried NB Allow full marks for use of N(12,12) leading to x ≥ 11.5 + 2.326 × 12 = 19.56
B1 for 2.326 seen M1 for equation in x and positive z-value A1 CAO (condone 19.64) A1FT for rounding appropriately (i.e. round up if c.c. used o/w rounding should be to nearest integer)
4
18

4767 Mark Scheme June 2006
Question 2 (i)
X ~ N(49.7,1.62)
(A) P(X > 51.5) = 51.5 49.7P
1.6Z −⎛ ⎞>⎜ ⎟
⎝ ⎠
= P( Z > 1.125)
= 1 - Φ(1.125) = 1 – 0.8696 = 0.1304
(B) P(X < 48.0) = 48.0 49.7P
1.6Z −⎛ ⎞<⎜ ⎟
⎝ ⎠
= P( Z < -1.0625) = 1 - Φ(1.0625)
= 1 – 0.8560 = 0.1440
P(48.0 < X < 51.5) = 1 - 0.1304 - 0.1440 = 0.7256
M1 for standardizing
M1 for prob. calc.
A1 (at least 2 s.f.) M1 for appropriate
prob’ calc.
A1 (0.725 – 0.726)
5
(ii) P(one over 51.5, three between 48.0 and 51.5)
= 41
⎛ ⎞⎜ ⎟⎝ ⎠
¬ 0.7256 ¬ 0.27443 = 0.0600
M1 for coefficient M1 for 0.7256 ¬ 0.27443 A1 FT (at least 2 sf)
3 (iii)
From tables,
Φ-1 ( 0.60 ) = 0.2533, Φ-1 ( 0.30 ) = -0.5244
49.0 = μ + 0.2533 σ
47.5 = μ – 0.5244 σ
1.5 = 0.7777 σ
σ = 1.929, μ = 48.51
B1 for 0.2533 or 0.5244 seen M1 for at least one correct equation μ & σ M1 for attempt to solve two correct equations A1 CAO for both
4
(iv)
Where μ denotes the mean circumference of the entire population of organically fed 3-year-old boys. n = 10,
Test statistic Z = 50.45 49.7 0.75 1.482
0.50601.6 / 10−
= =
10% level 1 tailed critical value of z is 1.282 1.482 > 1.282 so significant. There is sufficient evidence to reject H0 and conclude that organically fed 3-year-old boys have a higher mean head circumference.
E1 M1 A1(at least 3sf) B1 for 1.282 M1 for comparison
leading to a conclusion
A1 for conclusion in context
6 18

4767 Mark Scheme June 2006
Question 3 (i) EITHER:
Sxy = 1xy x yn
Σ − Σ Σ = 6235575 –1
10× 4715 × 13175
= 23562.5
Sxx = ( )22 1x xn
Σ − Σ = 2237725 – 1
10× 47152 =
14602.5
Syy = ( )22 1y yn
Σ − Σ = 17455825 – 1
10× 131752 =
97762.5
r = S
S Sxy
xx yy
= 23562.5
14602.5 97762.5× = 0.624
OR:
cov (x,y) = xy
x yn
−∑ = 6235575/10 – 471.5×1317.5
= 2356.25
rmsd(x) = xxSn
= √(14602.5/10) =√1460.25 = 38.21
rmsd(y) = yySn
= √(97762.5/10) =√9776.25 = 98.87
r = cov(x,y)( ) ( )rmsd x rmsd y
= 2356.25
38.21 98.87× = 0.624
M1 for method for Sxy M1 for method for at least one of Sxx or Syy A1 for at least one of Sxy , Sxx or Syy correct M1 for structure of r A1 (0.62 to 0.63) M1 for method for cov (x,y) M1 for method for at least one msd A1 for at least one of Sxy , Sxx or Syy correct M1 for structure of r A1 (0.62 to 0.63)
5
(ii) H0: ρ = 0 H1: ρ ≠ 0 (two-tailed test)
where ρ is the population correlation coefficient
For n = 10, 5% critical value = 0.6319 Since 0.624 < 0.6319 we cannot reject H0: There is not sufficient evidence at the 5% level to suggest that there is any correlation between length and circumference.
B1 for H0, H1 in symbols B1 for defining ρ
B1FT for critical value M1 for sensible comparison leading to a conclusion A1 FT for result B1 FT for conclusion
in context
6
(iii) (A) This is the probability of rejecting H0 when it is in fact true.
(B) Advantage of 1% level – less likely to reject H0 when it is true.
Disadvantage of 1% level – less likely to accept H1 when H0 is false.
B1 for ‘P(reject H0)’ B1 for ‘when true’ B1, B1 Accept
answers in context
2
2

4767 Mark Scheme June 2006
(iv) The student’s approach is not valid.
If a statistical procedure is repeated with a new sample, we should not simply ignore one of the two outcomes. The student could combine the two sets of data into a single set of twenty measurements.
E1 E1 – allow suitable
alternatives. E1 for combining
samples.
3 18

4767 Mark Scheme June 2006
Question 4
(i)
H0: no association between musical preference and age; H1: some association between musical preference and age;
Musical preference Observed Pop Classical Jazz
Row totals
Under 25 57 15 12 84
25 – 50 43 21 21 85 Age group
Over 50 22 32 27 81 Column totals 122 68 60 250
Musical preference Expected
Pop Classical Jazz Row
totals Under 25 40.992 22.848 20.160 84
25 – 50 41.480 23.120 20.400 85 Age group
Over 50 39.528 22.032 19.440 81 Column totals 122 68 60 250
Musical preference Contributions
Pop Classical Jazz
Under 25 6.25 2.70 3.30 25 – 50 0.06 0.19 0.02
Age group
Over 50 7.77 4.51 2.94
X 2 = 27.74 Refer to χ4
2 Critical value at 5% level = 9.488 Result is significant There is some association between age group and musical preference. NB if H0 H1 reversed, or ‘correlation’ mentioned, do not award first B1or final E1
B1
M1 A2 for expected
values (at least 1
dp) (allow A1 for at
least one row or
column correct)
M1 for valid attempt at
(O-E)2/E A1 for all correct M1dep for summation A1 for X2 (27.7 – 27.8) B1 for 4 deg of f
B1 CAO for cv B1FT E1 (conclusion in
context)
1 7 4

4767 Mark Scheme June 2006
(ii) The values of 6.25 and 7.77 show that under 25’s have a strong positive association with pop whereas over 50’s have a strong negative association with pop. The values of 4.51 and 2.94 show that over 50’s have a reasonably strong positive association with both classical and jazz. The values of 2.70 and 3.30 show that under 25’s have a reasonably strong negative associations with both classical and jazz. The 25-50 group’s preferences differ very little from the overall preferences.
B1, B1 for specific reference to a value from the table of contributions followed by an appropriate comment B1, B1 (as above for
second value ) B1, B1 (as above for
third value)
6
18

4767 Mark Scheme Jan 2007
70
Question 1 (i)
t = 112.8, v = 0.6
b = SvtSvv
=2
405.2 3 564 / 52.20 3 / 5
− ×
− =
66.80.4
= 167
OR b = 2
405.2 / 5 0.6 112.82.20 / 5 0.6
− ×
− =
13.360.08
= 167
hence least squares regression line is: t − t = b(v − v ) ⇒ t – 112.8 = 167(v – 0.6) ⇒ t = 167v + 12.6
B1 for t and v used (SOI) M1 for attempt at gradient
(b) A1 for 167 CAO M1 for equation of line A1 FT
5 (ii)
(A) For 0.5 litres, predicted time = = 167 × 0.5 + 12.6 = 96.1 seconds
(B) For 1.5 litres, predicted time = = 167 ×1.5 + 12.6 = 263.1 seconds
Any valid relevant comment relating to each prediction such as eg: ‘First prediction is fairly reliable as it is interpolation and the data is a good fit’ ‘Second prediction is less certain as it is an extrapolation’
M1 for at least one prediction attempted A1 for both answers (FT their equation if b>0) NB for reading predictions off the graph only award A1 if accurate to nearest whole number E1 (first prediction) E1 (second prediction)
4
(iii) The v-coefficient is the number of additional seconds required for each extra litre of water
E1 for indication of rate wrt v
E1 dep for specifying ito units
2
(iv) v = 0.8 ⇒ predicted t = 167 × 0.8 + 12.6 = 146.2 Residual = 156 – 146.2 = 9.8 v = 1.0 ⇒ predicted t = 167 × 1.0 + 12.6 = 179.6 Residual = 172 – 179.6 = –7.6
M1 for either prediction M1 for either subtraction A1 CAO for absolute value
of both residuals B1 for both signs correct.
4
(v) The residuals can be measured by finding the vertical distance between the plotted point and the regression line. The sign will be negative if the point is below the regression line (and positive if above).
E1 for distance E1 for vertical E1 for sign
3 18

4767 Mark Scheme Jan 2007
71
Question 2 (a) (i)
X ~ N(28,16)
P(24 < X < 33) = 24 28 33 28P
4 4Z− −⎛ ⎞< <⎜ ⎟
⎝ ⎠
= P(–1 < Z < 1. 25)
= Φ(1.25) – (1 – Φ(1)) = 0.8944 – (1 –0.8413) = 0.8944 – 0.1587
= 0.7357 (4 s.f.) or 0.736 (to 3 s.f.)
M1 for standardizing
A1 for 1. 25 and -1
M1 for prob. with tables and correct structure A1 CAO (min 3 s.f., to include use of difference column)
4 (ii) 25000 ×0.7357 ×0.1 = £1839
25000 ×0.1587 ×0.05 = £198
Total = £1839 + £198 = £2037
M1 for either product, (with or without price) M1 for sum of both products with price A1 CAO awrt £2040
3 (iii)
X ~ N(k, 16)
From tables Φ-1 ( 0.95 ) = 1.645
33 1.6454−
=k
33 – k = 1.645 × 4
k = 33 – 6.58
k = 26.42 (4 s.f.) or 26.4 (to 3 s.f.)
B1 for ±1.645 seen M1 for correct equation in k with positive z-value A1 CAO
3
(b) (i)
H0: μ = 0.155; H1: μ > 0.155 Where μ denotes the mean weight in kilograms of the population of onions of the new variety
B1 for both correct & ito μ B1 for definition of μ
2
(ii)
Mean weight = 4.77/25 = 0.1908
Test statistic = 01414.00358.0
25005.0155.01908.0
=−
= 2.531 1% level 1-tailed critical value of z = 2.326 2.531 > 2.236 so significant. There is sufficient evidence to reject H0 It is reasonable to conclude that the new variety has a higher mean weight.
B1 M1 must include √25 A1FT B1 for 2.326 M1 For sensible comparison leading to a conclusion A1 for correct, consistent conclusion in words and in context
6 18

4767 Mark Scheme Jan 2007
72
Question 3 (i) Mean =
xfn
Σ =
0 20 12 380
+ + + =
3580
(= 0.4375)
B1 for mean NB answer given
1
(ii)
Variance = 0.69072 = 0.4771
So Poisson distribution may be appropriate, since mean is close to variance
B1 for variance
E1dep on squaring s
2
(iii) P(X = 1) = e−0.4375
10.43751!
= 0.282 (3 s.f.)
Either: Thus the expected number of 1’s is 22.6 which is reasonably close to the observed value of 20. Or: This probability compares reasonably well with the relative frequency 0.25
M1 for probability calc. M0 for tables unless interpolated (0.2813) A1 B1 for expectation of 22.6 or r.f. of 0.25 E1 for comparison
4
(iv) λ = 8×0.4375 = 3.5
Using tables: P(X ≥ 12) = 1 – P(X ≤ 11)
= 1 – 0.9997 = 0.0003
B1 for mean (SOI)
M1 for using tables to find 1 – P(X ≤ 11) A1 FT
3
(v) The probability of at least 12 free repairs is very low, so the model is not appropriate. This is probably because the mean number of free repairs in the launderette will be much higher since the machines will get much more use than usual.
E1 for ‘at least 12’ E1 for very low E1
3 (vi) (A) λ = 0.4375 + 0.15 = 0.5875
P(X = 3) = e−0.587530.5875
3!
= 0.0188 (3 s.f.)
(B) P(Drier needs 1) = e−0.1510.15
1! = 0.129
P(Each needs just 1) = 0.282 ×0.129
= 0.036
B1 for mean (SOI)
M1 A1 B1 for 0.129 (SOI) B1FT for 0.036
3
2 18

4767 Mark Scheme Jan 2007
73
Question 4 (i) H0: no association between ambition and home
location; H1: some association between ambition and home location; X 2 = 3.716 Refer to χ1
2 Critical value at 5% level = 3.841 Result is not significant There is insufficient evidence to conclude that there is any association between home location and ambition. NB if H0 H1 reversed, or ‘correlation’ mentioned, do not award first B1or final B1 or final E1
B1 in context M1 A1 for attempt at
expected values M1 for valid attempt at (O-
E)2/E A1CAO for X2 B1 for 1 dof SOI B1 CAO for cv B1 dep on attempt at cv E1 conclusion in context
1 4 4
(ii) (A)
Expected Country, Results = 249 * 156 / 480 = 80.93 Expected Country, Other = 231 * 156 / 480 = 75.08
B1 B1
2
(B) Refer to χ22
Critical value at 5% level = 5.991 Result is significant There is evidence to conclude that there is association between home location and ambition.
B1 for 2 dof SOI B1 CAO for cv E1 for conclusion in
context
3
(C) ‘Country’ students are much less likely than city or town to have ‘Results’ as their main ambition. Low contributions show that city and town students do not appear to differ markedly in their ambitions.
E1 for correct obsn for ‘Country’
E1 for additional correct observation (must refer to contributions)
2
(iii) Conclusion in (i) is valid if only categorizing home location into city and non-city. However if non-city is subdivided into town and country this additional subdivision gives the data more precision and allows the relationship in part (ii) (C) to be revealed.
E1 E1
2
18
Home location Observed City Non-city
Good results 102 147 Ambition Other 75 156
Home location
Expected City Non-city
Good results 91.82 157.18 Ambition
Other 85.18 145.82
Home location Contribution to the test statistic City Non-city
Good results 1.129 0.659 Ambition
Other 1.217 0.711

Question 1 (i)
X ~ N(11,32)
P(X < 10) = 10 11P
3−⎛ ⎞<⎜ ⎟
⎝ ⎠Z
= P( Z < –0.333)
= Φ(–0.333) = 1 – Φ(0.333) = 1 – 0.6304 = 0.3696
M1 for standardizing
M1 for use of tables with their z-value M1 dep for correct tail A1CAO (must include use of differences)
4
(ii) P(3 of 8 less than ten)
= 83⎛ ⎞⎜ ⎟⎝ ⎠
× 0.36963 × 0.63045 = 0.2815
M1 for coefficient M1 for 0.36963 × 0.63045 A1 FT (min 2sf)
3
(iii) μ = np = 100 × 0.3696 = 36.96 σ2 = npq = 100 × 0.3696 × 0.6304 = 23.30 Y ~ N(36.96,23.30)
P(Y ≥ 50) = P49.5 36.96
23.30−⎛ ⎞>⎜ ⎟
⎝ ⎠Z
= P(Z > 2.598) = 1 – Φ(2.598) = 1 – 0.9953
= 0.0047
M1 for Normal approximation with correct (FT) parameters B1 for continuity corr. M1 for standardizing and using correct tail A1 CAO (FT 50.5 or omitted CC)
4
(iv)
H0: μ = 11; H1: μ > 11 Where μ denotes the mean time taken by the new hairdresser
B1 for H0, as seen. B1 for H1, as seen. B1 for definition of μ
3
(v) Test statistic =
12.34 11 1.340.63/ 25
−=
= 2.23 5% level 1 tailed critical value of z = 1.645 2.23 > 1.645, so significant. There is sufficient evidence to reject H0 It is reasonable to conclude that the new hairdresser does take longer on average than other staff.
M1 must include √25 A1 (FT their μ)
B1 for 1.645 M1 for sensible comparison
leading to a conclusion A1 for conclusion in words
in context (FT their μ)
5
19

Question 2 (i)
x 2.61 2.73 2.87 2.96 3.05 3.14 3.17 3.24 3.76 4.1
y 3.2 2.6 3.5 3.1 2.8 2.7 3.4 3.3 4.4 4.1
Rank x 10 9 8 7 6 5 4 3 2 1 Rank y 6 10 3 7 8 9 4 5 1 2
d 4 -1 5 0 -2 -4 0 -2 1 -1 d2 16 1 25 0 4 16 0 4 1 1
2
2
6 61 1( 1) 10 9Σ ×
= − = −− ×s
drn n
689
= 0.588 (to 3 s.f.) [ allow 0.59 to 2 s.f.]
M1 for ranking (allow all ranks reversed) M1 for d2 A1 for Σd2 = 68
M1 for method for rs
A1 f.t. for |rs| < 1 NB No ranking scores zero
5
(ii)
H0: no association between x and y
H1: positive association between x and y
Looking for positive association (one–tail test): critical value at 5% level is 0.5636
Since 0.588> 0.5636, there is sufficient evidence to reject H0, i.e. conclude that there is positive association between true weight x and estimated weight y.
B1 for H0, in context.
B1 for H1, in context.
NB H0 H1 not ito ρB1 for ± 0.5636
M1 for sensible comparison with c.v., provided |rs| < 1 A1 for conclusion in words & in context, f.t. their rs and sensible cv
5
(iii) Σx = 31.63, Σy = 33.1, Σx2 = 101.92, Σy2 = 112.61, Σxy = 106.51.
Sxy = 1
Σ − Σ Σxy xn
y = 106.51 – 110× 31.63 × 33.1
= 1.8147
Sxx = ( )22 1x xn
Σ − Σ = 101.92 – 110× 31.632 = 1.8743
Syy = ( )22 1yn
Σ − Σy = 112.61 – 110× 33.12 = 3.049
r = S
S Sxy
xx yy
= 1.8147
1.8743 3.049× = 0.759
M1 for method for Sxy M1 for method for at least one of Sxx or Syy A1 for at least one of Sxy, Sxx, Syy correct. M1 for structure of r A1 (awrt 0.76)
5
(iv) Use of the PMCC is better since it takes into account not just the ranking but the actual value of the weights.Thus it has more information than Spearman’s and will therefore provide a more discriminatory test. Critical value for rho = 0.5494 PMCC is very highly significant whereas Spearman’s is only just significant.
E1 for has values, not just ranks E1 for contains more information Allow alternatives. B1 for a cv E1 dep
4
19

Question 3 (i)
(A) P(X = 1) = 0.1712 – 0.0408 = 0.1304
OR = e-3.213.2
1! = 0.1304
(B) P(X ≥ 6) = 1 – P(X ≤ 5) = 1 – 0.8946
= 0.1054
M1 for tables
A1 (2 s.f. WWW) M1 A1
4
(ii) (A) λ = 3.2 ÷ 5 = 0.64
P(X =1) = e-0.6410.64
1! = 0.3375
(B) P(exactly one in each of 5 mins) = 0.33755 = 0.004379
B1 for mean (SOI)
M1 for probability
A1 B1 (FT to at least 2 s.f.)
4
(iii)
Mean no. of calls in 1 hour = 12 × 3.2 = 38.4
Using Normal approx. to the Poisson,
X ~ N(38.4, 38.4)
P(X ≤ 45.5) = P45.5 38.4
38.4−⎛ ⎞≤⎜ ⎟
⎝ ⎠Z
= P(Z ≤ 1.146) = Φ(1.146) = 0.874 (3 s.f.)
B1 for Normal approx. with correct parameters (SOI)
B1 for continuity corr. M1 for probability using correct tail A1 CAO, (but FT 44.5 or omitted CC)
4
(iv)
(A) Suitable arguments for/against each assumption: (B) Suitable arguments for/against each assumption:
E1, E1 E1, E1
4
16

Question 4 (i) H0: no association between age group and sex;
H1: some association between age group and sex;
X 2 = 11.84 Refer to Ξ2
2 Critical value at 5% level = 5.991 Result is significant There is some association between age group and sex . NB if H0 H1 reversed, or ‘correlation’ mentioned, do not award first B1or final E1
Sex Expected Male Female
Row totals
Under 40 81.84 42.16 124
40 – 49 73.92 38.08 112 Age group
50 and over 42.24 21.76 64
Column totals 198 102 300
Sex
Contribution to test statistic
Male Female Under 40 1.713 3.325
40 – 49 0.059 0.114 Age group
50 and over 2.255 4.378
B1 (in context) M1 A1 for expected
values (to 2dp) M1 for valid attempt at
(O–E)2/E M1dep for summation A1CAO for X2
B1 for 2 deg of f B1 CAO for cv B1 dep on their cv & X2
E1 (conclusion in context)
6 4
(ii) The analysis suggests that there are more females in the under 40 age group and less in the 50 and over age group than would be expected if there were no association. The reverse is true for males. Thus these data do support the suggestion.
E1 E1 E1dep (on at least one of the previous E1s)
3
(iii) Binomial(300, 0.03) soi n = 300, p = 0.03 so EITHER: use Poisson approximation to Binomial with λ = np = 9 Using tables: P(X ≥ 12) = 1 – P(X ≤ 11)
= 1 – 0.8030 = 0.197
OR: use Normal approximation N(9, 8.73)
P(X > 11.5) = P11.5 9
8.73Z −⎛ ⎞>⎜ ⎟⎝ ⎠
= P(Z > 0.846)) = 1 – 0.8012 = 0.199
B1 CAO EITHER: B1 for Poisson B1dep for Poisson(9) M1 for using tables to find 1 – P(X ≤ 11) A1 OR: B1 for Normal B1dep for parameters M1 for using tables with correct tail (cc not required for M1) A1
5
18

4767 Mark Scheme January 2008
50
4767 Statistics 2
Question 1 (i)
x is independent, y is dependent since the values of x are chosen by the student but the values of y are dependent on x
B1 E1 dep E1 dep
3
(ii) x = 2.5, y = 80.63
b = SxxSxy
= 12/3090
12/6.967303.25302−
×−=
153.111
=7.42
OR b = 250.212/9063.8050.212/3.2530
−×−
= 25.1275.9
=7.42
Hence least squares regression line is: y - y = b(x - x ) ⇒ y – 80.63 =7.42(x – 2.5) ⇒ y = 7.42x + 62.08
B1 for x and y used (SOI) M1 for attempt at gradient (b) A1 for 7.42 cao M1 for equation of line A1 FT (b>0) for complete equation
5
(iii) (A) For x = 1.2, predicted growth = 7.42 × 1.2 + 62.08 = 71.0
(B) For x = 4.3, predicted growth = 7.42 × 4.3 + 62.08 = 94.0
Valid relevant comments relating to the predictions such as : Comment re interpolation/extrapolation Comment relating to the fact that x = 4.3 is only just beyond the existing data. Comment relating to size of residuals near each predicted value (need not use word ‘residual’)
M1 for at least one prediction attempted. A1 for both answers (FT their equation if b>0) E1 (first comment) E1 (second comment)
4
(iv) x = 3 ⇒ predicted y = 7.42 × 3 + 62.08 = 84.3 Residual = 80 − 84.3 = −4.3
M1 for prediction M1 for subtraction A1 FT (b>0)
3
(v) This point is a long way from the regression line. The line may be valid for the range used in the experiment but then the relationship may break down for higher concentrations, or the relationship may be non linear.
E1 E1 for valid in range E1 for either ‘may break down’ or ‘could be non linear’ or other relevant
comment
3
18

4767 Mark Scheme January 2008
51
Question 2 (i) Binomial (94,0.1) B1 for binomial
B1 dep for parameters 2
(ii) n is large and p is small B1, B1 Allow appropriate numerical ranges
2
(iii) λ = 94 × 0.1 = 9.4
(A) P(X = 4) = e−9.4 !44.9 4
= 0.0269 (3 s.f.)
or from tables = 0.0429 − 0.0160 = 0.0269 cao (B) Using tables: P(X ≥ 4) = 1 − P(X ≤ 3)
= 1 − 0.0160 = 0.9840 cao
B1 for mean M1 for calculation or use of tables A1 M1 for attempt to find P(X ≥ 4) A1 cao
5
(iv) P(sufficient rooms throughout August) = 0.984031 = 0.6065
M1 A1 FT
2
(v) (A) 31 × 94 = 2914 Binomial (2914,0.1) (B)Use Normal approx with µ = np = 2914 × 0.1 = 291.4 σ2 = npq = 2914 × 0.1 × 0.9 = 262.26
P(X ≤ 300.5) = P ⎟⎟⎠
⎞⎜⎜⎝
⎛ −≤
26.2624.2915.300Z
= P(Z ≤ 0.5619) = Φ(0.5619) = 0.7130
B1 for binomial B1 dep, for parameters B1 B1 B1 for continuity corr. M1 for probability using correct tail A1 cao, (but FT wrong or omitted CC)
2 5
18

4767 Mark Scheme January 2008
52
Question 3 (i) X ~ N(56,6.52)
P(52.5 < X < 57.5) = P ⎟⎠⎞
⎜⎝⎛ −
<<−
5.6565.57
5.6565.52 Z
= P(−0.538 < Z < 0.231) = Φ(0.231) − (1 − Φ(0.538)) = 0.5914 − (1 − 0.7046) = 0.5914 − 0.2954 = 0.2960 (4 s.f.) or 0.296 (to 3 s.f.)
M1 for standardizing A1 for -0.538 and 0.231 M1 for prob. with tables and correct structure A1 CAO (min 3 s.f., to include use of difference column)
4 (ii)
P(5-year-old < 62) = P ⎟⎠⎞
⎜⎝⎛ −
<5.65662Z
= Φ(0.923) = 0.8220
P(young adult < 62) = P ⎟⎠⎞
⎜⎝⎛ −
<10
6862Z
= Φ(−0.6) = 1 − 0.7257 = 0.2743 P(One over, one under) = 0.8220 × 0.7257 + 0.1780 × 0.2743 = 0.645
B1 for 0.8220 or 0.1780 B1 for 0.2743 or 0.7257 M1 for either product M1 for sum of both products A1 CAO
5
(iii)
0.00
0.01
0.02
0.03
0.04
0.05
0.06
0.07
30 35 40 45 50 55 60 65 70 75 80 85 90 95 100
G1 for shape G1 for means, shown explicitly or by scale G1 for lower max height in young adults G1 for greater variance in young adults
4
(iv)
Y ~ N(82,σ2) From tables Φ−1(0.88) = 1.175
σ8262 −
= −1.175
−20 = −1.175 σ σ = 17.0
B1 for 1.175 seen M1 for equation in σ with z-value M1 for correct handling of LH tail A1 cao
4
17

4767 Mark Scheme January 2008
53
Question 4 (i)
H0: no association between sex and subject; H1: some association between sex and subject;
OBS Maths
English Both Neither Row sum
Male 38 19 6 32 95 Female 42 55 9 49 155 Col sum
80 74 15 81 250
EXP Maths English Both Neither Row
sum Male 30.40 28.12 5.70 30.78 95 Female 49.60 45.88 9.30 50.22 155 Col sum
80 74 15 81 250
CONT Maths English Both Neither Male 1.900 2.958 0.016 0.048 Female 1.165 1.813 0.010 0.030
X 2 = 7.94 Refer to 2
3χ Critical value at 5% level = 7.815 Result is significant There is evidence to suggest that there is some association between sex and subject choice. NB if H0 H1 reversed, or ‘correlation’ mentioned, do not award first B1 or final E1
B1 M1 A2 for expected values (allow A1 for at least one row or column correct)
M1 for valid attempt at (O-E)2/E A1
NB These M1 A1 marks cannot be implied by a correct final value of X 2
M1 for summation A1 cao for X 2 B1 for 3 deg of f B1 CAO for cv B1 E1
1 7 4
(ii) H0: µ = 67.4; H1: µ >67.4 Where µ denotes the mean score of the population of students taught with the new method.
Test statistic = 12/9.8
4.673.68 − =
57.29.0
= 0.35 10% level 1 tailed critical value of z = 1.282 0.35 < 1.282 so not significant. There is insufficient evidence to reject H0 There is insufficient evidence to conclude that the mean score is increased by the new teaching method.
B1 for both correct B1 for definition of µ M1 A1 cao B1 for 1.282 M1 for comparison A1 for conclusion in words and in context
7 19

4767 Mark Scheme June 2008
4767 Statistics 2 Question 1 (i) EITHER:
Sxy = 1xy xn
Σ − Σ Σy = 880.1 –148
× 781.3 × 57.8
= –60.72
Sxx = ( )22 1x xn
Σ − Σ = 14055 – 148
× 781.32 = 1337.7
Syy = ( )22 1yn
Σ − Σy = 106.3 – 148
× 57.82 = 36.70
r = S
S Sxy
xx yy
= 60.72
1337.7 36.70−
× = – 0.274
OR:
cov (x,y) = xy
x yn
−∑ = 880.1/48 – 16.28×1.204
= –1.265
rmsd(x) = xxSn
= √ (1337.7/48) =√ 27.87 = 5.279
rmsd(y) = yySn
= √ (36.70/48) =√ 0.7646 = 0.8744
r = cov(x,y)( ) ( )rmsd x rmsd y
= 1.265
5.279 0.8744−
× = – 0.274
M1 for method for Sxy M1 for method for at least one of Sxx or Syy A1 for at least one of Sxy, Sxx, Syy. correct M1 for structure of r A1 CAO (–0.27 to –0.28) M1 for method for cov (x,y) M1 for method for at least one msd A1 for at least one of cov/msd. correct M1 for structure of r A1 CAO (–0.27 to –0.28)
5
(ii) H0: ρ = 0 H1: ρ < 0 (one-tailed test)
where ρ is the population correlation coefficient
For n = 48, 5% critical value = 0.2403 Since | – 0.274 | > 0.2403 we can reject H0: There is sufficient evidence at the 5% level to suggest that there is negative correlation between education spending and population growth.
B1 for H0, H1 in symbols
B1 for defining ρ
B1FT for critical value M1 for sensible comparison leading to a conclusion A1 for result (FT r<0) E1 FT for conclusion in
words
6
(iii) Underlying distribution must be bivariate Normal. If the distribution is bivariate Normal then the scatter diagram will have an elliptical shape.
B1 CAO for bivariate Normal B1 indep for elliptical shape
2
(iv) • Correlation does not imply causation • There could be a third factor • increased growth could cause lower spending. Allow any sensible alternatives, including example of a possible third factor.
E1 E1 E1
3
(v)
Advantage – less effort or cost Disadvantage – the test is less sensitive (ie is less likely to detect any correlation which may exist)
E1 E1
2
18
67

4767 Mark Scheme June 2008
Question 2 (i) (A) P(X = 2) = e−0.37
20.372!
= 0.0473
(B) P(X > 2)
= 1 – (e−0.3720.37
2! + e−0.37
10.371!
+ e−0.3700.37
0!)
= 1 – (0.0473 + 0.2556 + 0.6907) = 0.0064
M1
A1 (2 s.f.) M1 for P(X = 1) and P(X = 0) M1 for complete method A1 NB Answer given
5
(ii) P(At most one day more than 2)
= × 0.993629 × 0.0064 + 0.993630 = 301
⎛ ⎞⎜ ⎟⎝ ⎠
= 0.1594 + 0.8248 = 0.9842
M1 for coefficient M1 for 0.993629 × 0.0064 M1 for 0.993630 A1 CAO (min 2sf)
4
(iii) λ = 0.37 ×10 = 3.7
P(X > 8) = 1 – 0.9863
= 0.0137
B1 for mean (SOI)
M1 for probability
A1 CAO
3
(iv)
Mean no. per 1000ml = 200 × 0.37 = 74 Using Normal approx. to the Poisson,
X ~ N(74, 74)
P(X > 90) = P90.5 74
74−⎛ ⎞>⎜ ⎟
⎝ ⎠Z
= P(Z >1.918) = 1 – Φ(1.918) = 1 – 0.9724 = 0.0276
B1 for Normal approx. with correct parameters (SOI)
B1 for continuity corr. M1 for probability using correct tail A1 CAO (min 2 s.f.), (but FT wrong or omitted CC)
4
(v)
P(questionable) = 0.0064 × 0.0137 ×0.0276 = 2.42 × 10⁻⁶
M1
A1 CAO
2 18
68

4767 Mark Scheme June 2008
Question 3 (i)
X ~ N(27500,40002)
P(X >25000) = 25000 27500P
4000−⎛ >⎜ ⎟
⎝ ⎠Z ⎞
= P( Z > –0.625)
= Φ(0.625) = 0.7340 (3 s.f.)
M1 for standardising
A1 for -0.625 M1 dep for correct tail A1CAO (must include use of differences)
4
(ii) P(7 of 10 last more than 25000)
= × 0.73407 × 0.26603 = 0.2592 107
⎛ ⎞⎜ ⎟⎝ ⎠
M1 for coefficient M1 for 0.73407 × 0.26603 A1 FT (min 2sf)
3
(iii) From tables Φ-1 ( 0.99 ) = 2.326
27500 2.3264000
−= −
k
x = 27500 – 2.326 × 4000 = 18200
B1 for 2.326 seen M1 for equation in k and negative z-value A1 CAO for awrt 18200
3
(iv)
H0: μ = 27500; H1: μ > 27500 Where μ denotes the mean lifetime of the new tyres.
B1 for use of 27500 B1 for both correct B1 for definition of μ
3
(v) Test statistic =
28630 27500 11301032.84000 / 15
−=
= 1.094 5% level 1 tailed critical value of z = 1.645 1.094 < 1.645 so not significant. There is not sufficient evidence to reject H0 There is insufficient evidence to conclude that the new tyres last longer.
M1 must include √ 15 A1 FT B1 for 1.645 M1 dep for a sensible
comparison leading to a conclusion
A1 for conclusion in words
in context
5
18
69

4767 Mark Scheme June 2008
70
Question 4 (i) H0: no association between location and species.
H1: some association between location and species. B1 for both
1
(ii) Expected frequency = 38/160 × 42 = 9.975 Contribution = (3 – 9.975)2 / 9.975 = 4.8773
M1 A1 M1 for valid attempt at (O-E)2/E A1 NB Answer given
4
(iii) Refer to 2
4χCritical value at 5% level = 9.488 Test statistic X 2 = 32.85 Result is significant There appears to be some association between location and species NB if H0 H1 reversed, or ‘correlation’ mentioned, do not award first B1or final E1
B1 for 4 deg of f(seen) B1 CAO for cv M1 Sensible comparison,
using 32.85, leading to a conclusion
A1 for correct conclusion (FT their c.v.)
E1 conclusion in context
5
(iv)
• Limpets appear to be distributed as expected
throughout all locations. • Mussels are much more frequent in exposed
locations and much less in pools than expected.
• Other shellfish are less frequent in exposed locations and more frequent in pools than expected.
E1 E1, E1 E1, E1
5
(v) 24 32 16 0.084953 65 42
× × =
M1 for one fraction M1 for product of all 3 A1 CAO
3
18

4767 Mark Scheme January 2009
54
4767 Statistics 2
Question 1 (i)
x 18 43 52 94 98 206 784 1530y 1.15 0.97 1.26 1.35 1.28 1.42 1.32 1.64
Rank x 1 2 3 4 5 6 7 8
Rank y 2 1 3 6 4 7 5 8
d -1 1 0 -2 1 -1 2 0
d2 1 1 0 4 1 1 4 0
2
2
6 6 121 1( 1) 8 63s
drn n
Σ ×= − = −
− ×
= 0.857 (to 3 s.f.) [ allow 0.86 to 2 s.f.]
M1 for attempt at ranking (allow all ranks reversed) M1 for d2 A1 for Σd2 = 12 M1 for method for rs
A1 f.t. for |rs| < 1 NB No ranking scores zero
5
(ii)
H0: no association between X and Y in the population
H1: some association between X and Y in the population
Two tail test critical value at 5% level is 0.7381
Since 0.857> 0. 7381, there is sufficient evidence to reject H0, i.e. conclude that the evidence suggests that there is association between population size X and average walking speed Y.
B1 for H0
B1 for H1
B1 for population SOI
NB H0 H1 not ito ρ B1 for ± 0. 7381
M1 for sensible comparison with c.v., provided |rs| < 1 A1 for conclusion in words f.t. their rs and sensible cv
6
(iii)
t = 45, w = 2.2367
b = StwStt
=2
584.6 270 13.42 / 613900 270 / 6
− ×
− =
17503.19−
= -0.011
OR b = 2
584.6 / 6 45 2.236713900 / 6 45
− ×
− =
3.218291.6667−
= -0.011
hence least squares regression line is:
73.2011.0
)45(011.02367.2)(
+−=⇒−−=−⇒
−=−
twtw
ttbww
B1 for t and w used
(SOI) M1 for attempt at
gradient (b) A1 CAO for -0.011 M1 for equation of line A1 FT for complete equation
5

4767 Mark Scheme January 2009
55
(iv)
(A) For t = 80, predicted speed = -0.011 × 80 + 2.73 = 1.85
(B) The relationship relates to adults, but a ten year old will not be fully grown so may walk more slowly.
NB Allow E1 for comment about extrapolation not in context
M1 A1 FT provided b < 0 E1 extrapolation o.e. E1 sensible contextual comment
4
TOTAL 20 Question 2 (i)
Binomial(5000,0.0001)
B1 for binomial B1 dep, for parameters
2
(ii) n is large and p is small
λ = 5000 × 0.0001 = 0.5
B1, B1 (Allow appropriate numerical ranges) B1
3
(iii)
P(X ≥ 1) = 1 – e�00.5
0! = 1 – 0.6065 = 0.3935
or from tables = 1 – 0.6065 = 0.3935
M1 for correct calculation or correct use of tables A1
2
(iv) P(9 of 20 contain at least one)
= 209
⎛ ⎞⎜ ⎟⎝ ⎠
× 0.39359 × 0.606511
= 0.1552
M1 for coefficient M1 for p9 × (1 – p) 11, p from part (iii) A1
3
(v) Expected number = 20 × 0.3935 = 7.87 M1 A1 FT 2 (vi)
Mean = xfn
Σ =
7 420+
=1120
= 0.55
Variance = ( )2211
fx nxn
Σ −−
= ( )21 15 20 0.5519
− × = 0.471
B1 for mean
M1 for calculation
A1 CAO
3
(vii) Yes, since the mean is close to the variance,
and also as the expected frequency for ‘at least one’, i.e. 7.87,
is close to the observed frequency of 9.
B1 E1 for sensible comparison B1 for observed frequency = 7 + 2 = 9
3
TOTAL 18

4767 Mark Scheme January 2009
56
Question 3 (i) (A) P( X < 120) =
120 115.3P21.9
Z −⎛ ⎞<⎜ ⎟⎝ ⎠
= P( Z < 0.2146)
= Φ(0.2146) = 0.5849 (B) P(100 < X < 110) =
100 115.3 110 115.3P21.9 21.9
Z− −⎛ ⎞< <⎜ ⎟⎝ ⎠
= P(–0.6986 < Z < –0.2420)
= Φ(0.6986) – Φ(0.2420) = 0.7577 – 0.5956 = 0.1621
(C) From tables Φ-1 ( 0.1 ) = –1.282
115.3 1.28221.9
k −= −
k = 115.3 – 1.282 × 21.9 = 87.22
M1 for standardizing A1 for z = 0.2146
A1 CAO (min 3 sf, to include use of difference column) M1 for standardizing both 100 & 110 M1 for correct structure in calcn
A1 CAO B1 for ±1.282 seen M1 for equation in k and negative z-value A1 CAO
3
3
3 (ii)
From tables,
Φ-1 ( 0.70 ) = 0.5244, Φ-1 ( 0.15 ) = – 1.036
180 = μ + 0.5244 σ
140 = μ – 1.036 σ
40 = 1.5604 σ
σ = 25.63, μ = 166.55
B1 for 0.5244 or ±1.036 seen M1 for at least one equation in μ and σ and Φ-1 value M1 dep for attempt to solve two equations A1 CAO for both
4 (iii) Φ-1 ( 0.975 ) = 1.96
a = 166.55 – 1.96 × 25.63 = 116.3
b = 166.55 + 1.96 × 25.63 = 216.8
B1 for ±1.96 seen M1 for either equation A1 A1 [Allow other correct intervals]
4
TOTAL 17

4767 Mark Scheme January 2009
57
Question 4 (i)
H0: no association between growth and type of plant; H1: some association between growth and type of plant;
EXPECTED Good Average Poor Coriander 12.10 24.93 17.97 Aster 10.56 21.76 15.68 Fennel 10.34 21.31 15.35 CONTRIBUTION Good Average Poor Coriander 0.0008 0.3772 0.4899 Aster 1.2002 0.6497 3.4172 Fennel 1.2955 0.0226 1.2344
X 2 = 8.69 Refer to 2
4χ Critical value at 5% level = 9.488 Result is not significant There is not enough evidence to suggest that there is some association between reported growth and type of plant; NB if H0 H1 reversed, or ‘correlation’ mentioned, do not award first B1or final A1
B1 (in context)
M1 A2 for expected values (to 2 dp)
(allow A1 for at least one row or column correct)
M1 for valid attempt at
(O-E)2/E A1 for all correct NB These M1A1 marks cannot be implied by a
correct final value of X 2
M1 for summation A1 for X2 CAO B1 for 4 d.o.f.
B1 CAO for cv M1 A1
12
(ii)
Test statistic = 49.2 47 2.2 1.830
1.2028.5/ 50−
= =
1% level 1 tailed critical value of z = 2.326 1.830 < 2.326 so not significant. There is not sufficient evidence to reject H0 There is insufficient evidence to conclude that the flowers are larger.
M1 correct denominator A1 B1 for 2.326 M1 (dep on first M1) for
sensible comparison leading to a conclusion
A1 for fully correct
conclusion in words in context
5
TOTAL 17

4767 Mark Scheme June 2009
71
4767 Statistics 2
Question 1 (i) EITHER:
Sxy = 1xy x yn
Σ − Σ Σ = 316345 – 150
× 2331.3 × 6724.3
= 2817.8
Sxx = ( )22 1x x
nΣ − Σ = 111984 – 1
50× 2331.32 = 3284.8
Syy = ( )22 1y y
nΣ − Σ = 921361 – 1
50× 6724.32 = 17036.8
r = S
S Sxy
xx yy
= 2817.8
3284.8 17036.8× = 0.377
OR:
cov (x,y) = xy
x yn
−∑ = 316345/50 – 46.626 × 134.486
= 56.356
rmsd(x) = xxSn
= √(3284.8/50) =√65.696 = 8.105
rmsd(y) = yySn
= √(17036.8/50) =√340.736 = 18.459
r = cov(x,y)( ) ( )rmsd x rmsd y
= 56.356
8.105 18.459× = 0.377
M1 for method for Sxy M1 for method for at least one of Sxx or Syy A1 for at least one of Sxy, Sxx or Syy correct M1 for structure of r A1 (AWRT 0.38) M1 for method for cov (x,y) M1 for method for at least one msd A1 for at least on of cov(x,y), rmsd(x) or rmsd(y) correct M1 for structure of r A1 (AWRT 0.38)
5
(ii) H0: ρ = 0 H1: ρ ≠ 0 (two-tailed test)
where ρ is the population correlation coefficient
For n = 50, 5% critical value = 0.2787 Since 0.377 > 0.2787 we can reject H0: There is sufficient evidence at the 5% level to suggest that there is correlation between oil price and share cost
B1 for H0, H1 in symbols B1 for defining ρ
B1FT for critical value M1 for sensible comparison leading to a conclusion A1 for result
1 B1 FT for conclusion in context
6
(iii) Population The scatter diagram has a roughly elliptical shape, hence the assumption is justified.
B1 B1 elliptical shape E1 conclusion
3
(iv) Because the alternative hypothesis should be decided without referring to the sample data and there is no suggestion that the correlation should be positive rather than negative.
E1 E1
2
TOTAL 16

4767 Mark Scheme June 2009
72
Question 2 (i)
Meteors are seen randomly and independently
There is a uniform (mean) rate of occurrence of meteor sightings
B1 B1
2
(ii)
(A) Either P(X = 1) = 0.6268 – 0.2725 = 0.3543
Or P(X = 1) = e �11.3
1! = 0.3543
(B) Using tables: P(X ≥ 4) = 1 – P(X ≤ 3)
= 1 – 0.9569
= 0.0431
M1 for appropriate use of tables or calculation A1
M1 for appropriate
probability calculation
A1
4
(iii)
λ = 10 × 1.3 = 13
P(X = 10) = e �1013
10! = 0.0859
B1 for mean
M1 for calculation A1 CAO
3
(iv)
Mean no. per hour = 60 × 1.3 = 78 Normal approx. to the Poisson, X ~ N(78, 78)
P(X ≥ 100) = P99.5 78
78Z −⎛ ⎞
>⎜ ⎟⎝ ⎠
= P(Z >2.434) = 1 – Φ(2.434) = 1 – 0.9926 = 0.0074
B1 for Normal approx. B1 for correct parameters (SOI) B1 for continuity corr. M1 for correct Normal probability calculation using correct tail A1 CAO, (but FT wrong or omitted CC)
5
(v) Either
P(At least one) = 1 - e λ 0
0!λ
= 1 - e λ ≥ 0.99
eλ ≤ 0.01
–λ ≤ ln 0.01, so λ ≥ 4.605
1.3 t ≥ 4.605, so t ≥ 3.54
Answer t = 4
Or
t = 1, λ = 1.3, P(At least one) = 1 - e 1.3 = 0.7275
t = 2, λ = 2.6, P(At least one) = 1 - e 2.6 = 0.9257
t = 3, λ = 3.9, P(At least one) = 1 - e 3.9 = 0.9798
t = 4, λ = 5.2, P(At least one) = 1 - e 5.2 = 0.9944
Answer t = 4
M1 formation of equation/inequality using P(X ≥ 1) = 1 – P(X = 0) with Poisson distribution. A1 for correct equation/inequality M1 for logs A1 for 3.54 A1 for t (correctly justified) M1 at least one trial with any value of t A1 correct probability. M1 trial with either t = 3 or t = 4 A1 correct probability of t = 3 and t = 4 A1 for t
5
TOTAL 19

4767 Mark Scheme June 2009
73
Question 3 (i)
X ~ N(1720,902)
P(X <1700) = 1700 1720P
90Z −⎛ ⎞
<⎜ ⎟⎝ ⎠
= P( Z < – 0.2222)
= Φ(– 0.2222) = 1 – Φ(0.2222) = 1 – 0.5879 = 0.4121
M1 for standardising A1
M1 use of tables (correct tail) A1CAO NB ANSWER GIVEN
4
(ii) P(2 of 4 below 1700)
= 42⎛ ⎞⎜ ⎟⎝ ⎠
× 0.41212 × 0.58792 = 0.3522
M1 for coefficient M1 for 0.41212 × 0.58792 A1 FT (min 2sf)
3
(iii) Normal approx with μ = np = 40 × 0.4121 = 16.48 σ2 = npq = 40 × 0.4121 × 0.5879 = 9.691
P(X ≥ 20) = P19.5 16.48
9.691Z −⎛ ⎞
≥⎜ ⎟⎝ ⎠
= P(Z ≥ 0.9701) = 1 – Φ(0.9701)
= 1 – 0.8340 = 0.1660
B1 B1 B1 for correct continuity corr. M1 for correct Normal probability calculation using correct tail A1 CAO, (but FT wrong or omitted CC)
5
(iv)
H0: μ = 1720; H1 is of this form since the consumer organisation suspects that the mean is below 1720 μ denotes the mean intensity of 25 Watt low energy bulbs made by this manufacturer.
B1 E1 B1 for definition of μ
3
(v) Test statistic =
1703 1720 1720.1290 / 20
− −=
= – 0.8447 Lower 5% level 1 tailed critical value of z = – 1.645 – 0.8447 > – 1.645 so not significant. There is not sufficient evidence to reject H0 There is insufficient evidence to conclude that the mean intensity of bulbs made by this manufacturer is less than 1720
M1 must include √20 A1FT B1 for –1.645 No FT
from here if wrong. Must be –1.645 unless it is clear that absolute values are being used. M1 for sensible comparison leading to a conclusion. FT only candidate’s test statistic A1 for conclusion in words in context
5
TOTAL 20

4767 Mark Scheme June 2009
74
Question 4 (i)
H0: no association between type of car and sex; H1: some association between type of car and sex; EXPECTED Male Female Hatchback 83.16 48.84 Saloon 70.56 41.44 People carrier 51.66 30.34 4WD 17.01 9.99 Sports car 29.61 17.39 CONTRIBUTION Male Female Hatchback 1.98 3.38 Saloon 0.59 1.00 People carrier 3.61 6.15 4WD 0.23 0.40 Sports car 1.96 3.33
X2 = 22.62 Refer to X4
2 Critical value at 5% level = 9.488 22.62 > 9.488 Result is significant There is evidence to suggest that there is some association between sex and type of car. NB if H0 H1 reversed, or ‘correlation’ mentioned, do not award first B1or final A1
B1
M1 A2 for expected
values (to 2 dp)
(allow A1 for at least one row or column correct)
M1 for valid attempt at
(O-E)2/E A1 for all correct NB These M1A1 marks
cannot be implied by a correct final value of X 2
M1 for summation A1 for X2 CAO B1 for 4 deg of f
B1 CAO for cv M1 sensible comparison leading to a conclusion A1
12
(ii)
• In hatchbacks, male drivers are more frequent
than expected. • In saloons, male drivers are slightly more frequent
than expected. • In people carriers, female drivers are much more
frequent than expected. • In 4WDs the numbers are roughly as expected • In sports cars, female drivers are more frequent
than expected.
E1 E1 E1 E1 E1
5
TOTAL 17
Deleted: 

4767 Mark Scheme January 2010
50
4767 Statistics 2 1 (i)
G1 For values of a G1 for values of t G1 for axes [3]
(ii) a is independent, t is dependent
since the values of a are not subject to random variation, but are determined by the runways which the pilot chooses, whereas the values of t are subject to random variation.
B1 E1dep E1dep [3]
(iii)
ā = 900, t = 855.2
b = at2
aa
S 6037800 5987 6300 / 7 649500 0.258S 8190000 6300 / 7 2520000
− ×= = =
−
OR b = 2
6037800 / 7 855.29 9008190000 / 7 900
− ×
− = 92785
360000 = 0.258
hence least squares regression line is: t – t = b(a – ā) t – 855.29 = 0.258 (a – 900) t = 0.258a + 623
B1 for ā and t used (SOI)
M1 for attempt at
gradient (b) A1 for 0.258 cao M1 for equation of
line A1 FT for complete
equation [5]
(iv) (A) For a = 800, predicted take–off distance
= 0.258×800 + 623 = 829 (B) For a = 2500, predicted take–off distance = 0.258×2500 + 623 = 1268
Valid relevant comments relating to the predictions such as: First prediction is interpolation so should be reasonable Second prediction is extrapolation and may not be reliable
M1 for at least one prediction attempted
A1 for both answers
(FT their equation if b>0)
E1 (first comment)
E1 (second comment)
[4]
(v) a = 1200
predicted t = 0.258×1200 + 623 = 933
Residual = 923 – 933 = –10 The residual is negative because the observed value is less than the predicted value.
M1 for prediction M1 for subtraction A1 FT E1
[4]
Total [19]

4767 Mark Scheme January 2010
51
2 (i) P(1 of 10 is faulty)
= 101
× 0.021 × 0.989 = 0.1667
M1 for coefficient M1 for probabilities A1 [3]
(ii) n is large and p is small B1, B1
Allow appropriate numerical ranges [2]
(iii) λ = 150 × 0.02 = 3
(A) P(X = 0) = 0
3 3e0!
− = 0.0498 (3 s.f.)
or from tables = 0.0498 (B) Expected number = 3 Using tables: P(X > 3) = 1 – P(X ≤ 3) = 1 – 0.6472 = 0.3528
B1 for mean (soi) M1 for calculation or
use of tables A1 B1 expected no = 3 (soi) M1 A1
[3]
[3]
(iv) (A) Binomial(2000,0.02)
(B) Use Normal approx with μ = np = 2000 × 0.02 = 40 σ2 = npq = 2000 × 0.02 × 0.98 = 39.2
P(X ≤ 50) = P 50.5 4039.2
Z − ≤
= P(Z ≤ 1.677) = Φ(1.677) = 0.9532 NB Poisson approximation also acceptable for full marks
B1 for binomial B1 for parameters B1 B1 B1 for continuity
corr. M1 for probability
using correct tail A1 CAO
[2]
[5]
Total [18]

4767 Mark Scheme January 2010
52
3 (i)
(A) P(X < 50)
= 50 45.3P11.5
Z − <
= P( Z < 0.4087) = Φ(0.4087)
= 0.6585
(B) P( 45.3 < X < 50) = 0.6585 – 0.5
=0.1585
M1 for standardising M1 for correct structure of probability calc’ A1 CAO inc use of diff
tables NB When a candidate’s answers suggest that (s)he appears to have neglected to use the difference column of the Normal distribution tables penalise the first occurrence only
M1 A1
[3]
[2]
(ii) From tables Φ-1 ( 0.9 ) = 1.282
45.3 1.28211.5
k −=
k = 45.3 + 1.282 × 11.5 = 60.0
B1 for 1.282 seen M1 for equation in k
A1 CAO
[3]
(iii) P(score = 111)
=P(110.5 < Y < 111.5)
= 110.5 100 111.5 100P15 15
Z− − < <
= P(0.7< Z < 0.7667) = Φ(0.7667) – Φ(0.7)
= 0.7784 – 0.7580 = 0.0204
B1 for both continuity corrections
M1 for standardising M1 for correct structure of probability calc’ A1 CAO
[4]
(iv) From tables,
Φ-1 ( 0.3 ) = –0.5244, Φ-1 ( 0.8 ) = 0.8416
22 = μ + 0.8416 σ
15 = μ – 0.5244 σ
7 = 1.3660 σ
σ = 5.124, μ = 17.69
B1 for 0.5244 or 0.8416 seen
M1 for at least one equation in z, μ & σ
A1 for both correct M1 for attempt to solve
two appropriate equations
A1 CAO for both
[5]
TOTAL [17]

4767 Mark Scheme January 2010
53
4 (i) H0: no association between size of business and recycling
service used. H1: some association between size of business and recycling service used.
B1 for both [1]
(ii) Expected frequency = 78/285 × 180 = 49.2632
Contribution = (52 – 49.2632)2 / 49.2632 = 0.1520
M1 A1 M1 for valid attempt at
(O-E)2/E A1 NB Answer given Allow 0.152
[4]
(iii) Test statistic X 2 = 0.6041
Refer to 2
2 Critical value at 5% level = 5.991 Result is not significant There is no evidence to suggest any association between size of business and recycling service used. NB if H0 H1 reversed, or ‘correlation’ mentioned in part (i), do not award B1in part (i) or E1 in part (iii).
B1 B1 for 2 deg of f(seen) B1 CAO for cv B1 for not significant E1
[5]
(iv) H0: μ = 32.8; H1: μ < 32.8
Where μ denotes the population mean weight of rubbish in the bins.
Test statistic = 30.9 32.8 1.9 3.951
0.48083.4 / 50−
= − = −
5% level 1 tailed critical value of z = –1.645 –3.951 < –1.645 so significant. There is sufficient evidence to reject H0
There is evidence to suggest that the weight of rubbish in dustbins has been reduced.
B1 for use of 32.8 B1 for both correct B1 for definition of μ M1 must include √50 A1 B1 for ±1.645 M1 for sensible
comparison leading to a conclusion
A1 for conclusion in
words in context [8]
TOTAL [18]

4767 Mark Scheme June 2010
1
Question 1 (i)
x 6 17 9 20 13 15 11 14 y 6 13 10 11 9 7 12 15
Rank x 8 2 7 1 5 3 6 4
Rank y 8 2 5 4 6 7 3 1
d 0 0 2 -3 -1 -4 3 3
d2 0 0 4 9 1 16 9 9
Σd2 = 48
2
2
6 6 481 1( 1) 8 63s
drn n
Σ ×= − = −
− ×
= 0.429 (to 3 s.f.) [ allow 0.43 to 2 s.f.]
M1 for attempt at ranking (allow all ranks reversed) M1 for d2 A1 CAO for Σd2
M1 for method for rs
A1 f.t. for |rs| < 1 NB No ranking scores zero
5 (ii)
H0: no association between X and Y in the population
H1: some positive association between X and Y in the population
One tail test critical value at 5% level is 0.6429
Since 0.429 < 0.6429, there is insufficient evidence to reject H0,
i.e. conclude that there is not enough evidence to show positive association between the two judges’ scores.
B1 for H0
B1 for H1
B1 for population SOI
NB H0 H1 not ito ρ
B1 for ± 0.6429
M1 for sensible comparison with c.v., provided that |rs| < 1 A1 for conclusion in context f.t. their rs and sensible cv
3
3
(iii)
A bivariate Normal distribution is required. Scatter diagram. Suitable discussion
B1 G1 labelled axes G1 correct points E1 E1
5
TOTAL 16

4767 Mark Scheme June 2010
2
Question 2 (i)
Counts have a uniform average rate of occurrence All counts are independent
E1 E1
2
(ii)
Variance = 3.4
B1
1
(iii)
(A) Either P(X = 3) = 0.5584 – 0.3397 = 0.2187
Or P(X = 3) = e−3.433.4
3! = 0.2186
(B) Using tables: P(X ≥ 3) = 1 – P(X ≤ 2)
= 1 – 0.3397
= 0.6603
M1 for use of tables or calculation A1
M1 for 1 - P(X ≤ 2)
M1 correct use of
Poisson tables
A1
2
3
(iv)
λ = 12 × 3.4 = 40.8
P(X = 40) = e−40.84040.8
40! = 0.0625
B1 for mean
M1 for calculation A1
3
(v) Mean no. per hour = 12 × 3.4 = 40.8
Using Normal approx. to the Poisson,
X ~ N(40.8, 40.8)
P(X ≥ 40) = P 39.5 40.840.8
Z − >
= P(Z > – 0.2035) = Φ(0.2035) = 0.5806
B1 for Normal approx. B1 for correct parameters (SOI) B1 for correct continuity corr. M1 for probability using correct tail A1 CAO (3 s.f.)
5
(vi)
Overall mean = 4.8
P(X ≥ 8) = 1 – P(X ≤ 7)
= 1 – 0.8867 = 0.1133
B1 for 4.8 M1 A1
3 TOTAL 19

4767 Mark Scheme June 2010
3
Question 3 (i)
(A) P( X < 65) = 65 63P
5.2Z −
<
= P( Z < 0.3846) = Φ(0.3846) = 0.6497
(B) P(60< X < 65) = 60 63 65 63P5.2 5.2
Z− − < <
= P(–0.5769 < Z < 0.3846) = Φ(0.3846) – (1 – Φ(0.5769)) = 0.6497 – (1 – 0.7181) = 0.3678
M1 for standardizing M1 for structure A1 CAO (min 3 s.f.), NB When a candidate’s answers suggest that (s)he appears to have neglected to use the difference column of the Normal distribution tables penalise the first occurrence only
M1 for standardizing both M1 for correct structure A1 CAO 3s.f.
3
3
(ii) P(All 5 between 60 and 65) = 0.36785 = 0.00673
M1 A1 FT (min 2sf)
2 (iii) From tables Φ-1 ( 0.95 ) = 1.645
63 1.6455.2
k −= −
x = 63 – 5.2 × 1.645 = 54.45 mins
B1 for ±1.645 seen M1 for correct equation in k A1 CAO
3 (iv)
H0: μ = 63 minutes; H1: μ < 63 minutes. Where μ denotes the population mean time on the new course.
Test statistic = 61.7 63 1.31.34265.2 / 15
− −=
= –0.968 5% level 1 tailed critical value of z = 1.645 –0.968 > –1.645 so not significant. There is not sufficient evidence to reject H0 There is insufficient evidence to conclude that the new course results in lower times.
B1 for use of 63 B1 for both correct B1 for definition of μ M1 must include √15 A1 B1 for ±1.645 M1 for sensible
comparison leading to a conclusion
A1 FT for correct conclusion in words in context
3
5 19

4767 Mark Scheme June 2010
4
Question 4 (i)
H0: no association between category of runner and type of running; H1: some association between category of runner and type of running;
EXPECTED Junior Senior Veteran Track 5.13 7.84 6.03 Road 6.48 9.90 7.62 Both 5.40 8.25 6.35
CONTRIBUTN Junior Senior Veteran Track 2.9257 0.0032 2.6949
Road 0.9468 0.3663 2.5190
Both 0.3615 0.3694 0.0192
X 2 = 10.21 Refer to X 4
2 Critical value at 5% level = 9.488 Result is significant There is evidence to suggest that there is some association between category of runner and type of running. NB if H0 H1 reversed, or ‘correlation’ mentioned, do not award first B1or final E1
B1
M1 A2 for expected values (to 2 dp)
(allow A1 for at least one row or column correct)
M1 for valid attempt at
(O-E)2/E A1 for all correct NB These M1A1 marks cannot be implied by
a correct final value of X 2
M1 for summation A1 for X2 B1 for 4 deg of f
B1 CAO for cv B1 FT their ‘sensible’ X2
E1 must be consistent
with their X2
1 7 4
(ii) • Juniors appear be track runners more often
than expected and road less often than expected.
• Seniors tend to be as expected ín all three
categories of running.
• Veterans tend to be road runners more than
expected and track runners less than expected.
E1 E1 E1 E1 E1 E1
6
TOTAL 18

4767 Mark Scheme January 2011
1
Question 1 (i) EITHER:
Sxy = 1xy x yn
= 1398.56 – 114 139.8 140.4
= –3.434
Sxx = 22 1x xn
= 1411.66 – 114
139.82 = 15.657
Syy = 22 1y yn
= 1417.88 – 114
140.42 = 9.869
r = S
S Sxy
xx yy
= -3.434
15.657 9.869
= –0.276 OR:
cov (x,y) = xy
x yn
= 1398.56/14 – 9.9857 10.0286
= –0.2454
rmsd(x) = xxSn
= √(15.657/14) =√1.1184 = 1.0575
rmsd(y) = yySn
= √(9.869/14) =√0.7049 = 0.8396
r = cov(x,y)( ) ( )rmsd x rmsd y
= -0.2454
1.0575 0.8396
= –0.276 NB: using only 3dp in calculating and x y leads to answer of 0.284 which is still in the acceptable range
M1 for method for Sxy M1 for method for at least one of Sxx or Syy A1 for at least one of
Sxy, Sxx, Syy correct M1 for structure of r A1 (-0.27 to -0.28 to 2dp) M1 for method for cov (x,y) M1 for method for at least one msd A1 for at least one of cov (x,y), msd(x), msd(y) correct M1 for structure of r A1 (-0.27 to -0.28 to 2dp)
5
If and x y used in rounded form, be generous with first A1 Structure of r needs to be fully correct in all parts – the first two M1
marks must have been earned and r = S
S Sxy
xx yy
applied.
If and x y used in rounded form, be generous with first A1 Structure of r needs to be fully correct in all parts – the first two M1
marks must have been earned and r = cov(x,y)( ) ( )rmsd x rmsd y
applied.

4767 Mark Scheme January 2011
2
(ii) H0: ρ = 0 H1: ρ 0 (two-tailed test) where ρ is the population correlation coefficient For n = 14, 5% critical value = –0.5324 Since –0.276 > –0.5324 the result is not significant. Thus we do not have sufficient evidence to reject H0 There is not sufficient evidence at the 5% level to suggest that there is correlation between birth rate and death rate
B1 for H0, H1 in symbols B1 for defining ρ
B1 for critical value (+ or -) M1 for a sensible comparison leading to a conclusion (provided that -1 < r < 1) A1 for correct result ft their r B1 ft for conclusion in
context
6
Condone hypotheses written in words and context. e.g. allow H0: There is no correlation between x & y, H1: There is correlation between x & y. (i.e. allow x & y as ‘context’ since these are defined in the question) NB If hypotheses given only in words and ‘association’ mentioned then do not award first B1 and last B1 For hypotheses written in words, candidates must make it clear that they are testing for evidence of correlation in the population. One-tailed test cv = (-) 0.4575 Comparison should be between the candidate’s value of r from part (i) and an appropriate cv (i.e. the sign of the cv and the sign of r should be the same). NOTE If result not stated but final conclusion is correct award SC1 to replace the final A1 B1
(iii) The underlying population must have a bivariate Normal distribution. Since the scatter diagram has a roughly elliptical shape.
B1 E1 for elliptical shape
2
Not bivariate and Normal
(iv) Because this data point is a long way from the other data and it is below and to the right of the other data. It does bring the validity of the test into question since this extra data point is so far from the other points and so there is less evidence of ellipticity.
E1 for a long way E1 for below and to the right of. E1 for does cast doubt on validity E1 for less elliptical
4
Indication that the point is (possibly) an outlier For identifying the position of this point (allow in terms of x and y) Allow ‘no’ but only with with suitable explanation e.g. the sample is still too small to provide evidence either for or against the presence of ellipticity.
TOTAL 17

4767 Mark Scheme January 2011
3
Question 2 (i)
Mean = xfn = 0 15 24 27 16 10
50
= 9250
= 1.84
Variance = 2211
fx nxn
= 21 258 50 1.8449
= 1.81 (to 2 d.p.)
B1 for mean M1 for calculation
A1
3
Use of MSD gets M1 A0 Standard deviation gets M0 A0 unless “Variance = 1.81” is seen.
(ii) Because the mean is close to the variance
B1 1
Must compare mean and their variance as found in part (i)
(iii) (A) P(No sultanas) = e
01.840!
= 0.159 (3 s.f.)
(B) P(At least two sultanas) =
1 – e01.84
0! – e
11.841!
=1 – 0.159 – 0.292 = 0.549
M1 for probability calc.
A1 M1 for P(1) M1 for 1 – [P(0) + P(1)] used A1 cao
5
[1.8 leads to 0.1653] Or attempt to find P(2) + P(3) + P(4) + …+ P(8) Use of λ = 1.8 loses both accuracy marks [1.8 leads to 1 – 0.4296 = 0.5372]
(iv) λ = 51.84 = 9.2 Using tables: P(X ≥ 10) = 1 – P(X 9) = 1 – 0.5611 (= 0.4389 NB ANSWER GIVEN)
B1 for mean (SOI) M1 for 1 – P(X 9) A1
3
Any λ

4767 Mark Scheme January 2011
4
(v) P(2 out of 6 contain at least ten sultanas) 6
= 2
0.43892 0.56114 = 0.2864
M1 for p2 q4 M1 dep for coefficient A1
3
p + q = 1 Coefficient of 15 as part of a binomial calculation ft if p rounded from part (iv)
(vi)
Use Normal approx with μ = np = 60 0.4389 = 26.334 σ2 = npq = 60 0.4389 0.5611 = 14.776
P(X > 30) = P 30.5 26.33414.776
Z
= P(Z > 1.0838) = 1 – Φ(1.0838)
= 1 – 0.8608
= 0.1392
B1 for μ B1 for σ2 B1 for correct continuity correction M1 for probability using correct tail. FT their μ & σ2 A1 cao
5
SOI Allow 26.3 Allow 14.8 … …(giving P(Z > 1.091..) = 0.137 3sf ) But do not FT wrong or omitted CC
20

4767 Mark Scheme January 2011
5
Question 3 (i)
(A) P(X < 325)
= P 325 35552
Z
= P( Z < – 0.577)
= 1– Φ(0.577) = 1 – 0.7181
= 0.2819
(B) P( 300 < X < 400)
= P 300 355 400 35552 52
Z
= P 1.058 0.865Z = Φ(0.865) – (1– Φ(1.058)) = 0.8065 – (1 – 0.8549)
= 0.6614 (0.6615 from GDC)
M1 for standardising M1 for correct structure A1 CAO M1 for standardising both M1 for correct structure A1 CAO
3
3
NB When a candidate’s answers suggest that (s)he appears to have neglected to use the difference column of the Normal distribution tables penalise the first occurrence only Ignore spurious continuity corrections & allow reversal of numerator i.e. correct tail (including below a negative z) Allow answers which round to 0.282 Penalise spurious continuity corrections Allow 0.663 if penalised inappropriate table use already Use of standard deviation = √52 or 522 can earn M1 for structure only in each part – max 2/6
(ii)
From tables Φ-1 ( 0.2) = – 0.8416
355 0.841652
k
k = 355 – 0.8416 52 = 311.2
B1 for ± 0.8416 seen M1 for equation in k A1 CAO
3
NOT 1 – 0.8416 Equation must be equivalent to this. Penalise use of + 0.8416 unless numerator has been reversed. Condone other z values but use of probabilities here, e.g. use of 0.2 or Φ(0.2) = 0.5793, gets M0 A0 Allow 311

4767 Mark Scheme January 2011
6
(iii)
H0: μ = 355; H1: μ ≠ 355. Where μ denotes the population mean (reaction time for women)
Test statistic = 344 355 11 1.05810.452 / 25
5% level 2 tailed critical value of z = 1.96 –1.058 > –1.96 so not significant. There is not sufficient evidence to reject H0 There is insufficient evidence to conclude that women have a different reaction time from men in this experiment.
B1 for use of 355 in hypotheses B1 for both correct B1 for definition of μ M1 must include √25 A1 B1 for 1.96 M1 for a sensible comparison
leading to a conclusion A1 for correct conclusion in words in context
8
Use of 355 in hypotheses and hypotheses given in terms of μ not p or x, etc. unless letter used is clearly defined as population mean Allow + 1.058 only if later compared with + 1.96 Or -1.96 Do not accept ‘men and women have same reaction time’
TOTAL 17

4767 Mark Scheme January 2011
7
Question 4 (i)
H0: no association between pebble size and site H1: some association between pebble size and site;
EXPECTED Site A Site B Site C Large 13.70 9.44 13.86 Medium 33.33 22.96 33.70 Small 42.96 29.60 43.44 CONTRIB’N Site A Site B Site C Large 0.1226 0.6940 1.0731 Medium 0.8533 1.5484 3.7861 Small 0.3793 0.3913 1.2744
X 2 = 10.12 Refer to X4
2 Critical value at 5% level = 9.488 Result is significant There is evidence to suggest that there is some association between pebble size and site
B1
M1 A2 for expected values (to 2 dp)
(allow A1 for at least one row or column correct)
M1 for valid attempt at
(O-E)2/E A1 M1 for summation A1 for X2 B1 for 4 deg of freedom
B1 CAO for cv B1 ft their ‘sensible’ X2 and critical value
E1 must be consistent with their X2
12
Must be in context NB if H0 H1 reversed, or ‘correlation’ mentioned, do not award first B1 or final E1 1d.p.can get M1A1A0 M1A2 can be implied by correct contributions/final answer NB These (M1A1) marks cannot be implied by a correct final value of X 2. A1 for at least 1 row/column correct Dependent on previous M1 Award only if no incorrect working seen Allow reject H0. B0 if critical value of 0.711 (lower tail) or 2.776 (t distribution) used. Dependent on previous B1 SC1 (to replace B1E1 if first B1B1 earned where ‘significant’ not stated but final statement is correct)

4767 Mark Scheme January 2011
8
(ii)
Site A Contributes least to X2 showing that frequencies are as expected if there were no association. OR Contribution of 0.8533 implies that there are (slightly) fewer medium pebbles than expected. Site B Contribution of 1.5484 implies that there are fewer medium pebbles than expected. Site C Contribution of 3.7861 implies that there are a lot more medium than expected. NB MAX 3/6 for answers not referring to contributions (explicitly or implicitly).
E2,1,0 E2,1,0 E2,1,0 Need ‘a lot more’ for E2
2
2
2
NOTE For each site, some reference to contributions needed (explicitly or implicitly). Award E2 only if no incorrect additional comment made. Allow large/small ‘as expected’ or ‘more than expected’ and medium ‘as expected’ or ‘less than expected’ for E1 (if contribution not mentioned) Award E2 only if no incorrect additional comment made. Allow large/small ‘as expected’ or ‘more than expected’ and medium ‘less than expected’ for E1 (if contribution not mentioned) Award E2 only if no incorrect additional comment made. Allow large/small ‘fewer than expected’ and medium ‘more than expected’ for E1 (if contribution not mentioned)
TOTAL 18

4767 Mark Scheme January 2011
9
Additional notes re Q1(ii) For those carrying out a one-tailed test, B0 B1 B1 M1 A1 B1 is available provided that working is consistent with a one-tailed test being used. For the final B1 to be earned, the conclusion should refer to alternative hypothesis used. e.g. ‘There is not sufficient evidence at the 5% level to suggest that there is a negative correlation between birth rate and death rate’. If the cv is taken from the Spearman’s Test table (i.e. -0.5385 and -0.4637) then the third B1 will be lost. If other ‘sensible’ cvs are used then only B1 B1 B0 M1 A0 B0 available. Use of t distribution leads to B1 B1 B0 M0 A0 B0 max. Additional notes re Q3(iii) Critical Value Method 355 – 1.96 × 52 ÷ √25 gets M1B1 = 334.6… gets A1 334.6 < 344 gets M1for sensible comparison A1 still available for correct conclusion in words & context Confidence Interval Method CI centred on 344 + or - 1.96 × 52 ÷ √25 gets M1 B1 = (323.62, 364.384) A1 contains 355 gets M1 A1 still available for correct conclusion in words & context Probability Method Finding P(sample mean < 344) = 0.1451 gets M1 A1 B1 0.1451 > 0.025 gets M1 for a sensible comparison if a conclusion is . 0.1451 > 0.05 gets M1 A0 unless using one tailed test A1 still available for correct conclusion in words & context. Condone P(sample mean > 344) = 0.8549 for M1 but only allow A1 if later compared with 0.975 at which point the final M1and A1 are still available One-tailed test Max B1 B0 B1 M1 A1 B1 (for cv = -1.645) M1 A1 (provided that the conclusion relates to H1: μ < 355, e.g. there is insufficient evidence to suggest that women have a lower reaction time than men in this experiment). Consistent use of σ = √52 Do not penalise in parts (ii) and (iii).

Oxford Cambridge and RSA Examinations
GCE
Unit 4767: Statistics 2
Advanced GCE
Mathematics (MEI)
Mark Scheme for June 2011

4767 Mark Scheme June 2011
1 (i)
G1 for axes G1 For values of x G1 for values of y
3
Condone axes drawn either way. Axes should show some indication of scale. If not then Max G1 if points ‘visibly correct’. If axes are scaled and only one point is incorrectly plotted, allow max G2/3.
1 (ii) x = 60, y = 4.26
b = xy
xx
SS
= 2
1803 300 21.3 / 527000 300 / 5
= 5259000
= 0.0583
OR b = 2
1803/ 5 60 4.2627000 / 5 60
= 1051800
= 0.0583
hence least squares regression line is: y y = b(x x ) y – 4.26 = 0.0583 (x – 60) y = 0.0583x + 0.76
B1 for x and y used appropriately (SOI)
M1 for attempt at gradient
(b) A1 for 0.0583 cao M1 for equation of line A1 FT for complete
equation
5
B1 for means can be implied by a correct value of b using either method. Allow y = 4.3 Attempt should be correct – e.g. evidence of either of the two suggested methods should be seen.
Allow 0.058 Condone 0.058 and 3 7120
Dependent on first M1. Values must be substituted to earn M1. Condone use of their b for FT provided b>0. Final equation must be simplified. b = 0.058 leads to y = 0.058x + 0.78
1 (iii) Regression line plotted on graph The fit is good
G1 G1 E1 for good fit
3
Line must pass through their ( x , y ) and y-intercept. E0 for notably inaccurate graphs/lines
5

4767 Mark Scheme June 2011
6
1 (iv) x = 30 predicted y = 0.0583×30 + 0.76 = 2.509
Residual = 2.5 – 2.509 = –0.009
B1 for prediction M1 for subtraction A1 FT
3
Using their equation Subtraction can be ‘either way’ but for the final mark the sign of the residual must be correct. FT sensible equations only – e.g. no FT for y = 0.071x leading to +0.37. [c = 0.78 leads to a residual of -0.02]
1 (v) (A) For x = 45, y = 0.0583×45 + 0.76 = 3.4 (B) For x = 150, y = 0.0583×150 + 0.76 = 9.5
M1 for at least one prediction attempted A1 for both answers (FT their equation provided their b>0)
2
Prediction obtained from their equation.
1 (vi) This is well below the predicted value … …suggesting that the model breaks down for larger values of x.
E1 for well below E1 extrapolation
2
Some indication that the value (8.7) is significantly below what is expected (9.5) is required for the first E1. Simply pointing out that it is ‘below’ is not sufficient. The second E1 is available for a suitable comment relating to the model being suitable only for values within the domain of the given points. Allow other sensible comments for either E1. E.g. The data might be better modelled by a curve’, ‘there may be other factors affecting yield’,
18

4767 Mark Scheme June 2011
2 (i) Independently means that the arrival time of each car is unrelated to the arrival time of any other car. Randomly means that the arrival times of cars are not predictable. At a uniform average rate means that the average rate of car arrivals does not vary over time.
E1 E1 E1
3
NOTE Each answer must be ‘in context’ and ‘clear’ Allow sensible alternative wording. SC1 For ALL answers not in context but otherwise correct.
2 (ii) P(At most 1 car) = e
00.620!
+ e10.62
1!
= 0.5379… + 0.3335… = 0.871
M1 for either M1 for sum of both A1 CAO
3
1.62e-0.62 Allow 0.8715 not 0.872 or 0.8714 Allow 0.87 without wrong working seen
2 (iii) New λ = 10 0.62 = 6.2 P(more than 5 in 10 mins) = 1 – 0.4141 = 0.5859
B1 for mean (SOI) M1 for probability A1 CAO
3
Use of 1 – P(X ≤ 5) with any λ Allow 0.586
2 (iv) Poisson with mean 37.2 B1 for Poisson B1 for mean 37.2
2
Dependent on first B1 Condone P(37.2, 37.2)
2 (v) Use Normal approx with μ = σ2 = λ = 37.2
P(X ≥ 40) = P 39.5 37.237.2
Z
= P(Z > 0.377) = 1 – Φ(0.377) = 1 – 0.6469 = 0.3531
B1 for Normal (SOI) B1 for parameters B1 for 39.5 M1 for correct use of Normal approximation using correct tail A1 cao
5
Allow 0.353
16
7

4767 Mark Scheme June 2011
3 (i)
P(Apple weighs at least 220g)
= P 220 210.515.2
Z
= P( Z > 0.625) = 1– Φ(0.625) = 1 – 0.7340
= 0.2660
M1 for standardising M1 for correct structure A1 CAO inc use of diff tables
3
Condone numerator reversed but penalise continuity corrections i.e. 1 – Φ(positive z value) Allow 0.266 but not 0.27
3 (ii) P(All 3 weigh at least 220g) = 0.26603 = 0.0188 M1 A1 FT 2 M1 for their answer to part (i) cubed
Allow 0.019 and 0.01882 3 (iii) (A) Binomial (100, 0.0188)
(B) Use a Poisson distribution with λ = 100×0.0188 = 1.88
P(At most one) = e01.88
0! + e
11.881!
= 0.1525 + 0.2869 = 0.4394 (C) n is large and p is small
B1 for binomial B1 for parameters B1 for Poisson SOI B1 for Poisson mean M1 for either probability M1 for sum of both A1 CAO For 0.44 or better
B1
2
5 1
Second B1 dependent on first B1 FT their answer to part (ii) for second B1 Consistent with p < 0.1 from part (iii) (A) FT answer to part (ii) with p < 0.1 Dependent on both previous B1 marks Allow 0.4395 but not 0.4337 Dependent on use of Poisson in part (iii) B Allow n is large and np <10 & n is large and
npqnp 3(iv)(A) Φ-1 ( 0.1 ) = – 1.282
170 185 1.282
1.282 σ = 15
σ = 11.70
B1 for ±1.282 M1 for correct equation as written o.e. A1 CAO
3
Do not allow 1 – 1.282 Allow M1 if different z-value used Without incorrect working seen. Allow 11.7
8

4767 Mark Scheme June 2011
9
3(iv)(B)
G1 for shape G1 for means, shown explicitly or by scale G1 for lower max height for Braeburns G1 for greater width (variance) for Braeburns
4
Ignore labelling of vertical axis. Two intersecting, adjacent Normal curves Means at 185 and 210.5
TOTAL 20 4(a)(i) H0: no association between amount spent and sex
H1: some association between amount spent and sex B1 for both
1 Hypotheses must be the right way round, in context and must not mention ‘correlation’.
4(a)(ii) Expected frequency = 62102÷200 = 31.62 Contribution = (34 – 31.62)2 / 31.62 = 0.1791
B1 M1 A1 for valid attempt at (O-E)2/E NB Answer given
3
Do not allow 31.6
Cox’s Braeburns

4767 Mark Scheme June 2011
4(a)(iii) Refer to X42
Critical value at 5% level = 9.488 3.205 < 9.488 Result is not significant There is insufficient evidence to suggest any association between amount spent and sex. .
B1 for 4 deg of freedom B1 CAO for cv M1 A1 for not significant E1
5
Allow p = 0.524 0.524 > 0.05 Conclusion must be stated to earn A1 here. Allow ‘do not reject H0’ and condone ‘accept H0’ or ‘reject H1’. FT if cv consistent with their d.o.f. Dependent on previous A1 and final comment must be in context and not mention correlation. SC1 for correct final conclusion where previous A1 omitted but M1 awarded.
4 (b) H0: μ = 400; H1: μ < 400 Where μ denotes the population mean (weight of the loaves). x = 396.5
Test statistic = 396.5 400 3.5 1.5042.3275.7 / 6
5% level 1 tailed critical value of z = –1.645 –1.504 > –1.645 so not significant. There is insufficient evidence to reject H0 There is insufficient evidence to suggest that the true mean weight of the loaves is lower than the minimum specified value of 400 grams.
B1 for H0 B1 for H1 B1 for definition of μ B1 for sample mean M1 must include √6 A1FT their sample mean
B1 for ±1.645
M1 for sensible comparison leading to a conclusion A1 for conclusion in context
9
Hypotheses in words must refer to population mean. Condone numerator reversed for M1 but award A1 only if test statistic of 1.504 is compared with a positive z-value. Dependent on previous M1 FT their sample mean only if hypotheses are correct.
TOTAL 18
10

4767 Mark Scheme June 2011
Additional notes re Q1 parts (ii), (iv) and (v) Part (ii) ‘x on y’ max B1 Part (iv) x = 16.9y – 12.02 leads to a prediction of x = 30.23 and a residual of -0.23 B1 M1 A1 available. Part (v) ‘x on y’ not appropriate here so award 0 if ‘x on y’ used. Additional notes re Q2 parts (i) & (v) Part (i) Independent – Allow ‘not linked to’ or ‘no association’ or ‘unrelated’ ‘not affected by’, ‘not connected to’, ‘not influenced by’ DO NOT ACCEPT ‘not together’ or ‘not dependent’ Random – Allow ‘not predictable’ or ‘no pattern’ or ‘could happen at any time’ or ‘not specific time’ Uniform average rate – Allow ‘average (rate) is constant over time’ DO NOT ACCEPT ‘average constant’ or ‘average rate and uniform’ – be generous over defining ‘average’ and/or ‘rate’. Part (v) If Binomial distribution stated in part (iv), allow B1 B0 B1 M0 A0 max Additional notes re Q3 part (iii) where p > 0.1 (iii) B – as scheme unless a Normal approximation is more suitable (p > 0.1). If so, award B1 B1 for Normal and correct parameters. The remaining marks are dependent on both these B1 marks being awarded. M1 for the correct continuity correction (P(X < 1.5) ) and depM1 for the correct tail but award A0. (iii) C – ‘n is large and p is not too small’ or ‘np > 10’
11

4767 Mark Scheme June 2011
12
Additional notes re Q4(b) σ estimated sample mean, 7.079… used in place of 5.7, the given value of the population mean, leads to a test statistic of -1.212… This gets M1A0 & the remaining marks are still available. Critical Value Method 400 – 1.645 × 5.7 ÷ √6… gets M1B1 …= 396.17…gets A1 400 + 1.645 × 5.7 ÷ √6 gets M1B1A0. 396.5 > 396.2 gets M1for sensible comparison (and B1 for 396.5) A1 still available for correct conclusion in words & context 90% Confidence Interval Method CI centred on 396.5 (gets B1 for 396.5) + or – 1.645 × 5.7 ÷ √6 gets M1 B1 = (392.67, 400.33) A1 contains 400 gets M1 A1 still available for correct conclusion in words & context Probability Method Finding P(sample mean < 396.5) = 0.0663 gets M1 A1 (and B1 for 396.5) 0.0663 > 0.05 gets M1 for a sensible comparison if a conclusion is made and also gets the B1 for 0.0663 (to replace the B1 for cv = 1.645). A1 still available for correct conclusion in words & context. Condone P(sample mean >396.5) = 0.9337 for M1 and B1 for 0.9337 but only allow A1 if later compared with 0.95 at which point the final M1and A1 are still available Two-tailed test Max B1 B0 B1 B1 M1 A1 B1 (for cv = -1.96) M1 A0
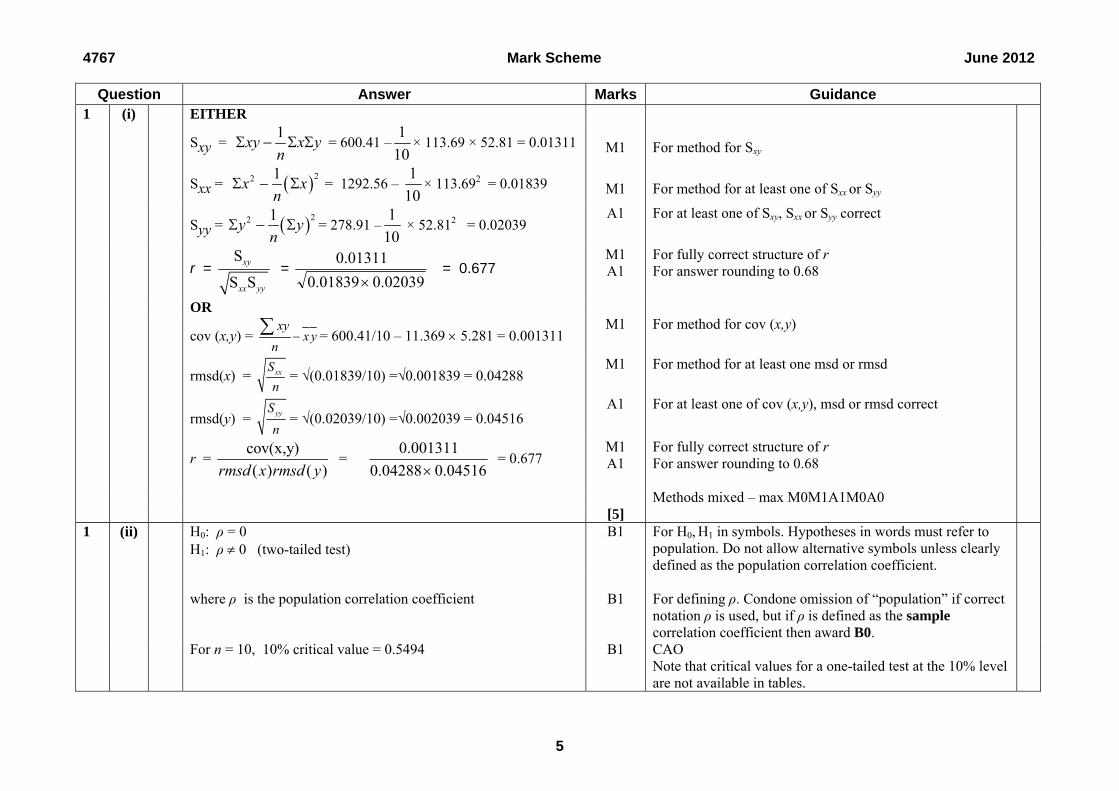
4767 Mark Scheme June 2012
Question Answer Marks Guidance 1 (i) EITHER
Sxy = 1xy x y = 600.41 –n
101
× 113.69 × 52.81 = 0.01311
M1 For method for Sxy
Sxx = 22 1x x
n = 1292.56 –
101
× 113.692 = 0.01839
M1 For method for at least one of Sxx or Syy
Syy = 22 1y y
n = 278.91 –
101
× 52.812 = 0.02039 A1 For at least one of Sxy, Sxx or Syy correct
r =
S
S Sxy
xx yy
= 02039.001839.0
01311.0
= 0.677 M1 A1
For fully correct structure of r For answer rounding to 0.68
OR
cov (x,y) = xy
x yn
= 600.41/10 – 11.369 5.281 = 0.001311 M1 For method for cov (x,y)
rmsd(x) = xxS
n= √(0.01839/10) =√0.001839 = 0.04288
M1 For method for at least one msd or rmsd
rmsd(y) = yyS
n= √(0.02039/10) =√0.002039 = 0.04516
A1 For at least one of cov (x,y), msd or rmsd correct
r =
cov(x,y)( ) ( )rmsd x rmsd y
= 04516.004288.0
001311.0 = 0.677
M1 A1
For fully correct structure of r For answer rounding to 0.68
Methods mixed – max M0M1A1M0A0 [5] 1 (ii) H0: ρ = 0
H1: ρ 0 (two-tailed test) B1 For H0, H1 in symbols. Hypotheses in words must refer to
population. Do not allow alternative symbols unless clearly defined as the population correlation coefficient.
where ρ is the population correlation coefficient B1 For defining ρ. Condone omission of “population” if correct
notation ρ is used, but if ρ is defined as the sample correlation coefficient then award B0.
For n = 10, 10% critical value = 0.5494 B1 CAO Note that critical values for a one-tailed test at the 10% level are not available in tables.
5

4767 Mark Scheme June 2012
Since 0.677 > 0.5494 the result is significant. M1 For sensible comparison leading to a conclusion provided that |r| < 1. The comparison can be in the form of a diagram as long as it is clear and unambiguous. Sensible comparison: e.g. 0.677 > 0.5494 is ‘sensible’ whereas 0.677 > - 0.5494 is ‘not sensible’. Reversed inequality sign e.g. 0.677 < 0.5494 etc. gets max M1 A0.
(Thus we have sufficient evidence to) reject H0 A1* For reject H0 o.e. FT their r and critical value from 10% 2-tail column.
There is sufficient evidence at the 10% level to suggest that there is correlation between times for the first and last sections.
E1dep* For correct, non-assertive conclusion in context. Allow ‘x and y’ for context. E0 if H0 and H1 not stated, reversed or mention a value other than zero for ρ in H0. Do not allow ‘positive correlation’ or ‘association’
[6] 1 (iii) The underlying population must have a bivariate Normal
distribution. B1 Condone “bivariate Normal distribution”, “underlying
bivariate Normal distribution”, but do not allow “the data have a bivariate Normal distribution”
The points in the scatter diagram should have a roughly elliptical shape.
E1 Condone ‘oval’ or suitable diagram
[2] 1 (iv) The hypothesis test has shown that there appears to be correlation. E1 For relevant comment relating to the test result or positive
value of r in supporting (unless FT leads to not supporting) the commentator’s suggestion. Or correlation does not imply causation. There may be a third factor. For questioning the use of the word ‘must’
However it could be that there is a third causal factor E1 Allow any two suitable, statistically based comments. [2] 1 (v) (A) Yes because the critical value at the 1% level is 0.7646 B1* B1 for 0.7646 seen which is larger than the test statistic E1dep* E1 for comment consistent with their (ii) provided r| < 1 [2]
6

4767 Mark Scheme June 2012
1 (v) (B) One advantage of a 1% level is that one is less likely to reject the null hypothesis when it is true.
E1 o.e. Wording must be clear.
One disadvantage of a 1% level is that one is more likely to E1 o.e. accept the null hypothesis when it is false. [2] 2 (i) Binomial(1200,1/300) B1 For binomial. B1dep For parameters [2] Allow B(1200, 1/300) and B(1200, 0.00333) 2 (ii) Because n is large and p is small E1, E1 Allow n is large and np < 10. Allow “sample is large” for n is large and “mean ≈
variance” for “p is small”
[2] 2 (iii) λ = 1200 1/300 = 4 B1 For λ FT their p
(A) P(X = 1) = !1
414e = 0.0733 (3 s.f.)
M1
For attempt to find P(X = 1) using Poisson p.d.f. or tables
or from tables = 0.0916 – 0.0183 = 0.0733 A1 Allow answers which round to 0.073 www. FT their λ (= np). No FT for λ = 1/300.
(B) Using tables: P(X > 4) = 1 – P(X 4) M1 For finding 1 – P(X 4) = 1 – 0.6288 = 0.3712 A1 CAO For answers rounding to 0.371 www [5] 2 (iv) µ = 80 B1 If symbols/words used then they must be correct. σ2 = 80 B1 Allow σ2 rounding to 79.7 from original binomial. FT their λ (= np) [2] 2 (v) (A)
P(Y ≥ 90) = P
80805.89Z
B1 M1
For correct continuity correction. For probability using correct tail and structure (condone omission of c.c.)
= P(Z > 1.062) = 1 – Φ(1.062) σ2 = 79.73 leads to P(Z > 1.064) = 1 – 0.8559 = 0.1441 A1cao σ2 = 79.73 leads to 1 – 0.8563 = 0.1437.
Allow 0.144 www. NOTE 0.1441 from B(24000, 1/300) gets 0/3
[3]
7

4767 Mark Scheme June 2012
2 (v) (B) P(Y ≤ k) > 0.05 From tables Φ-1 ( 0.05 ) = -1.645 B1 For ±1.645 seen
8080)5.0( k
= -1.645 M1
For correct equation in k seen or equivalent – e.g. allow +1.645 used if numerator reversed. FT their µ, σ2 and z-value. Condone omission of, or incorrect, continuity correction.
k + 0.5 = 80 – (1.645 × √80) = 65.29 k > 64.79
A1 A1 for 65.29 or 64.79 or 65.79 (σ2 = 79.73 leads to 65.31 or 64.81 or 65.81) Allow 3s.f.
So least value of k = 65 A1 For rounding 64.79 or 64.81 up to give k = 65. See additional notes for alternative method [4] 3 (i)
P(X ≥ 750) = P
5.2
Z 4.751750
M1 M1
For standardizing For correct structure (M0 if continuity correction used)
= P(Z > -0.56) = Φ(0.56) = 0.7123 A1 CAO Allow 0.712 www [3] 3 (ii) P(all 6 at least 750ml) = 0.71236 M1 For (their answer to part (i))6 = 0.1306 A1 FT 3s.f. [2] 3 (iii)
P(Y=0) = (= 0.0302) 258694.0025
M1
For using Binomial(25, p) with their p from part (ii)
P(Y=1) = (= 0.1135) 1306.08694.0
125 24
M1 For correct structure of either P(Y = 0) or P(Y = 1) with their p from part (ii) M0 if p and q reversed
P(Y=0) + P(Y=1) = 0.144 P(Y ≥ 2) = 1 – 0.144 M1dep For 1 – sum of both probabilities =0.856 A1 CAO [4]
8

4767 Mark Scheme June 2012
3 (iv) P(Z <
5.2750
) = 0.02
Φ-1 (0.02) = -2.054 B1 For ±2.054 seen. Allow ±2.055
5.2750
= -2.054 M1 For correct equation as seen or equivalent. FT σ = √2.5. M0
if c.c. used.
= 750 + 2.054 × 2.5 M1 For correctly rearranging their equation (if 750 used in numerator) for µ, FT their z
= 755.1 A1 cao Condone 755 or 5 s.f. rounding to 755.1 www [4] 3 (v)
P(Z <
4.751750 ) = 0.02
4.751750
= -2.054
054.24.1
M1
M1
For correct equation as seen or equivalent For correctly rearranging their equation (if 750 used in numerator) for σ unless this leads to σ < 0
= 0.682 A1 cao Allow answers rounding to 0.68 www [3] 3 (vi) Probably easier to change the mean (as reducing the standard. E1 deviation would require a much more accurate filling process). However increasing the mean would result in fewer bottles being filled overall and so less profit for the owners, so reducing the
standard deviation would be preferable to the vineyard owners. E1 For “preferable to reduce the standard deviation” with valid
reason.
[2] 4 (a) (i) Expected frequency = 67/150 57 = 25.46 B1 For 25.46 Contribution = (34 – 25.46)2 / 25.46 M1 For valid attempt at (O-E)2/E = 2.8646 A1 Correct values used to give answer which rounds to 2.8646
NB Answer given
[3]
9

4767 Mark Scheme June 2012
4 (a) (ii) H0: no association between type of cake and classification of B1 For both hypotheses in context person. H1: some association between type of cake and classification of person. Test statistic X 2 = 12.86 Refer to X 32 B1 For 3 degrees of freedom Critical value at 1% level = 11.34 B1 CAO For cv. No FT from here if wrong/omitted Result is significant B1 For significant There is evidence to suggest association between type of cake and E1 For correct, non-assertive conclusion, in context. classification of person. NB if H0 H1 reversed, omitted or ‘correlation’ mentioned, do not
award first B1 or final E1
[5] 4 (b) = 4.995 B1 For 4.995 seen H0: μ = 5 B1 For use of 5 in hypotheses. H1 : μ < 5 B1 For both correct. Hypotheses in words must refer to
population. Do not allow alternative symbols unless clearly defined as the population mean.
Where μ denotes the mean content of the bags of flour (in the population)
B1 For definition of μ in context. Condone omission of “population” if correct notation μ is used, but if μ is defined as the sample mean then award B0.
Test statistic = 964.1002546.0
005.08/0072.00.5995.4
M1* A1
must include √8 FT their . Allow +1.964 only if later compared with +1.645
Lower 5% level 1 tailed critical value of z = – 1.645 B1* For –1.645 No FT from here if wrong. Must be –1.645 unless it is clear that absolute values are being used.
– 1.964 < – 1.645 so significant. M1 dep*
For sensible comparison with correct c.v. leading to a conclusion.
There is sufficient evidence to reject H0 There is sufficient evidence to suggest that the average contents
of bags is less than 5kg. A1 For non-assertive conclusion in words and in context. No FT
here.
See additional notes. [9]
10

4767 Mark Scheme June 2012
11
ADDITIONAL NOTES REGARDING QUESTION 2 (v) B M1 for using a trial and improvement method with N(80,80) or N(80, 79.73) to find P(Y ≤ k) for any k. The distribution being used needs to be made clear. A1 for P(Y ≤ 66) = 0.0587… (0.0584… from σ2 = 79.73) or P(Y ≤ 65) = 0.0467… (0.0464… from σ2 = 79.73) A1 for both Final A1 not available if 66 and 65 used Or A1 for P(Y ≤ 65.5) = 0.0524… (0.0521… from σ2 = 79.73) or P(Y ≤ 64.5) = 0.0415… (0.0412… from σ2 = 79.73) A1 for both A1 for least value of k = 65, dependent on previous two A marks earned. ADDITIONAL NOTES REGARDING QUESTION 4 (b) Critical Value Method 5 – 1.645 × 0.0072 ÷ √8 gets M1*B1* = 4.9958… gets A1 4.995 < 4.99581.. gets M1dep* for sensible comparison A1 still available for correct conclusion in words & context “Confidence Interval” Method 4.995 + 1.645 × 0.0072 ÷ √8 gets M1* B1* = 4.9991.. gets A1 NOTE that the final M1dep* A1 available only if 1.645 used. 5 > 4.9991… gets M1 A1 still available for correct conclusion in words & context Probability Method Finding P(sample mean < 4.995) = 0.0248 gets M1* A1 B1 0.0248 < 0.05* gets M1dep* for a sensible comparison if a conclusion is made. A1 available for a correct conclusion in words & context. Condone P(sample mean > 4.995) = 0.9752 for M1 but only allow A1 B1 if later compared with 0.95, at which point the final M1and A1 are still available ADDITIONAL NOTE REGARDING OVER-SPECIFICATION OF ANSWERS Over-specification by providing final answers correct to 5 or more significant figures will be penalised. When this applies, candidates may lose no more than 2 marks per question and no more than 4 marks in total. The only exception to this rule is in Question 3 part (iv) – see guidance note.

4767 Mark Scheme January 2013
6
Question Answer Marks Guidance 1 (i)
G1
G2,1,0
G1 For axes suitably labelled with some indication of linear scale provided. G2 for points plotted correctly. G1 if 4 points plotted correctly. G0 if two or more incorrectly plotted/omitted points. Special Case SC1 for points visibly correct on axes where no indication of scale has been provided.
Allow x & y Allow axes reversed.
[3] 1 (ii) Thickness is the independent variable since the values of
‘Thickness’ are not subject to random variation, but are determined by the manufacturer.
E1
Allow explanations referring to thickness being “controlled” by the manufacturer. Allow equivalent interpretations.
[1] 1 (iii) t = 60, h = 1.548
B1 For t and h used. SOI
(e.g. can be implied by b = 0.0206)
b = th
tt
SS
= 2
546.8 (300 7.74 / 5)22000 300 / 5
= 82.44000
= M1* For attempt at calculating gradient (b) for h on t.
0.0206 A1 For 0.0206 cao
OR b = 2
546.8 / 5 (60 1.548)22000 / 5 60
= 16.48800
=
0.0206 hence least squares regression line is: h – h = b(t – t )

4767 Mark Scheme January 2013
7
Question Answer Marks Guidance h – 1.548 = 0.0206 (t – 60) M1
dep*
For equation of line, using their b, b > 0, and passing through their ( t , h )
h = 0.0206 t + 0.312 A1 Final equation must have h as the subject. CAO Allow h = 0.021 t + 0.31, Allow h = 0.021 t + 0.288 NOTE If equation given in terms of y and x then A0 unless x & y defined appropriately
[5] 1 (iv) (A) (0.0206 × 70) + 0.312 = 1.754 B1 Allow 1.75
FT their equation provided b > 0
Likely to be reliable as interpolation E1 [2] 1 (iv) (B) (0.0206 ×120) + 0.312 = 2.784 B1 Allow 2.78
FT their equation provided b > 0
Could be unreliable as extrapolation E1 Condone “reliable as 120 is not too far away from the data used to produce the equation”
[2] 1 (v) Thickness = 40 predicted max height = (0.0206 × 40) + 0.312 = 1.136 M1 For prediction. FT their equation provided b > 0 Residual = 1.09 – 1.136 M1 For difference between 1.09 and prediction. = –0.046 A1 Allow –0.05 [3] 1 (vi) Regression line gives a prediction of
(0.0206 × 200) + 0.312 = 4.432 B1*
B1 for obtaining a prediction from regression equation or from graph
This is well above the observed value. E1 dep*
E1 for noting the large difference between prediction and actual value
It could be that the relationship breaks down for larger thickness, or that the relationship is not linear
E1 E1 for suitable interpretation regarding the relationship between maximum height and thickness
[3]

4767 Mark Scheme January 2013
8
Question Answer Marks Guidance 2 (i) (A)
P(X = 0) = 2.1 0e 2.10!
M1 For calculation
= 0.1225 A1 CAO Allow 0.122 Or from tables P(X = 0) = 0.1225 [2] 2 (i) (B) P(X ≥ 2) = 1 – P(X ≤ 1) = 1 – 0.3796
M1
M1 for use of correct structure. i.e. M0 for use of 1 – P(X ≤2) or 1 – 0.6796 Using λ = 2.0 leading to 1 – 0.4060 gets M1
= 0.6204 A1 CAO Allow 0.6203, 0.620 [2] 2 (i) (C) New λ = 5 2.1 = 10.5 B1 For mean (SOI) P(Between 5 and 10 in 5 mins) = 0.5207 – 0.0211 M1 For P(X ≤10) – P(X ≤4) used. e.g. 1 – 0.9379
leads to B0M1A0
= 0.4996 A1 CAO Allow 0.500, 0.50. Condone 0.5 www. [3] 2 (ii) Mean number in 60 minutes = 60 × 2.1 = 126 Using Normal approx. to the Poisson, B1 For Normal approx. X ~ N(126, 126) B1 For correct parameters (SOI)
P(X ≥ 130) = P 129.5 126126
Z
B1 For correct continuity correction
= P(Z > 0.3118) = 1 – Φ(0.3118) M1 For correct probability structure = 1 – 0.6224 = 0.3776 A1 CAO, (Do not FT wrong or omitted CC).
Allow 0.378www & 0.3775
[5]

4767 Mark Scheme January 2013
9
Question Answer Marks Guidance 2 (iii) (Because if butterflies are blown in pairs,) the events
will no longer be occurring singly. E1
Accept ‘not independent’
[1] 2 (iv) P(3 or fewer) = P(3 or fewer individuals and no pairs) +
P(0 or 1 individual and 1 pair)
M1 For P(0 pairs) (= 0.8187)
= (0.9068 × 0.8187) + (0.4932 × (0.9825 – 0.8187)) M1 For P(1 pair) (= 0.1638 or 0.1637) First two M1s can be awarded
for 0.9825 = (0.9068 × 0.8187) + (0.4932 × 0. 1638) M2 For structure M2 for correct 6 combinations
identified and their probabilities added, M1 for 5 combinations identified and their probabilities added.
= 0.7424 + 0.0808 = 0.8232
Or using D for the number of pairs and S for the number of singles P(D = 0) × P(S = 0) = e–0.2 × e–1.7 = 0.1495… P(D = 0) × P(S = 1) = e–0.2 × 1.7e–1.7 = 0.2542… P(D = 0) × P(S = 2) = e–0.2 × 1.72e–1.7÷2 = 0.2161… P(D = 0) × P(S = 3) = e–0.2 × 1.73e–1.7 ÷ 3! = 0.1224… P(D = 1) × P(S = 0) = 0.2e–0.2 × e–1.7 = 0.0299… P(D = 1) × P(S = 1) = 0.2e–0.2 × 1.7e–1.7 = 0.0508… Or P(D = 0) × P(S = 3) + P(D = 1) × P(S = 1) P(D = 0) × P(S = 2) + P(D = 1) × P(S = 0) P(D = 0) × P(S = 1) P(D = 0) × P(S = 0)
A1 CAO Allow awrt 0.823 P(3 butterflies) (= 0.1733…) P(2 butterflies) (= 0.2460…) P(1 butterfly) (= 0.2542…) P(0 butterflies) (= 0.1495…)

4767 Mark Scheme January 2013
10
Question Answer Marks Guidance Or P(D ≤ 1) × P(S ≤ 1) = 0.98247 × 0.49324 D(D = 0) × P(S = 2) = 0.21613 D(D = 0) × P(S = 3) = 0.12247
[5] 3 (i) (A)
P(X < 450) = P 450 43530
Z
M1 For standardising.
M0 if ‘continuity correction’ applied
= P(Z < 0.5) = Φ(0.5) M1 For correct structure = 0.6915 A1 CAO Allow 0.692 [3] 3 (i) (B) P(400 < X < 450)
= P 400 435 450 43530 30
Z
= P(-1.1667 < X < 0.5) = Φ(0.5) – Φ(–1.1667) M1 For correct structure = 0.6915 – 0.1216 B1 For use of difference column to obtain 0.8784,
0.8783, 0.1216 or 0.1217. Condone 0.8782 or 0.1218
= 0.5699 A1 FT “their 0.6915” – 0.1216 (or 0.1217) [3] 3 (ii) P(all 5 between 400 and 450) = 0.56995 M1 = 0.0601 A1 FT Allow 0.060 [2]

4767 Mark Scheme January 2013
11
Question Answer Marks Guidance 3 (iii) P(Y < 350) = 0.2, P(Y > 390) = 0.1
P(Z < 350
) = 0.2
Φ-1 (0.2) = – 0.8416 350 0.8416
M1 For equation as seen or equivalent with their –ive z
value
If ‘continuity corrections’ applied allow M
P(Z > 390
) = 0.1
marks but do not award final A marks
Φ-1 (0.9) = 1.282 B1 For 1.282 or -0.8416 390 1.282
M1 For equation as seen or equivalent with their +ive z value
350 = µ – 0.8416 σ 390 = µ + 1.282 σ 2.1236 σ = 40 σ = 18.84 A1 Allow 18.8 Answers to max
2 d.p. µ = 350 + (0.8416 × 18.84) = 365.85 A1 Allow 365.86, 366, 365.9 [5] 3 (iv) Φ-1 ( 0.975 ) = 1.96 B1 For using a suitable pair of z values e.g. ± 1.96 a = 365.85 – (1.96 18.84) M1 For either equation provided that a suitable pair of z-
values is used. e.g. +2.326 and –1.751
= 328.9 A1
FT their µ and σ to 2 d.p. (A0 if ‘continuity
correction’ used)
Accept any correct values of
a and b. b = 365.85 + (1.96 18.84) = 402.8 A1 FT their µ and σ to 2 d.p. (A0 if ‘continuity
correction’ used)
[4]

4767 Mark Scheme January 2013
12
Question Answer Marks Guidance 4 (a) H0: no association between grade and hours worked
H1: some association between grade and hours worked;
B1 Hypotheses in context
Less than 5hrs At least 5hrs
A or B 17.05 13.95 C or lower 15.95 13.05
M1 A1
Any row/column correct For expected values (to 2 dp)
Less than 5hrs At least 5hrs
A or B 0.5104 0.6238 C or lower 0.5456 0.6669
M1 A1
For valid attempt at (O-E)2/E. Any row column correct. For all correct
NB These M1A1 marks
cannot be implied by a correct final value of X 2
X 2 = 2.347 B1 Refer to χ1
2 M1 For 1 deg of freedom. No FT from here if wrong. Critical value at 5% level = 3.841 A1 CAO for cv or p-value = 0.1255. SC1 for cv or p-
value if 1 dof not seen.
Result is not significant. There is insufficient evidence to suggest that there is any
association between hours worked and grade. E1 For conclusion in context. NB if H0 H1 reversed, or
‘correlation’ mentioned, do not award first B1 or final E1
[9]

4767 Mark Scheme January 2013
13
Question Answer Marks Guidance 4 (b) x = 417.79 B1 For x
H0: μ = 420; B1 For use of 420 in hypotheses. Hypotheses in words must refer to population. Do not allow alternative symbols unless clearly defined as the population mean.
H1 : μ ≠ 420 B1 For both correct Where μ denotes the mean volume of the cans of tomato purée
(in the population) B1 For definition of μ. Condone omission of
“population” if correct notation μ is used, but if μ is defined as the sample mean then award B0.
Test statistic = 417.79 420 2.21 1.997
1.1073.5 / 10
M1* A1
must include √10 FT their
Lower 1% level 2 tailed critical value of z = – 2.576
B1* For –2.576 Must be –2.576 unless it is clear that absolute values are being used.
–1.997 > – 2.576 So not significant. There is insufficient evidence to reject H0
M1 dep*
For sensible comparison leading to a conclusion.
There is insufficient evidence to suggest that the average volumes of the cans of tomato purée is not 420ml
A1 For conclusion in words in context provided that correct cv used. FT only candidate’s test statistic.
[9]

4767 Mark Scheme January 2013
14
ADDITIONAL NOTES REGARDING QUESTION 4 (b) Critical Value Method 420 – 2.576 × 3.5 ÷ √10 gets M1*B1* = 417.148… gets A1 417.79 > 417.148.. gets M1dep* for sensible comparison A1 still available for correct conclusion in words & context Confidence Interval Method CI centred on 417.79 + or – 2.5756 × 3.5 ÷ √10 gets M1* B1* = (414.93…, 420.64..) gets A1 NOTE that the final M1dep* A1 available only if 2.576 used. “Contains 420” gets M1dep* A1 still available for correct conclusion in words & context Probability Method Finding P(sample mean < 417.79) = 0.0229 gets M1* A1 B1* 0.0229 > 0.005* gets M1dep* for a sensible comparison if a conclusion is made. A1 available for a correct conclusion in words & context. Condone P(sample mean > 417.79) = 0.9771 for M1* but only allow A1 B1* if sensible comparison made, at which point the final M1dep* and A1 are still available ADDITIONAL NOTE REGARDING OVER-SPECIFICATION OF ANSWERS Over-specification by providing final answers correct to 5 or more significant figures will be penalised. When this applies, candidates may lose no more than 2 marks per question and no more than 4 marks in total. The only exception to this rule is in Question 3 parts (iii) & (iv) – see guidance notes.

4767 Mark Scheme June 2013
8
Question Answer Marks Guidance 1 (i) EITHER:
Sxy = 1xy x yn
= 40.66 – 160
× 43.62 × 55.15
= 0.56595
M1*
For method for Sxy
Sxx = 22 1x x
n = 32.68 – 1
60× 43.622
= 0.96826
M1*
For method for at least one of Sxx or Syy
Syy = 22 1y y
n = 51.44 – 1
60× 55.152
= 0.74796
A1
For at least one of Sxy, Sxx or Syy (to 2 sf) Note Allow 0.57322 for Sxy and 0.76634 for Syy from rounding mean of y to 0.919.
r = xy
xx yy
SS S
= 0.565950.96826 0.74796
= 0.665 M1
dep* A1
For structure of r For answer rounding to 0.66 or 0.67
OR: [5]
cov(x,y) = xy
x yn
= 40.66/60 – (43.62/60 55.15/60)
= 0.0094325
M1*
For method for cov (x,y)
rmsd(x) = xxS
n= √(0.96826/60) = √0.016137… = 0.1270
M1*
A1
For method for at least one msd or rmsd
For at least one of cov (x,y), msd or rmsd correct (to 2 sf)
rmsd(y) = yyS
n= √(0.74796/60) = √0.012466 = 0.1117
r = cov( , )
rmsd( )rmsd( )x y
x y = 0.0094325
0.1270 0.1117 = 0.665
M1 dep*
For structure of r
A1 For answer rounding to0.66 or 0.67
[5]
Methods mixed – max M0M1A1M0A0

4767 Mark Scheme June 2013
9
Question Answer Marks Guidance 1 (ii) H0: ρ = 0
H1: ρ > 0 (one-tailed test) B1 For H0, H1 in symbols. Hypotheses in words must
refer to population. Do not allow alternative symbols unless clearly defined as the population correlation coefficient.
where ρ is the population correlation coefficient B1 For defining ρ. Condone omission of “population” if correct notation ρ is used, but if ρ is defined as the sample correlation coefficient then award B0. Allow “ρ is the pmcc”.
For n = 60, 5% critical value = 0.2144
B1 For critical value
Since 0.665 > 0.2144, the result is significant. M1 For sensible comparison leading to a conclusion provided that |r| < 1. The comparison can be in the form of a diagram as long as it is clear and unambiguous. Sensible comparison: e.g. 0.665 > 0.2144 is ‘sensible’ whereas 0.665 > - 0.2144 is ‘not sensible’. Reversed inequality sign e.g. 0.665 < 0.2144 etc. gets max M1 A0.
Thus we have sufficient evidence to reject H0 A1 For reject H0 o.e. FT their r and critical value from 5% 1-tail column.
There is sufficient evidence at the 5% level to suggest that there is positive correlation between FEV1 before and after the two-week course.
E1 For correct, non-assertive conclusion in context (allow ‘x and y’ for context). E0 if H0 and H1 not stated, reversed or mention a value other than zero for ρ in H0.
[6]

4767 Mark Scheme June 2013
10
Question Answer Marks Guidance 1 (iii) The underlying population must have a bivariate
Normal distribution. B1 Condone “bivariate Normal distribution”,
“underlying bivariate Normal distribution”, but do not allow “the data have a bivariate Normal distribution”
Yes, since the scatter diagram appears to have a roughly elliptical shape.
E1 Condone ‘oval’ or suitable diagram
[2] 1 (iv) The significance level is the probability of
rejecting the null hypothesis when in fact it is true.
E1*
E1dep*
For “probability of rejecting H0” or “probability of a significant result”. For “when H0 is true”
[2] 1 (v) ∑x = 43.62 + 0.45 = 44.07
∑y= 55.15 – 0.45 = 54.70 ∑xy = 40.66
B1
For ∑x or ∑y or ∑xy
∑x2 = 32.68 + 1 – 0.552 = 33.3775 ∑y2= 51.44 – 1 + 0.552 = 50.7425
B1
For ∑x2 or ∑y2 (to 2 dp)
B1
For all correct (ignore n)
[3] 2 (i) P(At least one has red hair) = 1 – 0.9710
= 0.263 M1 A1
M1 for 1 – 0.9710 Allow 0.26
[2] 2 (ii) (Because X is binomially distributed), n is large
and p is small. E1 E1
Allow “sample is large” for n is large Allow “np < 10” or “mean ≈ variance” for “p is small” Do not allow “the probability is small”
Mean = 1.8 B1 [3]

4767 Mark Scheme June 2013
11
Question Answer Marks Guidance 2 (iii) (A)
P(X = 2) = 2
1.8 1.82!
e = 0.2678
OR = 0.7306 – 0.4628 = 0.2678
M1 A1
For calculation for P(X = 2) FT their mean. Allow answer to 3sf.
[2] 2 (iii) (B) P(X > 2) = 1 – P(X ≤ 2) = 1 – 0.7306
= 0.2694 M1 A1
1 – P(X ≤ 2) used. e.g.1 – P(X ≤ 2) = 1 – 0.4628 gets M0 CAO
[2] 2 (iv) The mean (np = 1.8) is too small
It is not appropriate to use a Normal approximation
E1* E1dep*
For “mean is too small” or “mean < 10” For “not appropriate”. Do not allow “p is too small”.
[2] 2 (v) Binomial(5000, 0.03) B1*
B1dep*For binomial, or B( , ) For parameters
[2] 2 (vi) Mean 5000 × 0.03 = 150 B1 For mean (soi) Variance = 5000 × 0.03 × 0.97 = 145.5 B1 For variance (soi) Using Normal approx. to the binomial,
X ~ N(150, 145.5)
P(X ≥ 160) = P 159.5 150
145.5Z
B1
For continuity corr.
= P(Z > 0.7876) = 1 – Φ(0.7876) = 1 – 0.7846
M1 For probability using correct tail and structure (condone omission of/incorrect c.c.)
= 0.215 (to 3 sig.fig.)
A1 CAO, (Do not FT wrong or omitted CC) Allow 0.2155. Do not allow 0.216
[5]

4767 Mark Scheme June 2013
12
Question Answer Marks Guidance 3 (i)
P(Y = 76) = P 75.5 76 76.5 7612 12
Z
B1
For one correct continuity correction used
= P(–0.04166… < Z < 0.04166…) = Φ(0.04166…) – (1 – Φ(0.04166…))
M1
For standardizing
= 2 × Φ(0.04166…) – 1 = 2 × 0.5167 – 1
M1
For correctly structured probability calculation.
= 0.0334 A1 CAO inc use of diff tables. Allow 0.0330 – 0.0340 www.
[4] 3 (ii)
P(Y ≥ 80) = P 79.5 7612
Z
B1 For correct cc used
= P(Z > 0.2917) = 1 – Φ(0.2917) M1 For correct structure = 1 – 0.6148 = 0.3852 = 0.385 to 3 sig fig A1 CAO do not allow 0.386 [3] 3 (iii) 3 × 0.3852 × 0.61482 = 0.4368
M1 A1
3 × their p × (1 – their p)2
FT their p. Allow 2sf if working seen.
[2]

4767 Mark Scheme June 2013
13
Question Answer Marks Guidance 3 (iv) EITHER: P(Score ≥ k) = 0.1 Φ-1 (0.9) = 1.282 B1 For 1.282
12
76k = 1.282
M1
Allow k – 0.5 used for k. Positive z used.
k = 76 + (1.282 × 12) = 91.38 or k = 76 + 0.5 + (1.282 × 12) = 91.88
A1
For 91.38 or 91.88
91.38 > 90.5 or 91.88 > 91 M1 Relevant comparison (e.g. diagram) www so lowest reported mark = 92 A1 OR Trial and improvement method
P(Mark ≥ 91) = P(Score ≥ 90.5) = 0.1135 P(Mark ≥ 92) = P(Score ≥ 91.5) = 0.0982 P(Mark ≥ 91) > 10% and P(Mark ≥ 92) < 10% so lowest reported mark = 92
M1 A1 A1 M1 A1
M1 for attempt to find P(Mark ≥ integer) A1 for 0.1135 A1 for 0.0982 M1 for comparisons
www
[5] 3 (v) P(Y ≤ 50) = 0.2
P(Z ≤ 50.512
) = 0.2
B1
For 50.5 used
50.512
= Φ-1 (0.2) = –0.8416 B1
M1
For –0.8416. Condone – 0.842 Condone 0.8416 if numerator reversed. For structure.
µ = 50.5 + (12 × 0.8416) = 60.6 A1 CAO [4]

4767 Mark Scheme June 2013
14
Question Answer Marks Guidance 4 (i) H0: no association between sex and artist preferred
H1: some association between sex and artist preferred B1 For both hypotheses in context
EXPECTED Monet Renoir Degas Cézanne Male 12.13 28 13.07 16.8 Female 13.87 32 14.93 19.2
M1 A2
For expected values (to 2 dp where appropriate) (allow A1 for at least one row or column correct)
CONTRIB’N Monet Renoir Degas Cézanne Male 1.4081 0.3214 1.8626 0.2881
Female 1.2321 0.2813 1.6298 0.2521
M1 A2
For valid attempt at (O–E)2/E For all correct (to 2 dp) and presented in a table or clear list. (Allow A1 for at least one row or column correct)
NB:These three marks cannot be implied by a correct final value of X 2
X 2 = 7.28 B1 Allow 7.27 www Refer to χ3
2 B1
for 3 deg of f
Critical value at 10% level = 6.251 B1
CAO for cv No FT from here if wrong or omitted, unless p-value used instead
B1 for p-value = 0.0636
Result is significant B1
FT their X2
There is evidence to suggest that there is some association between sex and artist preferred NB if H0 H1 reversed, or ‘correlation’ mentioned, do not award first B1 or final E1
E1
[12]
For correct (FT their X2), non-assertive conclusion, in context.

4767 Mark Scheme June 2013
15
Question Answer Marks Guidance 4 (ii) Monet: More females and fewer males than expected
prefer Monet, as indicated by large contribution(s) (of 1.4081 and 1.2321).
E1* E1dep*
FT their table of contributions NB MAX 3/6 for answers not referring to contributions (explicitly or implicitly).
Renoir: Preferences are much as expected, as indicated by small contributions.
E1
Degas: Fewer females and more males than expected prefer Degas, as indicated by large contribution(s) (of 1.8626 and 1.6298).
E1* depE1*
Cézanne: Preferences are much as expected, as indicated by small contributions.
E1 SC1 Renoir and Cézanne have correct comments for both but without referring to contributions
[6]

4767 Final Mark Scheme June 2014
1
1. Annotations and abbreviations
Annotation in scoris Meaning
Blank Page – this annotation must be used on all blank pages within an answer booklet (structured or unstructured) and on each page of an additional object where there is no candidate response.
and BOD Benefit of doubt FT Follow through ISW Ignore subsequent working M0, M1 Method mark awarded 0, 1 A0, A1 Accuracy mark awarded 0, 1 B0, B1 Independent mark awarded 0, 1 SC Special case ^ Omission sign MR Misread Highlighting Other abbreviations in mark scheme
Meaning
E1 Mark for explaining U1 Mark for correct units G1 Mark for a correct feature on a graph M1 dep* Method mark dependent on a previous mark, indicated by * cao Correct answer only oe Or equivalent rot Rounded or truncated soi Seen or implied www Without wrong working

4767 Final Mark Scheme June 2014
2
2. Subject-specific Marking Instructions for GCE Mathematics (MEI) Statistics strand a Annotations should be used whenever appropriate during your marking.
The A, M and B annotations must be used on your standardisation scripts for responses that are not awarded either 0 or full marks. It is vital that you annotate standardisation scripts fully to show how the marks have been awarded. For subsequent marking you must make it clear how you have arrived at the mark you have awarded.
b An element of professional judgement is required in the marking of any written paper. Remember that the mark scheme is designed to assist in marking incorrect solutions. Correct solutions leading to correct answers are awarded full marks but work must not be judged on the answer alone, and answers that are given in the question, especially, must be validly obtained; key steps in the working must always be looked at and anything unfamiliar must be investigated thoroughly. Correct but unfamiliar or unexpected methods are often signalled by a correct result following an apparently incorrect method. Such work must be carefully assessed. When a candidate adopts a method which does not correspond to the mark scheme, award marks according to the spirit of the basic scheme; if you are in any doubt whatsoever (especially if several marks or candidates are involved) you should contact your Team Leader.
c The following types of marks are available. M A suitable method has been selected and applied in a manner which shows that the method is essentially understood. Method marks are not usually lost for numerical errors, algebraic slips or errors in units. However, it is not usually sufficient for a candidate just to indicate an intention of using some method or just to quote a formula; the formula or idea must be applied to the specific problem in hand, eg by substituting the relevant quantities into the formula. In some cases the nature of the errors allowed for the award of an M mark may be specified. A Accuracy mark, awarded for a correct answer or intermediate step correctly obtained. Accuracy marks cannot be given unless the associated Method mark is earned (or implied). Therefore M0 A1 cannot ever be awarded. B Mark for a correct result or statement independent of Method marks.

4767 Final Mark Scheme June 2014
3
E A given result is to be established or a result has to be explained. This usually requires more working or explanation than the establishment of an unknown result.
Unless otherwise indicated, marks once gained cannot subsequently be lost, eg wrong working following a correct form of answer is ignored. Sometimes this is reinforced in the mark scheme by the abbreviation isw. However, this would not apply to a case where a candidate passes through the correct answer as part of a wrong argument.
d When a part of a question has two or more ‘method’ steps, the M marks are in principle independent unless the scheme specifically says otherwise; and similarly where there are several B marks allocated. (The notation ‘dep *’ is used to indicate that a particular mark is dependent on an earlier, asterisked, mark in the scheme.) Of course, in practice it may happen that when a candidate has once gone wrong in a part of a question, the work from there on is worthless so that no more marks can sensibly be given. On the other hand, when two or more steps are successfully run together by the candidate, the earlier marks are implied and full credit must be given.
e The abbreviation ft implies that the A or B mark indicated is allowed for work correctly following on from previously incorrect results. Otherwise, A and B marks are given for correct work only — differences in notation are of course permitted. A (accuracy) marks are not given for answers obtained from incorrect working. When A or B marks are awarded for work at an intermediate stage of a solution, there may be various alternatives that are equally acceptable. In such cases, exactly what is acceptable will be detailed in the mark scheme rationale. If this is not the case please consult your Team Leader. Sometimes the answer to one part of a question is used in a later part of the same question. In this case, A marks will often be ‘follow through’. In such cases you must ensure that you refer back to the answer of the previous part question even if this is not shown within the image zone. You may find it easier to mark follow through questions candidate-by-candidate rather than question-by-question.
f Wrong or missing units in an answer should not lead to the loss of a mark unless the scheme specifically indicates otherwise. Candidates are expected to give numerical answers to an appropriate degree of accuracy. 3 significant figures may often be the norm for this, but this always needs to be considered in the context of the problem in hand. For example, in quoting probabilities from Normal tables, we generally expect some evidence of interpolation and so quotation to 4 decimal places will often be appropriate. But even this does not always apply – quotations of the standard critical points for significance tests such as 1.96, 1.645, 2.576 (maybe even 2.58 – but not 2.57) will commonly suffice, especially if the calculated value of a test statistic is nowhere near any of these values. Sensible discretion must be exercised in such cases. Discretion must also be exercised in the case of small variations in the degree of accuracy to which an answer is given. For example, if 3 significant figures are expected (either because of an explicit instruction or because the general context of a problem demands it) but only 2 are given, loss of an accuracy ("A") mark is likely to be appropriate; but if 4 significant figures

4767 Final Mark Scheme June 2014
4
are given, this should not normally be penalised. Likewise, answers which are slightly deviant from what is expected in a very minor manner (for example a Normal probability given, after an attempt at interpolation, as 0.6418 whereas 0.6417 was expected) should not be penalised. However, answers which are grossly over- or under-specified should normally result in the loss of a mark. This includes cases such as, for example, insistence that the value of a test statistic is (say) 2.128888446667 merely because that is the value that happened to come off the candidate's calculator. Note that this applies to answers that are given as final stages of calculations; intermediate working should usually be carried out, and quoted, to a greater degree of accuracy to avoid the danger of premature approximation. The situation regarding any particular cases where the accuracy of the answer may be a marking issue should be detailed in the mark scheme rationale. If in doubt, contact your Team Leader.
g Rules for replaced work If a candidate attempts a question more than once, and indicates which attempt he/she wishes to be marked, then examiners should do as the candidate requests.
If there are two or more attempts at a question which have not been crossed out, examiners should mark what appears to be the last (complete) attempt and ignore the others. NB Follow these maths-specific instructions rather than those in the assessor handbook.
h Genuine misreading (of numbers or symbols, occasionally even of text) occurs. If this results in the object and/or difficulty of the question being considerably changed, it is likely that all the marks for that question, or section of the question, will be lost. However, misreads are often such that the object and/or difficulty remain substantially unaltered; these cases are considered below. The simple rule is that all method ("M") marks [and of course all independent ("B") marks] remain accessible but at least some accuracy ("A") marks do not. It is difficult to legislate in an overall sense beyond this global statement because misreads, even when the object and/or difficulty remains unchanged, can vary greatly in their effects. For example, a misread of 1.02 as 10.2 (perhaps as a quoted value of a sample mean) may well be catastrophic; whereas a misread of 1.6748 as 1.6746 may have so slight an effect as to be almost unnoticeable in the candidate's work. A misread should normally attract some penalty, though this would often be only 1 mark and should rarely if ever be more than 2. Commonly in sections of questions where there is a numerical answer either at the end of the section or to be obtained and commented on (eg the value of a test statistic), this answer will have an "A" mark that may actually be designated as "cao" [correct answer only]. This should be interpreted strictly – if the misread has led to failure to obtain this value, then this "A" mark must be withheld even if all method marks have been earned. It will also often be the case that such a mark is implicitly "cao"

4767 Final Mark Scheme June 2014
5
even if not explicitly designated as such. On the other hand, we commonly allow "fresh starts" within a question or part of question. For example, a follow-through of the candidate's value of a test statistic is generally allowed (and often explicitly stated as such within the marking scheme), so that the candidate may exhibit knowledge of how to compare it with a critical value and draw conclusions. Such "fresh starts" are not affected by any earlier misreads. A misread may be of a symbol rather than a number – for example, an algebraic symbol in a mathematical expression. Such misreads are more likely to bring about a considerable change in the object and/or difficulty of the question; but, if they do not, they should be treated as far as possible in the same way as numerical misreads, mutatis mutandis. This also applied to misreads of text, which are fairly rare but can cause major problems in fair marking. The situation regarding any particular cases that arise while you are marking for which you feel you need detailed guidance should be discussed with your Team Leader. Note that a miscopy of the candidate’s own working is not a misread but an accuracy error.

4767 Mark Scheme June 2014
6
Question Answer Marks Guidance
1 (i)
Diastolic 60 61 62 63 73 76 84 87 90 95
Systolic 98 121 118 114 108 112 132 130 134 139
Rank dias 1 2 3 4 5 6 7 8 9 10
Rank sys 1 6 5 4 2 3 8 7 9 10
d 0 4 2 0 -3 -3 1 -1 0 0
d2 0 16 4 0 9 9 1 1 0 0
M1 For attempt at ranking (allow all ranks reversed)
M1 For d2
Σd2 = 40 A1 For 40 soi e.g. can be implied by 0.242 seen.
2
2
6 6 40 2401 1 1 1 0.242
10 99 990( 1)
ds
n nr
M1 For method for rs using their Σd2
= 0.758 (to 3 s.f.) [ allow 0.76 to 2 s.f.]
A1 For 0.758 or 25/33 or 0.75 recurring
f.t. their Σd2 provided |rs| < 1
Do not allow 0.7575
NB No ranking scores 0/5
[5]

4767 Mark Scheme June 2014
7
Question Answer Marks Guidance
1 (ii)
H0: no association between diastolic blood pressure and systolic blood pressure
in the population of young adults
B1
H1: positive association between diastolic blood pressure and systolic blood
pressure in the population of young adults
B1 NB Hypotheses must be in context.
H0: no association,
H1: positive association, earns SC1
Hypotheses must not be given in terms of ρ or
mention correlation. Ignore references to ρ if
hypotheses also given in words.
B1 For population of young adults seen at least
once. Do not allow underlying population.
B0 for population correlation coefficient.
One tail test critical value at 5% level is 0.5636 B1* for 0.5636
cv from pmcc test = 0.5494 gets B0
Since 0.758 > 0.5636, there is sufficient evidence to reject H0,
M1dep*
For a sensible comparison, leading to a conclusion,
of their rs with 0.5636, provided 0 < rs< 1
The comparison may be in the form of a diagram.
i.e. conclude that there is sufficient evidence to suggest that there is positive
association between diastolic blood pressure and systolic blood pressure (in the
population of young adults).
A1
For non-assertive, correct conclusion in context.
f.t. their rs. Allow “support” in place of “suggest”.
Do not allow “show”, “imply”, “conclude” or
”prove” in place of “suggest”.
If a two-tailed test is carried out then award
maxB1B0B1B1(for 0.6485)M0A0
[6]
1 (iii) The scatter diagram does not appear to be roughly elliptical
so the (population) may not have a bivariate Normal distribution.
E1 For not elliptical. Allow “not oval”.
E1 For not bivariate Normal.
Do not allow “not Normal bivariate”.
Do not allow “the data does not have a bivariate
Normal distribution”.
[2]

4767 Mark Scheme June 2014
8
Question Answer Marks Guidance
1 (iv) H0: ρ = 0
H1: ρ > 0
B1
Do not allow other symbols unless clearly defined
as population correlation coefficient.
Do not allow hypotheses solely in words.
where ρ is the (population) correlation coefficient B1 For defining ρ
For n = 10, 1% critical value = 0.7155 B1* For 0.7155
Since 0.707 < 0.7155 the result is not significant M1dep*
For sensible comparison leading to a conclusion.
Conclusion soi.
There is insufficient evidence at the 1% level to suggest that there is positive
correlation between diastolic blood pressure and systolic blood pressure (in this
population).
A1
For non-assertive correct conclusion in context.
If a two-tailed test is carried out then award
maxB0B1B1(for 0.7646)M0A0
[5]
2 (i) ‘Independently’ means that the occurrence of one defect does not affect the
probability of another defect occurring.
E1 Allow e.g. “event” for “defect”
Poisson distribution E1 Allow Po(…)
[2]
2 (ii)
P( 2 defects ) =
1.7 2e 1.7
2!
OR from tables P( 2 defects) = 0.7572 – 0.4932
M1
For calculation of P(X = 2)
= 0.2640 A1 CAO Allow 0.264
Do not allow 0.2639
[2]

4767 Mark Scheme June 2014
9
Question Answer Marks Guidance
2 (iii) New λ = 7 1.7 = 11.9 B1 For mean (SOI)
P(12 defects) =
11.9 12e 11.9
12!
M1 For calculation with their λ ≠ 1.7
= 0.1143 cao A1
Allow 0.114 www
Note B0M1A0 for 0.114 from use of λ = 11.7
[3]
2 (iv) New λ = (2 × 1.7) + (2 × 0.8) = 5.0 B1* For new mean = 5 seen
P(At least 8 defects) = 1 – P(7 or fewer defects)
= 1 – 0.8666
B1*
B1dep*
For 1 – P(X ≤ 7) or 1 - P(X < 8) seen
For 1 – 0.8666 seen
(= 0.1334) NB Answer given
[3]
2 (v) Binomial(100, 0.1334) or B(100, 0.1334) B1* For binomial.
B1dep* For parameters
[2]
2 (vi) Mean = 13.34 B1 For mean (soi)
Variance = 100 × 0.1334 × 0.8666 = 11.56 B1 For variance (soi)
Using Normal approx. to the binomial,
X ~ N(13.34, 11.56)
For B(13.34, 11.56) seen, award B0B0 unless used
correctly as part of a Normal calculation.
P(X ≥ 20) = P19.5 13.34
11.56Z
= P(Z > 1.812) = 1 – Φ(1.812) = 1 – 0.9650
B1 For 19.5 seen
M1 For probability using correct tail and a sensible
calculation with their mean and variance.
e.g. using standard deviation = 11.56 or finding
P(Z < 1.812) gets M0A0
= 0.035 A1 CAO, (Do not FT wrong or omitted CC)
[5]

4767 Mark Scheme June 2014
10
Question Answer Marks Guidance
3 (i)
P(X > 135) = P135 130.5
11.84Z
M1
For standardising.
Penalise use of “continuity corrections”
= P(Z > 1.308) = 1 - Φ(1.308) = 1 – 0.9045 M1 For correct structure
i.e. finding the area to the right of their z
=0.0955 (3s.f.) A1 CAO inc use of diff tables
Allow 0.0954 and 0.0956
If numerator reversed, give BOD only if
P(Z < –1.308) is used
[3]
3 (ii) From tables Φ-1
( 0.99 ) = 2.326 B1 ±2.326 or (better) seen, not ±2.33
130.52.326
11.84
koe
M1 For sensible equation in k with their z value.
Note that use of z = 0.8389 from Φ (0.99) gets
B0M0A0, as 0.8389 is clearly a probability.
Allow use of -2.326 (or their negative z) with
numerator reversed.
Condone use of σ = 11.84 if also used in
part (i).
Condone use of “k ± 0.5” for k in equation.
0/3 for trial and improvement
130.5 2.326 11.84k = 138.50
A1 CAO
Allow 138.504. Accept 138.5
Do not accept final answers of 139 or 138.
[3]

4767 Mark Scheme June 2014
11
Question Answer Marks Guidance
3 (iii)
P(Wing length = 131) = P130.5 130.5 131.5 130.5
11.84 11.84Z
B1
For both limits correct, soi.
e.g. use of 0.5 in probability calculation implies
correct lower limit.
= P(0 < Z < 0.2906)
= Φ(0. 2906) – Φ(0)
= 0.6143 – 0.5
M1
For correct structure using their standardised
values. i.e. Finding the area between their z
values found using µ = 130.5
Condone use of σ = 11.84 if also used in part (i) or
part (ii).
= 0.1143 A1 CAO inc use of diff tables
Allow 0.1145
Allow 0.114 www
[3]

4767 Mark Scheme June 2014
12
Question Answer Marks Guidance
3 (iv) H0: μ = 130.5
H1 : μ > 130.5
B1 For both correct
Hypotheses in words must refer to population.
Do not allow other symbols unless clearly defined
as population mean
Where μ denotes the mean wing length (in the population) (of Scandinavian
male blackbirds).
B1 For definition of μ in context.
Do not allow “sample mean wing length”
or “mean wing length of English blackbirds”
Test statistic =
132.4 130.5 1.90
0.769411.84 / 20
M1* must include √20
Condone use of σ = 11.84 if also used in part (i),
part (ii) or part (iii).
Condone numerator reversed for
max M1*A0B1M0depA0A0 (max 4/8)
= 2.469 A1 Allow 2.47
Upper 5% level 1 tailed critical value of z = 1.645
B1 For 1.645. Must be positive.
B0 if -1.645 seen.
No further A marks from here if wrong.
2.469 > 1.645 M1dep* For sensible comparison leading to a conclusion.
The result is significant. There is sufficient evidence to reject H0 A1 For correct conclusion. e.g. for “significant” oe
FT only candidate’s test statistic if cv = 1.645
There is sufficient evidence to suggest that the mean wing length (of this
population of birds) is greater (than 130.5mm).
A1 For non-assertive conclusion in context,
consistent with their result
Condone use of “average” for “mean”
FT only candidate’s test statistic if cv = 1.645
[8]

4767 Mark Scheme June 2014
13
Question Answer Marks Guidance
3 (v) With a 10% significance level rather than a 5% significance level,
Advantage: One is less likely to accept the null hypothesis when it is false. E1 Accept equivalent wording.
Disadvantage: One is more likely to reject the null hypothesis when it is true. E1 Note – Unless stated otherwise, assume the first
comment relates to an advantage and the second
comment relates to a disadvantage.
[2]

4767 Mark Scheme June 2014
14
Question Answer Marks Guidance
4 (i) H0: no association between age and working days lost
H1: some association between age and working days lost
EXPEC
TED 0 to 4 5 to 9 10 or more
Under
35 24.47 28.39 9.14
35 to 50 26.84 31.14 10.02
Over 50 23.68 27.47 8.84
B1 For hypotheses, at least one of which is in context.
Allow hypotheses in terms of independence, in
context.
Do not allow “relationship” or “correlation” for
“association”
B1 For at least one row/column of expected values
correct (to 1 d.p.)
Seen or implied by contributions
B1 All correct (to 2 d.p.). Accept fraction equivalents.
Seen or implied by contributions
CONTRIB
’N
0 to 4 5 to 9 10 or more
Under 35 1.7404 0.0680 2.8880
35 to 50 0.0499 0.0239 0.4076
Over 50 2.4931 0.0101 5.7945
M1 For valid attempt at (O-E)2/E
Seen or implied by at least one correct
contribution to 2 d.p.. Allow 5.80 for last cell.
Condone values in a list.
A1 For all correct to 2 d.p. or better.
Allow 5.80 for last cell. Condone values in a list.
NB: These two marks cannot be implied by a
correct final value of X 2
X 2 = 13.48 B1 For answers rounding to 13.48. Do not penalize
over-specification here.
Refer to 2
4 B1 For 4 degrees of freedom.
Critical value at 1% level = 13.28 B1 No further marks from here if incorrect.
13.48 > 13.28 so result is significant
B1* For significant oe
FT their test statistic
There is evidence to suggest that there is some association between age and
working days lost
E1dep* For non-assertive conclusion in context
Allow conclusion in terms of independence
FT their test statistic
NB if H0 H1 reversed, or ‘correlation’ mentioned,
do not award final E1
[10]

4767 Mark Scheme June 2014
15
Question Answer Marks Guidance
4 (ii) The large contribution/contribution of 2.4931 implies that there are fewer
employees than expected who lose 0 to 4 working days.
The small contribution/contribution of 0.0101 implies that there are about as
many as expected who lose 5 to 9 working days.
E1 For correct interpretation with reference to
contribution for 0 to 4 working days
E1 For correct interpretation with reference to
contribution for 5 to 9 working days
The large contribution/contribution of 5.7945 implies that there are more
employees than expected who lose more than 10 working days.
E1 For correct interpretation with reference to
contribution for more than 10 working days
SC1 if all interpretations are correct but with no
reference to contributions. i.e. max 1 out of 3
[3]
4 (iii) Critical value at 1% level = 9.21 B1* CAO for cv
7.08 < 9.21 so the result is not significant oe B1dep* For correct conclusion
There is insufficient evidence to suggest that there is an association between age
and working days lost.
E1dep* For non-assertive conclusion in context
[3]
4 (iv) Conclusion in (iii) is valid if only categorizing working days lost into ‘0 to 4’
and ‘5 or more’.
However, if ‘5 or more’ is subdivided into ‘5 to 9’ and ‘10 or more’, this
additional subdivision gives the data more precision and allows the relationship
in part (i) to be revealed.
E1 As written,
or for explaining that combining/subdividing
groups leads to a different result.
E1 For subdivision allows relationship to be revealed
or gives more precision/sensitivity/detail.
Allow subdivision gives “a more reliable test” but
not “a more accurate test”
For both to be awarded, wording must be clear.
[2]

GCE
Mathematics (MEI) Unit 4767: Statistics 2 Advanced GCE
Mark Scheme for June 2015
Oxford Cambridge and RSA Examinations

OCR (Oxford Cambridge and RSA) is a leading UK awarding body, providing a wide range of qualifications to meet the needs of candidates of all ages and abilities. OCR qualifications include AS/A Levels, Diplomas, GCSEs, Cambridge Nationals, Cambridge Technicals, Functional Skills, Key Skills, Entry Level qualifications, NVQs and vocational qualifications in areas such as IT, business, languages, teaching/training, administration and secretarial skills. It is also responsible for developing new specifications to meet national requirements and the needs of students and teachers. OCR is a not-for-profit organisation; any surplus made is invested back into the establishment to help towards the development of qualifications and support, which keep pace with the changing needs of today’s society. This mark scheme is published as an aid to teachers and students, to indicate the requirements of the examination. It shows the basis on which marks were awarded by examiners. It does not indicate the details of the discussions which took place at an examiners’ meeting before marking commenced. All examiners are instructed that alternative correct answers and unexpected approaches in candidates’ scripts must be given marks that fairly reflect the relevant knowledge and skills demonstrated. Mark schemes should be read in conjunction with the published question papers and the report on the examination. OCR will not enter into any discussion or correspondence in connection with this mark scheme. © OCR 2015

4767 Mark Scheme June 2015
Annotations and abbreviations Annotation in scoris Meaning and BOD Benefit of doubt FT Follow through ISW Ignore subsequent working M0, M1 Method mark awarded 0, 1 A0, A1 Accuracy mark awarded 0, 1 B0, B1 Independent mark awarded 0, 1 SC Special case ^ Omission sign MR Misread Highlighting Other abbreviations in mark scheme
Meaning
E1 Mark for explaining U1 Mark for correct units G1 Mark for a correct feature on a graph M1 dep* Method mark dependent on a previous mark, indicated by * cao Correct answer only oe Or equivalent rot Rounded or truncated soi Seen or implied www Without wrong working awrt Answers which round to
3

4767 Mark Scheme June 2015
Subject-specific Marking Instructions for GCE Mathematics (MEI) Statistics strand
a Annotations should be used whenever appropriate during your marking.
The A, M and B annotations must be used on your standardisation scripts for responses that are not awarded either 0 or full marks. It is vital that you annotate standardisation scripts fully to show how the marks have been awarded. For subsequent marking you must make it clear how you have arrived at the mark you have awarded.
b An element of professional judgement is required in the marking of any written paper. Remember that the mark scheme is designed to assist in marking incorrect solutions. Correct solutions leading to correct answers are awarded full marks but work must not be judged on the answer alone, and answers that are given in the question, especially, must be validly obtained; key steps in the working must always be looked at and anything unfamiliar must be investigated thoroughly. Correct but unfamiliar or unexpected methods are often signalled by a correct result following an apparently incorrect method. Such work must be carefully assessed. When a candidate adopts a method which does not correspond to the mark scheme, award marks according to the spirit of the basic scheme; if you are in any doubt whatsoever (especially if several marks or candidates are involved) you should contact your Team Leader.
c The following types of marks are available. M A suitable method has been selected and applied in a manner which shows that the method is essentially understood. Method marks are not usually lost for numerical errors, algebraic slips or errors in units. However, it is not usually sufficient for a candidate just to indicate an intention of using some method or just to quote a formula; the formula or idea must be applied to the specific problem in hand, eg by substituting the relevant quantities into the formula. In some cases the nature of the errors allowed for the award of an M mark may be specified. A Accuracy mark, awarded for a correct answer or intermediate step correctly obtained. Accuracy marks cannot be given unless the associated Method mark is earned (or implied). Therefore M0 A1 cannot ever be awarded. B Mark for a correct result or statement independent of Method marks.
4

4767 Mark Scheme June 2015
E A given result is to be established or a result has to be explained. This usually requires more working or explanation than the establishment of an unknown result. Unless otherwise indicated, marks once gained cannot subsequently be lost, eg wrong working following a correct form of answer is ignored. Sometimes this is reinforced in the mark scheme by the abbreviation isw. However, this would not apply to a case where a candidate passes through the correct answer as part of a wrong argument.
d When a part of a question has two or more ‘method’ steps, the M marks are in principle independent unless the scheme specifically says otherwise; and similarly where there are several B marks allocated. (The notation ‘dep *’ is used to indicate that a particular mark is dependent on an earlier, asterisked, mark in the scheme.) Of course, in practice it may happen that when a candidate has once gone wrong in a part of a question, the work from there on is worthless so that no more marks can sensibly be given. On the other hand, when two or more steps are successfully run together by the candidate, the earlier marks are implied and full credit must be given.
e The abbreviation ft implies that the A or B mark indicated is allowed for work correctly following on from previously incorrect results. Otherwise, A and B marks are given for correct work only — differences in notation are of course permitted. A (accuracy) marks are not given for answers obtained from incorrect working. When A or B marks are awarded for work at an intermediate stage of a solution, there may be various alternatives that are equally acceptable. In such cases, exactly what is acceptable will be detailed in the mark scheme rationale. If this is not the case please consult your Team Leader. Sometimes the answer to one part of a question is used in a later part of the same question. In this case, A marks will often be ‘follow through’. In such cases you must ensure that you refer back to the answer of the previous part question even if this is not shown within the image zone. You may find it easier to mark follow through questions candidate-by-candidate rather than question-by-question.
f Wrong or missing units in an answer should not lead to the loss of a mark unless the scheme specifically indicates otherwise. Candidates are expected to give numerical answers to an appropriate degree of accuracy. 3 significant figures may often be the norm for this, but this always needs to be considered in the context of the problem in hand. For example, in quoting probabilities from Normal tables, we generally expect some evidence of interpolation and so quotation to 4 decimal places will often be appropriate. But even this does not always apply – quotations of the standard critical points for significance tests such as 1.96, 1.645, 2.576 (maybe even 2.58 – but not 2.57) will commonly suffice, especially if the calculated value of a test statistic is nowhere near any of these values. Sensible discretion must be exercised in such cases. Discretion must also be exercised in the case of small variations in the degree of accuracy to which an answer is given. For example, if 3 significant figures are expected (either because of an explicit instruction or because the general context of a
5

4767 Mark Scheme June 2015
problem demands it) but only 2 are given, loss of an accuracy ("A") mark is likely to be appropriate; but if 4 significant figures are given, this should not normally be penalised. Likewise, answers which are slightly deviant from what is expected in a very minor manner (for example a Normal probability given, after an attempt at interpolation, as 0.6418 whereas 0.6417 was expected) should not be penalised. However, answers which are grossly over- or under-specified should normally result in the loss of a mark. This includes cases such as, for example, insistence that the value of a test statistic is (say) 2.128888446667 merely because that is the value that happened to come off the candidate's calculator. Note that this applies to answers that are given as final stages of calculations; intermediate working should usually be carried out, and quoted, to a greater degree of accuracy to avoid the danger of premature approximation. Where over-specification is penalised, no more than two marks per question and no more than four marks in total per script should be lost. The situation regarding any particular cases where the accuracy of the answer may be a marking issue should be detailed in the mark scheme rationale. If in doubt, contact your Team Leader.
g Rules for replaced work If a candidate attempts a question more than once, and indicates which attempt he/she wishes to be marked, then examiners should do as the candidate requests.
If there are two or more attempts at a question which have not been crossed out, examiners should mark what appears to be the last (complete) attempt and ignore the others. NB Follow these maths-specific instructions rather than those in the assessor handbook.
h Genuine misreading (of numbers or symbols, occasionally even of text) occurs. If this results in the object and/or difficulty of the question being considerably changed, it is likely that all the marks for that question, or section of the question, will be lost. However, misreads are often such that the object and/or difficulty remain substantially unaltered; these cases are considered below. The simple rule is that all method ("M") marks [and of course all independent ("B") marks] remain accessible but at least some accuracy ("A") marks do not. It is difficult to legislate in an overall sense beyond this global statement because misreads, even when the object and/or difficulty remains unchanged, can vary greatly in their effects. For example, a misread of 1.02 as 10.2 (perhaps as a quoted value of a sample mean) may well be catastrophic; whereas a misread of 1.6748 as 1.6746 may have so slight an effect as to be almost unnoticeable in the candidate's work. A misread should normally attract some penalty, though this would often be only 1 mark and should rarely if ever be more than 2. Commonly in sections of questions where there is a numerical answer either at the end of the section or to be obtained and commented on (eg the value of a test statistic), this answer will have an "A" mark that may actually be designated as "cao"
6

4767 Mark Scheme June 2015
[correct answer only]. This should be interpreted strictly – if the misread has led to failure to obtain this value, then this "A" mark must be withheld even if all method marks have been earned. It will also often be the case that such a mark is implicitly "cao" even if not explicitly designated as such. On the other hand, we commonly allow "fresh starts" within a question or part of question. For example, a follow-through of the candidate's value of a test statistic is generally allowed (and often explicitly stated as such within the marking scheme), so that the candidate may exhibit knowledge of how to compare it with a critical value and draw conclusions. Such "fresh starts" are not affected by any earlier misreads. A misread may be of a symbol rather than a number – for example, an algebraic symbol in a mathematical expression. Such misreads are more likely to bring about a considerable change in the object and/or difficulty of the question; but, if they do not, they should be treated as far as possible in the same way as numerical misreads, mutatis mutandis. This also applied to misreads of text, which are fairly rare but can cause major problems in fair marking. The situation regarding any particular cases that arise while you are marking for which you feel you need detailed guidance should be discussed with your Team Leader. Note that a miscopy of the candidate’s own working is not a misread but an accuracy error.
7

4767 Mark Scheme June 2015
Question Answer Marks Guidance
1 (i)
G1*
Both axes labeled (allow t and y) with indication of scale
Allow axes interchanged Condone x for t
G1dep*
for values of time BOD if (0,0) not clearly visible
(evenly spaced)
G1dep* for values of average growth BOD if (0,0) not clearly visible. BOD if confusion arises from points plotted for part (v).
visually correct SC1 for points having the correct distribution and G0* awarded. Line through origin should appear but this is rewarded in part (v)
[3] 1 (ii)
t = 1.5, y = 32
B1 For t and y seen or implied by final answer.
Seen either in calculating b or in forming the equation of the line.
b = yt
tt
SS
= 2
490 (224 10.5 / 7)22.75 10.5 / 7− ×
− =
1547
= 22
OR b = 2
490 / 7 (32 1.5)22.75 / 7 1.5
− ×−
= 221
= 22
M1
For attempt at gradient (b)
Correct structure needed. See additional notes. FT their t and y for M1
A1 For 22 cao
hence least squares regression line is: y – y = b(t – t ) M1 For equation of line With their b > 0, t and y
8

4767 Mark Scheme June 2015
Question Answer Marks Guidance ⇒ y – 32 = 22 (t – 1.5) ⇒ y = 22 t – 1 A1 CAO
A0 for y = 22x - 1
[5] 1 (iii) t = 2 ⇒ predicted average growth = (22 × 2) – 1 = 43 B1 for prediction FT their equation Residual = 45 – 43
= 2 M1 A1
for subtraction (either way) FT
45 – their prediction
[3] 1 (iv) (22 × 5) – 1 = 109 B1 Estimate calculated using
equation FT their equation
Likely to be unreliable as extrapolation (oe) B1 [2] 1 (v) 490 21.5
22.75a = = 38… = 21.5 (3 s.f.)
M1 A1
Equation is y = 21.5t A1 Allow y = 21.54t CAO Allow y =(280/13)t Line plotted on diagram A1 For line correctly plotted CAO
A0 if axes not scaled or a ≠ 21.5 to 3 sf
Through (0,0) and between (3, 64) and (3,65)
[4] 2 (i)
P(Exactly one) = 251
× 0.031 × 0.9724
= 0.361
M1
A1
Binomial calculation with correct structure Allow 0.3611 and 0.36 www A0 for 0.3612
25× p× (1 – p)24
[2] 2 (ii) n is large B1 n large or sample is large or n >30 p is small. B1 p is small, or np ≈ np(1 – p)
B0 for the “probability” is small unless “probability” is correctly defined.
or np < 10
[2]
9

4767 Mark Scheme June 2015
Question Answer Marks Guidance 2 (iii) (A)
Mean = 250 × 0.03 = 7.5
B1
For mean (SOI)
P(exactly 10) =
107.5 7.5
10!e−
Or from tables = 0.8622 – 0.7764
= 0.0858
M1
For Poisson probability calculation
Or using P(X ≤ 10) - P(X ≤ 9) with Poisson tables
A1 Allow 0.08583 or 0.086www
[3] 2 (iii) (B) P(At least 10) = 1 – P(X ≤ 9) = 1 – 0.7764 M1 For using 1 - P(X ≤ 9) = 0.2236 A1 CAO Allow 0.224 www [2] 2 (iv) Mean 2000 × 0.03 = 60 B1 Normal approximation used Award full credit for use
of Normal approximation to Poisson distribution N(60, 60)
Variance = 2000 × 0.03 × 0.97 = 58.2 B1 For parameters (soi)
Using Normal approx. to the binomial, X ~ N(60, 58.2)
P(X ≥ 50) = P49.5 60
58.2Z − ≥
B1
For correct continuity correction
= P(Z > -1.376) = Φ(1.376)
= 0.9157 (allow 0.9156 and 0.916)
M1
A1
For probability using correct structure. CAO (Do not FT wrong or omitted CC)
N(60, 60) leads to P(Z > -1.356) = 0.9125 (or 0.913) Allow 0.9124 (or 0.912)
[5] 2 (v) Using a Poisson approximation to the binomial the
mean λ = np (= 0.002n) or λ = n × 0.002 (= 0.002n).
B1
For evidence of using np from binomial distribution (to give λ = 0.002n)
Need to see use of n×p or obtaining 0.002n from B(n, 0.002)
P(At most one fake coin) = P(zero or one fake coins) = 0 1
e e e e0! 1!
λ λ λ λλ λ λ− − − −+ = + AG
B1
Evidence of using P(X = 0) + P(X = 1) with λ = 0.002n NB ANSWER GIVEN
[2]
10

4767 Mark Scheme June 2015
Question Answer Marks Guidance 2 (vi) 2
12λ
− = 0.995
M1
For equation in λ or equivalent equation in n
λ2 = 0.01 so λ = 0.1 A1 For λ SOI or for n2 = 2500 n = 50 A1 CAO
[3] 3 (i) (A) P( X < 30)
= P30 30.7
3.5Z − <
M1
For standardising
Penalise erroneous continuity corrections and wrong sd. Condone numerator reversed.
= P(Z < -0.20) = Φ(-0.20) = 1 – Φ(0.20) M1 For correct structure 1 – Φ(positive z) = (1 – 0.5793) = 0.4207
A1 [3]
CAO
Allow 0.421 www
3 (i) (B) P(25 < X < 35)
= P25 30.7 35 30.7
3.5 3.5Z− − < <
M1
Correctly standardising both. Penalise erroneous continuity corrections and wrong sd. Condone both numerators reversed.
= P(-1.629 < X < 1.229) = Φ(1.229) – Φ(-1.629) = 0.8904 – (1 – 0.9483) = 0.8904 – 0.0517 M1 For correct structure
Φ(1.23) – Φ(-1.63) leads to 0.8907 – 0.0516 =0.8391
= 0.8387 A1 Use of differences column required
Only allow 0.839 if 0.8387 is seen.
[3]
11

4767 Mark Scheme June 2015
Question Answer Marks Guidance 3 (ii) P(all 5 weigh at least 30kg) = 0.57935 M1 Allow FT (1 – their (i)(A))5
or [their P(X ≥ 30)]5
= 0.0652 A1 FT only (1 – their (i)(A))5 Allow 0.06524, allow 0.065 www
[2] 3 (iii) P(weight > 30) = 0.05
P(Z >30 26.8
σ−
) = 0.05
Φ-1 (0.95) = 1.645 B1 For 1.645. B0 for 1 – 1.645 or 0.1645
NOTE use of -1.645 allowed only if numerator
30 26.8 1.645σ−
= M1*
For equation as seen or equivalent, with their z >1.
reversed. Condone use of spurious c.c. if already penalised in parts (i)(A) or (i)(B). See additional guidance notes.
σ =
30 26.81.645−
= 1.945 kg
M1dep* A1
Rearranging for σ CAO
Allow σ = 1.95 www
[4] 3 (iv)
G1
For two Normal shapes including attempt at asymptotic behaviour with horizontal axis at each of the four ends
Penalise clear asymmetry
G1 For means, shown explicitly or by scale on a single diagram
If shown explicitly, the positions must be consistent with horizontal scale if present.
G1
For lower max height for Male If not labelled, assume the larger mean represents Male
G1 For visibly greater width for If not labelled, assume the
12

4767 Mark Scheme June 2015
Question Answer Marks Guidance Male larger mean represents
Male [4] 4 (a) H0: no association between student smoking and parent
smoking H1: some association between student smoking and parent smoking
B1
Correct hypotheses in context NB if H0 H1 reversed do not award first B1 or final B1dep*
Allow hypotheses in terms of independence, in context. Do not allow “relationship” or “correlation” for “association”
Expected frequency
Parent smokes
Parent does not smoke
Student smokes 15.2 32.8
Student does not smoke
22.8 49.2
B1
B1
For at least one row/column of expected values correct May be implied by correct contributions or correct X 2 All correct
Contribution Parent smokes
Parent does not smoke
Student smokes 2.213 1.026
Student does not smoke 1.475 0.684
M1
A1
For valid attempt at (O-E)2/E All correct (to 3 d.p.)
NB These M1A1 marks cannot be implied by a correct final value of X 2
X 2 = 5.398
B1
Allow awrt 5.40
Do not penalise use of Yates correction, giving X 2 = 4.51
Refer to χ1
2 B1 For 1 degree of freedom Critical value at 5% level = 3.841 B1 CAO for cv. p value = 0.02016
13

4767 Mark Scheme June 2015
Question Answer Marks Guidance No further marks from here if
wrong or omitted, unless p-value used instead.
Result is significant B1* For significant oe FT their test statistic
There is sufficient evidence to suggest that there is association between student smoking and parent smoking.
B1dep*
NB if H0 H1 reverse do not award first B1 or final B1dep*
For non-assertive conclusion in context Allow conclusion in terms of independence FT their test statistic. Do not allow “relationship” or “correlation” for “association”.
[10] 4 (b)
= 88.2/100 = 0.882
B1
For 0.882 seen.
s =
278.68 (88.2) /100 0.887699 99
−=
0.0089657=
M1
For correctly structured calculation for the sample standard deviation or variance
= 0.0947 (allow 0.095 www) A1 Allow A1 for s2 = 0.0089657 or 0.00897 (allow 0.0090)
H0: μ = 0.87; H1 : μ > 0.87
B1
For both correct
Hypotheses in words only must refer to population.
Where μ denotes the mean nicotine content (of cigarettes of this brand in the population)
B1
For definition of μ in context. Do not allow other symbols unless clearly defined as population mean.
14

4767 Mark Scheme June 2015
Question Answer Marks Guidance
Test statistic = 00947.0
012.0100/0947.087.0882.0
=−
M1*
including correct use of √100.
FT their s (not s = 0.87 or √0.87 or 88.2 or √88.2 or 78.68 or √78.68)
=1.267
A1 CAO
Upper 1% level 1 tailed critical value of z = 2.326
B1
For 2.326 No further marks from here if wrong
1.267 < 2.326 (Not significant.)
M1dep*
For sensible comparison leading to a conclusion (even if incorrect)
There is insufficient evidence to suggest that the mean nicotine content of this brand is greater than 0.87mg.
A1
For non-assertive conclusion in words and in context. FT only candidate’s test statistic
[10] Additional Notes on Correct Structure in Q1(ii) Equivalent calculations for finding b are allowed. For example use of 7Syt/7Stt is allowed. However, where these are mixed we award M0. e.g. use of 7Syt/Stt would earn M0. For M1 to be awarded, the calculation must be structurally equivalent to the one provided – NOTE if it is believed that the candidate has made an error in transcription of a number (for example using 244 instead of 224) we can allow M1 BOD if the structure is otherwise correct. Additional Notes for Q3 (iii) M1* is for forming a suitable equation using their z-value but it must be reasonably clear that the value used is a z-value – for example we do not allow 0.05 or 0.95 to be treated as z-values here. The M1dep* can be awarded if the candidate correctly rearranges their equation to find σ. Hence, use of an incorrect z-value could earn max B0M1*M1dep*A0. However, if it is clear that the z-value is from the wrong tail (e.g. -1.645 used in place of +1.645) then award 0/4. In cases where -1.645 is used and the numerator of the equation is reversed allow full credit and annotate with BOD.
15

4767 Mark Scheme June 2015
Additional Notes on Sensible Comparisons In Q4 (b) Neither 1.267 > 0.05 nor 0.1026 < 2.326 are considered sensible as each compares a z-value with a probability. For 1.267 > 2.326 leading to a conclusion, allow M1A0. Additional Notes on Conclusions to Hypothesis Tests The following are examples of conclusions which are considered too assertive. There is sufficient evidence to reject H0 and conclude that… “there is a positive association between…” or “there seems to be evidence that there is a positive association between…” or “the mean nicotine content is greater ….” “there doesn’t appear to be association between…” Also note that final conclusions must refer to H1 in context for the final mark to be given. e.g. In Q4 (a), a conclusion just stating that “the evidence suggests that there is association” gets A0 as this does not refer to the context. Additional Notes on Alternative Methods in Q4 (b) Critical value method cv = 0.87 + 2.326 × 0.0946÷ √100 gets M1* B1 (for 2.326) = 0.8920 gets A1 cao (replacing the A1 for 1.267) 0.882 < 0.8920 gets M1dep* if a conclusion is made. The final A1 available as before if 2.326 used. Probability Method P(sample mean > 1.267) = 0.1026 gets M1*A1 B1 (the B1 for 0.1026 (allow 0.1025), from tables, replaces the B1 for 2.326).
0.1026 > 0.01 gets M1dep* if a conclusion is made. The final A1 available as before provided that B1 for 0.1026 awarded NOTE Condone B1 0.8974 (0.8975) if compared with 0.99 at which point the final M1dep*A1 are available. B0M0A0A0 if 0.8974 obtained from P(sample mean > -1.267).
16

OCR (Oxford Cambridge and RSA Examinations) 1 Hills Road Cambridge CB1 2EU OCR Customer Contact Centre Education and Learning Telephone: 01223 553998 Facsimile: 01223 552627 Email: [email protected] www.ocr.org.uk For staff training purposes and as part of our quality assurance programme your call may be recorded or monitored
Oxford Cambridge and RSA Examinations is a Company Limited by Guarantee Registered in England Registered Office; 1 Hills Road, Cambridge, CB1 2EU Registered Company Number: 3484466 OCR is an exempt Charity OCR (Oxford Cambridge and RSA Examinations) Head office Telephone: 01223 552552 Facsimile: 01223 552553 © OCR 2015

GCE
Mathematics (MEI) Unit 4767: Statistics 2 Advanced GCE
Mark Scheme for June 2016
Oxford Cambridge and RSA Examinations

OCR (Oxford Cambridge and RSA) is a leading UK awarding body, providing a wide range of qualifications to meet the needs of candidates of all ages and abilities. OCR qualifications include AS/A Levels, Diplomas, GCSEs, Cambridge Nationals, Cambridge Technicals, Functional Skills, Key Skills, Entry Level qualifications, NVQs and vocational qualifications in areas such as IT, business, languages, teaching/training, administration and secretarial skills. It is also responsible for developing new specifications to meet national requirements and the needs of students and teachers. OCR is a not-for-profit organisation; any surplus made is invested back into the establishment to help towards the development of qualifications and support, which keep pace with the changing needs of today’s society. This mark scheme is published as an aid to teachers and students, to indicate the requirements of the examination. It shows the basis on which marks were awarded by examiners. It does not indicate the details of the discussions which took place at an examiners’ meeting before marking commenced. All examiners are instructed that alternative correct answers and unexpected approaches in candidates’ scripts must be given marks that fairly reflect the relevant knowledge and skills demonstrated. Mark schemes should be read in conjunction with the published question papers and the report on the examination. OCR will not enter into any discussion or correspondence in connection with this mark scheme. © OCR 2016

4767 Mark Scheme June 2016
1. Annotations and abbreviations Annotation in scoris Meaning and BOD Benefit of doubt FT Follow through ISW Ignore subsequent working M0, M1 Method mark awarded 0, 1 A0, A1 Accuracy mark awarded 0, 1 B0, B1 Independent mark awarded 0, 1 SC Special case ^ Omission sign MR Misread Highlighting Other abbreviations in mark scheme
Meaning
E1 Mark for explaining U1 Mark for correct units G1 Mark for a correct feature on a graph M1 dep* Method mark dependent on a previous mark, indicated by * cao Correct answer only oe Or equivalent rot Rounded or truncated soi Seen or implied www Without wrong working ito In terms of
3

4767 Mark Scheme June 2016
2. Subject-specific Marking Instructions for GCE Mathematics (MEI) Statistics strand
a Annotations should be used whenever appropriate during your marking. The A, M and B annotations must be used on your standardisation scripts for responses that are not awarded either 0 or full marks. It is vital that you annotate standardisation scripts fully to show how the marks have been awarded. For subsequent marking you must make it clear how you have arrived at the mark you have awarded.
b An element of professional judgement is required in the marking of any written paper. Remember that the mark scheme is designed to assist in marking incorrect solutions. Correct solutions leading to correct answers are awarded full marks but work must not be judged on the answer alone, and answers that are given in the question, especially, must be validly obtained; key steps in the working must always be looked at and anything unfamiliar must be investigated thoroughly. Correct but unfamiliar or unexpected methods are often signalled by a correct result following an apparently incorrect method. Such work must be carefully assessed. When a candidate adopts a method which does not correspond to the mark scheme, award marks according to the spirit of the basic scheme; if you are in any doubt whatsoever (especially if several marks or candidates are involved) you should contact your Team Leader.
c The following types of marks are available. M A suitable method has been selected and applied in a manner which shows that the method is essentially understood. Method marks are not usually lost for numerical errors, algebraic slips or errors in units. However, it is not usually sufficient for a candidate just to indicate an intention of using some method or just to quote a formula; the formula or idea must be applied to the specific problem in hand, eg by substituting the relevant quantities into the formula. In some cases the nature of the errors allowed for the award of an M mark may be specified. A Accuracy mark, awarded for a correct answer or intermediate step correctly obtained. Accuracy marks cannot be given unless the associated Method mark is earned (or implied). Therefore M0 A1 cannot ever be awarded. B Mark for a correct result or statement independent of Method marks.
4

4767 Mark Scheme June 2016
E A given result is to be established or a result has to be explained. This usually requires more working or explanation than the establishment of an unknown result. Unless otherwise indicated, marks once gained cannot subsequently be lost, eg wrong working following a correct form of answer is ignored. Sometimes this is reinforced in the mark scheme by the abbreviation isw. However, this would not apply to a case where a candidate passes through the correct answer as part of a wrong argument.
d When a part of a question has two or more ‘method’ steps, the M marks are in principle independent unless the scheme specifically says otherwise; and similarly where there are several B marks allocated. (The notation ‘dep *’ is used to indicate that a particular mark is dependent on an earlier, asterisked, mark in the scheme.) Of course, in practice it may happen that when a candidate has once gone wrong in a part of a question, the work from there on is worthless so that no more marks can sensibly be given. On the other hand, when two or more steps are successfully run together by the candidate, the earlier marks are implied and full credit must be given.
e The abbreviation ft implies that the A or B mark indicated is allowed for work correctly following on from previously incorrect results. Otherwise, A and B marks are given for correct work only — differences in notation are of course permitted. A (accuracy) marks are not given for answers obtained from incorrect working. When A or B marks are awarded for work at an intermediate stage of a solution, there may be various alternatives that are equally acceptable. In such cases, exactly what is acceptable will be detailed in the mark scheme rationale. If this is not the case please consult your Team Leader. Sometimes the answer to one part of a question is used in a later part of the same question. In this case, A marks will often be ‘follow through’. In such cases you must ensure that you refer back to the answer of the previous part question even if this is not shown within the image zone. You may find it easier to mark follow through questions candidate-by-candidate rather than question-by-question.
f Wrong or missing units in an answer should not lead to the loss of a mark unless the scheme specifically indicates otherwise. Candidates are expected to give numerical answers to an appropriate degree of accuracy. 3 significant figures may often be the norm for this, but this always needs to be considered in the context of the problem in hand. For example, in quoting probabilities from Normal tables, we generally expect some evidence of interpolation and so quotation to 4 decimal places will often be appropriate. But even this does not always apply – quotations of the standard critical points for significance tests such as 1.96, 1.645, 2.576 (maybe even 2.58 – but not 2.57) will commonly suffice, especially if the calculated value of a test statistic is nowhere near any of these values. Sensible discretion must be exercised in such cases. Discretion must also be exercised in the case of small variations in the degree of accuracy to which an answer is given. For example, if 3 significant figures are expected (either because of an explicit instruction or because the general context of a
5

4767 Mark Scheme June 2016
problem demands it) but only 2 are given, loss of an accuracy ("A") mark is likely to be appropriate; but if 4 significant figures are given, this should not normally be penalised. Likewise, answers which are slightly deviant from what is expected in a very minor manner (for example a Normal probability given, after an attempt at interpolation, as 0.6418 whereas 0.6417 was expected) should not be penalised. However, answers which are grossly over- or under-specified should normally result in the loss of a mark. This includes cases such as, for example, insistence that the value of a test statistic is (say) 2.128888446667 merely because that is the value that happened to come off the candidate's calculator. Note that this applies to answers that are given as final stages of calculations; intermediate working should usually be carried out, and quoted, to a greater degree of accuracy to avoid the danger of premature approximation. The situation regarding any particular cases where the accuracy of the answer may be a marking issue should be detailed in the mark scheme rationale. If in doubt, contact your Team Leader.
g Rules for replaced work If a candidate attempts a question more than once, and indicates which attempt he/she wishes to be marked, then examiners should do as the candidate requests.
If there are two or more attempts at a question which have not been crossed out, examiners should mark what appears to be the last (complete) attempt and ignore the others. NB Follow these maths-specific instructions rather than those in the assessor handbook.
h Genuine misreading (of numbers or symbols, occasionally even of text) occurs. If this results in the object and/or difficulty of the question being considerably changed, it is likely that all the marks for that question, or section of the question, will be lost. However, misreads are often such that the object and/or difficulty remain substantially unaltered; these cases are considered below. The simple rule is that all method ("M") marks [and of course all independent ("B") marks] remain accessible but at least some accuracy ("A") marks do not. It is difficult to legislate in an overall sense beyond this global statement because misreads, even when the object and/or difficulty remains unchanged, can vary greatly in their effects. For example, a misread of 1.02 as 10.2 (perhaps as a quoted value of a sample mean) may well be catastrophic; whereas a misread of 1.6748 as 1.6746 may have so slight an effect as to be almost unnoticeable in the candidate's work. A misread should normally attract some penalty, though this would often be only 1 mark and should rarely if ever be more than 2. Commonly in sections of questions where there is a numerical answer either at the end of the section or to be obtained and commented on (eg the value of a test statistic), this answer will have an "A" mark that may actually be designated as "cao" [correct answer only]. This should be interpreted strictly – if the misread has led to failure to obtain this value, then this "A" mark
6

4767 Mark Scheme June 2016
must be withheld even if all method marks have been earned. It will also often be the case that such a mark is implicitly "cao" even if not explicitly designated as such. On the other hand, we commonly allow "fresh starts" within a question or part of question. For example, a follow-through of the candidate's value of a test statistic is generally allowed (and often explicitly stated as such within the marking scheme), so that the candidate may exhibit knowledge of how to compare it with a critical value and draw conclusions. Such "fresh starts" are not affected by any earlier misreads. A misread may be of a symbol rather than a number – for example, an algebraic symbol in a mathematical expression. Such misreads are more likely to bring about a considerable change in the object and/or difficulty of the question; but, if they do not, they should be treated as far as possible in the same way as numerical misreads, mutatis mutandis. This also applied to misreads of text, which are fairly rare but can cause major problems in fair marking. The situation regarding any particular cases that arise while you are marking for which you feel you need detailed guidance should be discussed with your Team Leader. Note that a miscopy of the candidate’s own working is not a misread but an accuracy error.
7

4767 Mark Scheme June 2016
Question Answer Marks Guidance 1 (i)
G1
G2,1,0
[3]
For suitably labelled axes. Condone absence of scale here. G2 for 11 points correctly plotted relative to a suitable linear scale. G1 if 9 or 10 correctly plotted. G0 if 3 or more incorrectly plotted/omitted
Allow axes interchanged
1 (ii) (The points in the scatter diagram) do not appear to be roughly elliptical. The population may not have a bivariate Normal distribution.
E1 E1
[2]
For “not elliptical”. For not underlying bivariate Normal. Do not allow “the data” in place of population/underlying. Allow “data is not from a bivariate Normal distribution”. Do not allow Normal bivariate ….
1 (iii) Percentage 33 6 58 35 81 69 61 7 74 71 17 Fertiliser use 76 44 6 68 3 10 7 176 5 137 157 Rank percentage 4 1 6 5 11 8 7 2 10 9 3 Rank Fertiliser 8 6 3 7 1 5 4 11 2 9 10 d 4 5 -3 2 -10 -3 -3 9 -8 0 7 d2 16 25 9 4 100 9 9 81 64 0 49
M1
M1
For ranking (allow ranks reversed) NB No ranking scores 0/5 For d2
8

4767 Mark Scheme June 2016
Question Answer Marks Guidance Σd2 = 366 A1
For Σd2
(May be embedded in the calculation)
2
2
6 6 366 21961 1 1 1 1.663611 120 1320( 1)
ds
n nr ×
= − = − = − = −×−∑
M1
For method for rs
= - 0.664 (to 3 s.f.) [ allow -0.66 to 2 s.f. or -73/110]
A1
[5]
FT their Σd2 provided -1 < rs < 0 ̧and ranking used. NB No ranking scores 0/5
1 (iv)
H0: no association between percentage of population living in rural areas and fertiliser use (in the population of countries)
B1
For null hypothesis in context NB H0 H1 not ito ρ.
H1: negative association between percentage of population living in rural areas and fertiliser use (in the population of countries)
B1
B1
For alternative hypothesis in context. Context needed in at least one of the hypotheses. For population of countries or underlying population.
One tail test critical value at 1% level is -0.7091
B1
For ±0.7091 No further marks from here if incorrect.
Since - 0.664 > -0.7091 [or 0.664 < 0.7901] there is … M1
For sensible comparison of their “- 0.664” with ±0.7091 seen, leading to conclusion, only if -1 < their rs < 0.
…insufficient evidence to reject H0. There is insufficient evidence to suggest that there is negative association between percentage of population living in rural areas and fertiliser use (in the population of countries)
A1 [6]
for not significant, oe, and correct conclusion in context. FT their rs with correct cv.
9

4767 Mark Scheme June 2016
Question Answer Marks Guidance 1 (v) It means that the probability of rejecting H0 given that it is correct is 1% o.e.
E1
[1]
Allow “the probability of a false positive is 1%”, “the probability of a Type I Error is 1%”. Do not allow “It means that the probability rejecting H0 when it should have been accepted is 1%”
1 (vi) None E1 [1]
2 (i) ‘Randomly’ means that mutations occur with no (predictable) pattern.
‘Independently’ means that the occurrence of one mutation does not affect the probability of another mutation occurring.
E1
E1
In context. Allow “not predictable” Must include ‘probability’ and context. Allow “chance”. If not indicated, assume first comment relates to randomness.
[2] 2 (ii) P(Exactly one) = 20C1 × 0.0121 × 0.98819
= 0.1908
M1 A1 [2]
For correct structure i.e. 20p(1 – p)19
Allow 0.191. Allow 0.19 www.
2 (iii) Because the number of mutating genes/X is binomially distributed n is large and p is small.
E1 E1
[2]
Allow B(500, 0.012) or B(n, p). Allow the sample is large & np ≈ np(1 – p) or np not too large. Condone suitable numerical ranges – e.g. n > 30, p < 0.1 Do not allow “the number is large and probability is small”. Allow “probability of success/a gene mutating is small” for p is small
2 (iv) (A) λ = 500 × 0.012 = 6 P(2 mutations ) = [0.0620 – 0.0174 from tables] = 0.0446
B1
M1
A1 [3]
For mean Correct structure for P(= 2) using Poisson pdf or tables. CAO Allow 0.04462 or 0.045www
10

4767 Mark Scheme June 2016
Question Answer Marks Guidance 2 (iv) (B) From tables P(At least two) = 1 – P(≤1) = 1 – 0.0174
= 0.9826 M1 A1 [2]
For using 1 – P(≤ 1) using their mean. CAO Allow 0.983. Allow 0.98 www.
2 (v) Mean 50000 × 0.012 = 600 , Var = 50000 × 0.012 × 0.988 = 592.8 Using Normal approx. to the binomial, X ~ N(600, 592.8)
B1 B1
For Normal approximation (SOI). For correct parameters (SOI).
P(X ≥ 650) = P B1
For 649.5
= P(Z > 2.033) = 1 – Φ(2.033) = 1 – 0.9789 = 0.0211
M1
A1 [5]
For standardisation and probability calculation using correct tail. CAO (Allow answer from calculator 0.0210)
2 (v) Alternative solution using Normal approx. to Poisson Mean 100 × 6 = 600 Using Normal approx. to the Poisson, X ~ N(600, 600)
B1 B1
For Normal approximation (SOI). For correct parameters (SOI).
P(X ≥ 650) = P B1
For 649.5
= P(Z > 2.021) = 1 – Φ(2.021) = 1 – 0.9783 = 0.0217
M1
A1 [5]
For standardisation and probability calculation using correct tail. CAO (Allow answer from calculator 0.0216 )
3 (i) P(50000 < X < 55000) =
P50000 50600 55000 50600
3400 3400Z− − < <
M1
For standardising both. SOI. Penalise erroneous continuity corrections and wrong sd. Condone numerator(s) reversed.
= P(-0.176 < Z < 1.294) = Φ(1.294) – (1 – Φ(0.176)) = 0.9022 – 1 + 0.5699 = 0.4721
M1
A1 [3]
For correct structure Φ(positive z) - Φ(negative z) CAO including use of difference tables (Answer from calculator 0.4722 and from tables interpolated 0.4723)
11

4767 Mark Scheme June 2016
Question Answer Marks Guidance 3 (ii)
P(X > 45000) = P45000 50600
3400Z − >
= P(Z > -1.647)
B1*
For -1.647 or -Φ-1(0.95) = -1.645 or 1.647 seen with P(X < 56200) or numerator reversed
= Φ(1.647) = 0.9502 0.9502 > 95% so agree with claim
B1*
depE1*
[3]
For 0.9502 or 45007 or 0.0498, or B1 for -1.645 if B1 for -1.647 already awarded. For comparison seen e.g. -1.647 < -1.645 or 0.0498 < 0.05 or 1.647 > 1.645 or 95% last longer than 45007 hours, and correct conclusion. Dependent on B1, B1 awarded
3 (iii) From tables Φ-1 ( 0.999 ) = 3.09
B1
±3.09 seen
50600 3.093400
h −= −
( )50600 3.09 3400k = − × = 40100 www
M1
A1 [3]
For equation as seen with their negative z-value CAO Allow 40094, 40090
12

4767 Mark Scheme June 2016
Question Answer Marks Guidance 3 (iv)
P(Y < 60000) = 0.6 60000P 0.6Z µ
σ− ⇒ < =
160000 (0.6) 0.2533µσ
−−⇒ = Φ =
60000 0.2533µ σ⇒ = +
B1
M1
For ±0.2533 or ±1.282 seen For an equation ito µ, σ, z and y formed. NB using z = ±0.2533 with y = 60 000 or ±1.282 with y = 50 000
P(Y >50000) = 0.9 50000P 0.9Z µ
σ− ⇒ > =
150000 (0.1) 1.282µσ
−−⇒ = Φ = −
50000 1.282µ σ⇒ = −
A1
For two correct equations seen.
1.5353 100006513σ
σ=
=
A1
CAO Allow 6510, 6515
50000 (1.282 6513) 58350µ⇒ = + × =
A1 [5]
CAO Allow 58400
3 (v)
G1
G1
G1
G1 [4]
For two Normal shapes including attempt at asymptotic behaviour with horizontal axis at each of the four ends. Penalise clear asymmetry. For means, shown explicitly or by scale on a single diagram. If shown explicitly, the positions must be consistent with horizontal scale if present. FT part (iv). For greater width (variance) for Different model. FT part (iv). For lower max height for Different model. FT part (iv) If not labelled assume the larger mean represents Different model. FT part(iv).
13

4767 Mark Scheme June 2016
Question Answer Marks Guidance 4 (a) (i) Expected frequency = 42/80 × 29 = 15.225
Contribution = (12 – 15.225)2 / 15.225 (= 0.6831 AG)
B1 M1 A1 [3]
for 15.225 For valid attempt at (O-E)2/E leading to correct answer. NB Answer given
4 (ii) H0: no association between sex and attitude to Mathematics. H1: some association between sex and attitude to Mathematics.
B1
For correct hypotheses in context (with context seen in at least one hypothesis). NB if H0 H1 reversed do not award first B1or final A1. Allow hypotheses expressed in terms of independence, and in context.
Test statistic X 2 = 5.3236 Refer to 2
2χ Critical value at 5% level = 5.991
B1
B1
B1
Allow 5.324 or 5.32 Allow “2 degrees of freedom” or ν = 2 seen. No further marks from here if wrong or omitted.
(5.3236 < 5.991 so result is) not significant
M1
For not significant oe. FT their test statistic. Allow ‘Accept H0’ or ‘Reject H1’
There is insufficient evidence to suggest that there is association between sex and attitude to Mathematics
A1
[6]
For non-assertive conclusion in context FT their test statistic. Do not allow “relationship” or “correlation” for “association”.
14

4767 Mark Scheme June 2016
Question Answer Marks Guidance 4 (b)
= 373/60 = 6.217
B1
Allow 6.22
s =
22498 (373) / 60 179.18359 59
−=
3.0370= = 1.743
M1
A1
For correctly structured calculation (divisor = 59) for the sample standard deviation or variance. Allow answers which round to 1.74
H0: μ = 5.64; H1 : μ > 5.64 Where μ denotes the mean radioactivity level in (the population of) limpets
B1
B1
For both hypotheses correct. For definition of μ in context. Do not allow other symbols unless clearly defined as population mean.
Test statistic =
6.217 5.64 0.57670.22501.743 / 60
−=
= 2.563
M1*
A1
Structure of test statistic using their sd and mean. Must include correct use of √60. Do not condone numerator reversed. Allow answers between 2.56 and 2.57 inclusive.
Upper 5% level 1 tailed critical value of z = 1.645
B1
For 1.645 No further marks from here if wrong.
2.563 > 1.645 The result is… …significant. There is sufficient evidence to reject H0
depM1*
A1
For sensible comparison leading to a conclusion (even if incorrect). FT their test statistic. Correct conclusion. FT their test statistic.
There is sufficient evidence to suggest that the mean level of radioactivity has increased.
A1 [11]
For correct non-assertive conclusion in words in context. FT their test statistic.
15

4767 Mark Scheme June 2016
Additional Notes on Sensible Comparisons e.g. In Q4 (b) Neither 2.563 > 0.05 nor 0.0052 < 2.326 are considered sensible as each compares a z-value with a probability. - 2.563 < 1.645 is not considered to be sensible.
For 2.563 < 1.645 leading to a conclusion, award M0 A0. Additional Notes on Conclusions to Hypothesis Tests The following are examples of conclusions which are considered too assertive. There is sufficient evidence to reject H0 and conclude that… “there is a positive association between…” or “there seems to be evidence that there is a positive association between…” or “the mean level of radioactivity is greater ….” “there doesn’t appear to be association between…” Also note that final conclusions must refer to H1 in context for the final mark to be given. e.g. In Q4 (a) part (ii), a conclusion just stating that “there is insufficient evidence to suggest that there is an association” gets A0 as this does not refer to the context. Additional Notes on Alternative Methods in Q4 (b) Critical value method cv = 5.64 + 1.645 × 1.743÷ √60 gets M1* (structure) FT their sd. B1 for 1.645 used (otherwise B0M0A0A0) = 6.01 gets A1 (replacing the A1 for 2.563)
6.217 > 6.01 gets depM1* if a conclusion is made, FT their mean only if 1.645 used. Then A1, A1 available as before.
Probability Method P(Z > 2.563) = 0.0052 gets B1 for value rounding to 0.005 which replaces the B1 for 1.645 (otherwise
B0depM0*A0A0).
0.005 < 0.05 gets depM1* if a conclusion is made only if B1for 0.005 has been awarded. Then A1, A1 available as before.
NOTE Condone B1 for 0.995 obtained from P(Z < 2.563) only if compared with 0.95 at which point the final depM1*A1A1are available. B0depM0*A0A0 if 0.995 obtained from P(z > -2.563).
16

OCR (Oxford Cambridge and RSA Examinations) 1 Hills Road Cambridge CB1 2EU OCR Customer Contact Centre Education and Learning Telephone: 01223 553998 Facsimile: 01223 552627 Email: [email protected] www.ocr.org.uk For staff training purposes and as part of our quality assurance programme your call may be recorded or monitored
Oxford Cambridge and RSA Examinations is a Company Limited by Guarantee Registered in England Registered Office; 1 Hills Road, Cambridge, CB1 2EU Registered Company Number: 3484466 OCR is an exempt Charity OCR (Oxford Cambridge and RSA Examinations) Head office Telephone: 01223 552552 Facsimile: 01223 552553 © OCR 2016