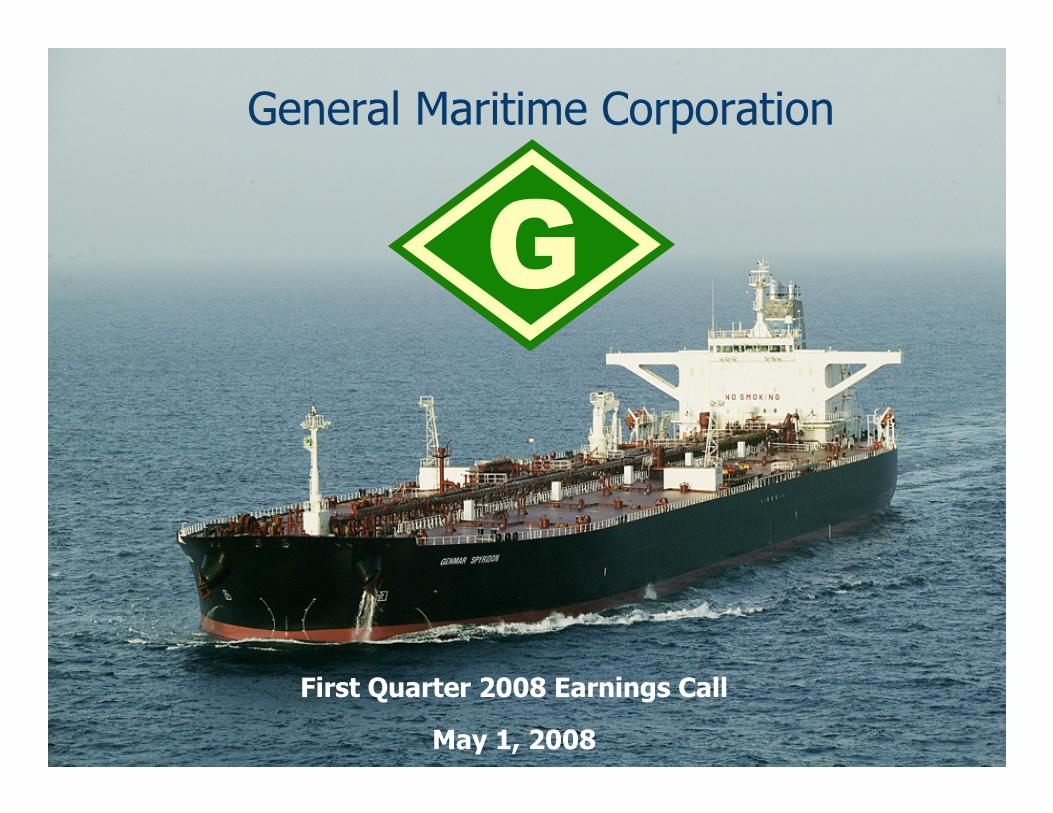
general maritime corporation -...
TRANSCRIPT
1
First Quarter 2008 Earnings Call
May 1, 2008
General Maritime Corporation

2
Today’s presentation and discussion will contain forward-looking statements within the meaning of the Private Securities Litigation Reform Act of 1995. These forward-looking statements are based on management's current expectations and observations. Included among the factors that, in the Company's view, could cause actual results to differ materially from the forward looking statements contained in this press release are the following: changes in demand; a material decline or prolonged weakness in rates in the tanker market; changes in production of or demand for oil and petroleum products, generally or in particular regions; greater than anticipated levels of tanker newbuilding orders or lower than anticipated rates of tanker scrapping; changes in rules and regulations applicable to the tanker industry, including, without limitation, legislation adopted by international organizations such as the International Maritime Organization and the European Union or by individual countries; actions taken by regulatory authorities; changes in trading patterns significantly impacting overall tanker tonnage requirements; changes in the typical seasonal variations in tanker charter rates; changes in the cost of other modes of oil transportation; changes in oil transportation technology; increases in costs including without limitation: crew wages, insurance, provisions, repairs and maintenance; changes in general domestic and international political conditions; changes in the condition of the Company's vessels or applicable maintenance or regulatory standards (which may affect, among other things, the Company's anticipated drydocking or maintenance and repair costs); changes in the itineraries of the Company’s vessels; and other factors listed from time to time in the Company’s filings with the Securities and Exchange Commission, including, without limitation, its Annual Report on Form 10-K for the year ended December 31, 2007 and its subsequent reports on Form 8-K. For further information, please refer to such filings with the Securities and Exchange Commission including the Company’s Current Report on Form 8-K dated as of April 30, 2008. The Company’s ability to pay dividends in any period will depend upon factors including applicable provisions of Marshall Islands law and the final determination by the Board of Directors each quarter after its review of the Company’s financial performance. The timing and amount of dividends, if any, could also be affected by factors affecting cash flows, results of operations, required capital expenditures, or reserves. As a result, the amount of dividends actually paid may vary from the amounts currently estimated. Share repurchases may be made from time to time for cash in open market transactions at prevailing market prices or in privately negotiated transactions. The timing and amount of purchases under the Company’s share repurchase program will be determined by management based upon market conditions and other factors. Purchases may be made pursuant to a program adopted under Rule 10b5-1 under the Securities Exchange Act. The program does not require the Company to purchase any specific number or amount of shares and may be suspended or reinstated at any time in the Company's discretion and without notice. Repurchases will be subject to the restrictions under the Company's existing credit facility.
3
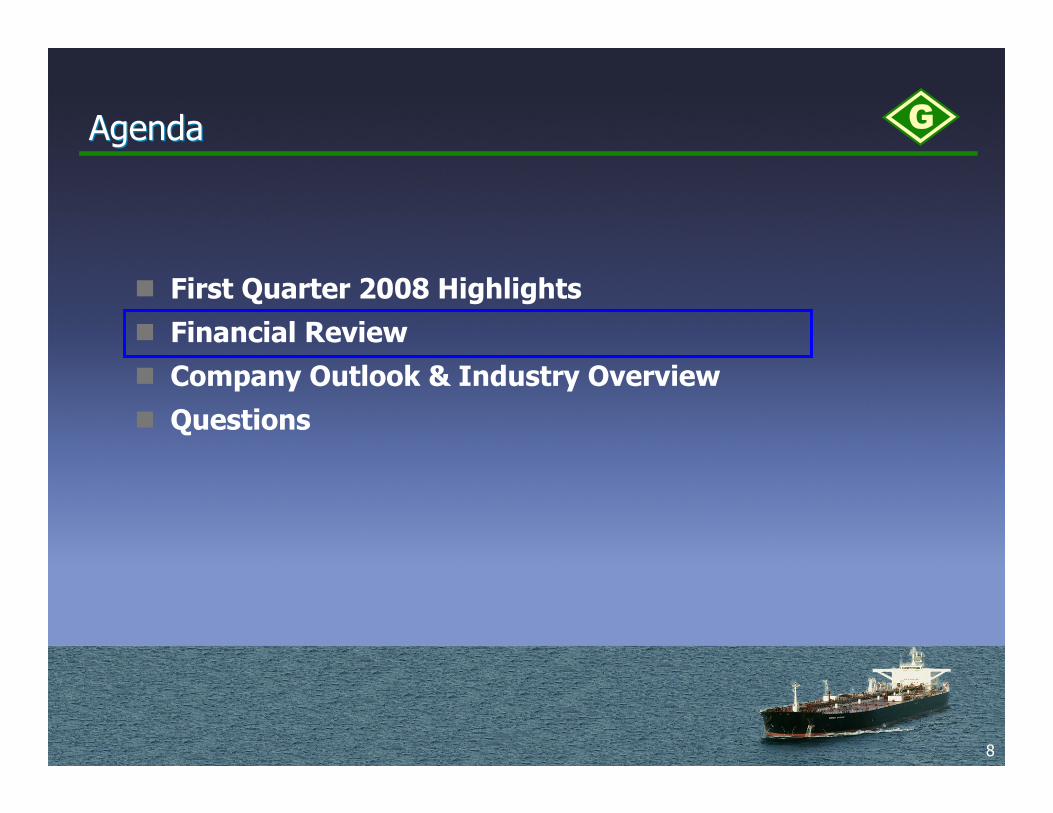
AgendaAgenda
� First Quarter 2008 Highlights
� Financial Review
� Company Outlook & Industry Overview
� Questions
4
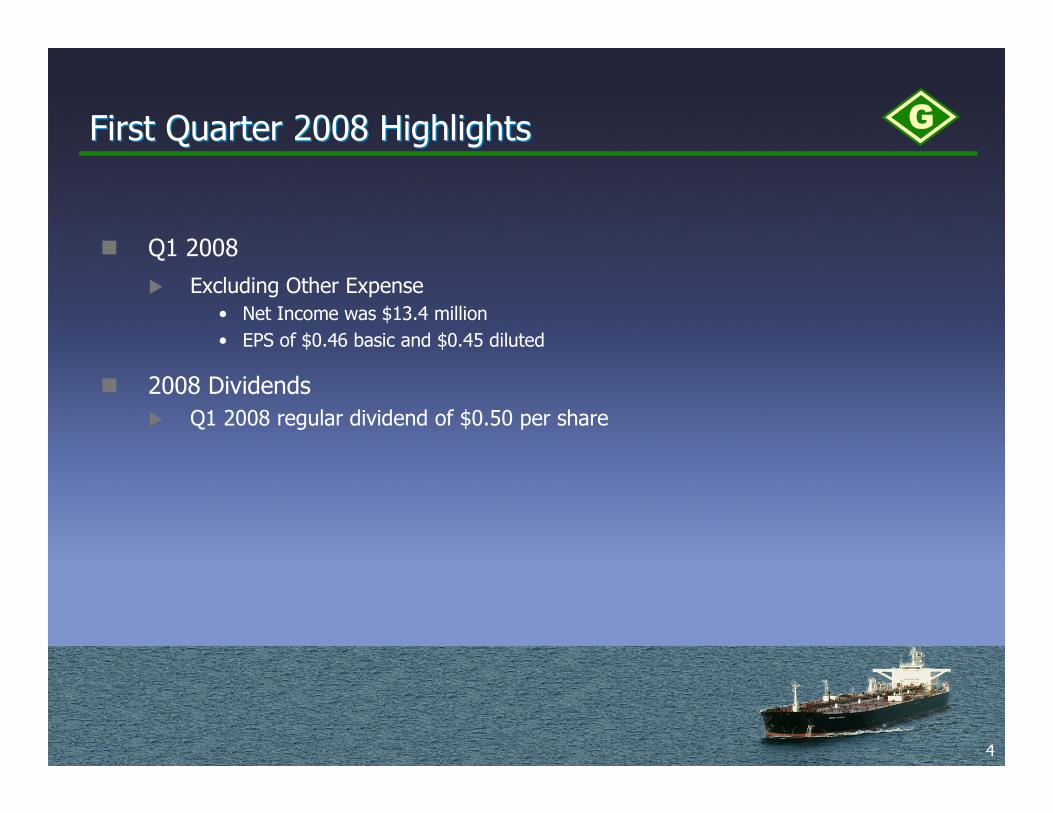
First Quarter 2008 HighlightsFirst Quarter 2008 Highlights
� Q1 2008
� Excluding Other Expense
• Net Income was $13.4 million
• EPS of $0.46 basic and $0.45 diluted
� 2008 Dividends
� Q1 2008 regular dividend of $0.50 per share

5
First Quarter 2008 – Fleet EmploymentFirst Quarter 2008 – Fleet Employment
� As of April 30, 2008 T/C coverage at 67%
� 14 vessels or vessel equivalents fixed on 3-year time charter
• 13 vessels under time charter
• 1 synthetic time charter
� Contracted revenue for 2008 expected to be $175.8 million

6
First Quarter 2008 – Time Charter CoverageFirst Quarter 2008 – Time Charter Coverage
36
36 + 2
36
36
36
36
36 + 2
36
36
36 + 2
36
36 + 2
36
11/23/2006
8/13/2006
GENMAR GEORGE T / Eiger (tcp 30 May 2007) 8/28/2007
4/2/2007
GENMAR HOPE / Westport (tcp 20 June 2006)
GENMAR HORN / Eiger (tcp 03 Oct 2006)
GENMAR HARRIET G / Eiger (tcp 02 Mar 2007)
$27,750
$36,500
$38,000
TC Rate
$38,500
$29,500 12/1/2006 12/1/2009
$39,000
GENMAR PHOENIX / Eiger (tcp 19 Oct 2006)
GENMAR PRINCESS / Eiger (tcp 03 Oct 2006)
GENMAR SPYRIDON / Eiger (tcp 03 Oct 2006)
1/1/2010 $38,500
10/24/2006
$38,500
GENMAR ST.NIKOLAS / Eiger (tcp 30 May 2007) 2/7/2008 2/7/2011
PERIOD of T/C
(Months)
10/13/2006
GENMAR DEFIANCE / Westport (tcp 24 Oct 2006)
GENMAR ORION / Eiger (tcp 02 Mar 2007)
GENMAR KARA G / Eiger (tcp 02 Mar 2007)
1/6/2010
GENMAR AJAX / AET (tcp 01 Dec 2006)
12/25/2006
4/9/2007
12/13/2009
10/24/2009
6/1/2010
11/1/2006
3/27/2007
GENMAR ARGUS / Eiger (tcp 04 Oct 2006)
Redelivery
DateGMM Vessel's on Time Charter (T/C)
Delivery
Date
11/6/2006
6/1/2010 $38,000
12/25/2009
$38,5001/23/2010
8/13/2009
8/28/2010
6/1/2010
$39,000
$29,500
$38,000
(1)
(2)
(1) Before Brokers’ Commissions
(2) Rate is reduced to $25,000 per date on 12/1/08
7
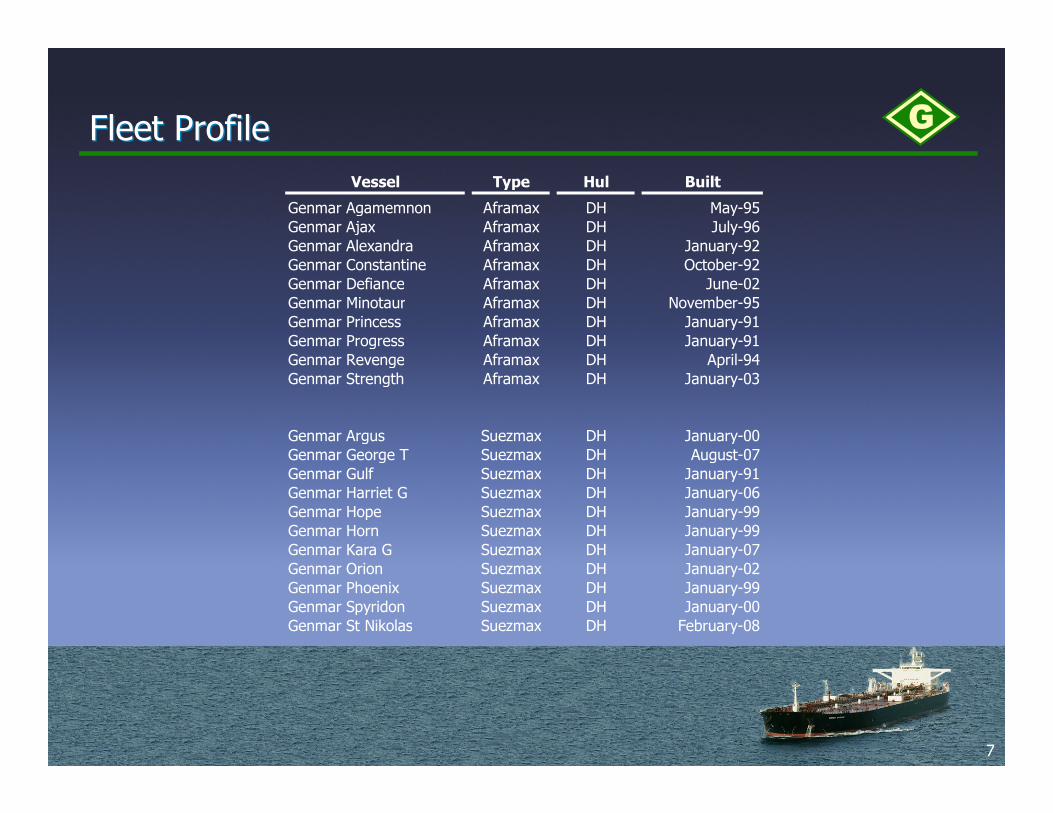
Fleet ProfileFleet Profile
Vessel Type Hul Built
Genmar Agamemnon Aframax DH May-95
Genmar Ajax Aframax DH July-96
Genmar Alexandra Aframax DH January-92
Genmar Constantine Aframax DH October-92
Genmar Defiance Aframax DH June-02
Genmar Minotaur Aframax DH November-95
Genmar Princess Aframax DH January-91
Genmar Progress Aframax DH January-91
Genmar Revenge Aframax DH April-94
Genmar Strength Aframax DH January-03
Genmar Argus Suezmax DH January-00
Genmar George T Suezmax DH August-07
Genmar Gulf Suezmax DH January-91
Genmar Harriet G Suezmax DH January-06
Genmar Hope Suezmax DH January-99
Genmar Horn Suezmax DH January-99
Genmar Kara G Suezmax DH January-07
Genmar Orion Suezmax DH January-02
Genmar Phoenix Suezmax DH January-99
Genmar Spyridon Suezmax DH January-00
Genmar St Nikolas Suezmax DH February-08
8
AgendaAgenda
� First Quarter 2008 Highlights
� Financial Review
� Company Outlook & Industry Overview
� Questions
9
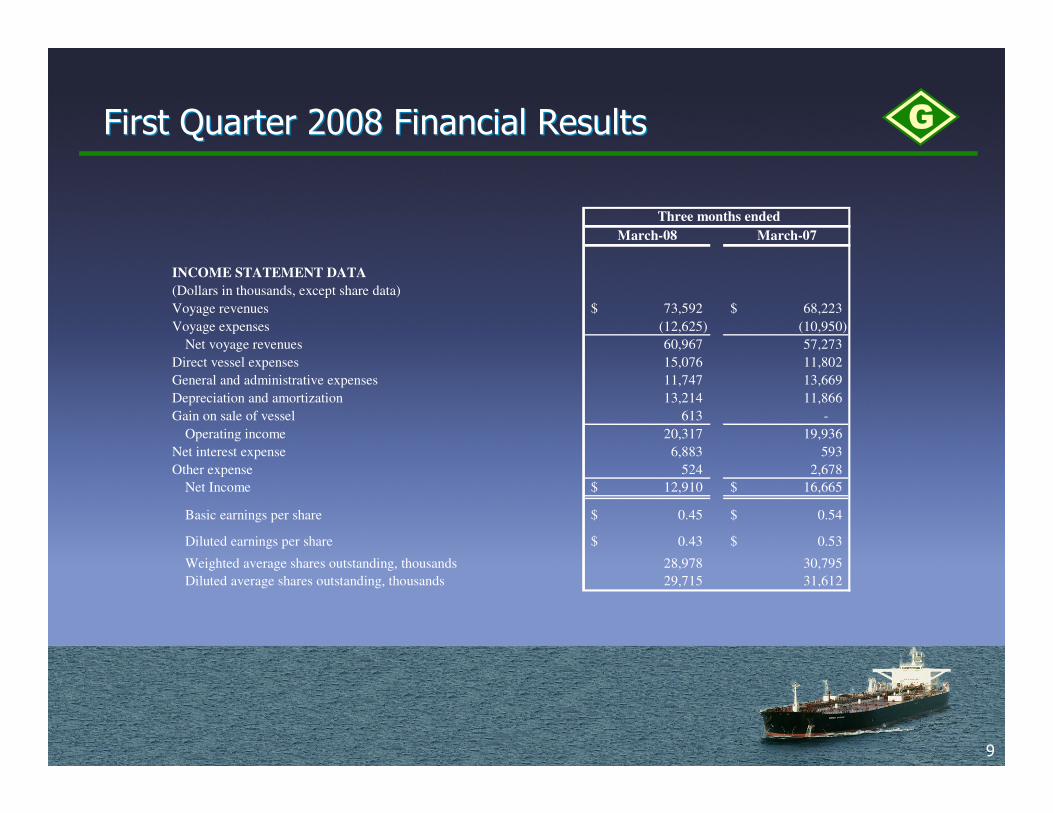
First Quarter 2008 Financial ResultsFirst Quarter 2008 Financial Results
March-08 March-07
INCOME STATEMENT DATA
(Dollars in thousands, except share data)
Voyage revenues 73,592$ 68,223$
Voyage expenses (12,625) (10,950)
Net voyage revenues 60,967 57,273
Direct vessel expenses 15,076 11,802
General and administrative expenses 11,747 13,669
Depreciation and amortization 13,214 11,866
Gain on sale of vessel 613 -
Operating income 20,317 19,936
Net interest expense 6,883 593
Other expense 524 2,678
Net Income 12,910$ 16,665$
Basic earnings per share 0.45$ 0.54$
Diluted earnings per share 0.43$ 0.53$
Weighted average shares outstanding, thousands 28,978 30,795
Diluted average shares outstanding, thousands 29,715 31,612
Three months ended
10
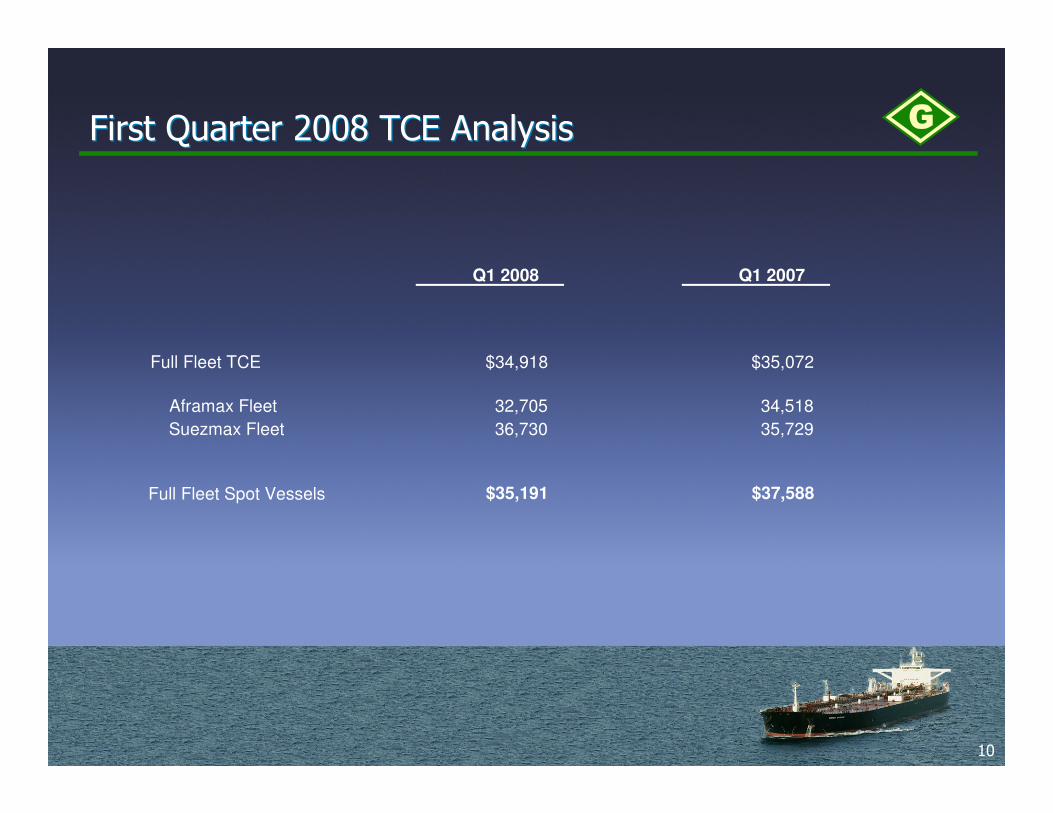
First Quarter 2008 TCE AnalysisFirst Quarter 2008 TCE Analysis
Q1 2008 Q1 2007
Full Fleet TCE $34,918 $35,072
Aframax Fleet 32,705 34,518
Suezmax Fleet 36,730 35,729
Full Fleet Spot Vessels $35,191 $37,588
11
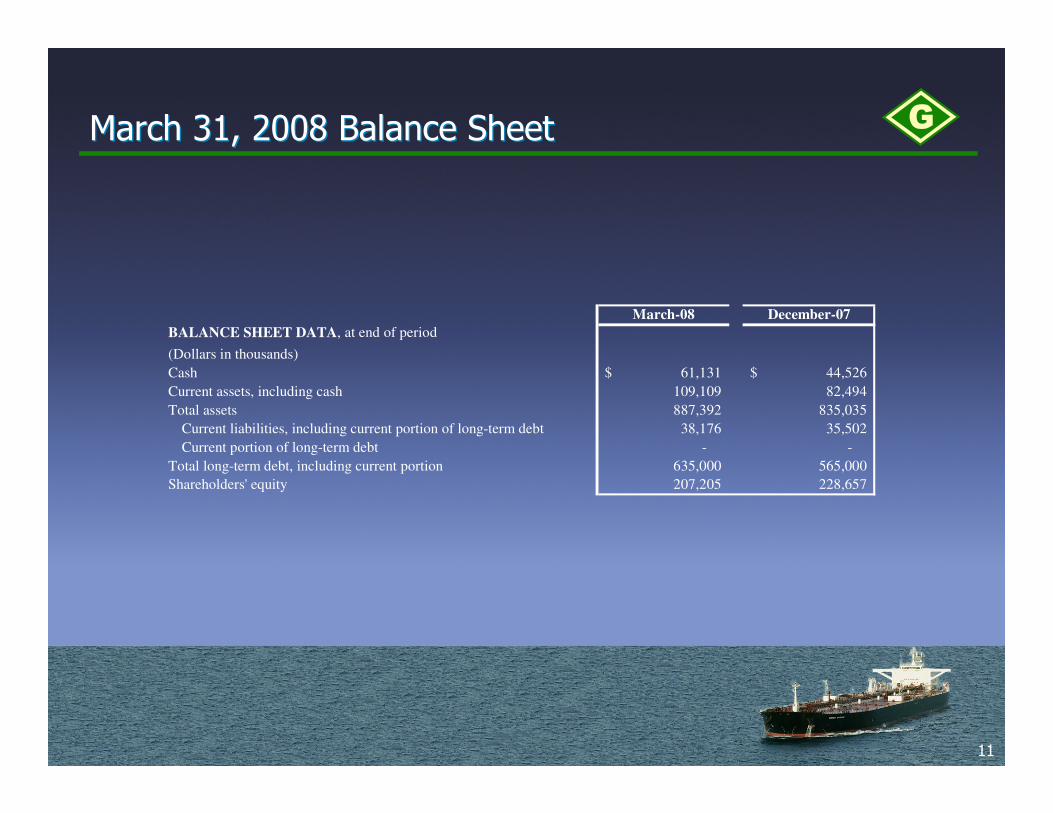
March 31, 2008 Balance SheetMarch 31, 2008 Balance Sheet
March-08 December-07
BALANCE SHEET DATA, at end of period
(Dollars in thousands)
Cash 61,131$ 44,526$
Current assets, including cash 109,109 82,494
Total assets 887,392 835,035
Current liabilities, including current portion of long-term debt 38,176 35,502
Current portion of long-term debt - -
Total long-term debt, including current portion 635,000 565,000
Shareholders' equity 207,205 228,657
12
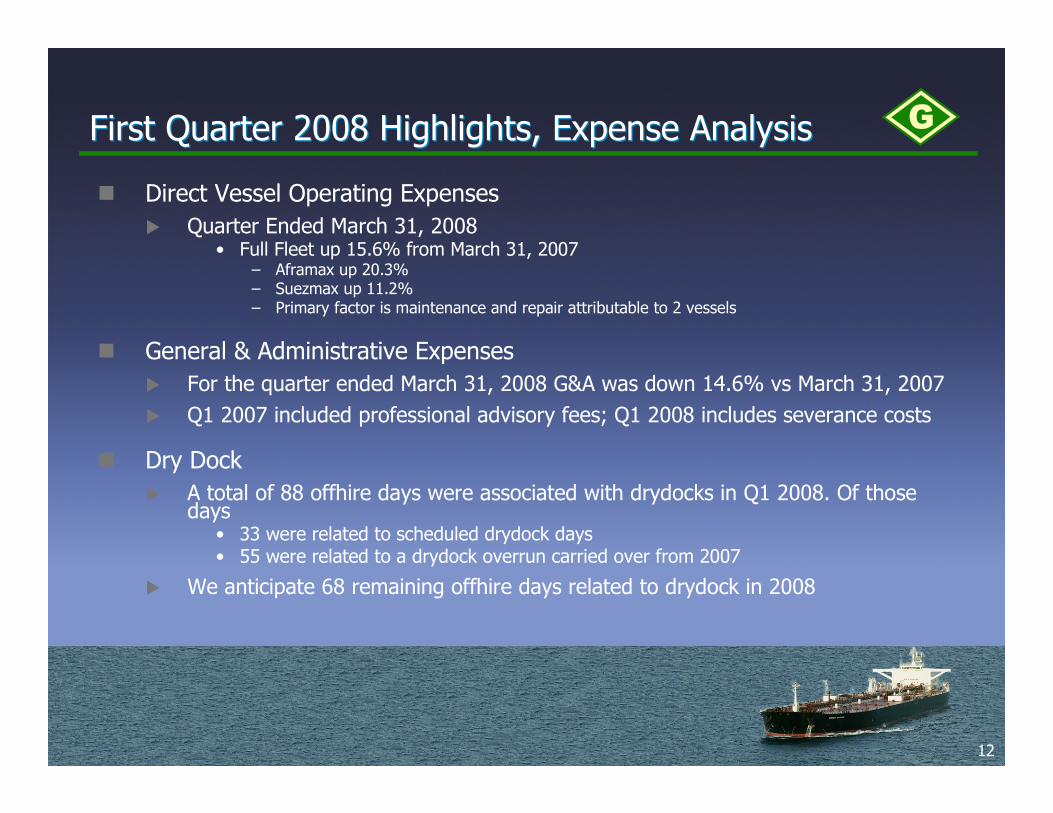
First Quarter 2008 Highlights, Expense AnalysisFirst Quarter 2008 Highlights, Expense Analysis
� Direct Vessel Operating Expenses
� Quarter Ended March 31, 2008• Full Fleet up 15.6% from March 31, 2007
– Aframax up 20.3%– Suezmax up 11.2%– Primary factor is maintenance and repair attributable to 2 vessels
� General & Administrative Expenses
� For the quarter ended March 31, 2008 G&A was down 14.6% vs March 31, 2007
� Q1 2007 included professional advisory fees; Q1 2008 includes severance costs
� Dry Dock
� A total of 88 offhire days were associated with drydocks in Q1 2008. Of those days
• 33 were related to scheduled drydock days• 55 were related to a drydock overrun carried over from 2007
� We anticipate 68 remaining offhire days related to drydock in 2008
13
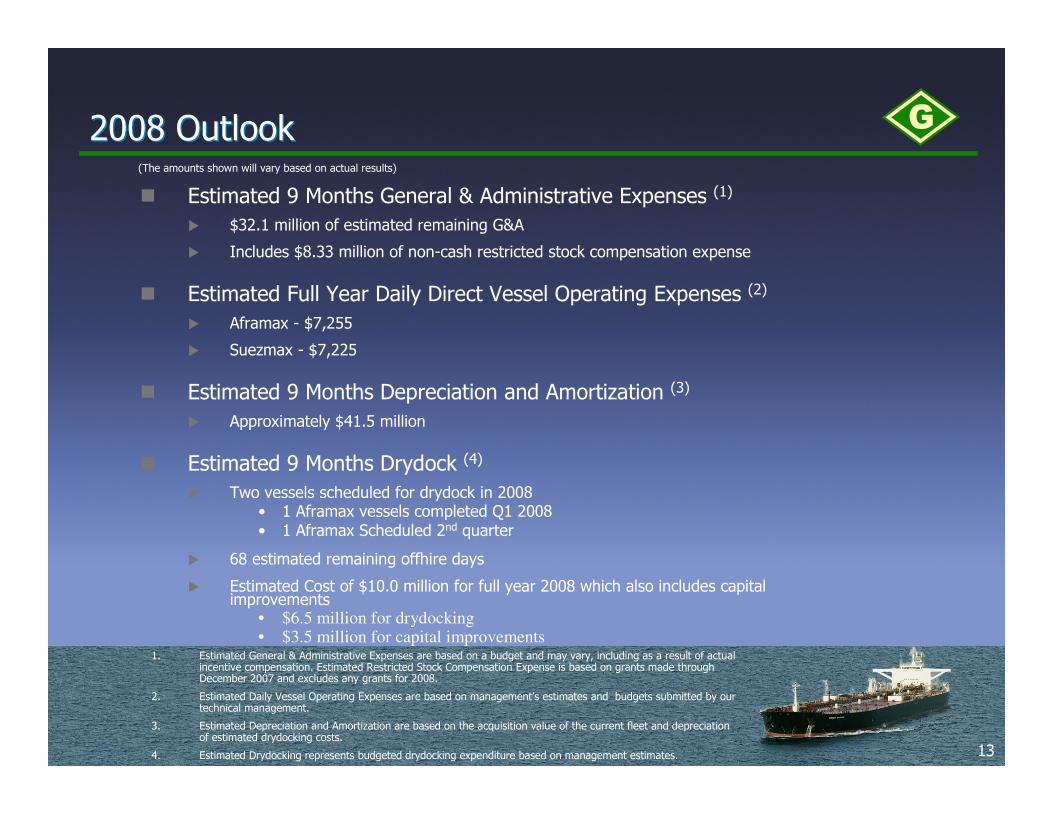
2008 Outlook2008 Outlook
� Estimated 9 Months General & Administrative Expenses (1)
� $32.1 million of estimated remaining G&A
� Includes $8.33 million of non-cash restricted stock compensation expense
� Estimated Full Year Daily Direct Vessel Operating Expenses (2)
� Aframax - $7,255
� Suezmax - $7,225
� Estimated 9 Months Depreciation and Amortization (3)
� Approximately $41.5 million
� Estimated 9 Months Drydock (4)
� Two vessels scheduled for drydock in 2008• 1 Aframax vessels completed Q1 2008• 1 Aframax Scheduled 2nd quarter
� 68 estimated remaining offhire days
� Estimated Cost of $10.0 million for full year 2008 which also includes capital improvements
• $6.5 million for drydocking• $3.5 million for capital improvements
(The amounts shown will vary based on actual results)
1. Estimated General & Administrative Expenses are based on a budget and may vary, including as a result of actual incentive compensation. Estimated Restricted Stock Compensation Expense is based on grants made through December 2007 and excludes any grants for 2008.
2. Estimated Daily Vessel Operating Expenses are based on management’s estimates and budgets submitted by our technical management.
3. Estimated Depreciation and Amortization are based on the acquisition value of the current fleet and depreciation of estimated drydocking costs.
4. Estimated Drydocking represents budgeted drydocking expenditure based on management estimates.

14
Overview of GMR Dividend Policy Overview of GMR Dividend Policy
� $2.00 per share annual fixed dividend target is intended to create visible and consistent dividend stream, which management believes the market will welcome
� The Company expects to declare dividends on a quarterly basis inFebruary, May, August and November. The target dividend is currently fixed at $0.50 per quarter or $2.00 annually
� Additional long term T/C coverage helps support the dividend andreduces volatility in the event of a declining market
15
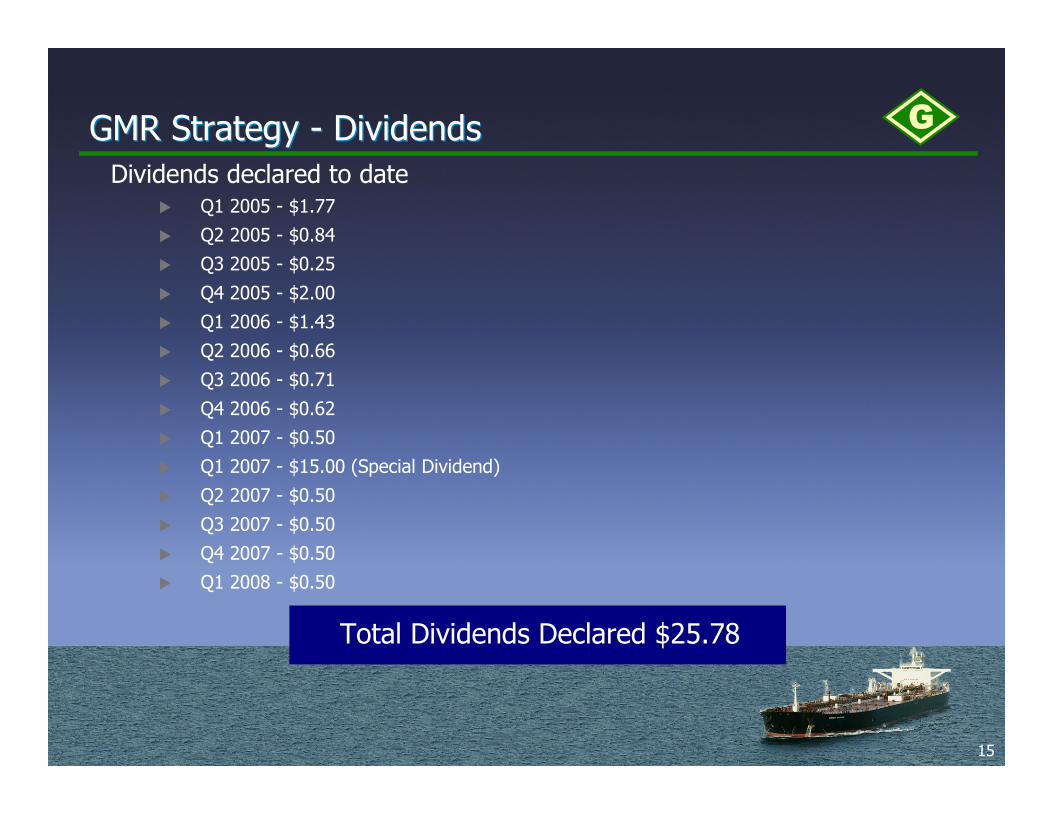
GMR Strategy - DividendsGMR Strategy - Dividends
Dividends declared to date� Q1 2005 - $1.77
� Q2 2005 - $0.84
� Q3 2005 - $0.25
� Q4 2005 - $2.00
� Q1 2006 - $1.43
� Q2 2006 - $0.66
� Q3 2006 - $0.71
� Q4 2006 - $0.62
� Q1 2007 - $0.50
� Q1 2007 - $15.00 (Special Dividend)
� Q2 2007 - $0.50
� Q3 2007 - $0.50
� Q4 2007 - $0.50
� Q1 2008 - $0.50
Total Dividends Declared $25.78
16
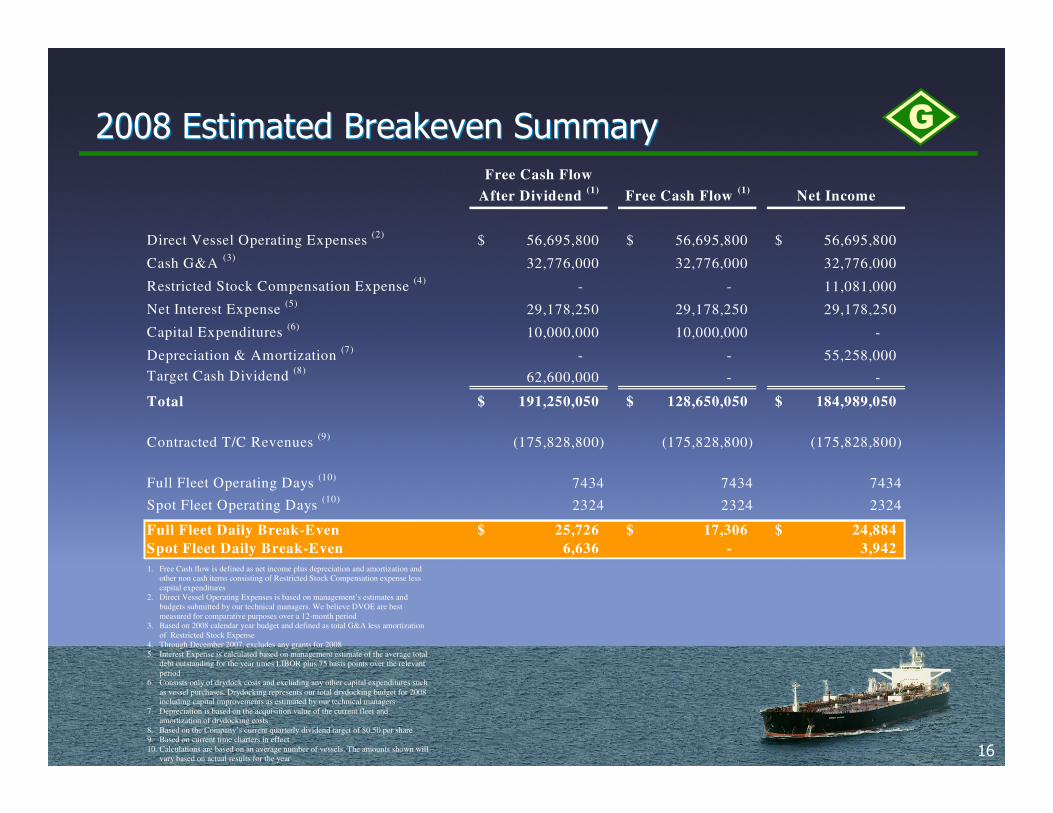
2008 Estimated Breakeven Summary2008 Estimated Breakeven SummaryFree Cash Flow
After Dividend (1)
Free Cash Flow (1)
Net Income
Direct Vessel Operating Expenses (2)
56,695,800$ 56,695,800$ 56,695,800$
Cash G&A (3)
32,776,000 32,776,000 32,776,000
Restricted Stock Compensation Expense (4)
- - 11,081,000
Net Interest Expense (5)
29,178,250 29,178,250 29,178,250
Capital Expenditures (6)
10,000,000 10,000,000 -
Depreciation & Amortization (7)
- - 55,258,000
Target Cash Dividend (8)
62,600,000 - -
Total 191,250,050$ 128,650,050$ 184,989,050$
Contracted T/C Revenues (9)
(175,828,800) (175,828,800) (175,828,800)
Full Fleet Operating Days (10)
7434 7434 7434
Spot Fleet Operating Days (10)
2324 2324 2324
Full Fleet Daily Break-Even 25,726$ 17,306$ 24,884$
Spot Fleet Daily Break-Even 6,636 - 3,942
1. Free Cash flow is defined as net income plus depreciation and amortization and other non cash items consisting of Restricted Stock Compensation expense less capital expenditures
2. Direct Vessel Operating Expenses is based on management’s estimates and budgets submitted by our technical managers. We believe DVOE are best measured for comparative purposes over a 12-month period
3. Based on 2008 calendar year budget and defined as total G&A less amortization of Restricted Stock Expense
4. Through December 2007. excludes any grants for 2008 5. Interest Expense is calculated based on management estimate of the average total
debt outstanding for the year times LIBOR plus 75 basis points over the relevant period
6. Consists only of drydock costs and excluding any other capital expenditures such as vessel purchases. Drydocking represents our total drydocking budget for 2008 including capital improvements as estimated by our technical managers
7. Depreciation is based on the acquisition value of the current fleet and amortization of drydocking costs
8. Based on the Company’s current quarterly dividend target of $0.50 per share 9. Based on current time charters in effect 10. Calculations are based on an average number of vessels. The amounts shown will
vary based on actual results for the year

17
AgendaAgenda
� First Quarter 2008 Highlights
� Financial Review
� Company Outlook & Industry Overview
� Questions
18
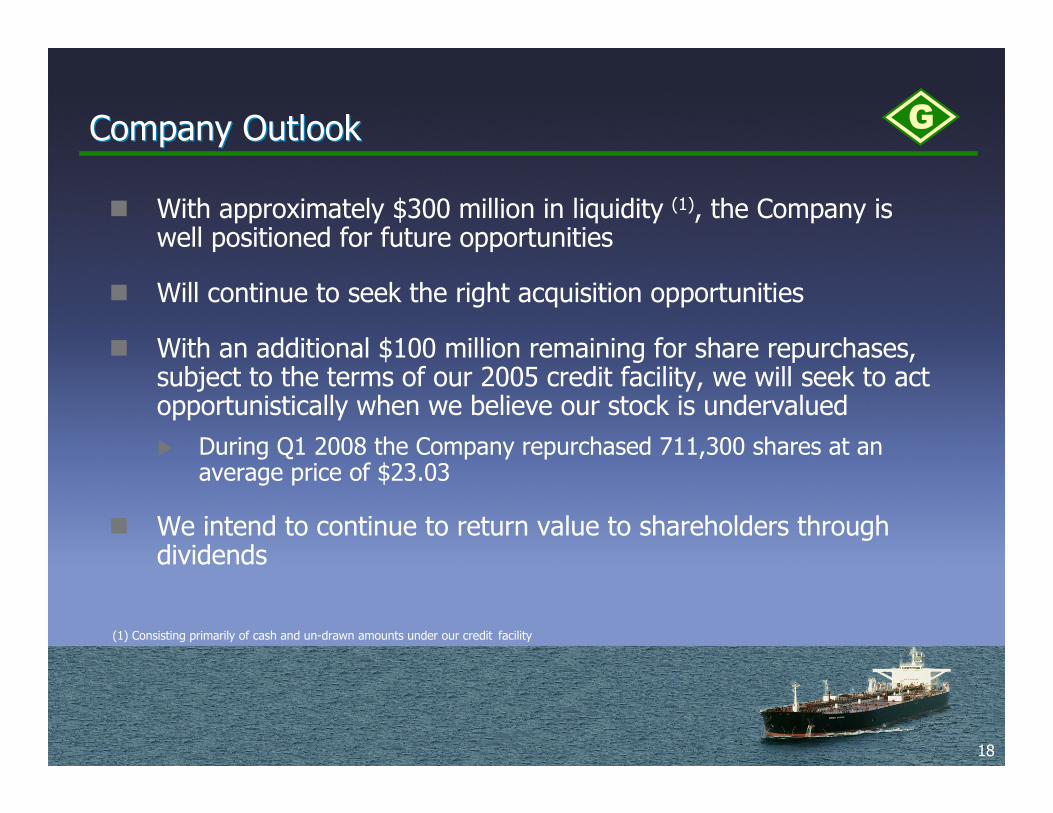
Company OutlookCompany Outlook
� With approximately $300 million in liquidity (1), the Company is well positioned for future opportunities
� Will continue to seek the right acquisition opportunities
� With an additional $100 million remaining for share repurchases,subject to the terms of our 2005 credit facility, we will seek to act opportunistically when we believe our stock is undervalued
� During Q1 2008 the Company repurchased 711,300 shares at an average price of $23.03
� We intend to continue to return value to shareholders through dividends
(1) Consisting primarily of cash and un-drawn amounts under our credit facility

19
Current Market ConditionsCurrent Market Conditions
� For Q2 2008
� 40% of available Aframax days booked at around $35,000 per day
� 54% of available Suezmax days booked at around $33,200 per day
� Current Market Rates (1)
� Aframax rates estimated to be $22,000 per day
� Suezmax rates estimated to be $65,000 per day
(1) Based on industry sources and aggregated Company data from Chartering department

20
Industry OutlookIndustry Outlook
� Q1 2008 Market Performance
� Spot Crude transportation rates were extremely volatile in Q1• The Quarter began with rates at delayed seasonal spike and moderated to lower, but still generally high rates
• Negative factors were primarily softness in demand in US from weaker economic conditions and high gasoline prices
• Positive factors included continued strong demand from BRIC nations, port delays in the Med and Gulf of Mexico, demand from new refineries in India and other new trade patterns
� Outlook for Remainder of 2008
� Demand• The IEA has gradually revised downward its global oil demand growth forecast to 1.4% from 2.3% at the beginning of the year. A number of observers believe that even this lower forecast willbe difficult to achieve, and management estimates that demand for tankers will grow at most 2-4%, dependant on ton-mile patterns

21
Industry Outlook ContinuedIndustry Outlook Continued
� Outlook for Remainder of 2008
� Supply
• Better information about removal of single hull vessels, throughscrapping or conversion has improved the net supply picture for 2008
• Sources including PIRA and Clarksons now indicate that as much as 6mm DWT of tankers have been removed from the fleet from the later part of 2007 and so far in 2008
• Combined with expected further deletions this year Clarksons now estimates that the overall crude fleet will grow net 3.0-4.0%, roughly in-line with lower demand numbers
� Overall we see rates roughly equal to 2007 though not necessarily in the same pattern as last year. The first half of 2008 looks likely to outpace the first half of 2007 while the second half may be more affected by the arrival of newbuildings
22
AgendaAgenda
� First Quarter 2008 Highlights
� Financial Review
� Company Outlook & Industry Overview
� Questions