general overview of environmental epidemiology: concepts
TRANSCRIPT

General Overview of Environmental Epidemiology:
Concepts and Challenges.
Michael Bates
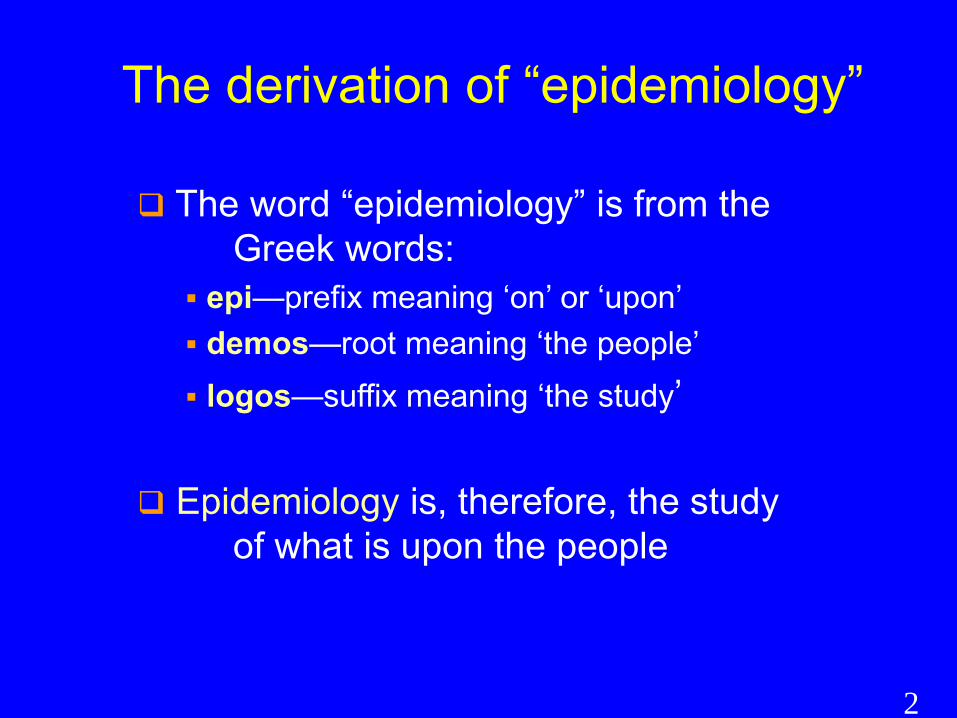
The derivation of “epidemiology”
The word “epidemiology” is from the Greek words:
epi—prefix meaning ‘on’ or ‘upon’ demos—root meaning ‘the people’ logos—suffix meaning ‘the study’
Epidemiology is, therefore, the study of what is upon the people
2

A more modern definition: Epidemiology is the study of the causes, distribution, and spread of states of health (illness and good health) in human populations, with the aim of providing information that can be used to prevent disease and promote good health.
3

Environmental epidemiology The epidemiologic investigation of the relationship between environmental exposures and states of health.
Occupational epidemiology, which investigates work-related exposure effects, is a sub-branch of environmental epidemiology.
4
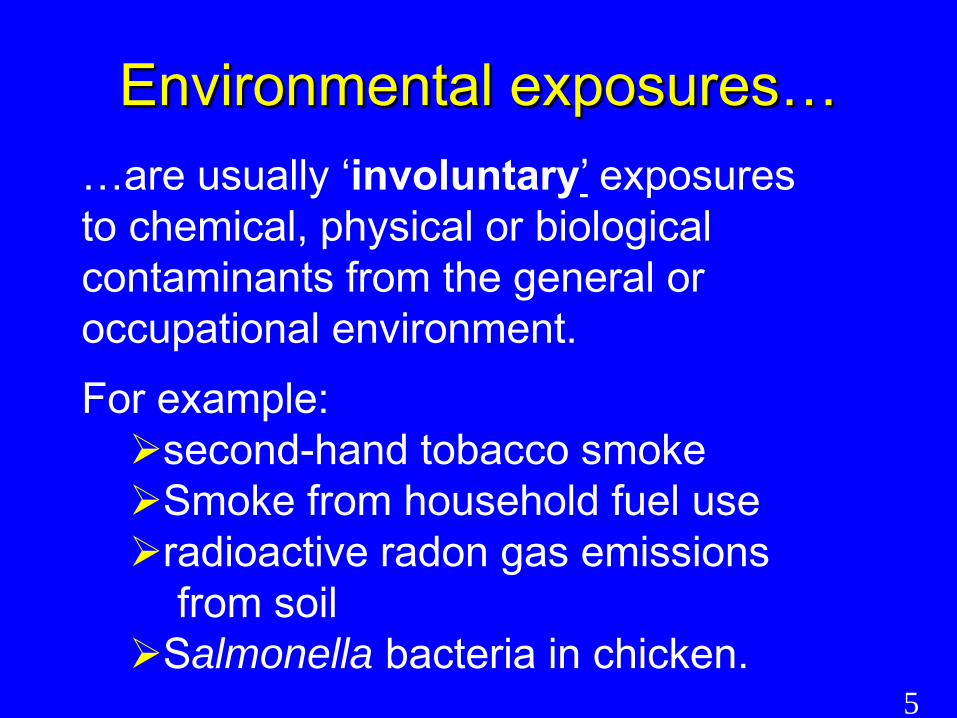
Environmental exposures… …are usually ‘involuntary’ exposures to chemical, physical or biological contaminants from the general or occupational environment.
For example: second-hand tobacco smoke Smoke from household fuel use radioactive radon gas emissions
from soil Salmonella bacteria in chicken.
5

•
•
•
•
Exposure assessment in environmental epidemiology?
Very difficult because:
Critical exposures may have happened years or decades ago.
Exposures may be very small (e.g., ppm or ppb).
Exposures may be from multiple sources (e.g., different stove types) and by multiple routes (e.g., oral, dermal, inhalation).
People cannot tell you what their exposures were.
6
–•••
–•
••
–
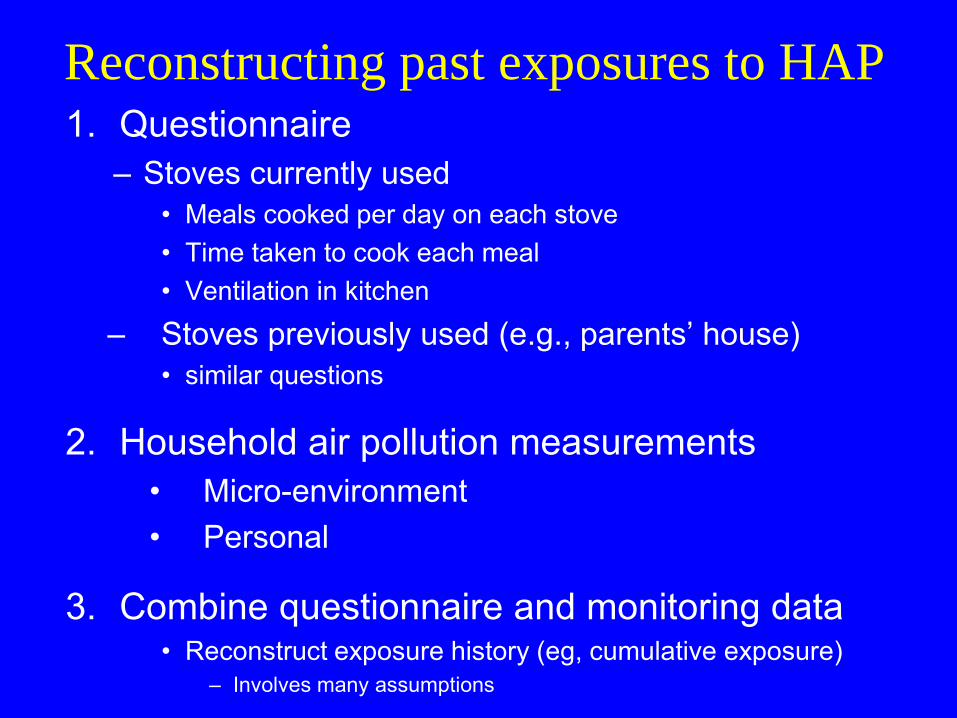
Reconstructing past exposures to HAP 1. Questionnaire
Stoves currently used Meals cooked per day on each stove Time taken to cook each meal Ventilation in kitchen
Stoves previously used (e.g., parents’ house) similar questions
2. Household air pollution measurements Micro-environment Personal
3. Combine questionnaire and monitoring data • Reconstruct exposure history (eg, cumulative exposure)
Involves many assumptions

Measures of disease occurrence Prevalence The proportion of a population with a specific type of disease, as recorded at one point in time.
e.g., the proportion of children in a school who are diagnosed asthmatics.
Incidence The rate at which new cases of disease occur in a defined population over a period of time.
e.g., number of new cases of lung cancer per 100,000 persons per year.
8
9
•
•
•
•
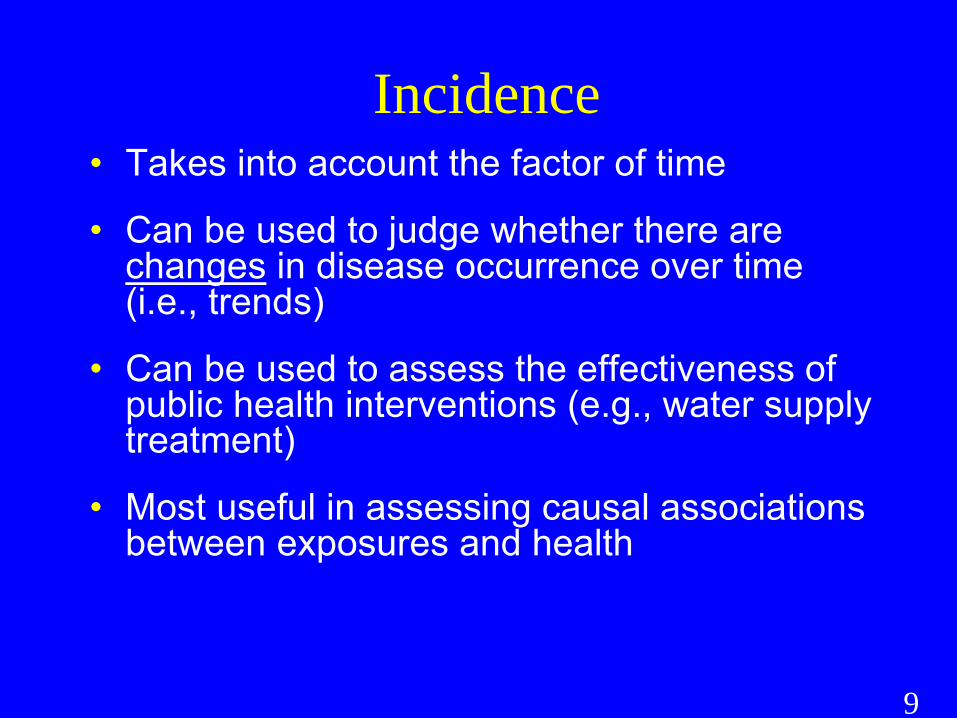
Incidence Takes into account the factor of time
Can be used to judge whether there are changes in disease occurrence over time (i.e., trends)
Can be used to assess the effectiveness of public health interventions (e.g., water supply treatment)
Most useful in assessing causal associations between exposures and health

10
•
•–––
•
Limitations of prevalence (compared to incidence)
Provides no information on rate of occurrence of new cases
Limited use for diseases which: have short duration (e.g., colds) are rapidly fatal (e.g., lung cancer). are rare (e.g., most cancers)
Most useful for persistent diseases (e.g., asthma, psoriasis)

•
•
•
The Relative Risk
A quantitative estimate of risk (e.g., an incidence measure) in an ‘exposed’ group divided by the corresponding estimate of risk in an unexposed group (i.e., it is a ratio).
A commonly used measure in epidemiology studies seeking to determine disease causes.
There are many different types of relative risk, depending on the epidemiologic study design.
11

••••••••
Relative risks from study types Odds ratio Incidence rate ratio Proportionate mortality ratio Standardized mortality ratio Standardized incidence ratio Risk ratio Prevalence ratio Prevalence odds ratio
etc.
12

•
•
•
Basic interpretation of the relative risk (RR)
RR = 1.0 implies risk is the same in both exposed and unexposed groups
RR > 1.0 implies the exposed group is at higher risk
RR < 1.0 implies the exposed group is at lower risk (i.e., the exposure is “protective”).
13

•
•
•
Importance of relative risks in environmental epidemiology?
Relative risk estimates associated with environmental contaminants are often small (e.g., < 1.5).
But exposed populations may be very large-- the entire population of a city, state, country or continent.
The implication of small relative risks applying to large populations is that very large numbers of extra cases of disease may be caused by exposure to the contaminant.
14

Epidemiology studies
Experimental studies Observational studies
15

•
•
•
•
•
Experimental studies (e.g., clinical trials) Involve random allocation of participants to treatment groups. Analogous to toxicology studies with animals. Can only be done if the treatment has the potential to be beneficial.
Observational studies Involve collecting data on the past and present real-life exposures of participants. There is no randomization or intervention by the study investigators.
16

The key difference:
In experimental studies, because of the randomization, the only difference between groups being compared should be the treatment or intervention.
In observational studies, because exposures are “observed” in real life, there is a strong possibility of bias in the results. Bias, when it occurs, distorts the size of the measured relationship between the exposure and the health condition.
17

•
•
•
Biases in environmental epidemiology:
Information bias Selection bias Confounding (bias)
18

Information bias
Also known as misclassification bias, observation bias, and measurement bias.
Involves misclassification of either health outcome or exposure status
Exposure misclassification is the major issue in most environmental epidemiology studies
19
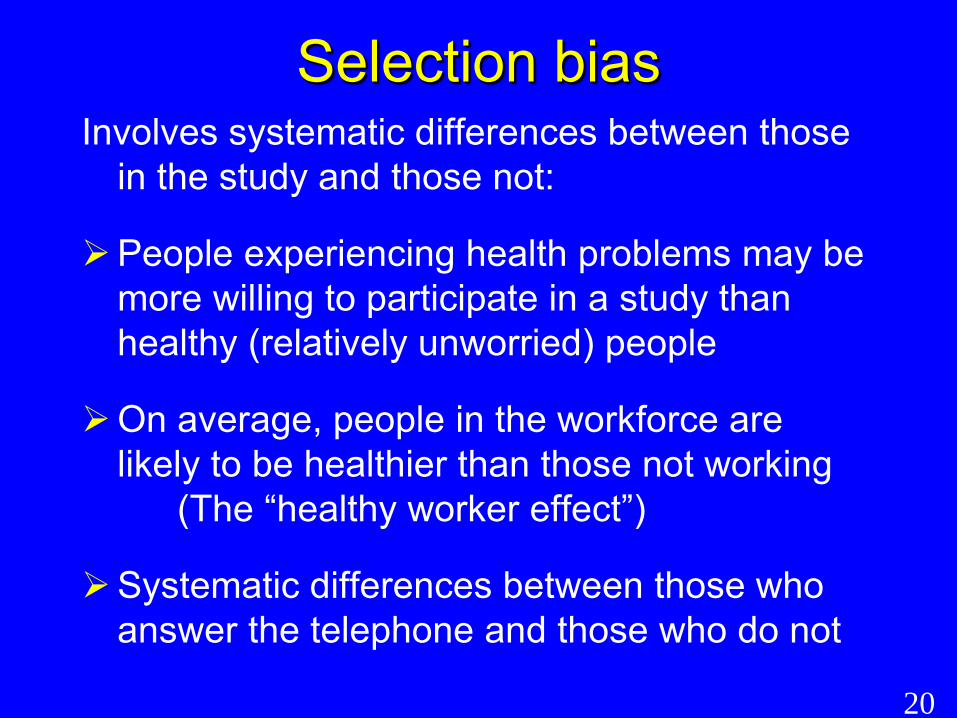
Selection bias Involves systematic differences between those
in the study and those not:
People experiencing health problems may be more willing to participate in a study than healthy (relatively unworried) people
On average, people in the workforce are likely to be healthier than those not working
(The “healthy worker effect”)
Systematic differences between those who answer the telephone and those who do not
20

•
•
•
Confounding Arises from the complex correlations of exposures in real life
e.g., people who drink coffee are more likely to be smokers than are non-coffee drinkers
Can cause “innocent” exposures to appear to have a causal role, or the reverse effect
Needs to be taken into account in the statistical analysis
21

?
Confounding example
Coffee consumption (exposure of interest)
Bladder cancer (outcome)
Cigarette smoking (confounder)
22

Descriptive studies… collect information on how exposures and/or health conditions are distributed in the study population (e.g., by age, gender, geographic area). May generate hypotheses about causes.
Analytic studies… attempt to collect and analyze data on exposures and disease/health in the study population in a way that will point to causal factors. They test hypotheses about causes.
23

•••••••
Environmental epidemiology study designs Analytic study design
Experimental (randomized) study Prospective cohort studies Case-control studies Retrospective cohort studies Cross-sectional studies Ecological studies Disease clusters
• Case series Descriptive study design
24
•
•
•
•
•
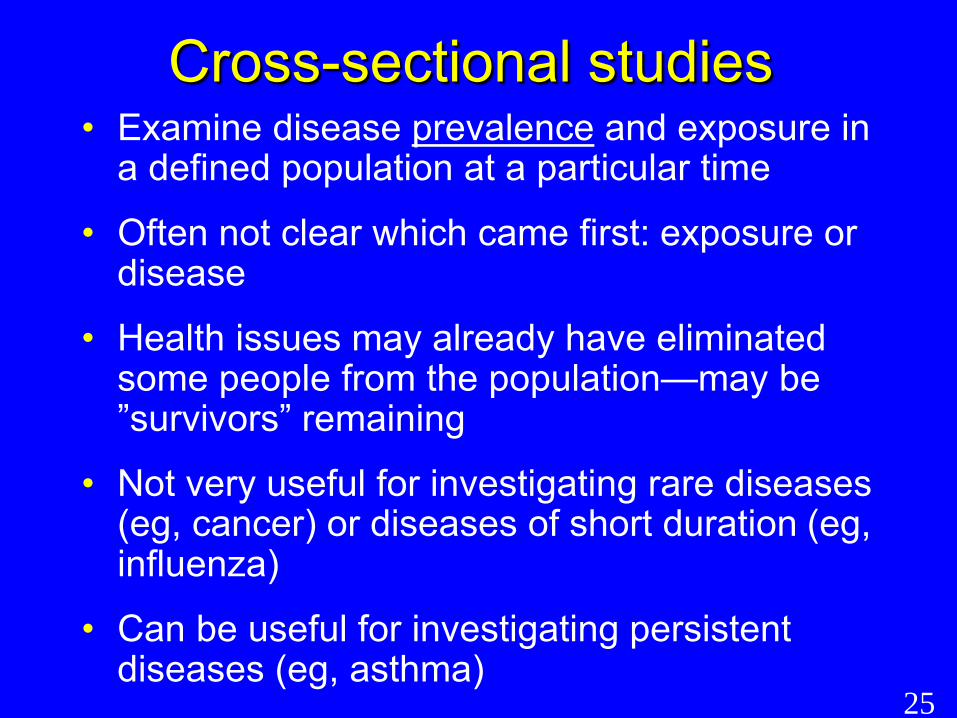
Cross-sectional studies Examine disease prevalence and exposure in a defined population at a particular time
Often not clear which came first: exposure or disease
Health issues may already have eliminated some people from the population—may be ”survivors” remaining
Not very useful for investigating rare diseases (eg, cancer) or diseases of short duration (eg, influenza)
Can be useful for investigating persistent diseases (eg, asthma)
25

26
•
•
Ecologic (correlational) studies
Correlate group measures of disease incidence with group measures of exposure
Limitations
Not known if the people with the disease are the ones with the exposure
No information on possible confounding factors
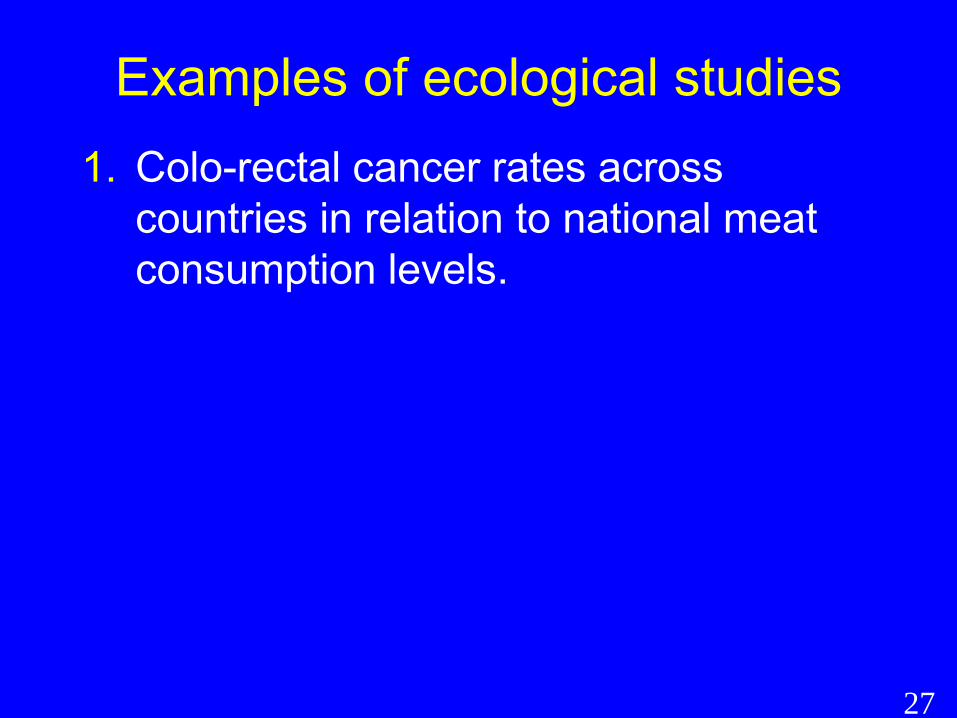
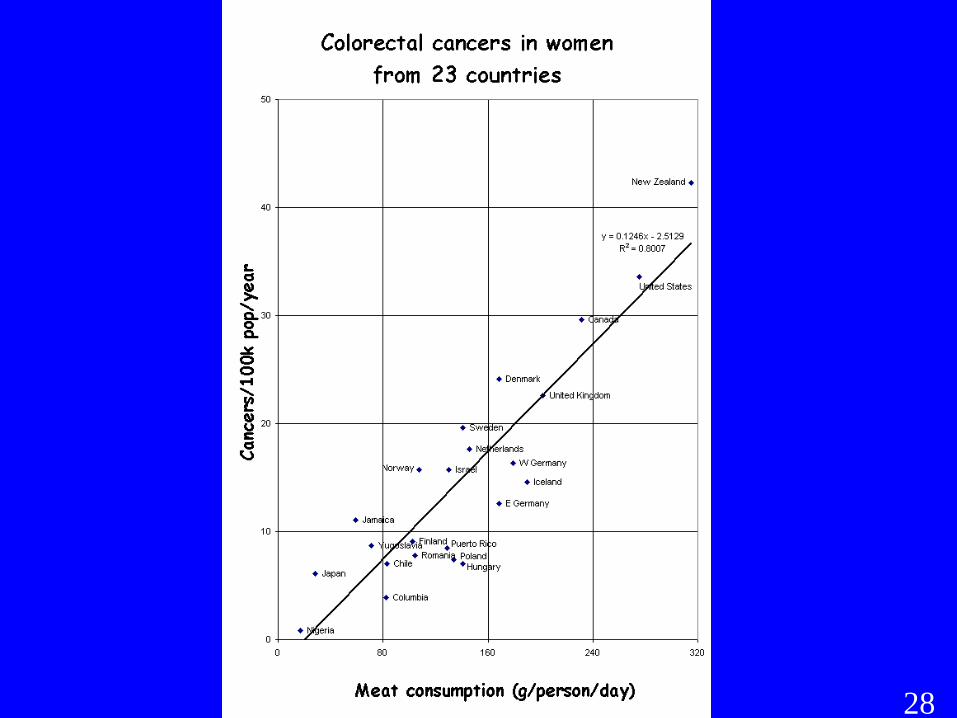
Examples of ecological studies 1. Colo-rectal cancer rates across
countries in relation to national meat consumption levels.
27
28

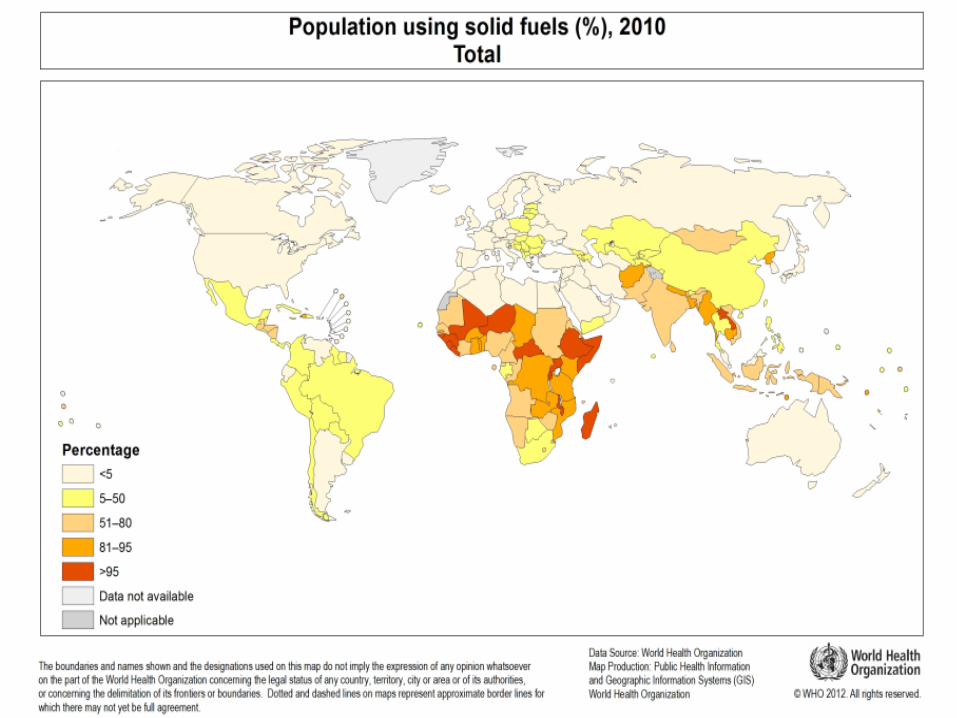
Examples of ecological studies 2. Tuberculosis incidence in relation to
household use of solid fuel, across countries of the world.
29
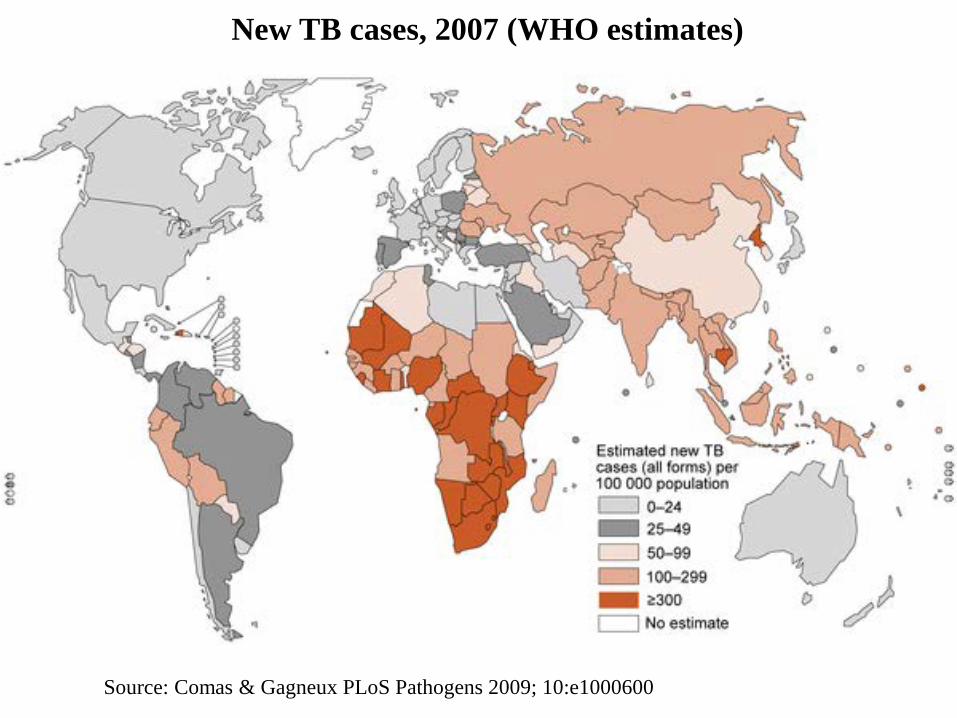
New TB cases, 2007 (WHO estimates)
Source: Comas & Gagneux PLoS Pathogens 2009; 10:e1000600
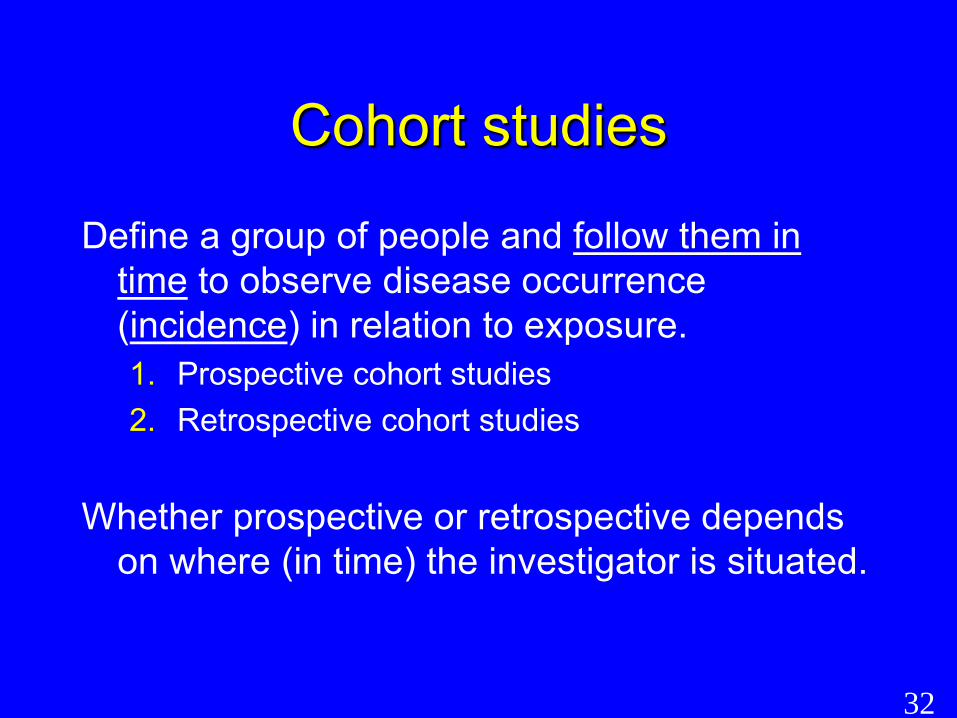
Cohort studies
Define a group of people and follow them in time to observe disease occurrence (incidence) in relation to exposure. 1. Prospective cohort studies 2. Retrospective cohort studies
Whether prospective or retrospective depends on where (in time) the investigator is situated.
32

Prospective cohort studies Investigator begins study here
33
•
•
•
•
•
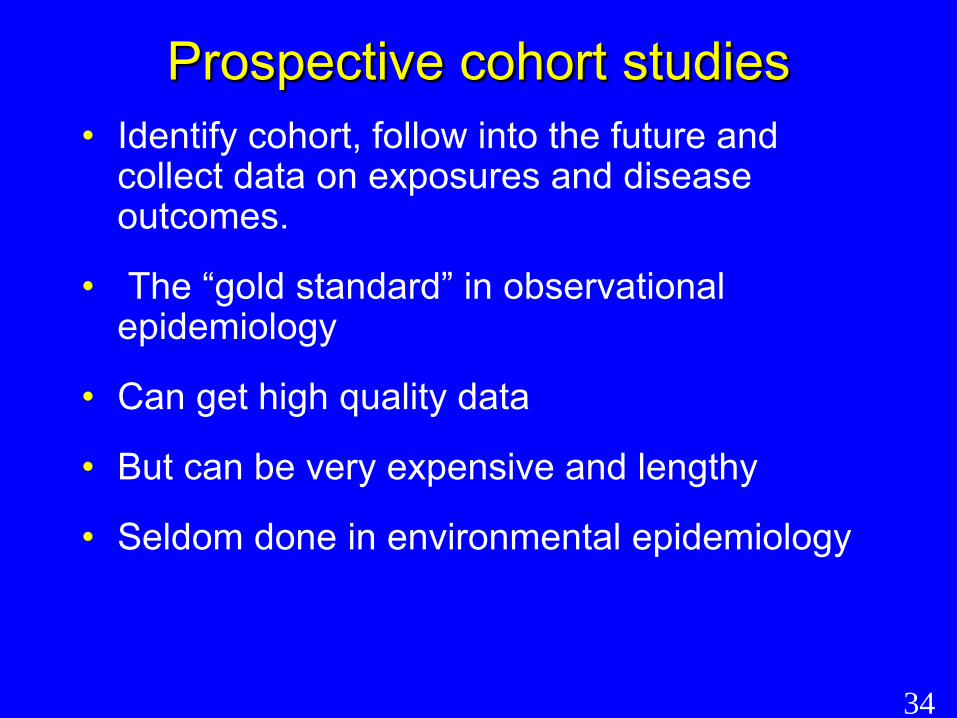
Prospective cohort studies Identify cohort, follow into the future and collect data on exposures and disease outcomes.
The “gold standard” in observational epidemiology
Can get high quality data
But can be very expensive and lengthy
Seldom done in environmental epidemiology
34

•
•
Retrospective cohort studies Define a previously existing group (e.g., workers in a particular industry) at some past time and trace their mortality or disease incidence closer to the present time
Particularly useful for studying cancer as an outcome (because of the widespread existence of cancer registries)
35

Retrospective cohort studies Information needs to be available on this population
Investigator begins study here
36

•
•
•
Retrospective cohort studies Much quicker and cheaper thanprospective cohort studies
Can study many different causes ofdeath/disease at the same time
More common in occupationalepidemiology than in environmental epidemiology, because past-existing occupational groups can often be clearly identified
37

•
•
•
•
•
•
Case-control studies Compare people with a specific disease (cases) with people without that disease (controls).
Useful for rare diseases
Can study the effects of many exposures at the same time
Common in environmental epidemiology
But… Can be very difficult to accurately reconstruct past environmental exposures
Valid control selection may be difficult
38
Multivariatemodel†OR
Multivariatemodel†95% CI
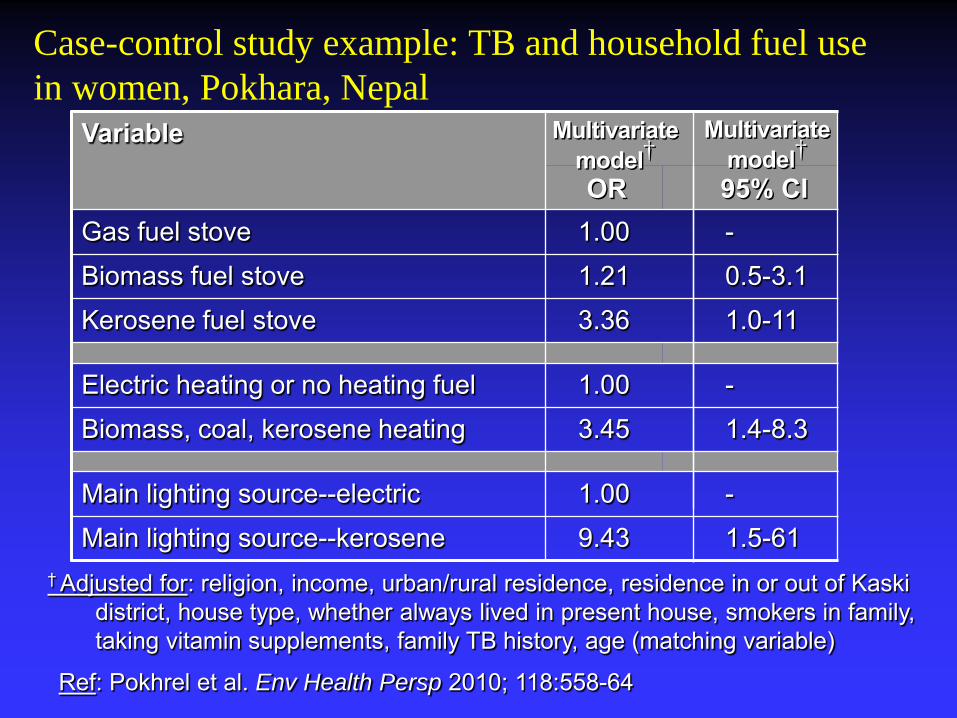
Case-control study example: TB and household fuel use in women, Pokhara, Nepal
Variable Multivariatemodel†OR
Multivariatemodel†95% CI
Gas fuel stove 1.00 - Biomass fuel stove 1.21 0.5-3.1 Kerosene fuel stove 3.36 1.0-11
Electric heating or no heating fuel 1.00 - Biomass, coal, kerosene heating 3.45 1.4-8.3
Main lighting source--electric 1.00 - Main lighting source--kerosene 9.43 1.5-61
† Adjusted for: religion, income, urban/rural residence, residence in or out of Kaski district, house type, whether always lived in present house, smokers in family, taking vitamin supplements, family TB history, age (matching variable)
Ref: Pokhrel et al. Env Health Persp 2010; 118:558-64

•
•
•
Experimental (intervention) studies
Rarely possible in environmental epidemiology.
Involve interventions, such as improved stoves (e.g., RESPIRE) or water treatment systems.
With a large study size and if randomization is properly done, there is good compliance with the assigned intervention and little loss to follow-up, then there will be little opportunity for confounding or selection bias to affect results.

Comparing toxicology and observational environmental epidemiology
Attribute Toxicology Epidemiology Type Experimental Observational Randomization Yes No Species Animals Humans Exposure levels Too high Appropriate Bias Unlikely Likely Exposure/dose measurement
Precise Imprecise
Socio-economic factors? No Yes Useful for new chemicals? Yes No Investigate interactions Seldom Easier
41

Thank you!