general review teacher · 2018-03-05 · exams and quizzes, and any review materials given to you...
TRANSCRIPT
AP* Statistics
Review
General Review
Teacher Packet
AP* is a trademark of the College Entrance Examination Board. The College Entrance Examination Board was not involved in the production of this material.
Copyright © 2009 Laying the Foundation®, Inc., Dallas, TX. All rights reserved. Visit: www.layingthefoundation.org
General Review Page 1 of 26
Copyright © 2009 Laying the Foundation®, Inc., Dallas, TX. All rights reserved. Visit: www.layingthefoundation.org
Make a study plan Make every moment count by having a study plan.
• Realistically assess your knowledge. Do you need to relearn some topics or just brush up on the details? Are there some topics that your class did not get to? Are there some topics you feel totally confident about? Don’t fool yourself into thinking you know more than you really do, but also don’t waste time studying things that you already know.
• Get organized. Find everything you will need. Gather up your notes, your old exams and quizzes, and any review materials given to you by your teacher or handed out at Saturday sessions. If you have no notes or sketchy notes, use the summaries from the ends of the chapters in your book to help you review the content.
• Reach out: If you study well with others, schedule sessions with your study group. Ask if your teacher is offering tutoring.
• Make a study plan. Look through your notes, your book, and your old quizzes and exams so that you can make a list of the topics that you need to spend the most time on.
• Start early. This is too much material to review in one night.
Writing a complete solution • If there is a yes or no question, answer it and then give evidence for your answer.
Evidence can be a number you calculated, something you noticed from a graph you made, etc. For example, your answer could end up like this: “No, thing A and thing B are not independent because P(A) is not equal to P(A|B).” Above this sentence would be your calculations of P(A) and P(A|B).
• Numerical answers with no work shown and no explanation get little or no credit. • Do not make the grader read your mind. Decide on a plan and say what you are
doing. Write down the equation you are starting with and then put numbers in. • Do NOT USE abbreviations unless they are universally accepted (like SRS).
Write out the words. • Define the symbols you use. • Write complete, grammatically correct sentences. If your initial score on a free
response problem is between two scores, the grader will often decide whether to round up or down based on the quality of your communication.
Choosing a solution strategy Look for keywords to help you make a solution plan.
• “expected value” Find the mean of a random variable using ( )iix xpx ⋅= ∑μ • “completely randomized design” Describe how to randomly assign subjects into
treatment and control groups, describe the treatments, and tell what response variable will be measured and compared. (You do not have to do a block design.)
General Review Page 2 of 26
Copyright © 2009 Laying the Foundation®, Inc., Dallas, TX. All rights reserved. Visit: www.layingthefoundation.org
• “Find the probability of getting _____ successes out of ______ tries” This is a
binomial model problem. • “Do you think the claim is true?” Do a complete significance test (hypotheses,
check the conditions, calculations, conclusions). • “Estimate the population mean or proportion.” Do a complete confidence interval
problem (check the conditions, write the interval, write a conclusion).
Basics of Describing Distributions • Read the labels on graphs carefully. For example, a cumulative frequency graph
is very different from a histogram. • If you are asked to describe or compare distributions, be sure to talk about the
shape, center, and spread of the distributions. • Understand which measures are resistant (median and IQR) and which are not
(mean and standard deviation). Know that resistant measures are needed when outliers or skewness is present.
• Know how to do linear transformations: (do not add/subtract to anything that measures spread).
Basics of Correlation • Be able to write a best fit line from computer output. • Be able to interpret slope, intercept, correlation coefficient, and r2 in context. • Know how to tell if a linear model is appropriate (by looking at the scatterplot
and the residual plot). • Know how to find residuals.
Basics of Simulations What kind of simulation is it? Geometric: Each trial continues until some condition is met. The observation of interest is the length of each trial. Binomial: Each trial has a set length n. The observation of interest is the number of successes in each trial. What should you include in your answer? “ATOM”
• Assumption: The key components must be independent of each other (because the random numbers on the table are).
• Trial: Either tell the set number (binomial) or say “go until _____ happens” (geometric)
• Observation of interest: Either the number of successes (binomial) or the trial length (geometric)
• Model: Take ___-digit numbers from the table and let these numbers represent _______. Can you use repeated numbers?
General Review Page 3 of 26
Copyright © 2009 Laying the Foundation®, Inc., Dallas, TX. All rights reserved. Visit: www.layingthefoundation.org
Do many trials to find the probability of a given event happening. Mark the trials by circling successes, drawing a line between trials, and writing the observation of interest above each trial.
Basics of Probability When you don’t know how to begin a probability problem, here are some ideas to try:
• Is it a distribution we recognize? Normal, binomial, geometric, uniform? Normal distributions will either be described as such, or you can identify them in following ways.
1) If the problem is about a mean and the sample size is over 30, the Central Limit Theorem applies, and the sampling distribution for x is
⎟⎟⎠
⎞⎜⎜⎝
⎛n
N σμ, .
2) If the problem is about a proportion (which would initially be a binomial distribution) and both 10>pn and ( ) 101 >− pn , then the normal approximation to the binomial distribution can be used, and the sampling
distribution for p̂ is ( )⎟⎟⎠
⎞⎜⎜⎝
⎛ −n
pppN 1, .
• A binomial problem will ask the probability that a certain number (k) out of n fall into a certain category. For example, it might ask the probability that at least 3 out of 8 people surveyed will vote for Candidate A. If the normal approximation doesn’t apply, you may use your calculator (binompdf and binomcdf) or the binomial formula to calculate binomial probabilities.
• A geometric problem will ask when the first success occurs. For example, how many people must be asked before you find a person who is left-handed?
• Will it help to draw a box, tree, or Venn diagram? If the overlap between two groups is given, then a Venn diagram may be useful. When you are given conditional probabilities, drawing a tree diagram or making a box/chart may help. For example, you may be told that 30% of the people in a neighborhood are dog owners and that 40% of dog owners and 25% of non-dog owners take walks daily. Since the last two percentages given are out of subgroups (dog owners and non-dog owners), a tree or box will be a good way to organize the information.
• Can it be solved as a simulation problem? (Usually, this will be stated in the problem and several rows of random digits will be given.)
• Do I need to combine two normal distributions as a sum or difference? Then use these formulas: YXYX μμμ ±=± and 222
YXYX σσσ +=± . Remember, the formula for variances can only be used if X and Y are independent. (These formulas are NOT on the formula sheet.) When you are comparing two random variables (such as the race times for two runners), you should use these formulas to find the distribution of their difference and then do a z score problem in which you generally draw a line at zero (since a difference of zero means the two runners tied).

General Review Page 4 of 26
Copyright © 2009 Laying the Foundation®, Inc., Dallas, TX. All rights reserved. Visit: www.layingthefoundation.org
• Is it a question about the expected value or mean of a random variable? If so,
write down the probability distribution chart where one column is a list of the possible outcomes ix and the other column is a list of their probabilities ( )ixP and then apply these formulas to get the mean and variance:
( )iix xPx ⋅= ∑μ and ( ) ( )ixix xPx ⋅−= ∑ 22 μσ Remember, you may use your calculator to find the mean and standard deviation if you put the ix values in L1, the ( )ixP values in L2, and you do STAT/CALC/ONE-VAR STATS L1, L2.
Basics of Confidence Intervals • In general, you must put the following three things in a confidence interval
problem: 1. Identify the interval you will use and check the conditions necessary to use the
interval. 2. Calculate the interval. 3. Interpret the interval in the context of the problem.
• Use the sample proportion p̂ when checking conditions and to calculate the standard error.
• You may use a confidence interval to test a claim: reject the claim if it falls outside the interval and do not reject the claim if it falls within the interval.
• A good conclusion will make one of these statements in the context of the question. “I am C% confident that my interval captures the population value μ or p.” or “C out of 100 intervals constructed using this method would capture the population value μ or p.”
• Avoid any statement that makes your interval sound special (since you do not know if it is one of the good ones or not). Also, avoid making it sound like the population value μ or p is random. The intervals are random because they are based on random samples. Do NOT say the following: “C% of the x values or p̂ values would fall in my interval.” “C% of the data is in my interval.”
“There is a C% chance that the population value μ or p is in my interval.”
General Review Page 5 of 26
Copyright © 2009 Laying the Foundation®, Inc., Dallas, TX. All rights reserved. Visit: www.layingthefoundation.org
Basics of Significance Tests • In general, you must put the following four things in a significance test problem: 1. A null and an alternative hypothesis (define the parameter of interest in words) Note: Always hypothesize about the unknown population parameters (μ and p), not the sample statistics ( x and p̂ ), which are known from the data. 2. Identify the test you are using and check the conditions necessary for doing that test. 3. Your calculations should include a formula for the test statistic ( z or t or 2χ ), a value for the statistic (can be from calculator if you have written the formula) and a shaded picture of the distribution if you have time to draw it, and the P value (from calculator or table) related to the α -level, plus df for t-tests or the expected values for 2χ tests 4. Two conclusions: either reject H0 or don’t reject it based on the relationship of the P-value and the α –level AND write a conclusion about the alternative hypothesis in the context of the problem.
General Review Page 6 of 26
Copyright © 2009 Laying the Foundation®, Inc., Dallas, TX. All rights reserved. Visit: www.layingthefoundation.org
TI-84 Calculator Use in AP Statistics Numbers after calculator choices indicate where that choice is on the menu. The numbers may be used as a shortcut instead of using the arrow keys to go to the choice you want and then hitting ENTER.
Descriptive Statistics Entering data into lists Choose STAT/EDIT(1). You may clear lists by moving the cursor to the very top, highlighting the name of the list, and pressing CLEAR. Making plots First make sure that you have no functions in “Y =” because those will show up on your graphs, too. STATPLOT/choose one. Turn it on, pick a type (scatterplot, line plot, histogram, modified boxplot, boxplot, normal quantile plot). Choose the correct lists for Xlist (and Ylist if applicable). Make sure Freq = 1 unless you are doing advanced plots. Choose ZOOM/ZOOMSTAT(9). If you are making a histogram, choose WINDOW and make sure XScl = 1 or some other appropriate value. Calculating one variable statistics After your data is in a list, choose STAT/CALC/1-var Stats(1). Give the name of the list you would like to use, then press ENTER. (List L1 is the default.) The output includes the mean, standard deviation, and the five number summary. Calculating one variable statistics with frequency or relative frequency information (How to get expected value and standard deviation from a probability model or distribution.) After your data is in L1 and either your frequencies or relative frequencies are in L2, choose STAT/CALC/1-Var Stats(1). Give the names of both lists with a comma between them, then press ENTER. The output includes the mean, standard deviation, and the five number summary.

General Review Page 7 of 26
Copyright © 2009 Laying the Foundation®, Inc., Dallas, TX. All rights reserved. Visit: www.layingthefoundation.org
Correlation
Finding a best fit line and correlation coefficient After your data is in two lists (x and y), choose STAT/CALC/Lin-Reg(4). Give the name of your x list, followed by a comma and the name of your y list, then press ENTER. (L1 and L2 are the defaults.) The output will include the slope and y-intercept of the best fit line as well as the correlation coefficient, r. If you do not see the correlation coefficient, go to CATALOG, choose DiagnosticOn, and press ENTER. You only have to do this once for each calculator unless the memory is totally cleared later. Putting the best fit line onto the scatterplot After entering the data, making a scatterplot, and calculating the best-fit line, go to the Y= screen. At the first prompt, choose VARS/Statistics (5)/EQ/RegEQ(1).
The Normal and Binomial Distributions Note: cdf stands for cumulative distribution function. This adds up probabilities for a range of outcomes. pdf stands for probability distribution function Finding the area under a normal curve First, draw a label a graph on paper, shading the area you are looking for and labeling the graph with the information you know. Go to DISTR/normalcdf(2). If you know the z-scores for the area you want, in the parentheses put the lower z limit and then the upper z limit separated by commas. Use –1EE99 for negative infinity and 1EE99 for positive infinity. After you hit ENTER, the calculator will tell you the area under the curve (probability) between your 2 z values. Your input should look like this: normalcdf(lower z limit, upper z limit). If you do not know the z scores, you may let the calculator find them for you. In the parentheses, put the lower x limit, the upper x limit, the mean of the normal distribution, and the standard deviation of the normal distribution. The latter two values are used to convert your x values into z values. Your input should look like this: normalcdf(lower x limit, upper x limit, mean, standard deviation). Finding a z-score corresponding to a given area under the normal curve First, draw a label a graph on paper, shading the area you are looking for and labeling the graph with the information you know.

General Review Page 8 of 26
Copyright © 2009 Laying the Foundation®, Inc., Dallas, TX. All rights reserved. Visit: www.layingthefoundation.org
Go to DISTR/invNorm(3). You must input the proportion (area) to the left of the z-score you are looking for. Let’s call this A. If you are given the area to the right, subtract that from 1 to get A. Put this number in the parentheses, and the calculator will give you the z-score that separates the distribution into two parts: one with area A to the left of that z-score and one with area 1-A to the right of that z-score. Your input should look like this: invnorm(area or proportion to the left of the line). You may also find the x instead of the z: Your input should look like this: invnorm(proportion to the left, mean, standard deviation). Finding a binomial distribution probability for a single outcome For binomial distributions, the relevant variables are N (the number in the sample) and p (the probability of the outcome you are looking for). X is the number of successes you have out of N. To calculate the probability that X is exactly equal to one number, go to DISTR/binompdf(0). To find the probability that X is equal to the number Q, plug N, p and Q into the parentheses, separated by commas. In other words, P(X = Q) = binompdf(N, p, Q). Finding a binomial distribution probability for a group of outcomes To calculate the probability that X is less than or equal to a particular number Q, go to DISTR/binomcdf(A). To find the probability that X is less than or equal to the number Q, plug N, p and Q into the parentheses, separated by commas. In other words, P(X <= Q) = binomcdf(N, p, Q). To calculate the probability that X is greater than a particular number Q, use the complement rule. Since the probabilities up to and including Q plus the probabilities from Q+1 on up must equal one, you get that P(X>Q) = 1 - binomcdf(N, p, Q). To calculate the probability that X is greater than or equal to a particular number Q, you also use the complement rule, but you have to be careful. Since the probabilities up to and including Q-1 plus the probabilities from Q on up must equal one, you get that P(X=>Q) = 1 - binomcdf(N, p, Q-1).

General Review Page 9 of 26
Copyright © 2009 Laying the Foundation®, Inc., Dallas, TX. All rights reserved. Visit: www.layingthefoundation.org
Tests of Significance
Note: There are two options when doing any confidence interval or significance test on the calculator. You may either choose to input the entire list of data, or just the relevant statistics (such as the sample mean, the sample standard deviation, the sample size, or the sample proportion.) Finding confidence intervals You may do one sample z intervals, one sample t intervals, two sample z intervals, two sample t intervals, one sample z proportion intervals, or two sample z proportion intervals on the calculator. Be sure to justify that you can actually use the interval that you choose for the problem you are given. (Check the assumptions for using the interval!!!) If you do not know the sample statistics, but you have the entire list of data, put them in a list first. Go to STAT/TESTS. The confidence intervals are options 7 through B. Choose DATA if you have already put the data in a list. Specify which list and give the confidence level either as a decimal (0.95) or as a percent (95). Choose CALCULATE to get the interval. If you do not have the data in a list, but you already know the sample statistics, choose STATS. Fill in all necessary information, such as the sample size(s), the mean(s), standard deviation(s), or proportion(s). Choose CALCULATE. Performing tests of significance You may do one sample z tests, one sample t tests, two sample z tests, two sample t tests, one sample z proportion tests, or two sample z proportion tests on the calculator. Be sure to justify that you can actually use the test that you choose for the problem you are given. (Check the assumptions for the test!!!) If you do not know the sample statistics, but you have the entire list of data, put them in a list first. Go to STAT/TESTS. The significance tests are options 1 through 6. Choose DATA if you have already put the data in a list. You must first enter the value that will go in your null hypothesis (for one sample tests only. Two sample tests always use the hypothesis that the two means or proportions are equal.) Specify which list your data is in. Choose which alternative hypothesis you want to test. You may choose a two sided hypothesis or either one-sided hypothesis. Choose CALCULATE to get the value for z or t and the P-value of the test. Choose DRAW to see the z or t distribution with the appropriate region shaded. (If you choose DRAW and you get errors, make sure you have nothing on the Y= screen and that all of your statplots are off.) If you do not have the data in a list, but you already know the sample statistics, choose STATS. After giving the value for the null hypothesis, fill in all necessary information, such as the sample size(s), the mean(s), standard deviation(s), or proportion(s). Choose

General Review Page 10 of 26
Copyright © 2009 Laying the Foundation®, Inc., Dallas, TX. All rights reserved. Visit: www.layingthefoundation.org
the alternative hypothesis you want and choose either CALCULATE or DRAW as before. Performing chi-squared tests To do a chi-squared test for independence of rows and columns or for homogeneity, first check the assumptions necessary to do the test. Then go to the MATRIX menu and choose EDIT. Pick a matrix to edit. First fill in the number of rows and columns, then fill in your observed values, using either the ENTER key or the arrows to move between matrix entries. You do not have to format a matrix for your predicted values. As long as the other matrix exists (has a name), the calculator will make it the right size while performing the test. Choose QUIT to exit the matrix menu. Go to STAT/TESTS and choose χ2-TEST (C). Input the names of the matrices for your observed and predicted values and choose CALCULATE or DRAW as before. After performing the test, you may go back to the MATRIX menu, choose EDIT, and look at the predicted values that were determined by the calculator. (For a complete answer, these values should be written in parentheses after the observed values.)
General Review Page 11 of 26
Copyright © 2009 Laying the Foundation®, Inc., Dallas, TX. All rights reserved. Visit: www.layingthefoundation.org
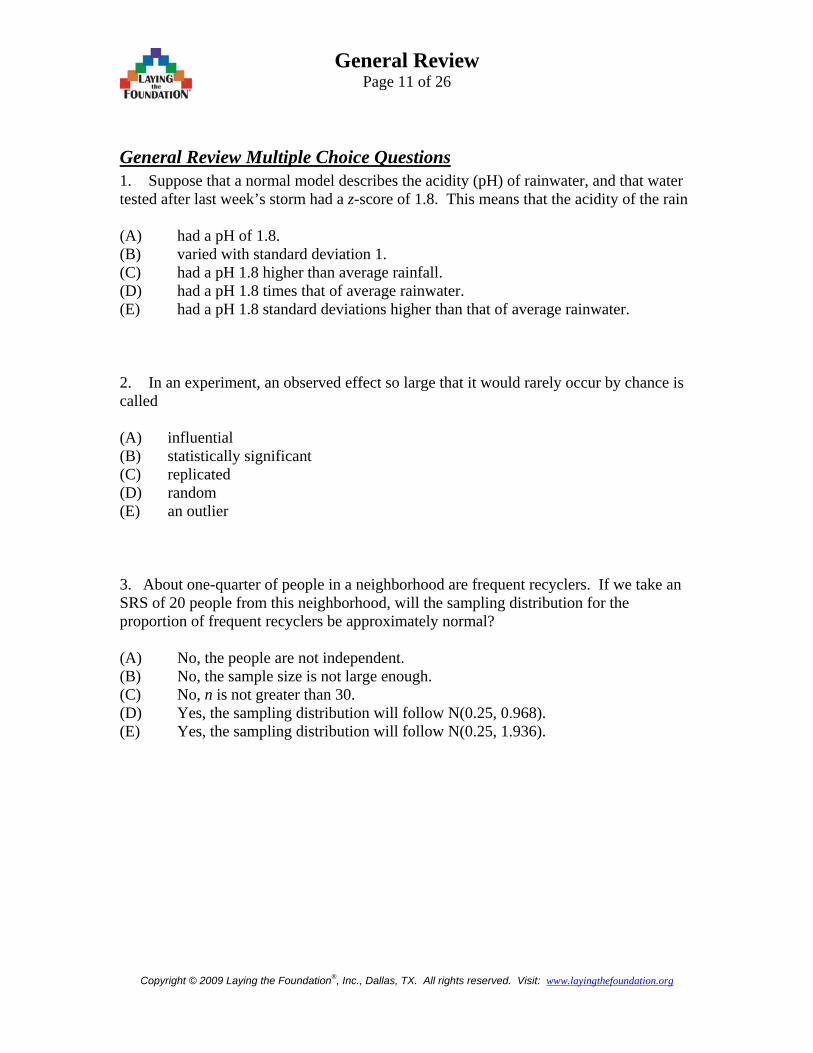
General Review Multiple Choice Questions 1. Suppose that a normal model describes the acidity (pH) of rainwater, and that water tested after last week’s storm had a z-score of 1.8. This means that the acidity of the rain (A) had a pH of 1.8. (B) varied with standard deviation 1. (C) had a pH 1.8 higher than average rainfall. (D) had a pH 1.8 times that of average rainwater. (E) had a pH 1.8 standard deviations higher than that of average rainwater. 2. In an experiment, an observed effect so large that it would rarely occur by chance is called (A) influential (B) statistically significant (C) replicated (D) random (E) an outlier 3. About one-quarter of people in a neighborhood are frequent recyclers. If we take an SRS of 20 people from this neighborhood, will the sampling distribution for the proportion of frequent recyclers be approximately normal? (A) No, the people are not independent. (B) No, the sample size is not large enough. (C) No, n is not greater than 30. (D) Yes, the sampling distribution will follow N(0.25, 0.968). (E) Yes, the sampling distribution will follow N(0.25, 1.936).

General Review Page 12 of 26
Copyright © 2009 Laying the Foundation®, Inc., Dallas, TX. All rights reserved. Visit: www.layingthefoundation.org
4. A survey of some AP Stats students recorded gender and whether or not the student was left or right-handed. Results were summarized in the table below. If it turned out that handedness were independent of gender, how many of the AP Stats students were lefty girls?
Lefty Righty Total Male 66 Female ??? 54 Total 20 100 120
(A) 4 (B) 7 (C) 9 (D) 10 (E) The number cannot be determined. 5. We suspect that the cans of a generic brand of cola are being underfilled. Suppose that these cans of generic cola really contain 12 ounces, the amount stated on the label. We measure the amount of cola in a simple random sample of cans, and our data results in a P value of 0.0004. What probably happens as a result of our experiment? (A) We correctly fail to reject H0. (B) We correctly reject H0. (C) We reject H0, making a Type I error. (D) We reject H0, making a Type II error. (E) We fail to reject H0, making a Type II error. 6. You define two events, A and B. If P(A) = 0.45, P(B) = 0.25 and P(A or B) = 0.68, then the two events are (A) mutually exclusive but not independent. (B) independent but not mutually exclusive. (C) mutually exclusive and independent. (D) neither mutually exclusive nor independent. (E) not enough information is given to determine whether A and B are mutually exclusive or independent. 7. Two variables in a study are said to be confounded if (A) they are highly correlated. (B) one causes the other. (C) they do not have a normal distribution. (D) one cannot separate their effects on a response variable. (E) one of them is a placebo.

General Review Page 13 of 26
Copyright © 2009 Laying the Foundation®, Inc., Dallas, TX. All rights reserved. Visit: www.layingthefoundation.org
8. An insurance company issues a policy on a small boat under the following conditions: The replacement cost ($5000) will be paid for a total loss. If it is not a total loss, but the damage is more than $2000, then $1500 will be paid. Nothing will be paid for damage costing $2000 or less and of course nothing is paid out if there is no damage. The company estimates the probability of the first three events as 0.02, 0.10, and 0.30, respectively. The amount the company should charge if it wishes to make a profit of $50 above the expected amount paid out in a year is: (A) $250 (B) $201 (C) $300 (D) $1200 (E) $165 9. How does quadrupling the sample size affect the width of a confidence interval? (A) The width of the interval becomes half as large. (B) The width of the interval becomes two times as large. (C) The width of the interval becomes four times as large. (D) The width of the interval becomes one fourth as large. (E) The width of the interval is unchanged. 10. Political analysts estimate the probability that Candidate A will run for Texas governor as a Republican in the next election is 70%, and the probability that Candidate B will run as the Democratic candidate is 20%. If their political decisions are independent, then what is the probability that Candidate A runs for governor but Candidate B doesn’t?
(A) 14% (B) 30% (C) 44% (D) 56% (E) 80%

General Review Page 14 of 26
Copyright © 2009 Laying the Foundation®, Inc., Dallas, TX. All rights reserved. Visit: www.layingthefoundation.org
Questions 11 and 12: Two independent random variables have the following means and standard deviations.
Mean Standard deviation X 100 20 Y 42 7
11. Find the mean and standard deviation of 3X + 5. (A) mean is 305, standard deviation is 20 (B) mean is 300, standard deviation is 20 (C) mean is 305, standard deviation is 65 (D) mean is 305, standard deviation is 60 (E) mean is 300, standard deviation is 60 12. Find the mean and standard deviation of X – Y. (A) mean is 142, standard deviation is 13 (B) mean is 58, standard deviation is 21.2 (C) mean is 58, standard deviation is 18.7 (D) mean is 58, standard deviation is 13 (E) mean is 142, standard deviation is 18.7 13. The quality control supervisor at a local bakery is trying to determine if the new personnel are making the one-pound loaves come out overweight. A one-sample t-test for a mean was conducted. A sample mean of 1.3 pounds resulted in a P-value of 0.085. This means that (A) there is an 8.5% chance that the null hypothesis is true. (B) there is an 8.5% chance of observing a sample result of at least 1.3, when the null hypothesis is true. (C) there is an 8.5% chance of observing a sample result of at least 1.3, when the null hypothesis is false. (D) there is an 8.5% chance that the alternate hypothesis is true. (E) there is an 8.5% chance that the one-pound loaves are overweight.

General Review Page 15 of 26
Copyright © 2009 Laying the Foundation®, Inc., Dallas, TX. All rights reserved. Visit: www.layingthefoundation.org
14. The following two-way table categorizes suicides committed in 1983 by the sex of the victim and the method used.
Method Male Female Row totals
Firearms 13,959 2,641 16,600 Poison 3,148 2,469 5,617 Hanging 3,222 709 3,931 Other 1,457 690 2,147 Total 21,786 6,509 28,295
From this table, what would be the best conclusion about 1983? (A) Simpson's Paradox was demonstrated by the data. (B) There was no relation between the sex of the victim and the method of suicide used. (C) Females were responsible for a higher percentage of the suicides committed by using poison than males. (D) Males accounted for roughly 77% of all suicides, regardless of method. (E) Firearms were used in roughly 90% of all suicides, regardless of sex. 15. The expected number of repairs a certain type of computer will need in a year is 1.3 repairs with a standard deviation of 0.7 repairs. To get a service contract on this computer, you must pay $100 plus $25 per repair. Find the mean and standard deviation of the amount a service contract will cost for this kind of computer. (A) mean is $132.50; standard deviation is $117.50 (B) mean is $132.50; standard deviation is $17.50 (C) mean is $132.50; standard deviation is $306.25 (D) mean is $162.50; standard deviation is $117.50 (E) none of these are true

General Review Page 16 of 26
Copyright © 2009 Laying the Foundation®, Inc., Dallas, TX. All rights reserved. Visit: www.layingthefoundation.org
General Review Free Response Questions 1. Two teachers do the newspaper crossword puzzle every day. Teacher A’s time is normally distributed with a mean of 28 minutes and a standard deviation of 8 minutes, while Teacher B’s time to complete the crossword follows the N(24 min, 6 min) distribution. Assume the teacher’s completion times are independent of each other. (a) What is the probability that, on a randomly chosen day, Teacher A will finish the crossword more quickly? Justify your answer. (b) Both Teacher A and Teacher B do the crossword every day for a month and average their completion times. In a 30-day month, what is the probability that Teacher A’s average time will be quicker than Teacher B’s average time? (Assume the crossword puzzles are randomly selected by the newspaper, so that this month has its fair share of both easier and harder puzzles.)

General Review Page 17 of 26
Copyright © 2009 Laying the Foundation®, Inc., Dallas, TX. All rights reserved. Visit: www.layingthefoundation.org
2. Can a food additive increase milk production in dairy cows? Agricultural researchers want to design an experiment to find out. They have 100 cows available for the study. They will test two kinds of feed: the regular feed and the new feed with the additive. They plan to run their test for a month. (a) Design an experiment that will require a two-sample t-procedure to analyze the results and write hypotheses for your test, identifying the variable(s) used. (b) Design an experiment that will require a matched-pairs t-procedure to analyze the results and write hypotheses for your test, identifying the variable(s) used. (c) Which experiment would you consider the stronger design? Why?
General Review Page 18 of 26
Copyright © 2009 Laying the Foundation®, Inc., Dallas, TX. All rights reserved. Visit: www.layingthefoundation.org
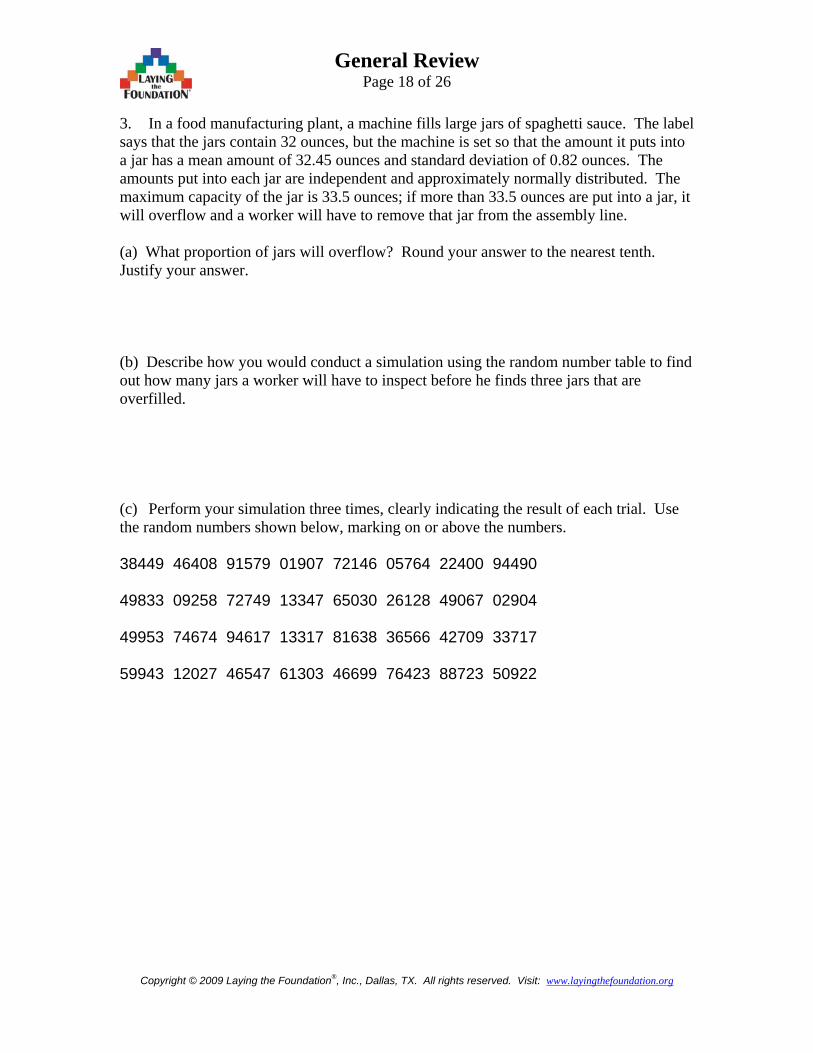
3. In a food manufacturing plant, a machine fills large jars of spaghetti sauce. The label says that the jars contain 32 ounces, but the machine is set so that the amount it puts into a jar has a mean amount of 32.45 ounces and standard deviation of 0.82 ounces. The amounts put into each jar are independent and approximately normally distributed. The maximum capacity of the jar is 33.5 ounces; if more than 33.5 ounces are put into a jar, it will overflow and a worker will have to remove that jar from the assembly line. (a) What proportion of jars will overflow? Round your answer to the nearest tenth. Justify your answer. (b) Describe how you would conduct a simulation using the random number table to find out how many jars a worker will have to inspect before he finds three jars that are overfilled. (c) Perform your simulation three times, clearly indicating the result of each trial. Use the random numbers shown below, marking on or above the numbers. 38449 46408 91579 01907 72146 05764 22400 94490
49833 09258 72749 13347 65030 26128 49067 02904
49953 74674 94617 13317 81638 36566 42709 33717
59943 12027 46547 61303 46699 76423 88723 50922
General Review Page 19 of 26
Copyright © 2009 Laying the Foundation®, Inc., Dallas, TX. All rights reserved. Visit: www.layingthefoundation.org
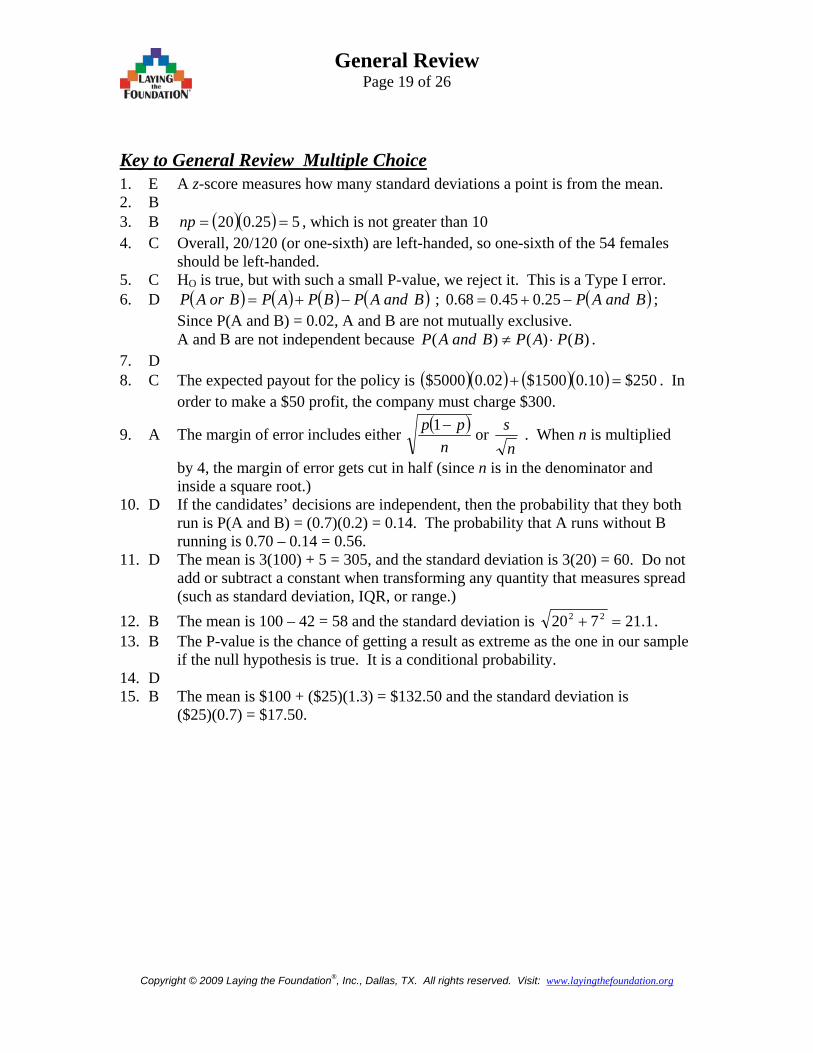
Key to General Review Multiple Choice 1. E A z-score measures how many standard deviations a point is from the mean. 2. B 3. B ( )( ) 525.020 ==np , which is not greater than 10 4. C Overall, 20/120 (or one-sixth) are left-handed, so one-sixth of the 54 females should be left-handed. 5. C HO is true, but with such a small P-value, we reject it. This is a Type I error. 6. D ( ) ( ) ( ) ( )BandAPBPAPBorAP −+= ; ( )BandAP−+= 25.045.068.0 ; Since P(A and B) = 0.02, A and B are not mutually exclusive. A and B are not independent because )()()( BPAPBandAP ⋅≠ . 7. D 8. C The expected payout for the policy is ( )( ) ( )( ) 250$10.01500$02.05000$ =+ . In order to make a $50 profit, the company must charge $300.
9. A The margin of error includes either ( )n
pp −1 or ns . When n is multiplied
by 4, the margin of error gets cut in half (since n is in the denominator and inside a square root.) 10. D If the candidates’ decisions are independent, then the probability that they both run is P(A and B) = (0.7)(0.2) = 0.14. The probability that A runs without B running is 0.70 – 0.14 = 0.56. 11. D The mean is 3(100) + 5 = 305, and the standard deviation is 3(20) = 60. Do not add or subtract a constant when transforming any quantity that measures spread (such as standard deviation, IQR, or range.) 12. B The mean is 100 – 42 = 58 and the standard deviation is 1.21720 22 =+ . 13. B The P-value is the chance of getting a result as extreme as the one in our sample if the null hypothesis is true. It is a conditional probability. 14. D 15. B The mean is $100 + ($25)(1.3) = $132.50 and the standard deviation is ($25)(0.7) = $17.50.
General Review Page 20 of 26
Copyright © 2009 Laying the Foundation®, Inc., Dallas, TX. All rights reserved. Visit: www.layingthefoundation.org
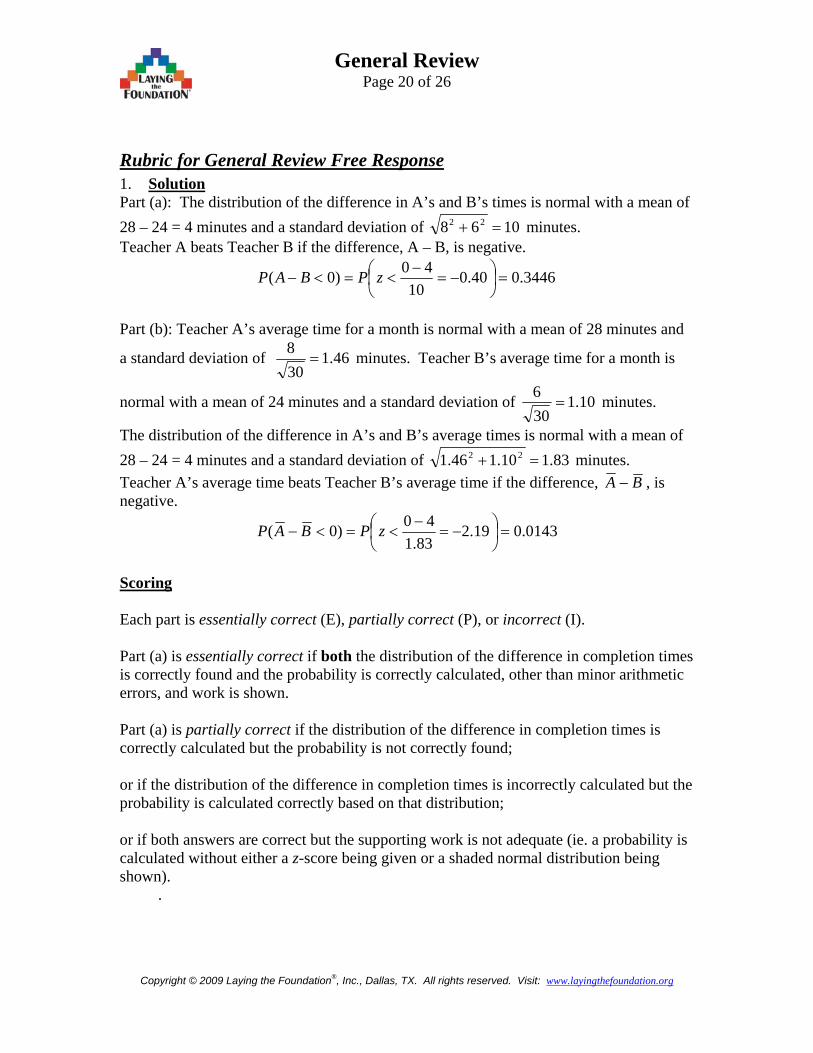
Rubric for General Review Free Response 1. Solution Part (a): The distribution of the difference in A’s and B’s times is normal with a mean of 28 – 24 = 4 minutes and a standard deviation of 1068 22 =+ minutes. Teacher A beats Teacher B if the difference, A – B, is negative.
3446.040.010
40)0( =⎟⎠⎞
⎜⎝⎛ −=
−<=<− zPBAP
Part (b): Teacher A’s average time for a month is normal with a mean of 28 minutes and
a standard deviation of 46.1308
= minutes. Teacher B’s average time for a month is
normal with a mean of 24 minutes and a standard deviation of 10.1306
= minutes.
The distribution of the difference in A’s and B’s average times is normal with a mean of 28 – 24 = 4 minutes and a standard deviation of 83.110.146.1 22 =+ minutes. Teacher A’s average time beats Teacher B’s average time if the difference, BA − , is negative.
0143.019.283.1
40)0( =⎟⎠⎞
⎜⎝⎛ −=
−<=<− zPBAP
Scoring Each part is essentially correct (E), partially correct (P), or incorrect (I). Part (a) is essentially correct if both the distribution of the difference in completion times is correctly found and the probability is correctly calculated, other than minor arithmetic errors, and work is shown. Part (a) is partially correct if the distribution of the difference in completion times is correctly calculated but the probability is not correctly found; or if the distribution of the difference in completion times is incorrectly calculated but the probability is calculated correctly based on that distribution; or if both answers are correct but the supporting work is not adequate (ie. a probability is calculated without either a z-score being given or a shaded normal distribution being shown). .

General Review Page 21 of 26
Copyright © 2009 Laying the Foundation®, Inc., Dallas, TX. All rights reserved. Visit: www.layingthefoundation.org
Part (b) is essentially correct if all three of these quantities are correctly found, other than minor arithmetic errors, with work shown: 1. the distribution of each teacher’s average time, 2. the distribution of the difference in average completion times 3. the probability that A’s average time is quicker than B’s average time . Part (b) is partially correct if both the distribution of each teacher’s average time and the distribution of the difference in average completion times are correctly found, but the probability is incorrect; or if the distribution of each teacher’s average time is incorrectly found, but the distribution of the difference in average completion times and the probability are correctly found based on those distributions; or if the distribution of each teacher’s average time is correctly found, the distribution of the difference in average completion times is incorrect, but the probability are correctly found based on that distribution; or if all answers are correct but the supporting work is inadequate. 4 Complete Response (2E) Both parts essentially correct 3 Substantial Response (1E 1P) One part essentially correct and one part partially correct 2 Developing Response (1E 0P or 2P) One part essentially correct and one part incorrect OR Two parts partially correct 1 Minimal Response (1P) One part partially correct
General Review Page 22 of 26
Copyright © 2009 Laying the Foundation®, Inc., Dallas, TX. All rights reserved. Visit: www.layingthefoundation.org
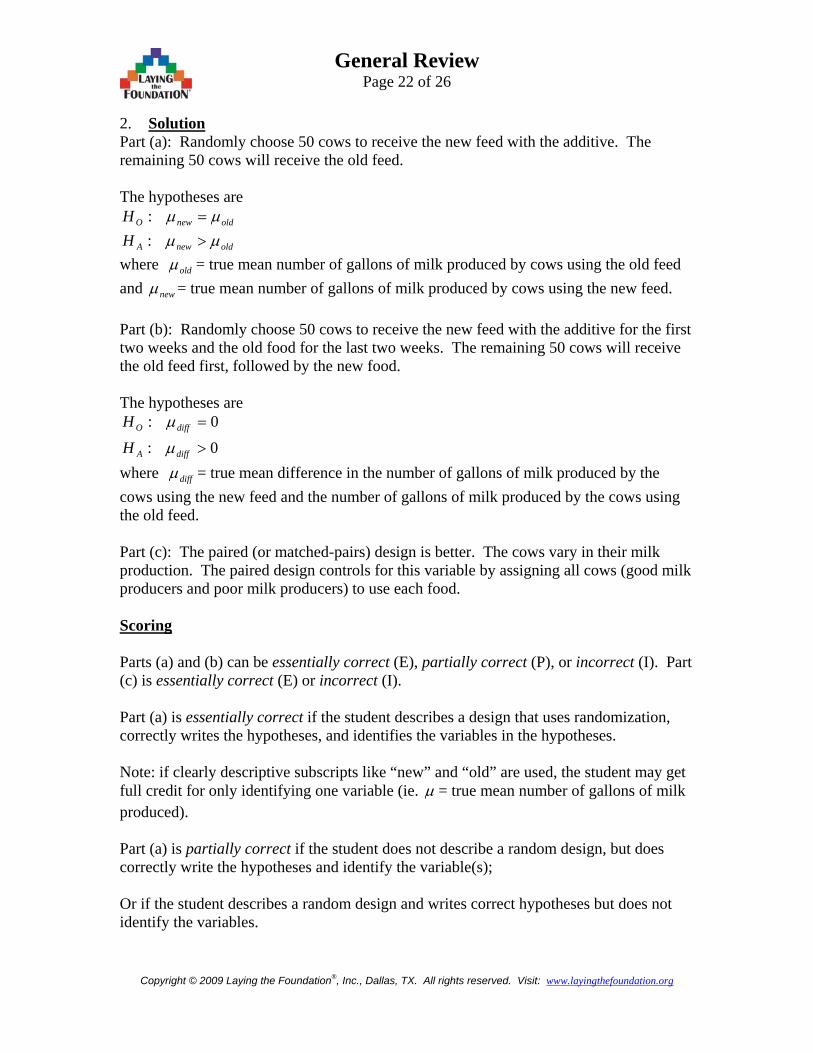
2. Solution Part (a): Randomly choose 50 cows to receive the new feed with the additive. The remaining 50 cows will receive the old feed. The hypotheses are
oldnewA
oldnewO
HH
μμμμ
>=
::
where oldμ = true mean number of gallons of milk produced by cows using the old feed and newμ = true mean number of gallons of milk produced by cows using the new feed. Part (b): Randomly choose 50 cows to receive the new feed with the additive for the first two weeks and the old food for the last two weeks. The remaining 50 cows will receive the old feed first, followed by the new food. The hypotheses are
0:
0:
>
=
diffA
diffO
H
H
μ
μ
where diffμ = true mean difference in the number of gallons of milk produced by the cows using the new feed and the number of gallons of milk produced by the cows using the old feed. Part (c): The paired (or matched-pairs) design is better. The cows vary in their milk production. The paired design controls for this variable by assigning all cows (good milk producers and poor milk producers) to use each food. Scoring Parts (a) and (b) can be essentially correct (E), partially correct (P), or incorrect (I). Part (c) is essentially correct (E) or incorrect (I). Part (a) is essentially correct if the student describes a design that uses randomization, correctly writes the hypotheses, and identifies the variables in the hypotheses. Note: if clearly descriptive subscripts like “new” and “old” are used, the student may get full credit for only identifying one variable (ie. μ = true mean number of gallons of milk produced). Part (a) is partially correct if the student does not describe a random design, but does correctly write the hypotheses and identify the variable(s); Or if the student describes a random design and writes correct hypotheses but does not identify the variables.
General Review Page 23 of 26
Copyright © 2009 Laying the Foundation®, Inc., Dallas, TX. All rights reserved. Visit: www.layingthefoundation.org
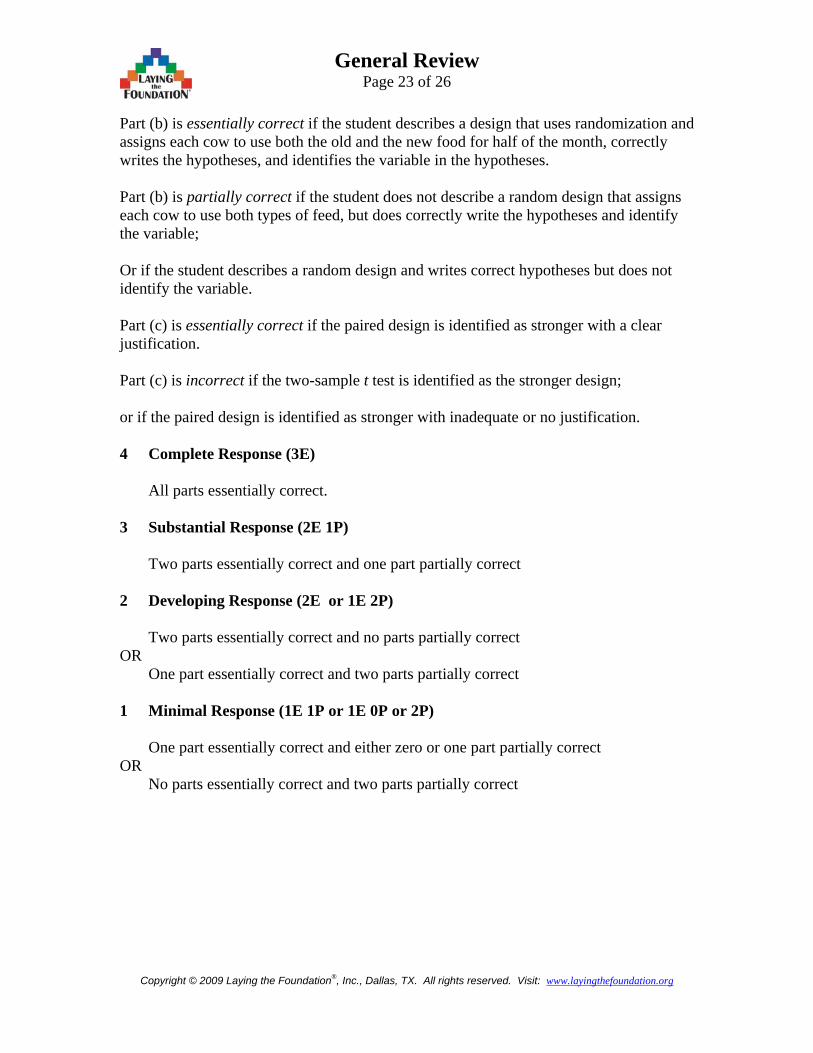
Part (b) is essentially correct if the student describes a design that uses randomization and assigns each cow to use both the old and the new food for half of the month, correctly writes the hypotheses, and identifies the variable in the hypotheses. Part (b) is partially correct if the student does not describe a random design that assigns each cow to use both types of feed, but does correctly write the hypotheses and identify the variable; Or if the student describes a random design and writes correct hypotheses but does not identify the variable. Part (c) is essentially correct if the paired design is identified as stronger with a clear justification. Part (c) is incorrect if the two-sample t test is identified as the stronger design; or if the paired design is identified as stronger with inadequate or no justification. 4 Complete Response (3E) All parts essentially correct. 3 Substantial Response (2E 1P) Two parts essentially correct and one part partially correct 2 Developing Response (2E or 1E 2P) Two parts essentially correct and no parts partially correct OR One part essentially correct and two parts partially correct 1 Minimal Response (1E 1P or 1E 0P or 2P) One part essentially correct and either zero or one part partially correct OR No parts essentially correct and two parts partially correct
General Review Page 24 of 26
Copyright © 2009 Laying the Foundation®, Inc., Dallas, TX. All rights reserved. Visit: www.layingthefoundation.org
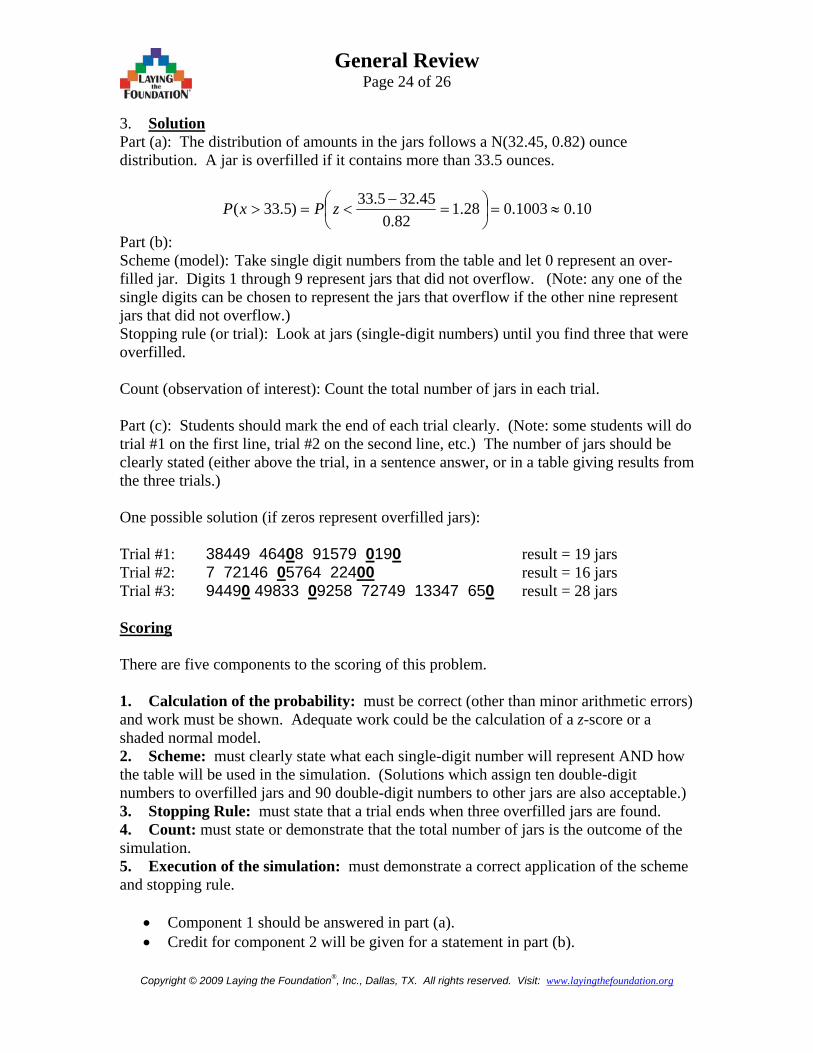
3. Solution Part (a): The distribution of amounts in the jars follows a N(32.45, 0.82) ounce distribution. A jar is overfilled if it contains more than 33.5 ounces.
10.01003.028.182.0
45.325.33)5.33( ≈=⎟⎠⎞
⎜⎝⎛ =
−<=> zPxP
Part (b): Scheme (model): Take single digit numbers from the table and let 0 represent an over-filled jar. Digits 1 through 9 represent jars that did not overflow. (Note: any one of the single digits can be chosen to represent the jars that overflow if the other nine represent jars that did not overflow.) Stopping rule (or trial): Look at jars (single-digit numbers) until you find three that were overfilled. Count (observation of interest): Count the total number of jars in each trial. Part (c): Students should mark the end of each trial clearly. (Note: some students will do trial #1 on the first line, trial #2 on the second line, etc.) The number of jars should be clearly stated (either above the trial, in a sentence answer, or in a table giving results from the three trials.) One possible solution (if zeros represent overfilled jars): Trial #1: 38449 46408 91579 0190 result = 19 jars Trial #2: 7 72146 05764 22400 result = 16 jars Trial #3: 94490 49833 09258 72749 13347 650 result = 28 jars Scoring There are five components to the scoring of this problem. 1. Calculation of the probability: must be correct (other than minor arithmetic errors) and work must be shown. Adequate work could be the calculation of a z-score or a shaded normal model. 2. Scheme: must clearly state what each single-digit number will represent AND how the table will be used in the simulation. (Solutions which assign ten double-digit numbers to overfilled jars and 90 double-digit numbers to other jars are also acceptable.) 3. Stopping Rule: must state that a trial ends when three overfilled jars are found. 4. Count: must state or demonstrate that the total number of jars is the outcome of the simulation. 5. Execution of the simulation: must demonstrate a correct application of the scheme and stopping rule.
• Component 1 should be answered in part (a). • Credit for component 2 will be given for a statement in part (b).
General Review Page 25 of 26
Copyright © 2009 Laying the Foundation®, Inc., Dallas, TX. All rights reserved. Visit: www.layingthefoundation.org
• Credit for components 3 and/or 4 will be given for statements or demonstrations
in parts (b) or (c). • Credit for component 5 will be given for work shown in part (c).
4 Complete Response Essentially correct on all five components. 3 Substantial Response Essentially correct on four of the five components. 2 Developing Response Essentially correct on three of the five components. 1 Minimal Response Essentially correct on component 5 only. OR Essentially correct on two of the other five components.
General Review Page 26 of 26
Copyright © 2009 Laying the Foundation®, Inc., Dallas, TX. All rights reserved. Visit: www.layingthefoundation.org
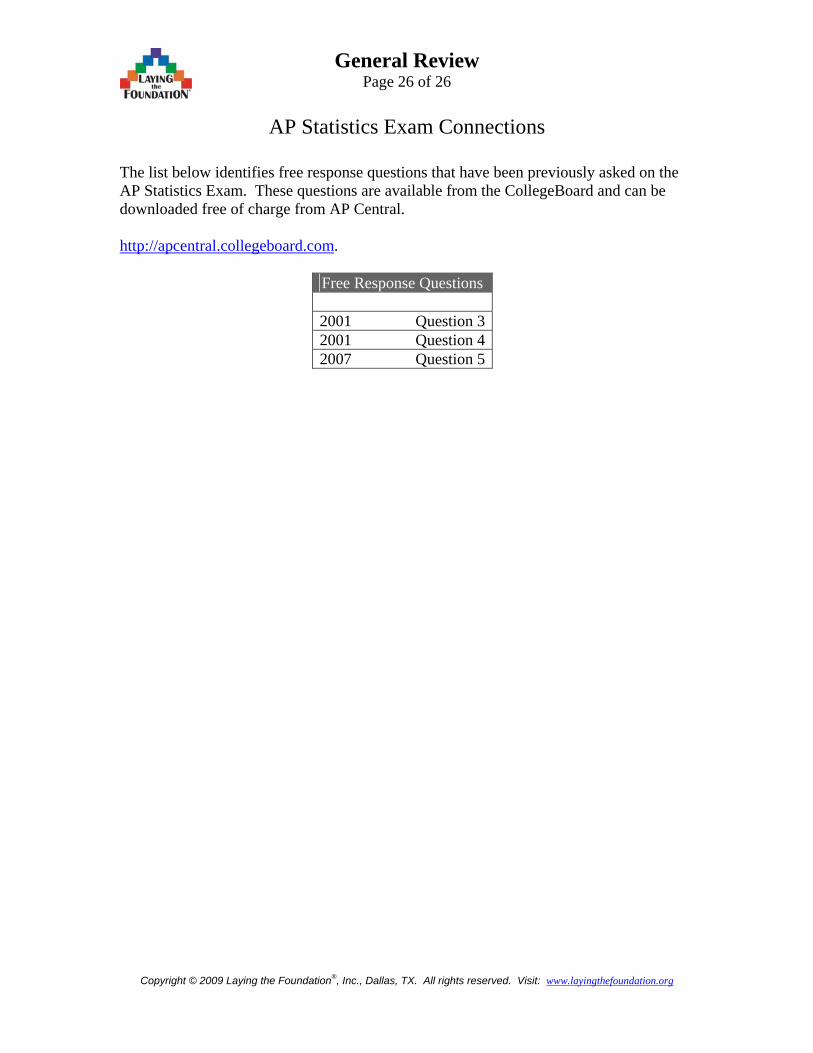
AP Statistics Exam Connections
The list below identifies free response questions that have been previously asked on the AP Statistics Exam. These questions are available from the CollegeBoard and can be downloaded free of charge from AP Central. http://apcentral.collegeboard.com.
Free Response Questions 2001 Question 32001 Question 42007 Question 5