general statistics 2008 - education.gov.bt · 5 1. the education system 1.1 introduction the 10th...
TRANSCRIPT


1
GENERAL STATISTICS, 2008 Published by: Policy and Planning Division Ministry of Education Royal Government of Bhutan Telephone: +975-2-327387, 323551 Fax: +975-2-325183 Email: [email protected] www.education.gov.bt Copyright © 2008 Policy and Planning Division, Ministry of Education All rights reserved. No part of this publication may be reproduced in any form without prior permission from the Policy and Planning Division, Ministry of Education. First Edition: 1999 Tenth Edition: 2008

2
Table of Contents
Summary of Education Statistics, 2008 ............................................................................. 4
1. The Education System................................................................................................. 5
1.1 Introduction ................................................................................................................. 5 1.2 Education Structure..................................................................................................... 5
1.2.1. General education structure ................................................................................. 5 1.2.2. Schools in General Education.............................................................................. 6
1.3 General Education Curriculum................................................................................... 6 1.4 Education Administration............................................................................................ 7
2. Status of Education in 2008 ........................................................................................ 8
2.1 Enrolment, Schools and Teachers at the National Level ............................................ 8 2.1.1. Enrolment ............................................................................................................ 8 2.1.2 Schools and Institutes ........................................................................................... 9 Community Primary Schools......................................................................................... 9 Schools and Enrolment by Location.............................................................................. 9 Non Formal Education................................................................................................. 10 2.1.3. Teachers............................................................................................................. 10
2.2 Education facilities, enrolment and teachers in the dzongkhags .............................. 11 2.2.1. Provision of schools per dzongkhag.................................................................. 11 2.2.2. Enrolment in the Dzongkhags ........................................................................... 11 2.2.3. Teachers in the Dzongkhags.............................................................................. 12
2.3 Girls Enrolment ......................................................................................................... 13 Girls’ enrolment in HSS and tertiary education .......................................................... 14
2.4 School feeding, WFP ................................................................................................. 15
3. Enrolment in the General Education Program ...................................................... 17
3.1 Primary Education (Classes PP-VI) ......................................................................... 17 3.2 Secondary Education................................................................................................. 21
Lower and Middle Secondary Education (VII-X)....................................................... 21 Higher Secondary Education (XI-XII) ........................................................................ 21
4. Examination Results and Efficiency Indicators...................................................... 23
4.1 Examination results ................................................................................................... 23 Class X Examinations.................................................................................................. 23 Class XII Examination................................................................................................. 23 Class VI and Class VIII Examinations ........................................................................ 23
4.2 Efficiency indicators.................................................................................................. 24 4.2.1. Promotees, Repeaters and Drop-outs................................................................. 24 4.2.2 Completion rate and internal efficiency measures. ............................................ 26
5. Teachers...................................................................................................................... 28
5.1 Teacher strength........................................................................................................ 28 Proportion of Non-Bhutanese Teachers ...................................................................... 28
5.2 Teacher education ..................................................................................................... 29 Pre-service training...................................................................................................... 29 In-Service training ....................................................................................................... 30
5.3 Academic profile of teachers ..................................................................................... 31
6. Quality indicators ...................................................................................................... 32
3
6.1 Teacher-pupil ratio.................................................................................................... 32 6.2 Class size ................................................................................................................... 34 6.3 Combining teacher:pupil ratio and class size ........................................................... 36
7. EDUCATION FACILITIES..................................................................................... 39
7.1 The Water Situation in Schools ................................................................................. 39 7.2 Provision of classrooms, laboratories and computers in schools............................. 40
Laboratories in schools................................................................................................ 41 Computers in schools................................................................................................... 42
7.3 Electricity, telephone and internet connectivity ........................................................ 42 7.4 Road accessibility...................................................................................................... 44
8. Non Formal, Continuing and Special Education.................................................... 46
8.1 Non Formal Education .............................................................................................. 46 8.2 Continuing Education................................................................................................ 46 8.3 Special Education...................................................................................................... 47 8.4 Sanskrit Pathshalas ................................................................................................... 47
9. Tertiary, Vocational, International and Monastic Education............................... 48
9.1 Tertiary education ..................................................................................................... 48 9.2 Vocational education................................................................................................. 48 9.3 Students Abroad......................................................................................................... 48
Primary and secondary education................................................................................ 48 Tertiary education........................................................................................................ 48
9.4 Monastic Education................................................................................................... 49
10. Financing of Education ................................................................................... 51
10.1. Free services and sharing of costs .................................................................... 51 10.2. Annual budget.................................................................................................... 51 10.3. Per head costs.................................................................................................... 55
Annexures........................................................................................................................... 56
Annex 1. New and Upgraded schools in Bhutan in 2007 ................................................ 56 Annex 2. Comparative enrolment .................................................................................... 57 Annex 3. Organization of the MoE Headquarters........................................................... 58 Annex 5: Enrolment details by Dzongkhag, Category and Level.................................... 57

4
Summary of Education Statistics, 2008
A Early Childhood Development1 Day Care Centres
B School Education1 Community Primary Schools2 Primary Schools3 Lower Secondary Schools4 Middle Secondary Schools5 Higher Secondary Schools
Sub-Total (B)C Special Institutes*D Tertiary Institutes under RUBE Vocational Institutes
Total (Schools and Institutes)�(A+B+C+D+E)F Monastic Education �(Lobdra, Shredra,etc)G Non-Formal Centres
A Early Childhood Development Male Female Male Female Male Female Total1 Day Care Centres - - 143 151 143 151 294
B [i] School Education1 Community Primary Schools 15,174 14,528 - - 15,174 14,528 29,702 2 Primary Schools 11,516 11,297 917 843 12,433 12,140 24,573 4 Lower Secondary Schools 24,113 24,593 486 428 24,599 25,021 49,620 5 Middle Secondary Schools 16,481 15,811 - - 16,481 15,811 32,292 6 Higher Secondary Schools 8,491 7,664 2,349 2,421 10,840 10,085 20,925
Sub-Total 75,775 73,893 3,752 3,692 79,527 77,585 157,112
B [ii] Bhutanese students in India & abroad** - - 191 68 191 68 259 Sub-Total (B [i]+[i]) 75,775 73,893 3,819 3,653 79,594 77,546 157,371
C Special Institutes* 48 20 48 20 68 D Tertiary Education
1 Tertiary Institutes under RUB 2,806 1,384 - - 2,806 1,384 4,190 2 Tertiary Students in India*** 275 61 1,148 1,582 1,423 1,643 3,066 3 Tertiary Students abroad*** 82 18 18 18 100 36 136
Sub-Total (D) 3,163 1,463 1,166 1,600 4,329 3,063 7,392 E Vocational institutes 848 436 848 436 1,284
Total (Schools and Institutes)�(A+B+C+D+E) 79,861 75,825 5,142 5,422 85,003 81,247 166,409 F Monastic Education �(Lobdra, Shredra,etc)**** 6,930 75 5,149 - 12,079 75 12,154 G Non-Formal Centres 4,183 9,647 4,182 9,647 13,829
GRAND TOTAL 90,974 85,547 10,291 5,422 101,265 90,969 192,392
A Early Childhood Development Male Female Male Female Male Female Total1 Day Care Centres - - - 26 - 26 26
B School Education1 Community Primary Schools 775 225 - - 775 225 1,000 2 Primary Schools 425 374 39 84 464 458 922 4 Lower Secondary Schools 836 791 27 37 863 828 1,691 5 Middle Secondary Schools 697 480 - - 697 480 1,177 6 Higher Secondary Schools 523 231 154 47 677 278 955
Sub-Total (B) 3,256 2,101 220 168 3,476 2,269 5,745 C Special Institutes* 11 3 - - 11 3 14 D Tertiary Institutes under RUB 538 157 - - 538 157 695 E Vocational institutes 93 12 - - 93 12 105
Total (Schools and Institutes)�(A+B+C+D+E) 3,898 2,273 220 194 4,118 2,467 6,585 G Non-Formal Centres 322 414 322 414 736
GRAND TOTAL 4,220 2,687 220 194 4,440 2,881 7,321
** Bhutanese students in PP-XII studying in Darjeeling and Kalimpong*** Students who are on RGOB Scholarship abraod have been listed under public students and other students studying abraod under private**** The monastic enrolment reflected under public is from 2007, the enrolment reflected under private is from 2004
SUMMARY OF TEACHERS, LECTURERS, INSTRUCTORS, TRAINERS & CAREGIVERSGovernment Private Total
552 391 - 391 518 34
499 24 523
7 - 7
2 - 2 10
44 - 44 24 8 32
81 13 94 89 3 92
261 - 261
- 10 10
Public Private Total
- 10
747 -
* National institute for the Disabled and the Sanskrit Patshala are included under Special Institutes
747 1,656 34 1,690
SUMMARY OF STUDENTS, LEARNERS, TRAINEES & NOVITIATESGovernment Private Total
GRAND TOTAL

5
1. The Education System 1.1 Introduction The 10th statistical yearbook provides a quantitative overview of the current state of the education system, summarizing information on general school-based, monastic, non-formal, continuing, vocational, and tertiary education within Bhutan and to some extent information on Bhutanese students studying outside Bhutan. In addition to information on the academic year 2008, some historical comparisons are included. Chapter one provides a general background on the education system in Bhutan, while Chapter 2 contains an overview of the status of education in 2008. Chapters 3 to 8 present more detailed information on the elements of the education system that are under the jurisdiction of the Ministry of Education. The chapters focus, respectively, on enrolment, exam results, teachers, quality indicators, facilities in the schools and non-formal, continuing and special education. Chapter 9 presents some basic information on education outside the jurisdiction of the Ministry of Education, viz. monastic, vocational, tertiary, and students studying outside the country. Chapter 10 provides some financial information pertaining to the Education Sector. The appendices contain detailed information on enrolment, teachers and the school feeding programme.
1.2 Education Structure The education system in Bhutan has 3 main elements: general education, monastic education and non-formal (and continuing) education. The first type of education is by far the biggest and is commonly seen as the only educational structure. Monastic education is the oldest form of education in Bhutan, and until the introduction of formal school-based education in the late 1950’s, it was the only education available in the country. Students enroll in monastic education at different stages in their life. For those who could not attend or complete general or monastic education, basic literacy courses are offered all over the country in non-formal education centers. Since 2006, the Ministry of Education in collaboration with private higher secondary schools, has initiated a continuing education programme, to allow school drop outs the opportunity to upgrade their qualifications.
1.2.1. General education structure The school-based education structure in Bhutan starts with 11 years of free Basic Education from classes PP to X. The 11 years of basic education are divided into 7 years of Primary Education, which starts at the age of 6, and 4 years of Secondary Education. At the end of the cycle, or class X, there is a national Board examination. Beyond class X, students can continue their general education in classes XI and XII in Higher Secondary Schools join the vocational training institutes or enter the labor market. Access to class XI in government schools and to vocational training in government institutes is based on the students' performance in the Board Examinations at the end of Class X. Students who are not selected for government funded education, but who want to continue their education can attend private higher secondary schools in Bhutan or abroad, or vocational courses organized by private training institutes. The duration of vocational training in both government and private institutes vary depending upon the type of course. After graduating from class XII (public and private), students can enter the job market or enroll in the tertiary level. Some graduates from the Vocational Training Institutes are selected to continue education at the tertiary level. Students either join one of the institutes of the Royal University of Bhutan (RUB) for a diploma or a bachelor’s degree or join an institute abroad. Selection for the RUB is based upon the class XII examination results. A limited number of

6
students are eligible for government scholarships for professional studies abroad, while others who can afford it fund themselves to tertiary education institutes abroad. Figure 1.1 gives a schematic overview of the general education structure in Bhutan. Figure 1.1 General education structure
1.2.2. Schools in General Education At the primary education level a school is either called a primary school or a community primary school. Both schools offer, in principle, seven years of education, from PP to VI. At the secondary level the classification of a school depends on the final class that is taught. Schools that have Class VIII as their final class are called Lower Secondary while schools that have Class X or XII as their terminal classes are called Middle Secondary and Higher Secondary Schools, respectively.
1.3 General Education Curriculum The objective of primary education in Bhutan is to impart basic literacy and numeracy skills, to provide knowledge of the country’s history, geography, culture and traditions and to teach the fundamentals of agriculture, health & hygiene, and population education. Moral and value education are given special attention. Activity-based learning is used uniformly across the country to teach these skills and knowledge. Class IX students can choose between Economics, Commercial Studies and Computer Applications while in higher secondary education students have to choose between science, arts and commerce streams. The Bhutan Board of Examinations (BBE) conducts the national examinations for Bhutanese schools at classes X and XII. The examinations for classes VI and VIII have been decentralized to the schools, although the questions, model answers and marking schemes are provided by the BBE. Curriculum reforms of English, Dzongkha and Mathematics were initiated in the 9th FYP and will continue in the 10th plan, especially for Dzongkha and Mathematics. Figure 1.2 provides an overview of the curriculum up to Class XII.
Higher Secondary Age 17 to 18 (HS)
Vocational Education Age 17 plus (VTI)
Tertiary Education
Age 19 to 22
PP - VI VII - X XI - XII
Voc. TI
Labor Force
BA or Dipl. course

7
Figure 1.2 General Education curriculum PP-XII Primary Education LSS MSS HSS
PP I II III IV V VI VII VIII IX X XI XII
RigzhungEnglish
Business Mathematics
Commercial StudiesCommerceAccounting
1 Learning areas with specific subjects and periods set in the timetable.
2
Area SubjectsLanguage Dzongkha
English literatureMathematics Mathematics
Science and Technology SciencePhysicsChemistryBiologyComputer ApplicationsComputer Science
Human Society and Environment
Environmental StudiesSocial StudiesHistoryGeography
EconomicsCreative and Practical Arts Visual arts and craft
Songs, dances, MusicHealth, Physical Education and Personal Development
Health & Population EducationGames and SportsMoral and value educationScouts
Socially Useful and Productive Work
Agriculture and Social ForestrySUPWBasic Vocational Skills
Learning areas addressed in co-curricular programmes, school organizations or integrated in the subject areas
1.4 Education Administration The responsibility for the administration of education in Bhutan is shared amongst the Ministry of Education (MoE), the Ministry of Labor and Human Resources (MoLHR), the Royal University of Bhutan (RUB), the Dzongkhags and the Gewogs. Monastic education is the responsibility of the central monastic body and privately managed independent monasteries.
The MoE is responsible for policy planning, curriculum development and administration of Basic (Primary up to Middle secondary), Higher Secondary, Non Formal and continuing education. It is also responsible for ex-country tertiary level scholarships, and the design and implementation of Higher Education Policy. This includes liaising with institutions at that level, such as the RUB. The organizational structure of the MoE is presented in the appendices.
Dzongkhag and Gewogs are entrusted with a range of responsibilities in the education sector, non formal education, school construction and maintenance, and implementation of national policies. These responsibilities are carried out by Dzongkhag Education Officers (DEOs), and Assistant DEOs, all of whom report both to the Dzongda and the Ministry of Education.
The MoLHR is responsible for vocational training after class X and the Royal University of Bhutan (RUB) is responsible for planning, curriculum development and administration of the ten tertiary institutions responsible for the provision of public education after class XII.

8
2. Status of Education in 2008 2.1 Enrolment, Schools and Teachers at the National Level
2.1.1. Enrolment The total enrolment figures for Bhutan in March 2008 are presented in table 2.1. This includes enrolment in all Bhutanese educational institutes as well as Bhutanese students studying outside Bhutan. Although, the data on monastic enrolment and students studying outside the country is not comprehensive, this gives a good indicative overview. In total there are about 192,000 students and learners. Table 2.1 Estimated enrolment per school level & type, March 2008
Public Private TotalDay care centre Students - 294 294 Primary Students(PP-VI) 103,435 2,665 106,100 Lower & Middle Secondary Students (VII-X) 40,726 129 40,855 Higher Secondary Students (XI-XII) 5,507 4,650 10,157 School Students Abroad - 259 259 Special Institute Students 68 - 68 Tertiary Students 4,190 - 4,190 Tertiary Students Abroad 436 2,766 3,202 Vocational Students 1,284 - 1,284 NFE learners 13,830 - 13,830 Monastic Students 7,005 5,149 12,154 Total 176,481 15,912 192,393 Information on Vocational institutes and the Royal University is from the 2007 academic year since the new academic year for these institutes starts only in the second half of the year. The figures for tertiary students abroad are based upon scholarship information and upon the membership of the Bhutanese Students Association in the different university towns. Therefore the information on private students is not very accurate. The information on the School students abroad is based upon information given by the Dzongkha Lopens in Darjeeling and Kalimpong. The information on the NFE learners has been collected by the NFE division of the MoE. The special institutes are the Sanskrit Patshala and the National Institute for the Disabled. Students enrolled in the Deaf Unit in Drukgyel LSS are reflected under the general students since these students participate in regular education. Information about the Monastic education has been collected by the Central Monastic Body. The enrolment reflected under public is data collected in 2007. The enrolment reflected under private monasteries is from 2004. Table 2.2 below presents the main education indicators Gross Primary Enrolment Ratio (GPER) and Net Primary Enrolment Ratio (NPER)1 calculated2 based on the population projections for Bhutan for 2005-2030 published by the National Statistical Bureau in June 2008. The table shows that the Net Enrolment and Gross Enrolment Ratios at all levels have increased significantly since 20063. 1 NER = No of correct age students/no of population of correct age GER = No of students/no of population of correct age 2 When the 2007 statistics were published the projections from NSB were not available Therefore the population figures for 2006 and 2007 are extrapolations from the Census results received from the National Statistical Bureau(NSB). As recommended by the NSB the assumption was made that the mortality rate, the immigration rate and the emigration rate has been 0% in 2006 and 2007 for those who were between 4 to 11 years old during the time of the census. If we would use the same method for 2008 the 6-12 year old population would be slightly higher. This makes sense since in the population projection from the NSB mortality rate has been included, which was kept 0 in calculating 2006 and 2007 NER. Also the NSB has corrected some mistakes in the Population and Housing Census data. The denominator used in our NER and GER calculation has been approved by the NSB. 3 The enrolment has gone up again in 2008 compared to 2007. Also the denominator used this year is significantly lower than the one used last year. If the NSB-projection is compared with extrapolating the PHCB05 as was done in previous years, the NSB-projection projects a smaller population of 6-12 respectively 6-16 years old.
9
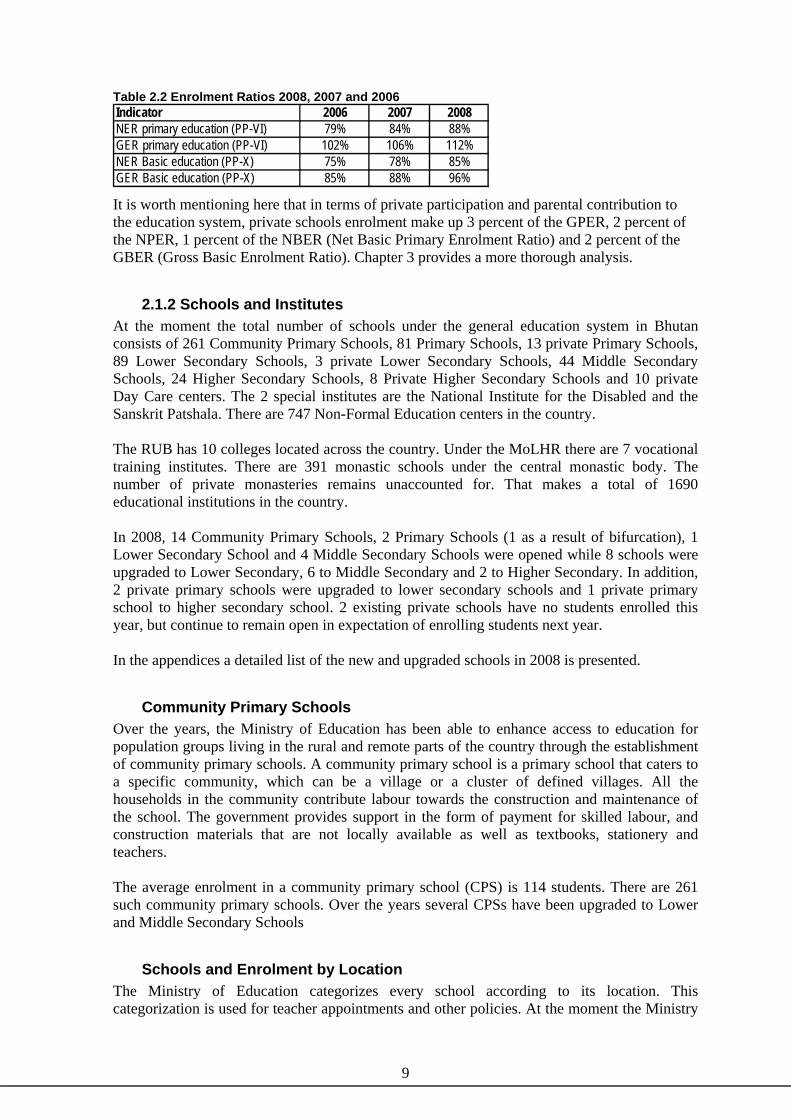
Table 2.2 Enrolment Ratios 2008, 2007 and 2006 Indicator 2006 2007 2008NER primary education (PP-VI) 79% 84% 88%GER primary education (PP-VI) 102% 106% 112%NER Basic education (PP-X) 75% 78% 85%GER Basic education (PP-X) 85% 88% 96% It is worth mentioning here that in terms of private participation and parental contribution to the education system, private schools enrolment make up 3 percent of the GPER, 2 percent of the NPER, 1 percent of the NBER (Net Basic Primary Enrolment Ratio) and 2 percent of the GBER (Gross Basic Enrolment Ratio). Chapter 3 provides a more thorough analysis.
2.1.2 Schools and Institutes At the moment the total number of schools under the general education system in Bhutan consists of 261 Community Primary Schools, 81 Primary Schools, 13 private Primary Schools, 89 Lower Secondary Schools, 3 private Lower Secondary Schools, 44 Middle Secondary Schools, 24 Higher Secondary Schools, 8 Private Higher Secondary Schools and 10 private Day Care centers. The 2 special institutes are the National Institute for the Disabled and the Sanskrit Patshala. There are 747 Non-Formal Education centers in the country. The RUB has 10 colleges located across the country. Under the MoLHR there are 7 vocational training institutes. There are 391 monastic schools under the central monastic body. The number of private monasteries remains unaccounted for. That makes a total of 1690 educational institutions in the country. In 2008, 14 Community Primary Schools, 2 Primary Schools (1 as a result of bifurcation), 1 Lower Secondary School and 4 Middle Secondary Schools were opened while 8 schools were upgraded to Lower Secondary, 6 to Middle Secondary and 2 to Higher Secondary. In addition, 2 private primary schools were upgraded to lower secondary schools and 1 private primary school to higher secondary school. 2 existing private schools have no students enrolled this year, but continue to remain open in expectation of enrolling students next year. In the appendices a detailed list of the new and upgraded schools in 2008 is presented.
Community Primary Schools Over the years, the Ministry of Education has been able to enhance access to education for population groups living in the rural and remote parts of the country through the establishment of community primary schools. A community primary school is a primary school that caters to a specific community, which can be a village or a cluster of defined villages. All the households in the community contribute labour towards the construction and maintenance of the school. The government provides support in the form of payment for skilled labour, and construction materials that are not locally available as well as textbooks, stationery and teachers. The average enrolment in a community primary school (CPS) is 114 students. There are 261 such community primary schools. Over the years several CPSs have been upgraded to Lower and Middle Secondary Schools
Schools and Enrolment by Location The Ministry of Education categorizes every school according to its location. This categorization is used for teacher appointments and other policies. At the moment the Ministry

10
uses the following seven categories: Urban (grade 1 and grade 2), Semi-urban, Semi-remote, Remote, Very remote, Difficult4. Table 2.3 gives the details for this year. Table 2.3 School and enrolment by categorization, 2008
No. Enrol. No. Enrol. No. Enrol. No. Enrol. No. Enrol. No. Enrol. No. Enrol.4 1,195 25 4,311 74 9,518 96 8,354 59 6,214 3 222 261 29,814
0.8% 0.8% 4.8% 2.7% 14.1% 6.1% 18.4% 5.3% 11.3% 4.0% 0.6% 0.1% 49.9% 19.0%23 10,494 12 3,426 20 4,283 16 2,392 23 3,866 - - 94 24,461
4.4% 6.7% 2.3% 2.2% 3.8% 2.7% 3.1% 1.5% 4.4% 2.5% 18.0% 15.6%28 24,714 19 8,739 30 10,693 10 3,989 5 1,485 - - 92 49,620
5.4% 15.7% 3.6% 5.6% 5.7% 6.8% 1.9% 2.5% 1.0% 0.9% 17.6% 31.6%20 16,607 16 11,271 5 3,084 3 1,330 - - - - 44 32,292
3.8% 10.6% 3.1% 7.2% 1.0% 2.0% 0.6% 0.8% 8.4% 20.6%27 18,220 5 2,705 - - - - - - - - 32 20,925
5.2% 11.6% 1.0% 1.7% 6.1% 13.3%102 71,230 77 30,452 129 27,578 125 16,065 87 11,565 3 222 523 157,112
19.5% 45.3% 14.7% 19.4% 24.7% 17.6% 23.9% 10.2% 16.6% 7.4% 0.6% 0.1% 100.0% 100.0%
Total
Total
CPS
LSS
MSS
HSS
PS
Urban Semi-Urban Semi-Remote Remote Very Remote Difficult
Around 65 percent of the total enrolment is concentrated in the urban and semi-urban areas, while only 35 percent of schools are in these areas. This can be attributed to the scattered nature of our population settlements in the rural and remote areas and explains the relatively high cost of providing education services. It is also apparent from the table above that most of the CPSs are in the remote areas while most secondary schools are in urban and less remote areas. About 50% of the government schools are Community Primary Schools showing the success of the CPS policy.
Non Formal Education The number of NFE centres has increased tremendously from 6 in 1992 with 300 learners to 747 with 13,830 learners and 736 instructors in 2008. Learners attend a basic literacy course followed by a post literacy course.
2.1.3. Teachers As of March 2008, excluding monastic teachers, there were 7,321 teachers and instructors. This does not include the 222 teachers recruited under the Light Druk-Yul project and the100 temporary teachers recruited in April 2008, who were sent to the dzongkhags. Table 2.4 shows the distribution of teachers among the educational institutes. By far the most teachers are employed in Lower Secondary Schools. Table 2.4 Teachers per educational facility in Bhutan, March 2008
Male Female Both SexDay Care Centres - 26 26 Community Primary Schools 775 225 1,000 Primary Schools 425 374 799 Private Primary Schools 39 84 123 Lower Secondary Schools 836 791 1,627 Private Lower Secondary Schools 27 37 64 Middle Seondary Schools 697 480 1,177 Higher Secondary Schools 523 231 754 Private Higher Seondary Schools 154 47 201 Special Institutes 11 3 14 Royal University of Bhutan 538 157 695 Vocational Training Institutes 93 12 105 Non-Formal Education Centres 322 414 736 Total 4,440 2,881 7,321
Number of TeachersTypes of Schools & Institutes
4 The categorization of schools is planned to be changed. The new categorization was not yet finalized when this report was finished. The last time schools were officially categorized was in 2004.

11
Table 2.5 shows the steady increase in the teaching cadre over the last six years for both public and private schools. The growth in teacher numbers across all levels of schools this year shows the even spread of new establishments and upgrading across all levels. Table 2.5 Changes in teacher numbers per school 2002-2008
Teachers % gr Teachers % gr Teachers % gr Teachers % gr Teachers % gr Teachers % gr2008 1000 12% 922 2% 1691 4% 1177 8% 955 12% 5745 7%2007 892 5% 905 15% 1627 -1% 1093 46% 854 43% 5371 16%2006 852 8% 790 3% 1643 11% 748 4% 596 8% 4629 8%2005 786 11% 767 2% 1477 1% 721 -1% 551 25% 4302 5%2004 707 19% 752 7% 1461 5% 729 17% 440 -6% 4089 8%2003 592 12% 701 -7% 1388 20% 623 -7% 466 35% 3770 9%2002 529 755 1153 670 346 3453
HSS TotalCPS PS LSS MSS
2.2 Education facilities, enrolment and teachers in the dzongkhags 2.2.1. Provision of schools per dzongkhag
Every dzongkhag provides basic education for its children. At the secondary level, students who have no access to schools within their own locality are boarded in the nearest boarding school. Boarding is also offered in some selected primary schools. While urban dzongkhags/dungkhags like Thimphu, Samtse and Phuentsholing have no boarding schools at the higher secondary level, most dzongkhags have some boarding middle and higher secondary schools in order to cater to students who have no access to secondary schools within their own locality. Table 2.6 gives a full overview of the provision of general education facilities including private schools. Table 2.6 Public and private schools per dzongkhag 2008.
# % # % # % # % # % # % # % # % # %Bumthang 13 5.0% 0 0.0% 0 0.0% 2 2.2% 0 0.0% 2 4.5% 1 4.2% 1 12.5% 19 3.6%Chukha 17 6.5% 4 4.9% 0 0.0% 7 7.9% 1 33.3% 5 11.4% 2 8.3% 1 12.5% 37 7.1%Dagana 15 5.7% 2 2.5% 0 0.0% 3 3.4% 0 0.0% 2 4.5% 0 0.0% 0 0.0% 22 4.2%Gasa 2 0.8% 1 1.2% 0 0.0% 0 0.0% 0 0.0% 1 2.3% 1 4.2% 0 0.0% 5 1.0%Haa 3 1.1% 3 3.7% 0 0.0% 3 3.4% 0 0.0% 0 0.0% 0 0.0% 0 0.0% 9 1.7%Lhuentse 14 5.4% 8 9.9% 0 0.0% 2 2.2% 0 0.0% 1 2.3% 1 4.2% 0 0.0% 26 5.0%Mongar 31 11.9% 6 7.4% 0 0.0% 8 9.0% 0 0.0% 2 4.5% 2 8.3% 0 0.0% 49 9.4%Paro 3 1.1% 3 3.7% 4 30.8% 8 9.0% 0 0.0% 2 4.5% 2 8.3% 1 12.5% 23 4.4%Pemagatshel 18 6.9% 4 4.9% 0 0.0% 6 6.7% 0 0.0% 2 4.5% 1 4.2% 0 0.0% 31 5.9%Punakha 10 3.8% 3 3.7% 0 0.0% 4 4.5% 0 0.0% 3 6.8% 1 4.2% 1 12.5% 22 4.2%Samdrupjongkhar 10 3.8% 5 6.2% 1 7.7% 5 5.6% 0 0.0% 5 11.4% 0 0.0% 0 0.0% 26 5.0%Samtse 7 2.7% 3 3.7% 0 0.0% 1 1.1% 0 0.0% 5 11.4% 1 4.2% 0 0.0% 17 3.3%Sarpang 7 2.7% 0 0.0% 1 7.7% 4 4.5% 0 0.0% 2 4.5% 2 8.3% 1 12.5% 17 3.3%Thimphu 5 1.9% 6 7.4% 7 53.8% 9 10.1% 2 66.7% 4 9.1% 2 8.3% 3 37.5% 38 7.3%Trashigang 35 13.4% 11 13.6% 0 0.0% 10 11.2% 0 0.0% 2 4.5% 3 12.5% 0 0.0% 61 11.7%Trashiyangtse 21 8.0% 2 2.5% 0 0.0% 5 5.6% 0 0.0% 1 2.3% 1 4.2% 0 0.0% 30 5.7%Trongsa 15 5.7% 3 3.7% 0 0.0% 3 3.4% 0 0.0% 1 2.3% 1 4.2% 0 0.0% 23 4.4%Tsirang 5 1.9% 2 2.5% 0 0.0% 2 2.2% 0 0.0% 1 2.3% 1 4.2% 0 0.0% 11 2.1%Wangdue 15 5.7% 6 7.4% 0 0.0% 3 3.4% 0 0.0% 2 4.5% 1 4.2% 0 0.0% 27 5.2%Zhemgang 15 5.7% 9 11.1% 0 0.0% 4 4.5% 0 0.0% 1 2.3% 1 4.2% 0 0.0% 30 5.7%Total 261 100% 81 100% 13 100% 89 100% 3 100% 44 100% 24 100% 8 100% 523 100%
Dzongkhag TotalPvt. LSS MSS HSS Pvt. HSSCPS PS Pvt. PS LSS
2.2.2. Enrolment in the Dzongkhags The enrolment per level and by dzongkhag is shown in table 2.7. Table 2.8 gives an overview of the growth in enrolment of each dzongkhag by level.

12
Table 2.7 Enrolment per Dzongkhag per type of School, March 2008
# % # % # % # % # % # % # % # % # %Bumthang 1,462 5% 0 0% 0 0% 1064 2% 0 0% 1010 3% 492 3% 191 4% 4,219 3%Chukha 2,377 8% 946 4% 0 0% 5484 11% 246 27% 4898 15% 1665 10% 454 10% 16,070 10%Dagana 2,846 10% 450 2% 0 0% 1680 3% 0 0% 903 3% 0 0% 0 0% 5,879 4%Gasa 153 1% 111 0% 0 0% 0 0% 0 0% 328 1% 0 0% 0 0% 592 0%Haa 144 0% 620 3% 0 0% 1439 3% 0 0% 0 0% 698 4% 0 0% 2,901 2%Lhuentse 957 3% 1,471 6% 0 0% 566 1% 0 0% 458 1% 471 3% 0 0% 3,923 2%Mongar 2,735 9% 923 4% 0 0% 2939 6% 0 0% 1220 4% 1388 9% 0 0% 9,205 6%Paro 263 1% 1,286 6% 271 15% 4542 9% 0 0% 1244 4% 1313 8% 800 17% 9,719 6%Pemagatshel 1,747 6% 414 2% 0 0% 2454 5% 0 0% 1161 4% 586 4% 798 17% 7,160 5%Punakha 917 3% 1,053 5% 0 0% 1844 4% 0 0% 1840 6% 723 4% 0 0% 6,377 4%Samdrupjongkhar 1,414 5% 2,026 9% 58 3% 2105 4% 0 0% 2387 7% 0 0% 0 0% 7,990 5%Samtse 2,368 8% 1,371 6% 0 0% 1202 2% 0 0% 6538 20% 555 3% 0 0% 12,034 8%Sarpang 1,819 6% 0 0% 137 8% 3749 8% 0 0% 2148 7% 1217 8% 293 6% 9,363 6%Thimphu 876 3% 4,830 21% 1294 74% 6879 14% 668 73% 3790 12% 2438 15% 2,234 47% 23,009 15%Trashigang 3,270 11% 2,156 9% 0 0% 4052 8% 0 0% 1249 4% 1832 11% 0 0% 12,559 8%Trashiyangtse 1,671 6% 369 2% 0 0% 1996 4% 0 0% 653 2% 513 3% 0 0% 5,202 3%Trongsa 1,197 4% 773 3% 0 0% 764 2% 0 0% 388 1% 428 3% 0 0% 3,550 2%Tsirang 698 2% 642 3% 0 0% 1915 4% 0 0% 821 3% 564 3% 0 0% 4,640 3%Wangdue 1,630 5% 2,188 10% 0 0% 2169 4% 0 0% 809 3% 517 3% 0 0% 7,313 5%Zhemgang 1,158 4% 1,184 5% 0 0% 1863 4% 0 0% 447 1% 755 5% 0 0% 5,407 3%Total 914 4,770
Dzongkhag HSS Pvt. HSS
157,112
TotalPvt. LSS MSSCPS PS Pvt. PS LSS
32,292 16,15548,70629,702 22,813 1,760 Table 2.8 Enrolment per Dzongkhag per level 2006-2008
2006 2007 2008 2006 2007 2008 2006 2007 2008 2006 2007 2008Bumthang 2,637 2,613 2,583 678 676 677 470 589 592 300 316 367Chukha 10,072 10,510 10,890 2,103 2,146 2,324 1,585 1,882 1,909 788 860 947Dagana 3,571 3,978 4,709 440 518 743 397 424 427 0 0 0Gasa 424 405 407 72 87 105 0 32 80 0 0 0Haa 1,902 1,878 1,854 445 493 527 472 464 410 122 112 110Lhuentse 2,826 2,834 2,836 489 525 552 377 394 391 76 131 144Mongar 6,221 6,245 6,399 1,225 1,375 1,389 974 1,014 994 364 350 423Paro 5,515 5,678 5,836 1,470 1,556 1,481 1,230 1,151 1,186 777 829 1,216Pemagatshel 2,549 4,123 3,993 611 980 1,069 534 1,108 977 279 312 323Punakha 3,080 3,093 4,101 694 682 1,048 701 699 971 830 891 1,055Samdrupjongkhar 7,275 6,036 6,073 1,422 1,277 1,327 853 276 590 0 0 0Samtse 8,440 9,093 9,418 1,185 1,386 1,532 618 772 941 70 124 143Sarpang 6,389 6,609 6,462 1,180 1,354 1,448 868 980 1,053 101 110 400Thimphu 14,148 14,602 13,893 3,505 3,566 3,233 2,707 2,827 2,711 2,704 2,996 3,172Trashigang 9,012 8,502 8,398 1,761 1,922 1,928 1,446 1,489 1,573 551 580 660Trashiyangtse 3,509 3,575 3,653 602 655 702 442 489 538 289 310 309Trongsa 2,656 2,584 2,473 431 504 591 380 376 365 134 128 121Tsirang 2,912 3,070 3,190 536 578 701 386 432 486 226 270 263Wangdue 5,333 5,361 5,250 981 1,057 1,031 733 784 786 174 216 246Zhemgang 3,754 3,678 3,682 652 767 839 542 625 628 317 281 258Total 102,225 104,467 106,100 20,482 22,104 23,247 15,715 16,807 17,608 8,102 8,816 10,157
XI-XIIPP-VI VII-VIII IX-X
As can be seen from the table, the changing of the dzongkhag boundaries has had a significant impact on the enrolment in Pemagatshel, Samdrupjongkhar and Trashigang between 2006 and 2007, and on Punakha and Thimphu between 2007 and 2008.
2.2.3. Teachers in the Dzongkhags Table 2.9 shows the teachers per school type per dzongkhag in Bhutan. Details are discussed in the chapters about teachers and quality indicators.

13
Table 2.9 Teachers in Bhutan in 2008 per school type per dzongkhag CPS PS LSS MSS HSS Pvt
Teachers Teachers Teachers Teachers Teachers Teachers Teachers %Bumthang 66 0 43 37 25 24 10 181 3% 23Chukha 79 32 163 195 75 28 36 580 10% 28Dagana 58 9 40 35 0 41 0 142 2% 41Gasa 8 12 0 18 0 16 0 38 1% 16Haa 7 30 63 0 31 22 0 131 2% 22Lhuentse 36 43 24 17 23 27 0 143 2% 27Mongar 86 25 90 45 63 30 0 309 5% 30Paro 12 51 175 58 60 24 47 403 7% 24Pemagatsel 66 18 75 41 23 29 0 223 4% 32Punakha 47 43 71 78 42 23 36 317 6% 20Samdrupjongkhar 34 51 52 86 0 36 7 230 4% 35Samtse 50 33 40 160 32 38 0 315 5% 38Sarpang 50 0 97 58 59 34 19 283 5% 33Thimphu 37 180 266 181 119 24 233 1022 18% 23T/gang 134 83 144 47 75 26 0 483 8% 26T/yangtse 60 10 58 26 23 29 0 177 3% 29Tongsa 50 32 36 17 19 23 0 154 3% 23Tsirang 16 16 59 22 27 33 0 140 2% 33Wangdue 62 81 69 36 31 26 0 279 5% 26Zhemgang 41 45 62 20 27 28 0 195 3% 28Total 999 794 1627 1177 754 28 388 5745 27
T:P All schools
T:P Public schools
TotalDzongkhag
2.3 Girls Enrolment Girls’ enrolment over the last 6 years shows a slow but steady increase. With the exception of higher secondary level, the girls’ enrolment as a percentage of the total school enrolment is about 50%, at every level of general education. However, even at the higher secondary level, the enrolment of girls has been increasing steadily over the years as Table 2.10 shows. Table 2.10 Enrolment of girls in primary and secondary education 2002-2008
STD % STD % STD % STD % STD % STD % STD % STD %2008 51255 50% 1274 48% 11759 51% 32 40% 8698 50% 13 27% 2181 40% 2373 51%2007 50071 49% 1136 47% 10995 50% 12 39% 8210 49% 30 42% 2023 39% 1806 49%2006 49003 49% 1014 50% 10251 50% 7585 48% 23 55% 1695 36% 1673 50%2005 47514 49% 1142 48% 9734 50% 6829 46% 9 29% 1432 33% 1654 49%2004 46237 48% 1079 48% 8653 49% 6518 47% 22 50% 1213 32% 1418 48%2003 44235 48% 818 49% 7926 49% 10 50% 5802 46% 14 44% 1092 33% 1196 49%2002 42244 47% 694 48% 7681 48% 5083 45% 844 32% 856 47%
Public Private Public PrivatePublic Private Public PrivatePP-VI VII-VIII XI-XIIIX-X
Table 2.11 shows the details per school level and per school type for 2008. Table 2.11 Girls’ enrolment by type/level of school 2008
G T G T G T G T G T G T G TPP 435 965 2,541 5,111 1,685 3,339 2,523 5,065 990 1,954 - - 8,174 16,434 I 239 486 2,489 5,130 1,635 3,366 2,470 4,992 1,047 2,123 - - 7,880 16,097 II 204 395 2,443 5,152 1,700 3,498 2,586 5,327 1,031 2,170 - - 7,964 16,542 III 132 288 2,063 4,180 1,569 3,279 2,547 5,159 975 2,090 - - 7,286 14,996 IV 100 210 2,026 4,035 1,720 3,438 2,763 5,342 1,196 2,487 - - 7,805 15,512 V 92 166 1,642 3,323 1,592 3,163 2,505 4,920 1,120 2,243 - - 6,951 13,815 VI 72 155 1,324 2,771 1,396 2,730 2,580 5,017 1,097 2,031 - - 6,469 12,704
Sub-Total 1,274 2,665 14,528 29,702 11,297 22,813 17,974 35,822 7,456 15,098 - - 52,529 106,100 VII 20 52 - - - - 3,667 7,066 2,342 4,626 268 584 6,297 12,328 VIII 12 29 - - - - 2,952 5,818 1,970 4,025 560 1,047 5,494 10,919
Sub-Total 32 81 - - - - 6,619 12,884 4,312 8,651 828 1,631 11,791 23,247 IX 6 19 - - - - - - 2,436 5,068 2,386 4,612 4,828 9,699 X 7 29 - - - - - - 1,607 3,475 2,269 4,405 3,883 7,909
Sub-Total 13 48 - - - - - - 4,043 8,543 4,655 9,017 8,711 17,608 XI 1,320 2,541 - - - - - - - - 1,116 2,885 2,436 5,426 XII 1,053 2,109 - - - - - - - - 1,065 2,622 2,118 4,731
Sub-Total 2,373 4,650 - - - - - - - - 2,181 5,507 4,554 10,157 Total 3,692 7,444 14,528 29,702 11,297 22,813 24,593 48,706 15,811 32,292 7,664 16,155 77,585 157,112
Private Schools
Com. Primary Schools
PrimarySchools
Lower Sec. Schools
Middle Sec.Schools
Higher Sec.Schools TotalClass

14
In table 2.12 the percentage wise enrolment of girls is presented. 2.12 Percentage wise girls’ enrolment per level and type of school, March 2008
Class Pvt CPS PS LSS MSS HSS ALLPP-VI 47.8% 48.9% 49.5% 50.2% 49.4% 49.5%VII-VIII 39.5% 51.4% 49.8% 50.8% 50.7%
IX-X 27.1% 47.3% 51.6% 49.5%XI-XII 51.0% 39.6% 44.8%PP-XII 49.6% 48.9% 49.5% 50.5% 49.0% 47.4% 49.4%
Table 2.13 gives a regional picture of the number and percentage of girls enrolled under the different categories of schools by dzongkhag. This ratio is a crude indicator, since it does not take into account differences in overall population, which could make significant differences, especially in scantily populated areas where a 50-50 gender division is not always realistic. Table 2.13 Girls’ enrolment per location per dzongkhag, March 2008
Enrol % Enrol % Enrol % Enrol % Enrol % Enrol % Enrol %Bhutan 35815 50% 14669 48% 13846 50% 8470 53% 4704 41% 81 36% 77585 49%Bumthang 1165 50% 467 51% 430 50% 58 47% 2120 50%Chukha 4529 50% 1361 49% 924 48% 920 45% 154 44% 7888 49%Dagana 1334 49% 916 49% 420 48% 227 51% 2897 49%Gasa 170 52% 57 51% 48 31% 275 46%Haa 706 53% 660 49% 71 56% 59 57% 1496 52%Lhuentse 347 44% 414 47% 441 49% 543 49% 132 49% 1877 48%Mongar 1190 46% 1095 49% 480 49% 1044 49% 566 44% 4375 48%Paro 3387 51% 1030 49% 426 53% 116 50% 0% 4959 51%Pemagatshel 575 43% 533 46% 594 48% 833 47% 446 51% 2981 47%Punakha 1251 50% 539 52% 1874 54% 87 50% 3751 52%Samdrupjongkhar 1106 50% 311 49% 574 46% 1249 45% 577 50% 3817 48%Samtse 1901 49% 2485 47% 338 49% 420 47% 597 45% 5741 48%Sarpang 2914 50% 600 47% 1005 49% 60 50% 26 42% 4605 49%Thimphu 10980 52% 540 47% 280 51% 47 51% 33 48% 11880 52%Trashigang 1358 50% 1782 46% 1698 49% 597 48% 551 45% 5986 48%Trashiyangtse 628 48% 326 45% 972 50% 473 50% 137 46% 2536 49%Trongsa 697 48% 339 54% 485 51% 185 51% 77 46% 1783 50%Tsirang 947 48% 408 50% 332 52% 548 46% 2235 48%Wangdue 1489 51% 1626 52% 471 54% 194 52% 3780 52%Zhemgang 645 48% 445 48% 281 51% 271 43% 961 49% 2603 48%
TotalVery Remote DifficultUrban Semi-Urban Semi-Remote Remote
On average, girls make up 49% of the enrolment in Bhutanese schools and in several dzongkhags it is above 50%. Since enrolment and population figures are so small, these are all indicative figures. It is difficult to draw valid conclusions without knowing the actual population in the dzongkhags and regional categories.
Girls’ enrolment in HSS and tertiary education As mentioned earlier, the comparative enrolment of girls in Public Higher Secondary Schools is lower than in the earlier stages of the general education system. In table 2.14 the girls’ enrolment in class X and class XI is compared over the years. Table 2.14 Girls’ enrolment in class X and class XI public and private schools 03- 08.
Year G T % G G T % G G T % G2008 3883 7909 49% 1116 2885 39% 1320 2541 52%2007 3675 7691 48% 1096 2667 41% 942 1914 49%2006 3275 6856 48% 944 2525 37% 865 1709 51%2005 3038 6427 47% 770 1539 33% 851 1688 50%2004 2842 6246 46% 656 2031 32% 774 1579 49%2003 2361 5264 45% 571 1751 33% 613 1240 49%
level XI public XI privateX
15
In 2008 the relative percentage of girls’ enrolment in class XI in Public Higher Secondary Schools decreased a little, although the girls enrolment in terms of absolute numbers increased compared to 2007. However, only next year’s figures will indicate whether this is a trend. In the publicly financed tertiary education system, both in and ex-country enrolment of girls is still much lower than that of boys. Only 33% of the students studying under the RUB institutes are girls and only 18% of the students receiving scholarship to study abroad are girls. On the other hand, 58% of the students studying without scholarships abroad are girls, indicating the willingness of parents to spend equally on the education of girls and boys.
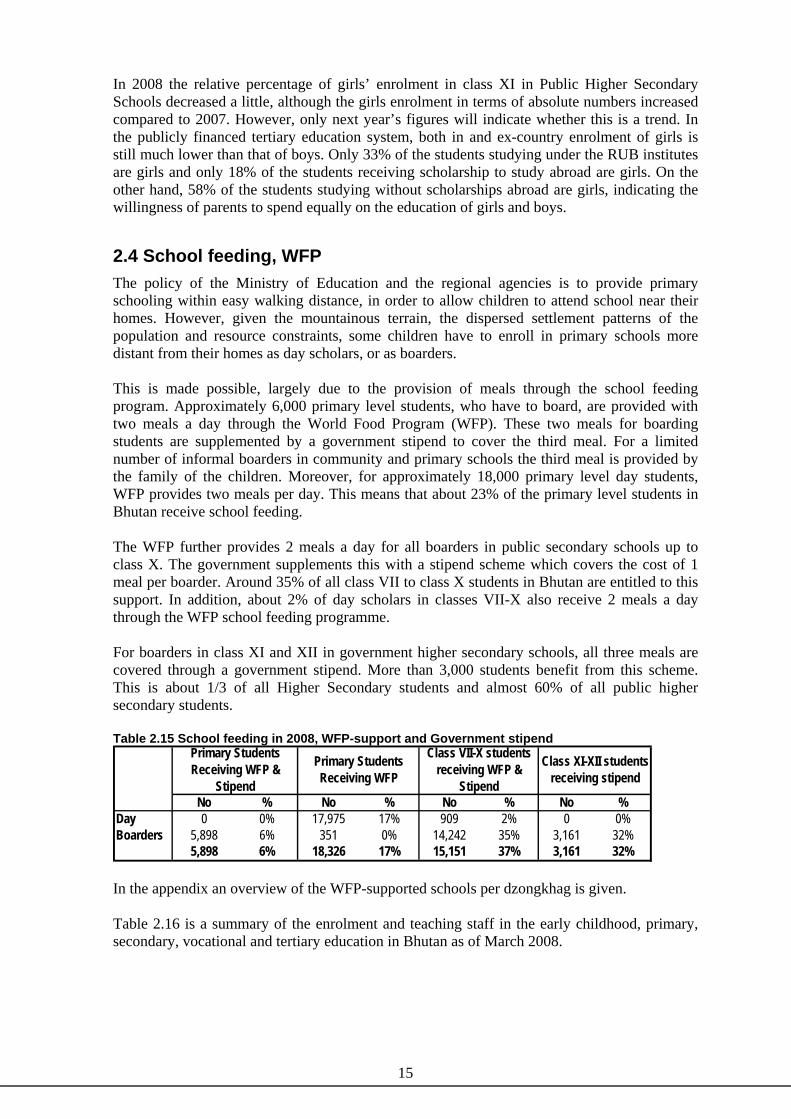
2.4 School feeding, WFP The policy of the Ministry of Education and the regional agencies is to provide primary schooling within easy walking distance, in order to allow children to attend school near their homes. However, given the mountainous terrain, the dispersed settlement patterns of the population and resource constraints, some children have to enroll in primary schools more distant from their homes as day scholars, or as boarders. This is made possible, largely due to the provision of meals through the school feeding program. Approximately 6,000 primary level students, who have to board, are provided with two meals a day through the World Food Program (WFP). These two meals for boarding students are supplemented by a government stipend to cover the third meal. For a limited number of informal boarders in community and primary schools the third meal is provided by the family of the children. Moreover, for approximately 18,000 primary level day students, WFP provides two meals per day. This means that about 23% of the primary level students in Bhutan receive school feeding. The WFP further provides 2 meals a day for all boarders in public secondary schools up to class X. The government supplements this with a stipend scheme which covers the cost of 1 meal per boarder. Around 35% of all class VII to class X students in Bhutan are entitled to this support. In addition, about 2% of day scholars in classes VII-X also receive 2 meals a day through the WFP school feeding programme. For boarders in class XI and XII in government higher secondary schools, all three meals are covered through a government stipend. More than 3,000 students benefit from this scheme. This is about 1/3 of all Higher Secondary students and almost 60% of all public higher secondary students. Table 2.15 School feeding in 2008, WFP-support and Government stipend
No % No % No % No %Day 0 0% 17,975 17% 909 2% 0 0%Boarders 5,898 6% 351 0% 14,242 35% 3,161 32%
5,898 6% 18,326 17% 15,151 37% 3,161 32%
Primary Students Receiving WFP &
Stipend
Primary Students Receiving WFP
Class VII-X students receiving WFP &
Stipend
Class XI-XII studentsreceiving stipend
In the appendix an overview of the WFP-supported schools per dzongkhag is given. Table 2.16 is a summary of the enrolment and teaching staff in the early childhood, primary, secondary, vocational and tertiary education in Bhutan as of March 2008.

16
Table 2.16 Summary of Enrolment and Teaching Staff in Bhutan, 2008
Male Female Total Bht N/Bht TotalA Early Childhood Care (Day Care Centres) 10 19 143 151 294 26 - 26 B School Education 1 Community Primary Schools 261 1,533 15,174 14,528 29,702 998 2 1,000 2 Primary Schools 81 774 11,516 11,297 22,813 792 7 799 3 Pvt. Primary Schools 13 93 917 843 1,760 108 15 123 4 Lower Secondary Schools 89 1,377 24,113 24,593 48,706 1,537 90 1,627 5 Pvt. Lower Secondary Schools 3 41 486 428 914 51 13 64 6 Middle Secondary Schools 44 863 16,481 15,811 32,292 982 195 1,177 7 Higher Secondary Schools 24 447 8,491 7,664 16,155 510 244 754 8 Pvt. Higher Secondary Schools 8 131 2,349 2,421 4,770 120 81 201
Sub-Total 523 5,259 79,527 77,585 157,112 5,098 647 5,745 C Tertiary Education Insitutes (RUB)1 College of Natural Resources, Lobesa 1 117 23 140 69 2 71 2 College of Science and Technology, Rinchending 1 189 58 247 62 14 76 3 Institutes of Language and Culture Studies, Semtokha 1 213 125 338 56 1 57 4 Jigme Namgyel Polytechnic, Dewathang 1 244 63 307 57 2 59 5 National Institute of Traditional medicine, Thimphu 1 32 3 35 15 - 15 6 Paro College of Education, Paro 1 537 302 839 77 3 80 7 Royal Institute for Health Sciences, Thimphu 1 131 126 257 41 2 43 8 Royal Institute of Management, Semtokha 1 177 100 277 75 2 77 9 Samtse College of Education, Samtse 1 425 234 659 78 9 87
10 Sherubtse College , Kanglung 1 741 350 1,091 88 42 130 Sub-Total 10 - 2,806 1,384 4,190 618 77 695
D Vocational Institutes1 Vocational Training Institute, Khuruthang 1 118 50 168 15 - 15 2 Vocational Training Institute, Samthang 1 88 9 97 12 - 12 3 Vocational Training Institute, Chumey 1 136 91 227 13 - 13 4 Vocational Training Institute, Rangjung 1 121 53 174 16 - 16 5 Vocational Training Insitute, Shershong 1 79 56 135 9 - 9 6 Trashiyangtse Institute ofr Zorig Chusum 1 61 42 103 14 - 14 7 National Institute for Zorig Chusum 1 245 135 380 26 - 26
Sub-Total 7 - 848 436 1,284 105 - 105 E Special Institutes1 National Institute of Disabled 1 30 20 50 13 - 13 2 Jigmecholing Sanskrit Pathshala 1 18 - 18 1 - 1
Sub-Total 2 48 20 68 14 - 14 F Non-Formal Education Programme 747 4,183 9,647 13,830 322 414 736
Total 1,299 5,278 87,555 89,223 176,778 6,183 1,138 7,321
Enrolment TeachersSl.No. Levels/Types of Schools, Centres & Institutes No.s Sec.s

17
3. Enrolment in the General Education Program 3.1 Primary Education (Classes PP-VI) The number of new entrants in primary education in 2008 was 15,242. This is about the same as in 2007. Two important indicators to monitor the level of access to education in Bhutan are the Apparent (Gross) Intake Ratio (AIR) and the Net Intake Ratio (NIR)5. Table 3.1 gives the AIR for the last 5 years. Both private and public students are included, monastic and international are left out. As shown in the table, the AIR has exceeded 100% for the last 5 years and continues to increase. The Net Intake Ratio for 2008 is estimated at around 50%. This is a bit lower than last year when it was estimated at 53%. In 2006 it was estimated at 44%. The estimate is based upon the assumption that all 6 year olds in PP are new entrants since the age of the repeaters is unknown. Since the Apparent Intake Ratio has been more than 100% over the last years and this year it is around 114% it is safe to assume that a lot of children go to school for the first time when they are older than 6. For 2008 the estimation is that around 50% of the new entrants are older than 6 years. Since several children are younger than 6 in PP the NIR is an estimate. Table 3.1 Gross or Apparent Intake Ratio (AIR) 2004-2008
Year Enrolment Repeaters New Entrants Pop. 6 yrs old AIR2008 16,434 1,192 15,242 13,343 114%2007 16,392 1,127 15,265 13,347 114%2006 16,842 1,257 15,585 13,907 111%2005 15,518 1,507 14,011 12,887 108%2004 16,636 1,761 14,875 14,143 104%
Table 3.2 New admissions in PP 1996-2008
Boys Girls Total # %2008 7,612 7,630 15,242 -23 -0.2%2007 7,751 7,514 15,265 -320 -2.1%2006 7,967 7,618 15,585 1,574 11.2%2005 7,187 6,824 14,011 -864 -5.8%2004 7,565 7,310 14,875 891 6.4%2003 7,052 6,932 13,984 493 3.7%2002 6,967 6,524 13,491 614 4.8%2001 6,613 6,264 12,877 -301 -2.3%2000 7,000 6,178 13,178 729 5.9%1999 6,626 5,823 12,449 643 5.4%1998 6,325 5,481 11,806 -940 -7.4%1997 6,800 5,946 12,746 951 8.1%1996 6,394 5,401 11,795 1,862 18.7%
3.6%Average annual growth rate
GrowthPP EnrolmentYear
Table 3.2 above shows the new admissions in PP for the last 12 years. While the overall enrolment has decreased in the last two years, it is also seen that this year for the first time, the number of new female entrants into PP has exceeded that of boys. Table 3.3 below shows that the total enrolment in primary education has increased by 1,547 students in 2008. Although the total enrolment has been increasing for the last ten years, the enrolment growth rate over the last 3 years has been decreasing. This is not surprising since the birth rate in Bhutan has been decreasing, while the expansion in schools and resulting large 5 AIR = total number of new entrants/total population of correct age (6 years old) NIR = total number of correct age entrants (6 years old)/total population of correct age (6 years old)

18
intakes have reduced the number of overage out of school children. Table 3.3 gives the primary enrolment (for both public and private schools) for the last 12 years. Table 3.3: Enrolment in Primary Education, 1996-2008
Boys Girls Total # %2008 53,571 52,529 106,100 1,633 1.6%2007 53,260 51,207 104,467 2,275 2.2%2006 52,187 50,005 102,192 2,318 2.3%2005 51,218 48,656 99,874 2,025 2.1%2004 50,443 47,406 97,849 3,875 4.1%2003 48,921 45,053 93,974 3,030 3.3%2002 48,006 42,938 90,944 2,752 3.1%2001 46,942 41,250 88,192 3,095 3.6%2000 45,846 39,251 85,097 3,941 4.9%1999 44,100 37,056 81,156 3,149 4.0%1998 42,787 35,220 78,007 3,341 4.5%1997 41,345 33,321 74,666 4,698 6.7%1996 39,198 30,770 69,968 5,053 7.8%
3.9%Average annual growth rate
StudentsYears Annual Growth
Table 3.4 shows the Gross primary enrolment ratio and the Net primary enrolment ratio from 2005 to 2008. Table 3.4 NPER and GPER 2005-20086
Gross Primary Enrolment Net Primary Enrolment2008 112% 88%2007 106% 84%2006 102% 79%2005 97% 73%
According to the table above, the number of out of school primary age children not in PP-VI is around 11,200. However, these children do not necessarily have to be out-of-school. Analyzing current data allows for the following assumptions and estimates of the whereabouts of these children to be made:
• A large proportion of these children are 6 years old and not yet in school. Since the NIR is estimated to be around 50%, while the AIR is around 114%, it is can be assumed that more than 50% of the children entering school for the first time are older than 6 years old, while some will be younger, especially in the private schools. This big difference between NIR and AIR has also occurred in previous years. It is estimated that around 5% of the 6-12 year old children are 6 years old and not yet enrolled. Given the limited spaces in urban areas and the difficult walking distances in remote areas, it is very likely that most of them will be enrolled next year or the year thereafter.
• A small group of these primary school age children who are not in the primary levels is actually enrolled in class VII or higher. The Net Primary Enrolment does not include these children. Based on the available data, around 1% of the children aged between 6 to 12 years old are enrolled in secondary education in Bhutan.
• Based on the PHCB results, an estimate of the number of primary age children staying/studying abroad and the number of primary age children studying/staying in monastic schools can be made. In 2005 around 1% of the 6-12 year old children were reported to be temporarily abroad. It is assumed that they were enrolled in school. In 2005 around 2% of the 6-12 years old children were assumed to be enrolled in traditional,
6 As mentioned in footnote 8, chapter 2, the denominator for 2005 to 2007 ratios was based on the PHCB05 data with 0% international migration and 0% mortality for the concerned age group. The 2008 ratios used the population projection 2006-2030 published by NSB in June 2008.

19
monastic education7. If we assume that the proportion of children abroad and in the monastery as a proportion of the total out-of-school population remains the same, it is estimated that around 0.5% of the 6-12 year old children are studying abroad and around 1% of the 6-12 year old are studying in the monastery.
• The last group are the children 7 years and older who are currently out of school. They will have dropped out or never gone to school. Looking at the current age of entrants in PP some might still enroll or return to school while some will not. This is around 4.5% of all the 6-12 year old children. Since the age of the drop-outs is unknown, it is not possible to estimate how many of these children have actually dropped out and how many never went to school.
• Some of the out of school children mentioned above would also include disabled children. In order to achieve universal primary education it would be necessary to make provisions also for the education of all disabled children and this includes also finding how many children in Bhutan are disabled, how many of these children are already in school and what kind of special needs these children have in order to receive quality education.
Table 3.5 shows the indicative Net Primary Enrolment Ratio and the Gross Primary Enrolment Ratio per dzongkhag for 2008. The Gender Parity Index is included for both Net and Gross enrolment. The Gender parity index is the ratio of girls to boys enrollment. If this index is between 0.97 and 1.03, it is considered to be parity or equal representation of both sexes. However, if it is higher or lower, one of the two sexes is underrepresented.
The enrolment ratios for 2008 are based upon the population projections done by the NSB for 2006-2030, which also account for the changes made in the boundaries of the dzongkhags. Table 3.5 Indicative NER & GER Primary and the Gender Parity Index per Dzongkhag 2008
B G BG GPI B G BG GPIBhutan 87% 89% 88% 1.02 112% 112% 112% 1.00Bumthang 89% 96% 92% 1.07 110% 116% 113% 1.06Chukha 86% 86% 86% 0.99 111% 104% 108% 0.94Dagana 82% 92% 87% 1.12 118% 122% 120% 1.04Gasa 90% 63% 76% 0.70 105% 76% 91% 0.72Haa 85% 95% 90% 1.11 104% 112% 108% 1.08Lhuentse 89% 88% 89% 0.99 114% 114% 114% 0.99Mongar 89% 91% 90% 1.02 108% 110% 109% 1.02Paro 96% 97% 97% 1.01 117% 118% 117% 1.00Pemagatshel 94% 92% 93% 0.98 120% 120% 120% 1.00Punakha 90% 96% 93% 1.08 110% 120% 115% 1.10Samdrupjongkhar 85% 80% 82% 0.95 113% 109% 111% 0.97Samtse 74% 78% 76% 1.06 103% 103% 103% 1.00Sarpang 83% 85% 84% 1.02 111% 111% 111% 1.01Thimphu 94% 95% 95% 1.01 115% 113% 114% 0.99Trashigang 88% 87% 87% 0.99 109% 107% 108% 0.98Trashiyangtse 98% 98% 98% 1.00 126% 125% 126% 0.99Trongsa 92% 96% 94% 1.04 115% 120% 118% 1.04Tsirang 78% 79% 78% 1.00 115% 113% 114% 0.98Wangdue 87% 91% 89% 1.04 106% 114% 110% 1.08Zhemgang 91% 95% 93% 1.05 120% 123% 121% 1.02
NER GER
This year the girls seem to have overtaken the boys in terms of correct age enrolment. However the difference is too small to draw any conclusions. 7 Of the 4,612 6-12 years old children that reported to be either following traditional education, Non-formal or self-learning, 2,392 states they are also enrolled in regular school. The assumption is that these students receive tutoring in their free hours. This implies that 2220 students aged 6-12 years old are enrolled either in traditional in Non-Formal education. Since in general children this young are not allowed to join NFE, it is assumed that they were enrolled in traditional education, e.g. monastic education (from PHCB05).

20
Table 3.6 shows an estimated distribution of out of school primary age children among the dzongkhags. The biggest number of out of school primary aged children is in Samtse with 20%. A big proportion can also be found in the other populous Dzongkhags like Chhukha, Trashigang and Samdrupjongkhar. For Thimphu Dzongkhag, it can be assumed that a significant number of the children not in PP-VI are either in class VII or higher or studying abroad. 3.6 Division of number of 6-12 years old not in PP-VI, March 2008 Samtse 20% Lhuentse 3%Chukha 13% Pema Gatshel 2%Trashigang 9% Zhemgang 2%Samdrupjongkhar 9% Haa 2%Sarpang 8% Bumthang 2%Thimphu 6% Paro 1%Tsirang 5% Trongsa 1%Mongar 5% Gasa 1%Wangdue 5% Punakha 2%Dagana 5% Trashiyangtse 1% A comparison of the changes in enrolment between 2008 and 2007 at the dzongkhag level shows a general increase in both Net and Gross enrolment ratios. In table 3.7 the dzongkhags that have a change of more than 5% in the NPER since last year have been highlighted. 3.7 Indicative NER & GER Primary per Dzongkhag, 2007 & 2008
2007 2008 2007 2008 2007 2008 2007 2008 2007 2008 2007 2008B B G G BG BG B B G G BG BG
Bhutan 84% 87% 84% 89% 84% 88% 107% 112% 104% 112% 106% 112%Bumthang 95% 89% 98% 96% 97% 92% 115% 110% 115% 116% 115% 113%Chukha 79% 86% 80% 86% 79% 86% 101% 111% 96% 104% 98% 108%Dagana 86% 82% 88% 92% 87% 87% 121% 118% 117% 122% 119% 120%Gasa 71% 90% 51% 63% 61% 76% 92% 105% 73% 76% 82% 91%Haa 88% 85% 88% 95% 88% 90% 110% 104% 105% 112% 107% 108%Lhuentse 83% 89% 82% 88% 82% 89% 106% 114% 102% 114% 104% 114%Mongar 84% 89% 83% 91% 83% 90% 105% 108% 100% 110% 103% 109%Paro 88% 96% 87% 97% 87% 97% 108% 117% 107% 118% 107% 117%P/Gatshel 94% 94% 95% 92% 94% 93% 120% 120% 117% 120% 118% 120%Punakha 85% 90% 95% 96% 90% 93% 102% 110% 119% 120% 110% 115%S/jongkhar 85% 85% 78% 80% 81% 82% 112% 113% 105% 109% 109% 111%Samtse 72% 74% 72% 78% 72% 76% 98% 103% 93% 103% 96% 103%Sarpang 73% 83% 74% 85% 73% 84% 98% 111% 96% 111% 97% 111%Thimphu 91% 94% 93% 95% 92% 95% 109% 115% 108% 113% 109% 114%Trashigang 87% 88% 81% 87% 84% 87% 108% 109% 100% 107% 104% 108%Trashiyangtse 91% 98% 89% 98% 90% 98% 117% 126% 114% 125% 116% 126%Trongsa 93% 92% 96% 96% 95% 94% 116% 115% 123% 120% 119% 118%Tsirang 73% 78% 72% 79% 72% 78% 106% 115% 105% 113% 105% 114%Wangdue 87% 87% 87% 91% 87% 89% 104% 106% 107% 114% 106% 110%Zhemgang 91% 91% 91% 95% 91% 93% 121% 120% 116% 123% 119% 121%
NER GER
The only dzongkhag where the NPER decreased significantly is Bumthang. The figures for the boys have gone down. Whether or not this will be a trend will be seen next year. Compared to last year, the Gasa figures have gone up. However, Gasa’s population is too small to draw conclusions. Sarpang shows a remarkable increase, mainly as a result of the change in boundaries of the dzongkhag, wherein 3 Gewogs were shifted from Sarpang to Dagana, and this change is reflected for the first time in this overview.

21
The continuing increase in enrolment is very encouraging. Figures indicate that increasing the Net Intake Ratio to ensure that more and more children enroll at the age of 6 and strategies focused on increasing enrolment in highly populous dzongkhags like Samtse, Chhukha, Trashigang and Samdrupjongkhar are required for achieving universal primary enrolment.
3.2 Secondary Education Lower and Middle Secondary Education (VII-X)
Table 3.8 gives the enrolment for the classes VII to X since 1995. Since private schools hardly offer these levels there is no distinction made between private and public students. The annual growth at this level has been high since 1995, especially compared with the growth in primary education. Table 3.8 Enrolment in Class VII-X 1996-2008
Boys Girls Total # %2008 20,353 20,502 40,855 1,944 5.0%2007 19,664 19,247 38,911 2,714 6.5%2006 18,315 17,882 36,197 2,367 7.0%2005 17,258 16,572 33,830 2,382 7.6%2004 16,256 15,192 31,448 2,565 8.9%2003 15,131 13,752 28,883 1,472 5.4%2002 14,647 12,764 27,411 1,544 6.0%2001 14,070 11,797 25,867 2,566 11.0%2000 12,878 10,423 23,301 3,178 15.8%1999 11,238 8,885 20,123 2,749 15.8%1998 9,804 7,570 17,374 2,634 17.9%1997 8,392 6,348 14,740 3,185 27.6%1996 6,688 4,867 11,555 2,004 21.0%
21.0%
Enrolment in Class VII-X Annual GrowthYear
Average annual growth rate
Higher Secondary Education (XI-XII) Students who graduate from Class X are admitted in public Higher Secondary Schools based on merit. Those students, who do not qualify but can afford to pay, continue their education in private Higher Secondary schools. Students can choose between 3 different streams, Science, Arts and Commerce. Table 3.9 shows the distribution of enrolment among the streams. Only a few private schools offer Scince. The majority of the students in government schools opt for Science. The main reason for the increase in Science enrolment this year could be attributed to the increase in number of Science seats in government schools. Commerce appears to be the most popular stream among the private school students. Table 3.9: Enrolment in Class XI and XII per stream, March 2008
# % # % # %Arts 267 9% 859 34% 1126 21%Commerce 894 31% 1479 58% 2373 44%Science 1724 60% 203 8% 1927 36%Sub-total 2885 100% 2541 100% 5426 100%Arts 426 16% 823 39% 1249 26%Commerce 977 37% 1070 51% 2047 43%Science 1219 46% 216 10% 1435 30%Sub-total 2622 100% 2109 100% 4731 100%
Total
Class XIClass XII
Public Schools Private Schools

22
On the whole, the number of higher secondary students this year has grown at a higher rate than in the last two years mainly because one private primary school has upgraded to higher secondary level. This shows the important role Private Higher Secondary Schools play in the general education system.Table 3.10 shows the enrolment since 1995. Table 3.10 Enrolment in public and private higher secondary schools since 19968
Boys Girls Total Boys Girls Total Boys Girls Total %age2008 3326 2181 5507 2277 2373 4650 5603 4554 10157 1341 13.2%2007 3142 2023 5165 1845 1806 3651 4987 3829 8816 714 8.1%2006 3069 1695 4764 1665 1673 3338 4734 3368 8102 418 5.4%2005 2900 1432 4332 1698 1654 3352 4598 3086 7684 993 14.8%2004 2546 1213 3759 1514 1418 2932 4060 2631 6691 887 15.3%2003 2261 1092 3353 1255 1196 2451 3516 2288 5804 1327 29.6%2002 1795 844 2639 982 856 1838 2777 1700 4477 1673 59.7%2001 1813 991 2804 864 44.5%2000 1299 641 1940 556 40.2%1999 953 431 1384 424 44.2%1998 673 287 960 28 3.0%1997 659 273 932 244 35.5%1996 501 187 688 231 50.5%
35.5%
Enrolment in Classes XI & XII
Year
Average annual growth rate
Public Private Total Annual growth
From 2002 onwards, the enrolment in both private and public schools is shown. Overall, the enrolment has increased trememdously in the last 12 years, with an increase of more than a 1000 students this year. With the government policy of enrolling approximately 40% of class X graduates in government HSSs, this growth will continue for quite some time.

23
4. Examination Results and Efficiency Indicators 4.1 Examination results
Class X Examinations The national level examinations at the end of Primary Education were instituted in 1972 with the aim of ensuring uniformity in the standard of education among the different schools across the country. It was also used as a touchstone for screening the candidates for entry into the next level of general education. With the upgrading of the basic education level to class X, the class X examinations have now replaced the end of primary education examinations as the major touchstone. For many students the class X examinations mark the end of their general education. Students who fail are only allowed to re-appear the examinations as private candidates and cannot attend regular classes in the government schools. However, these conditions may not apply to cases where students were sick or have valid reasons for not sitting the examinations. The figures shown in table 4.1 reflect only the results of the regular candidates. Table 4.1 Class X results, 1997-2007
Year 1997 1998 1999 1999 2000 2001 2002 2003 2004 2005 2006 2007
No. of students appeared 1,476 1,796 2,240 2,389 3,159 4,596 4,791 5,298 6,057 6,392 6,893 7,924No. of students passed 1,285 1,379 1,535 2,114 2,519 4,215 4,411 5,110 5,822 5,945 6,338 7,573No. of students failed 191 417 705 275 640 381 380 188 235 447 555 351Pass % 87% 77% 69% 88% 80% 92% 92% 96% 96% 93% 92% 96% The annual increase in the number of students appearing for exams has been very steady. In 2007 more than 1,000 students appeared compared to the previous year. Given the increased enrolment in primary and secondary education, the annual number of Class X graduates is likely to keep increasing. This year’s pass percentage was one of the highest ever.
Class XII Examination In 2006 the Bhutan Board of Examinations took over the conduct of the class XII exams from the CISCE. With regard to repetition and examinations in class XII, the same rules apply as in class X. Table 4.2 Class XII results, 1997-2007
Year 1997 1998 1999 2000 2001 2001 2002 2003 2004 2005 2006 2007
No. of students appeared 252 444 469 529 824 1206 1703 2997 3170 3871 3969 5027No. of students passed 250 372 443 469 752 1115 1582 2688 2904 3494 3737 4263No. of students failed 2 72 26 60 72 91 121 309 266 377 232 764Pass % 99% 84% 94% 89% 91% 92% 93% 90% 92% 90% 94% 85% Similar to class X, the number of students appearing for the class XII examinations increased by over 1000 in 2007. The pass percentage was very low, with one reason cited as the new curriculum in English and the Business Mathematics.
Class VI and Class VIII Examinations The Class VI examinations were decentralized in 1999 and the Class VIII examinations in 2006. The decentralization of examinations gives schools the responsibility for administration and marking of the examinations. However, for purposes of uniformity in standards, the papers for both examinations are still set by the Bhutan Board of Examinations (BBE).

24
4.2 Efficiency indicators 4.2.1. Promotees, Repeaters and Drop-outs
The efficiency of the Education System can be monitored by indicators such as repetition rate, dropout rate, promotion rate and survival rate at various levels of education. These are known as Efficiency Indicators. The lower the repetition and dropout rates, and the higher the number of promotees and the survival rate, the better the system is said to be doing. The Net and Gross enrolment (NER and GER) and intake ratios (AIR) indicate access to education. The efficiency indicators and the access indicators together give quantitative information on the quality of the system. If children come to school, remain in school and do not repeat too much, it gives an indication of the accessibility and the efficiency of the system.. Table 4.3 gives a general overview over the last 10 years for PP-X. The figures show that the repetition rate has gone down considerably. From 2006 onwards the Class X school leavers who do not continue onto class XI are no longer defined as drop-outs therefore the drop-out rate is lower after 2005. Table 4.3 Enrolment, repetition rate & drop-out rate PP-X 1998-2008
1998 1999 2000 2001 2002 2003 2004 2005 2006 2007 2008
Enrolment 95,381 101,279 108,398 114,071 118,355 122,857 128,771 133,288 138,422 143,378 146,955Promotees 71,811 77,289 82,624 88,625 92,883 98,218 105,384 113,948 118,262 134,545 127,606Repeaters 12,249 12,355 13,814 14,183 14,767 13,604 12,206 9,266 8,743 8,833 8,833Rep. Rate 13.7% 13.0% 13.6% 13.1% 12.9% 11.5% 9.9% 7.2% 6.6% 6.4% 6.0%Dropouts 5,346 5,737 4,841 5,590 6,421 6,533 5,267 5,557 4,055 4,989 4,064Dropout Rate 5.6% 5.7% 4.5% 4.9% 5.4% 5.3% 4.1% 4.2% 3.0% 3.6% 2.8% Table 4.4 Details on drop-outs and repeaters 2007-2008
Repeaters Promotees Dropouts2007 2008 2008 Imputed Imputed Promotees Repeaters Dropouts
PP 16,392 16,434 1,192 14,984 216 91.4% 7.3% 1.3%I 16,865 16,097 1,113 15,442 310 91.6% 6.6% 1.8%II 15,537 16,542 1,100 14,076 361 90.6% 7.1% 2.3%III 15,386 14,996 920 14,227 239 92.5% 6.0% 1.6%IV 14,899 15,512 1,285 13,084 530 87.8% 8.6% 3.6%V 13,450 13,815 731 12,262 457 91.2% 5.4% 3.4%VI 11,938 12,704 442 11,318 178 94.8% 3.7% 1.5%
Sub-Total 104,467 106,100 6,889 95,393 2,291 91.3% 6.6% 2.2%VII 11,887 12,328 1,010 10,204 673 85.8% 8.5% 5.7%VIII 10,217 10,919 715 9,093 409 89.0% 7.0% 4.0%
Sub-Total 22,104 23,247 1,330 19,297 1,082 87.3% 6.0% 4.9%IX 9,116 9,699 606 7,819 691 85.8% 6.6% 7.6%X* 7,691 7,909 90 5,318 0 69.1% 1.2% 0.0%
Sub-Total 16,807 17,608 614 13,137 691 78.2% 3.7% 4.1%Total 143,378 146,955 8,833 127,827 4,064 89.2% 6.2% 2.8%
* The students who leave school after Class X are Graduates and school leavers and not drop-outs
PercentageEnrolementClass
Table 4.4 gives the details per level of repeaters, promotees and drop-outs for 2007-2008. The drop-out rate in PP was 0 last year, however this year some children have dropped out from PP. The figures for Class X require some extra explanation. Every student who passed Class X is a Class X graduate. In 2007, 7,537 students passed their class X exams. Of those who failed or did not appear in the exam, 91 are repeaters and the rest are school leavers without a certificate. These school leavers might decide to do the exam again as private candidates. The graduates who cannot continue in class XI may choose to join a vocational training institute, attend a school abroad, or enter the job market.

25
Table 4.5 gives a more detailed overview of what happens with the class X students of 2007 in 2008. Table 4.5 Class X detailed results 2007-2008
% NumberGraduates continuing Class XI 67% 5,318Graduates not continuing Class XI 28% 2,255Repeaters 1% 90School-leavers without certificate 3% 261Total 7,924 Table 4.6 gives the drop-out rate over the last 7 years. This year the drop-out rate in class IX increased. Class IX and Class VII show a high drop-out rate. The number of drop-outs in PP is also very high this year. While this may be a statistical error, it is a cause for serious concern. The total number of drop-outs is higher than last year, although it has decreased percentage wise due to increased enrolment this year. A drop out rate of 0% until class IV is essential in order to achieve the goal of 100% NER. Moreover, it is also known at a minimum of 5 years of education is required to ensure literacy and numeracy. It is estimated that within the 9th FYP period, around 10,000 children have left the education system as illiterates. Of course they might have enrolled again, either in monasteries or abroad. Table 4.6 Drop-out rate and numbers 2002-2008
#` % #` % #` % #` % #` % #` %PP -62 0% 44 0% 33 0% -5 0% 21 0% 216 1% 247 0%I 381 3% 275 2% 168 1% 302 2% 127 1% 310 2% 1,563 2%II 526 4% 267 2% 355 2% 481 3% 389 2% 361 2% 2,379 3%III 420 3% 314 2% 234 2% 223 2% 118 1% 239 2% 1,548 2%IV 754 6% 492 4% 584 4% 611 4% 600 4% 530 4% 3,571 4%V 554 5% 566 5% 49 4% 570 5% 479 4% 457 3% 2,675 4%VI 423 4% 532 5% 154 2% 366 3% 242 2% 178 1% 1,895 3%VII 789 9% 822 9% 565 6% 766 7% 581 5% 673 6% 4,196 7%VIII 470 7% 164 2% 169 2% 343 4% 237 3% 409 4% 1,792 4%IX 518 8% 169 2% 507 7% 388 5% 257 3% 691 8% 2,530 5%
After class X school leaver continue in class XI or in vocational training or join the labor market
Total in 9th FYP
Ave %
Dropouts Dropouts Dropouts Dropouts Dropouts Dropouts2005-2006 2006-2007
Class2007-20082002-2003 2003-2004 2004-2005
Table 4.7 shows the repetition rate for the last 6 years. Compared to 2003 the repetition rate has gone down significantly, although it has remained stable for the last 3 to 4 years.
26
Table 4.7 Repetition rate and numbers 2003-2008
# % # % # % # % # % # %PP 1,993 13% 1,761 11% 1,507 9% 1,257 8% 1131 7% 1,192 7% 9.2%I 1,896 13% 1,739 11% 1,359 9% 1,280 8% 1173 8% 1,113 7% 9.1%II 1,762 12% 1,526 11% 1,235 8% 1,236 8% 1299 8% 1,100 7% 9.0%III 1,378 11% 1,223 9% 924 7% 856 6% 961 7% 920 6% 7.5%IV 1,790 14% 1,726 13% 1,265 9% 1,255 9% 1208 8% 1,285 9% 10.5%V 1,223 12% 1,035 9% 679 6% 734 6% 665 5% 731 5% 7.2%VI 1,096 12% 805 8% 465 4% 389 4% 464 4% 442 4% 5.8%VII 1,189 13% 1,100 12% 828 8% 917 9% 873 8% 1,010 8% 9.8%VIII 304 4% 344 5% 318 4% 275 3% 457 5% 715 7% 4.7%IX 886 13% 867 12% 636 8% 516 7% 542 6% 606 7% 8.9%X 87 2% 80 2% 50 1% 28 0% 72 0% 90 1% 1.0%
2005-2006 2006-2007 2007-2008 Ave %RepeatersRepeatersRepeaters
Class
2002-2003 2003-2004 2004-2005Repeaters RepeatersRepeaters
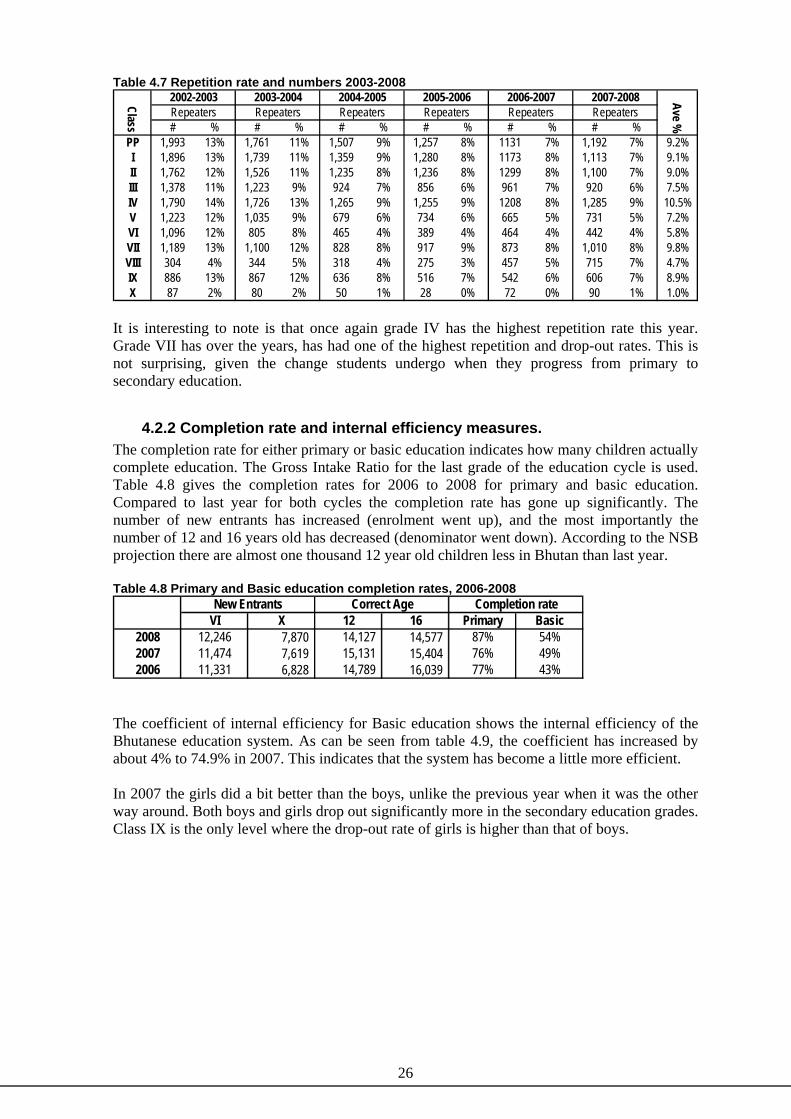
It is interesting to note is that once again grade IV has the highest repetition rate this year. Grade VII has over the years, has had one of the highest repetition and drop-out rates. This is not surprising, given the change students undergo when they progress from primary to secondary education.
4.2.2 Completion rate and internal efficiency measures. The completion rate for either primary or basic education indicates how many children actually complete education. The Gross Intake Ratio for the last grade of the education cycle is used. Table 4.8 gives the completion rates for 2006 to 2008 for primary and basic education. Compared to last year for both cycles the completion rate has gone up significantly. The number of new entrants has increased (enrolment went up), and the most importantly the number of 12 and 16 years old has decreased (denominator went down). According to the NSB projection there are almost one thousand 12 year old children less in Bhutan than last year. Table 4.8 Primary and Basic education completion rates, 2006-2008
VI X 12 16 Primary Basic2008 12,246 7,870 14,127 14,577 87% 54%2007 11,474 7,619 15,131 15,404 76% 49%2006 11,331 6,828 14,789 16,039 77% 43%
New Entrants Correct Age Completion rate
The coefficient of internal efficiency for Basic education shows the internal efficiency of the Bhutanese education system. As can be seen from table 4.9, the coefficient has increased by about 4% to 74.9% in 2007. This indicates that the system has become a little more efficient. In 2007 the girls did a bit better than the boys, unlike the previous year when it was the other way around. Both boys and girls drop out significantly more in the secondary education grades. Class IX is the only level where the drop-out rate of girls is higher than that of boys.

27
Table 4.9 Measures of Internal Efficiency 2007 (both sexes, boys, girls) PP 1 2 3 4 5 6 7 8 9 10 Graduates
Promotion rate 91.4% 91.6% 90.6% 92.2% 87.7% 91.0% 94.6% 85.8% 89.5% 86.3% 98.8%Repetition rate 7.3% 6.6% 7.1% 6.0% 8.6% 5.4% 3.7% 8.5% 7.0% 6.7% 1.2%Dropout rate 1.3% 1.8% 2.3% 1.8% 3.7% 3.5% 1.7% 5.7% 3.5% 7.0% 0.0%Adjusted promotion rate 91.4% 91.6% 90.6% 92.2% 87.7% 91.0% 94.6% 85.8% 89.5% 86.3% 98.8%Survivors to the Grade 1,000 986 967 942 924 887 854 839 786 757 701 670Average study time at Grade 1.1 1.1 1.1 1.1 1.1 1.1 1.0 1.1 1.1 1.1 1.0 11.7
14.7 74.9%
BoysPP 1 2 3 4 5 6 7 8 9 10 Graduates
Promotion rate 90.4% 89.9% 89.0% 89.4% 85.1% 89.0% 93.1% 85.8% 89.2% 88.4% 99.1%Repetition rate 7.7% 7.3% 8.0% 6.8% 9.7% 6.4% 4.2% 8.2% 6.5% 6.3% 0.9%Dropout rate 1.9% 2.8% 3.0% 3.7% 5.2% 4.7% 2.7% 6.0% 4.3% 5.3% 0.0%Adjusted promotion rate 90.4% 89.9% 89.0% 89.4% 85.1% 89.0% 93.1% 85.8% 89.2% 88.4% 99.1%Survivors to the Grade 1,000 979 950 919 882 831 790 767 717 684 645 618Average study time at Grade 1.1 1.1 1.1 1.1 1.1 1.1 1.0 1.1 1.1 1.1 1.0 11.8
15.2 72.2%
GirlsPP 1 2 3 4 5 6 7 8 9 10 Graduates
Promotion rate 92.5% 93.4% 92.3% 95.1% 90.3% 93.1% 96.2% 85.8% 89.8% 84.3% 98.6%Repetition rate 6.8% 5.9% 6.1% 5.1% 7.5% 4.5% 3.2% 8.7% 7.6% 7.1% 1.4%Dropout rate 0.7% 0.7% 1.6% -0.2% 2.1% 2.4% 0.7% 5.5% 2.6% 8.6% 0.0%Adjusted promotion rate 92.5% 93.4% 92.3% 94.9% 90.3% 93.1% 96.2% 85.8% 89.8% 84.3% 98.6%Survivors to the Grade 1,000 993 985 968 968 946 922 916 861 837 760 724Average study time at Grade 1.1 1.1 1.1 1.1 1.1 1.0 1.0 1.1 1.1 1.1 1.0 11.7
14.2 77.4%
Pupil-years invested per GraduateCoefficient of Internal Efficiency
Pupil-years invested per GraduateCoefficient of Internal Efficiency
Pupil-years invested per GraduateCoefficient of Internal Efficiency
Table 4.10 compares the indicator ‘survivors to the grade’ for the last 4 years. Since 2005 gender desegregated data is available. Unlike in 2006, the girls performed much better than the boys in 2007. On average 2005 was a weak year, and it is fair to say that for the last 4 years, 65 to 70 % of all the children starting PP will eventually graduate. Some more years of gender disaggregated data is required to analyze the gender differences. Since Bhutan has such a small education system individual incidences have a great impact, while quite often they are not indicators of a trend. Table 4.10 Survivors to the grade 2004-2007 (both sexes, boys, girls)
PP 1 2 3 4 5 6 7 8 9 10 GraduatesBoth SexesSurvivors to the grade 2007 1,000 986 967 942 924 887 854 839 786 757 701 670Survivors to the grade 2006 1,000 997 988 962 954 911 874 856 808 786 720 673Survivors to the grade 2005 1,000 1,000 980 947 932 886 844 815 750 720 682 631Survivors to the grade 2004 1,000 997 985 960 942 898 859 845 793 775 718 671
BoysSurvivors to the grade 2007 1,000 979 950 919 882 831 790 767 717 684 645 618Survivors to the grade 2006 1,000 1,000 988 959 948 894 844 815 781 762 713 682Survivors to the grade 2005 1,000 999 979 937 913 862 811 775 710 681 657 617
GirlsSurvivors to the grade 2007 1,000 993 985 968 968 946 922 916 861 837 760 724Survivors to the grade 2006 1,000 982 976 953 948 918 895 887 824 800 717 652Survivors to the grade 2005 1,000 1,000 980 957 950 911 877 857 793 763 707 643
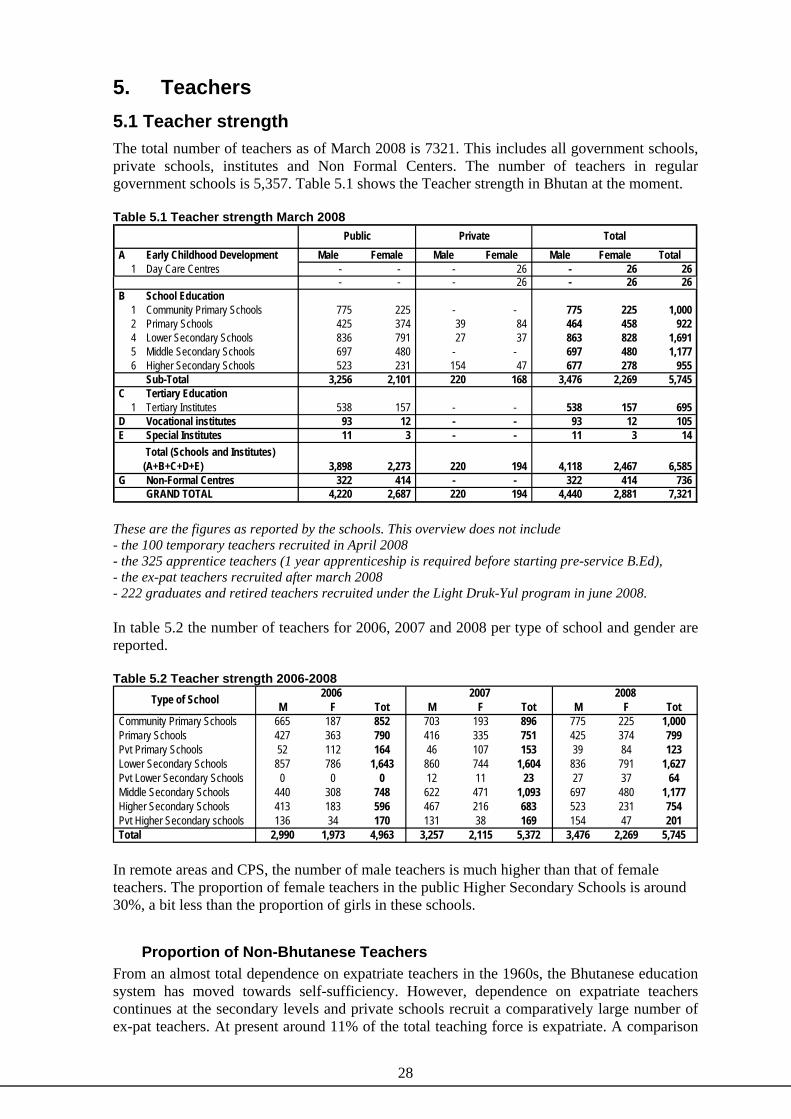
28
5. Teachers 5.1 Teacher strength The total number of teachers as of March 2008 is 7321. This includes all government schools, private schools, institutes and Non Formal Centers. The number of teachers in regular government schools is 5,357. Table 5.1 shows the Teacher strength in Bhutan at the moment. Table 5.1 Teacher strength March 2008
A Early Childhood Development Male Female Male Female Male Female Total1 Day Care Centres - - - 26 - 26 26
- - - 26 - 26 26 B School Education
1 Community Primary Schools 775 225 - - 775 225 1,000 2 Primary Schools 425 374 39 84 464 458 922 4 Lower Secondary Schools 836 791 27 37 863 828 1,691 5 Middle Secondary Schools 697 480 - - 697 480 1,177 6 Higher Secondary Schools 523 231 154 47 677 278 955
Sub-Total 3,256 2,101 220 168 3,476 2,269 5,745 C Tertiary Education
1 Tertiary Institutes 538 157 - - 538 157 695 D Vocational institutes 93 12 - - 93 12 105 E Special Institutes 11 3 - - 11 3 14
Total (Schools and Institutes) (A+B+C+D+E) 3,898 2,273 220 194 4,118 2,467 6,585
G Non-Formal Centres 322 414 - - 322 414 736 GRAND TOTAL 4,220 2,687 220 194 4,440 2,881 7,321
Public Private Total
These are the figures as reported by the schools. This overview does not include - the 100 temporary teachers recruited in April 2008 - the 325 apprentice teachers (1 year apprenticeship is required before starting pre-service B.Ed), - the ex-pat teachers recruited after march 2008 - 222 graduates and retired teachers recruited under the Light Druk-Yul program in june 2008. In table 5.2 the number of teachers for 2006, 2007 and 2008 per type of school and gender are reported. Table 5.2 Teacher strength 2006-2008
M F Tot M F Tot M F TotCommunity Primary Schools 665 187 852 703 193 896 775 225 1,000Primary Schools 427 363 790 416 335 751 425 374 799Pvt Primary Schools 52 112 164 46 107 153 39 84 123Lower Secondary Schools 857 786 1,643 860 744 1,604 836 791 1,627Pvt Lower Secondary Schools 0 0 0 12 11 23 27 37 64Middle Secondary Schools 440 308 748 622 471 1,093 697 480 1,177Higher Secondary Schools 413 183 596 467 216 683 523 231 754Pvt Higher Secondary schools 136 34 170 131 38 169 154 47 201Total 2,990 1,973 4,963 3,257 2,115 5,372 3,476 2,269 5,745
Type of School 2006 2007 2008
In remote areas and CPS, the number of male teachers is much higher than that of female teachers. The proportion of female teachers in the public Higher Secondary Schools is around 30%, a bit less than the proportion of girls in these schools.
Proportion of Non-Bhutanese Teachers From an almost total dependence on expatriate teachers in the 1960s, the Bhutanese education system has moved towards self-sufficiency. However, dependence on expatriate teachers continues at the secondary levels and private schools recruit a comparatively large number of ex-pat teachers. At present around 11% of the total teaching force is expatriate. A comparison

29
between 1997 and 2007 shows an impressively high increase in the proportion and absolute number of Bhutanese teachers over the years. Table 5.3 Proportion of Non-Bhutanese teachers 1997-2008
Bht N/Bt Tot. Bht N/Bt Tot. Bht N/Bt Tot. Bht N/Bt Tot.CPS 246 3 249 527 2 529 889 3 892 998 2 1,000PS 110 212 322 724 31 755 745 6 751 792 7 799LSS 368 105 473 948 205 1,153 1,501 103 1,604 1,537 90 1,627M & HSS 208 108 316 657 359 1,016 1,365 411 1,776 1,492 439 1,931Pvt. S 66 5 71 144 71 215 257 91 348 279 109 388NID 8 8 7 1 8 11 1 12 13 0 13
Total 1,006 433 1,439 3,007 669 3,676 4,757 614 5,371 5,111 647 5,758% 70% 30% 82% 18% 89% 11% 89% 11%
20081997 2002 2007
Referring back to table 2.16, approximately 11 percent of the teachers in the School system are expatriates, with the majority teaching in the higher secondary and middle secondary levels. At the higher secondary level, 32 percent of the teachers are expatriates and at the middle secondary level, 17 percent are expatriates. 28 percent of private school teachers are expatriates, with the majority being employed in the private higher secondary levels.
Similarly, approximately 11 percent of the lecturers in the institutes under the Royal University of Bhutan are expatriates, with the maximum in Sherubtse College, where 32 percent of the teaching staff are expatriates.
However, the vocational institutes under the Ministry of Labour and Human Resources (MoLHR), and the special institutes and day care centers under the Ministry of Education are fully staffed by Bhutanese nationals.
5.2 Teacher education Pre-service training
Pre-service teacher education is provided at the Colleges of Education (CoE) in Samtse and Paro, the former established in 1968 and the latter in 1975. There are two pre-service programs offered, a Bachelor of Education (B.Ed) and a Post Graduate Certificate in Education (PGCE). The four-year B.Ed. programme caters for both primary and secondary teaching and is provided in both the CoEs, whereas the one year PGCE programme caters for secondary teaching and is provided in the institute at Samtse only. Entry into the PGCE programme requires a 1st degree, while the B.Ed programme requires a class XII or equivalent certificate. Currently, the B.Ed degree includes 1 year of field attachment as apprentice teachers at the beginning of the programme. In 2008, 325 students were sent as apprentice teachers. From 2009 onwards the apprenticeship programme at the beginning will be discontinued and students will undergo the apprenticeship during the 3rd year of the programme. The B.Ed programme, which used to be only in English, has now been expanded to include Dzongkha.

30
Table 5.4 Teacher graduates from pre-service training 1996-2007 1996 1997 1998 1999 2000 2001 2002 2003 2004 2005 2006 2007 Total
PGCE 10 14 24 36 40 52 49 48 46 48 62 43 472B.Ed 35 17 41 29 17 63 101 136 177 371 429 377 1793PTC* 76 113 95 147 162 289 150 170 0 0 0 0 1202ZTC* 42 48 34 37 20 33 37 32 37 0 0 0 320
163 192 194 249 239 437 337 386 260 419 491 420 3787 The enrolment in the 2 teacher colleges has been around 1200 students for the last 5 years. The proportion of girls choosing to become teachers is hovering around 40%. This is not surprising given the lower proportion of girls enrolled in higher secondary schools. Considering the overall enrolment in the RUB-colleges, the proportion of girls studying in the teacher colleges is higher than the average. Table 5.5 Enrolment in the Colleges of Education 2003-2008
M F Total M F Total M F Total2003 224 120 344 337 319 656 561 439 1,000 44%2004 327 162 489 355 282 637 682 444 1,126 39%2005 321 166 487 462 317 779 783 483 1,266 38%2006 320 163 483 419 325 744 739 488 1,227 40%2007 359 187 546 428 275 703 787 462 1,249 37%2008 352 188 540 430 294 724 782 482 1,264 38%
128 68 196 93 -25 68 221 43 26457% 57% 57% 28% -8% 10% 39% 10% 26%
%F
Diff. Between 2008 & 2003
Year CoE, Samtse COE, Paro Grand Total
In-Service training Teachers are regularly updated on new developments in curriculum and other educational issues through in-service training and workshops organized at national, dzongkhag and school level as well as through fellowships outside the country. The table below shows the number of in-service workshops organized at the national level from 2002 - 2007. Table 5.6 In-service Workshops
Courses Participants2002 31 2,0332003 27 1,3582004 22 8512005 10 5602006 20 2,3452007 16 1,800Total 126 8,947
Year National Level
Since 1995, the Ministry has provided opportunities for in-service teachers to upgrade their qualifications by sitting for the national level examinations as private candidates. In December 2008, 447 will avail this opportunity. Table 5.7 Number of teachers who have upgraded their qualifications
Year ISE ILCS ICSE Total Remarks2003 103 14 2 119 Appeared for examination2004 91 10 1 102 Appeared for examination2005 190 54 1 225 Enrolled for examination2006 267 36 303 Enrolled for examination2007 203 40 1 244 Appeared for examination2008 330 116 1 447 Enrolled for examination
Since 2000, in-service teachers have had the opportunity to upgrade themselves to Bachelors of Education (B.Ed) in primary education via a distance education programme. In 2002, a Masters

31
of Education programme was also started at the Paro College of Education using the same mode. Table 5.8 shows the number of graduates so far. Table 5.8 Distance education 2003-2008
Year of graduation B.Ed (P) M.Ed2003 45 -2004 32 -2005 44 172006 44 172007 ( 2007-2008) 40 23Total 205 57 This programme is in great demand, especially after a first degree became an official requirement for advancing in one’s career. The Distance B.Ed is being facilitated from Samtse College of Education, and the Distance M.Ed from Paro College of Education. Teachers participating are offered classes during winter break and offered remote education during the academic year. In that sense, both programmes are mixed mode degrees rather than distance education.
5.3 Academic profile of teachers Out of a total of 5,7429 teachers, 91% are trained in the teaching profession. Around 84% of our teachers have at least a Class X certificate. In addition, about 16% of the teachers are Zhungkha Language Teachers (ZLTs). Less than 1% of the teachers do not have a class X certificate.
A comparatively low percentage of the teachers with a Masters and Bachelors Degree, most of whom are expatriate teachers, do not have a teaching certificate. Table 5.9 Number of trained teachers by degree, March 2008
# % # % # %Masters Degree 317 6% 119 2% 436 8%Bachelors Degree 2,326 41% 212 4% 2,538 44%Higher Secondary/�Matriculation 1,646 29% 190 3% 1,836 32%Under Matriculation 20 0% 10 0% 30 1%ZLTS 767 13% 135 2% 902 16%Total 5,076 88% 666 12% 5,742 100%
Trained as teacher Not trained as teacher Total TeachersAcademic degree
In table 5.10 it can be seen that most of the teachers with a master’s degree are expatriate teachers. An interesting detail is that there are 4 expatriate teachers with less than a class X certificate. Table 5.10 Teachers’ academic qualification by nationality & type of school, March 2008
Bht
Non-Bht
All
Bht
Non-Bht
All
Bht
% Bht
Non-Bht
% Non-Bht
All
Masters Degree 94 260 354 19 63 82 113 26% 323 74% 436Bachelors Degree 2144 260 2404 98 36 134 2242 88% 296 12% 2538Higher Secondary/Matriculation 1723 14 1737 89 10 99 1812 99% 24 1% 1836Under Matriculation 23 4 27 3 0 3 26 87% 4 13% 30ZLTS 832 0 832 70 0 70 902 100% 0 0% 902
Total 4816 538 5354 279 109 388 5095 89% 647 11% 5742
Public Private Total
Academic Qualification
9 This number does not include dance teachers.

32
6. Quality indicators Some of the major quality indicators that the Ministry of Education uses are the teacher-pupil ratio, or the number of teachers per school and the class size. This chapter focuses on these indicators.
6.1 Teacher-pupil ratio Table 6.1 gives the teacher-pupil ratio for different school levels by location. It shows that, on average, the highest ratios are found in the remote and very remote schools. The table includes private schools which are mainly in the urban category. It is interesting to note that the ratio in the CPSs is rather high, even though these schools are supposed to serve the scattered areas with smaller catchments. On the other hand, it is also known that it is quite difficult to deploy teachers to the more remote schools. Many of the CPSs are in remote areas. Nationwide, the teacher pupil ratio is now 28 students per teacher on average. This is a good ratio. Table 6.1 Teacher-pupil ratio in schools per location March 2007
Level of Schools Urban Semi-Urban Semi-Remote Remote Very Remote Difficult Total
Community primary 28 28 29 29 34 17 30Primary 28 28 27 29 34 0 29Lower Secondary 30 30 28 37 35 0 30Middle Seconday 25 30 31 37 0 0 27Higher Seconday 21 21 0 0 0 0 21Total 26 29 29 31 34 17 28 Table 6.2 gives the teacher-pupil ratio per type of school per dzongkhag. The ratio is highest in Dagana, followed by Samtse and Samdrupjonkhar. The low ratio in Gasa can be explained by the low enrolment there. Haa, Bumthang, Paro, Punakha and Trongsa also have low teacher pupil ratios. Table 6.2 Teacher-pupil ratio per dzongkhag per type of school March 2008
CPS PS LSS MSS HSS Ave Public Pvt. PS Pvt. LSS Pvt. HSS Total
Bhutan 30 29 30 27 21 28 15 14 23 28Bumthang 22 25 27 20 23 19 23Chukha 30 30 34 25 22 28 13 27 28Dagana 49 50 42 26 39 39Gasa 19 9 18 15 15Haa 21 21 23 23 22 22Lhuentse 27 34 24 27 20 27 27Mongar 32 37 33 27 22 30 30Paro 22 25 26 21 22 23 16 27 24Pemagatshel 26 23 33 28 25 29 29Punakha 20 24 26 24 17 22 22 23Samdrupjongkhar 42 40 40 28 37 8 34Samtse 47 42 30 41 17 37 37Sarpang 36 39 37 21 33 23 23 32Thimphu 19 27 26 21 20 23 14 15 24 22Trashigang 24 26 28 27 24 26 26Trashiyangtse 30 26 34 25 22 28 28Trongsa 24 24 21 23 23 23 23Tsirang 44 40 32 37 21 33 33Wangdue 26 27 31 22 17 26 26Zhemgang 28 26 30 22 28 27 27
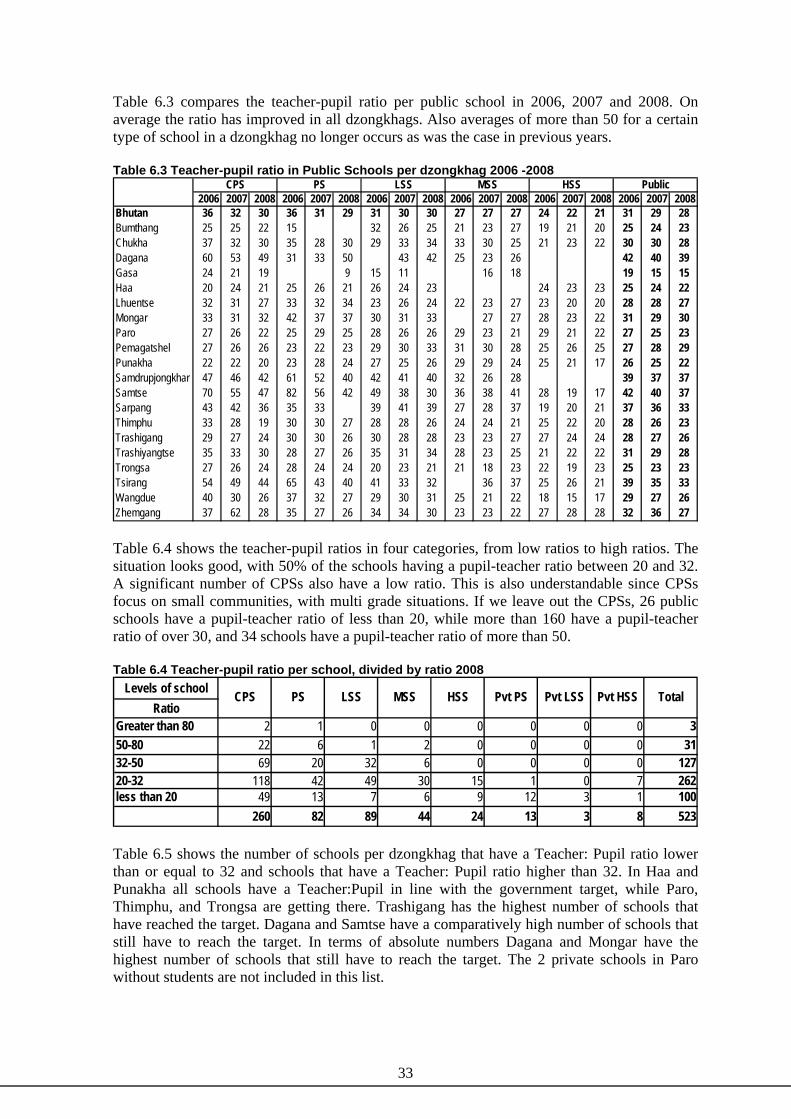
33
Table 6.3 compares the teacher-pupil ratio per public school in 2006, 2007 and 2008. On average the ratio has improved in all dzongkhags. Also averages of more than 50 for a certain type of school in a dzongkhag no longer occurs as was the case in previous years. Table 6.3 Teacher-pupil ratio in Public Schools per dzongkhag 2006 -2008
2006 2007 2008 2006 2007 2008 2006 2007 2008 2006 2007 2008 2006 2007 2008 2006 2007 2008Bhutan 36 32 30 36 31 29 31 30 30 27 27 27 24 22 21 31 29 28Bumthang 25 25 22 15 32 26 25 21 23 27 19 21 20 25 24 23Chukha 37 32 30 35 28 30 29 33 34 33 30 25 21 23 22 30 30 28Dagana 60 53 49 31 33 50 43 42 25 23 26 42 40 39Gasa 24 21 19 9 15 11 16 18 19 15 15Haa 20 24 21 25 26 21 26 24 23 24 23 23 25 24 22Lhuentse 32 31 27 33 32 34 23 26 24 22 23 27 23 20 20 28 28 27Mongar 33 31 32 42 37 37 30 31 33 27 27 28 23 22 31 29 30Paro 27 26 22 25 29 25 28 26 26 29 23 21 29 21 22 27 25 23Pemagatshel 27 26 26 23 22 23 29 30 33 31 30 28 25 26 25 27 28 29Punakha 22 22 20 23 28 24 27 25 26 29 29 24 25 21 17 26 25 22Samdrupjongkhar 47 46 42 61 52 40 42 41 40 32 26 28 39 37 37Samtse 70 55 47 82 56 42 49 38 30 36 38 41 28 19 17 42 40 37Sarpang 43 42 36 35 33 39 41 39 27 28 37 19 20 21 37 36 33Thimphu 33 28 19 30 30 27 28 28 26 24 24 21 25 22 20 28 26 23Trashigang 29 27 24 30 30 26 30 28 28 23 23 27 27 24 24 28 27 26Trashiyangtse 35 33 30 28 27 26 35 31 34 28 23 25 21 22 22 31 29 28Trongsa 27 26 24 28 24 24 20 23 21 21 18 23 22 19 23 25 23 23Tsirang 54 49 44 65 43 40 41 33 32 36 37 25 26 21 39 35 33Wangdue 40 30 26 37 32 27 29 30 31 25 21 22 18 15 17 29 27 26Zhemgang 37 62 28 35 27 26 34 34 30 23 23 22 27 28 28 32 36 27
LSS MSSCPS PS HSS Public
Table 6.4 shows the teacher-pupil ratios in four categories, from low ratios to high ratios. The situation looks good, with 50% of the schools having a pupil-teacher ratio between 20 and 32. A significant number of CPSs also have a low ratio. This is also understandable since CPSs focus on small communities, with multi grade situations. If we leave out the CPSs, 26 public schools have a pupil-teacher ratio of less than 20, while more than 160 have a pupil-teacher ratio of over 30, and 34 schools have a pupil-teacher ratio of more than 50. Table 6.4 Teacher-pupil ratio per school, divided by ratio 2008
Levels of schoolRatio
Greater than 80 2 1 0 0 0 0 0 0 350-80 22 6 1 2 0 0 0 0 3132-50 69 20 32 6 0 0 0 0 12720-32 118 42 49 30 15 1 0 7 262less than 20 49 13 7 6 9 12 3 1 100
260 82 89 44 24 13 3 8 523
TotalHSS Pvt PS Pvt LSS Pvt HSS CPS PS LSS MSS
Table 6.5 shows the number of schools per dzongkhag that have a Teacher: Pupil ratio lower than or equal to 32 and schools that have a Teacher: Pupil ratio higher than 32. In Haa and Punakha all schools have a Teacher:Pupil in line with the government target, while Paro, Thimphu, and Trongsa are getting there. Trashigang has the highest number of schools that have reached the target. Dagana and Samtse have a comparatively high number of schools that still have to reach the target. In terms of absolute numbers Dagana and Mongar have the highest number of schools that still have to reach the target. The 2 private schools in Paro without students are not included in this list.

34
Table 6.5 Target T:P ratio reached per dzongkhag, March 2008 Dzongkhag T:P < 32 T:P > 32 % T:P < 32Bhutan 362 159 69%Bumthang 17 2 89%Chhukha 24 13 65%Dagana 3 19 14%Gasa 3 1 75%Haa 10 0 100%Lhuentse 20 6 77%Mongar 29 20 59%Paro 19 2 90%Pema Gatshel 23 8 74%Punakha 21 0 100%Samdrupjongkhar 9 17 35%Samtse 3 14 18%Sarpang 7 10 41%Thimphu 38 1 97%Trashigang 52 9 85%Trashiyangtse 18 12 60%Trongsa 22 1 96%Tsirang 3 8 27%Wangduephodrang 18 9 67%Zhemgang 23 7 77% In March 2008, 23 schools reported they had only 1 teacher. Of these, 12 reported to have an enrolment of more than 25 students. The policy is to have a maximum of 25 students in a MG situation. 5 schools each with 1 teacher and an enrolment of more than 25 opened this year. Table 6.6 gives the changes in teacher-pupil ratio over the years. It shows a steady decline in the (community) primary and lower secondary schools, with the rate of decrease slowing down the last 3 to 4 years. The ratio in the middle & higher secondary schools has been stable over the last few years. Table 6.6 Teacher-Pupil ratio 1998-2008
Level 1999 2000 2001 2002 2003 2004 2005 2006 2007 2008Community Primary 50 47 43 40 38 35 34 28 32 30Primary 43 44 42 38 37 35 34 33 31 29Lower Secondary 41 39 40 36 34 33 33 31 30 30Middle & Higher Secondary 27 28 28 27 26 27 27 27 25 24Private 22 23 19 18 20 18 19 16 18 17
6.2 Class size Next to number of students per teacher another indicator that can be used is the number of students per class or student:section ratio. This assumes that every section in a school is a different class. Table 6.7 shows the class size per section per school. It shows that in urban and semi-urban areas the classes are crowded. It also shows that the classes in the Lower Secondary, Middle Secondary and Higher Secondary Schools are more crowded than in the Primary and Community Primary Schools. The CPSs have on average the smallest class sizes, and in these schools multi-grade is more common. The assumption in standard classroom construction is that the maximum number of students in a classroom is 40. Therefore on average our classes have less than 40 students, except in MSSs in remote areas. There are 3 MSSs in remote areas.

35
Table 6.7 Class size per location per school, March 2008 Category
levels of schoolsCPS 35 26 21 16 18 11 21PS 33 31 27 22 23 27
LSS 37 35 31 36 31 34MSS 36 38 39 43 39HSS 36 38 37
Average 36 34 29 29 24 11 27
Very-Remote Difficult AverageUrban Semi-Urban Semi-Remote Remote
Table 6.8 compares the class sizes in 2007 and 2008. The differences between the regions and school types are considerable. The dzongkhags with large class sizes last year have all improved a bit, despite increases in enrolment. With the exception of Samtse, the average class size in all dzongkhags is 40 or less. The average class size for Bhutan remains the same, indicating that the school system has been able to accommodate the increasing enrolment. Table 6.8 Class Size per school type per Dzongkhag 2007 and 2008
2007 2008 2007 2008 2007 2008 2007 2008 2007 2008 2007 2008 2007 2008 2007 2008 2007 2008Bhutan 20 19 29 29 37 35 38 37 36 36 17 19 19 22 32 36 30 30Bumthang 17 17 - 31 31 33 32 32 31 - - 24 32 25 24Chukha 20 21 28 31 37 39 41 38 39 42 23 - 25 33 38 33 34Dagana 37 35 33 32 40 44 34 36 - - - - 36 37Gasa 12 11 - 16 19 21 25 - - - - 16 17Haa 15 16 28 23 31 31 - 35 33 - - - 30 28Lhuentse 13 13 26 25 30 28 35 33 32 31 - - - 22 21Mongar 16 16 28 22 33 33 38 34 43 38 - - - 25 24Paro 12 13 32 31 38 36 36 35 38 38 11 19 - 38 44 34 34Pemagatsel 17 16 16 16 35 36 39 35 35 39 - - - 26 25Punakha 20 18 30 33 32 32 42 38 37 38 - - 30 33 31 31S/Jonkhar 27 23 23 40 41 36 39 39 - 11 15 - - 33 34Samtse 42 38 39 37 46 45 44 46 35 29 - - - 43 42Sarpang 36 35 41 44 43 43 39 33 35 20 27 - - 27 40 38Thimphu 20 21 38 37 39 38 34 33 37 36 19 18 19 22 36 37 34 33T/gang 14 15 30 25 33 33 39 37 40 39 - - - 25 25T/yangtse 16 16 19 18 33 26 33 33 38 37 - - - 24 22Tongsa 15 14 27 26 27 15 26 30 34 33 - - - 22 19Tsirang 39 37 40 46 44 45 42 39 39 31 - - - 41 40Wangdue 16 19 36 33 45 40 32 35 31 32 - - - 29 30Zhemgang 24 16 20 19 36 35 36 34 37 40 - - - 26 25
Pvt HSS Total MSS HSS Pvt Ps Pvt LSSDzongkhag
CPS PS LSS
Table 6.9 shows by dzongkhag how many schools have a class size that is smaller than or equal to 40, and how many schools have more than 40 per class. The 2 private schools in Paro without students are not included.
In most dzongkhags a majority of the schools have been able to keep the average class size under 40. The exception is Samtse, where the class rooms are overcrowded in about 60% of the schools.

36
Table 6.9 Class size Maximum per Dzongkhag, March 2008
Dzongkhag Class =< 40 Class > 40 % Class =< 40Bhutan 413 52 89%Bumthang 15 1 94%Chhukha 29 5 85%Dagana 12 7 63%Gasa 2 0 100%Haa 7 0 100%Lhuentse 23 0 100%Mongar 44 2 96%Paro 16 4 80%Pema Gatshel 27 1 96%Punakha 16 2 89%Samdrupjongkhar 19 4 83%Samtse 5 9 36%Sarpang 8 6 57%Thimphu 34 2 94%Trashigang 57 1 98%Trashiyangtse 27 0 100%Trongsa 20 0 100%Tsirang 5 3 63%Wangduephodrang 21 4 84%Zhemgang 26 1 96%
6.3 Combining teacher:pupil ratio and class size Pupil: Teacher ratio and class size are 2 indicators of the quality of education. If the classes are too crowded, quality teaching will not be possible, if the teachers have to teach too many students, quality will go down. Therefore targets are set to ensure that each school has at least 2 teachers, that the teacher-pupil ratio is 1:32 or less and that class sizes are no bigger than 40. In the last paragraph these indicators are combined to see how the schools are doing in Bhutan.
Table 6.10 shows the following indicators. The 1st column shows the number of schools where the number of sections is bigger than the number of teachers. This suggests a teacher shortage, however if the teacher pupil ratio is equal to or smaller than 25, multi-grade is possible. It is assumed that those schools do not have a teacher shortage. Therefore this column is split into schools that have a teacher pupil ratio higher than 25 (teacher shortage) and those with a T:P ratio equal to or less than 25 (Multi-grade is possible).
The 2nd column deals with schools where the number of teachers is more than or equal to the number of sections. At first sight they are fine. However, if schools have class-sizes bigger than 40, they actually should have more sections, since the classes are overcrowded. Therefore in the 2nd column schools with class sizes over 40 that do not have enough teachers to make extra sections are split from those which either have class sizes smaller than or equal to 40 or which have class sizes bigger than 40 and have extra teachers. This last group chooses not to make extra sections, maybe because they do not have enough class rooms.
Since in MSS and HSS schools it is not realistic to assume 1 teacher per section, this table only takes (Community) Primary and Lower Secondary schools into account. In the higher levels there are more teachers required than sections.

37
Table 6.10 (C)PS, LSS combine T:P and Class Size, March 2008
A) Pupil:Teacher ratio more then 25
B) Pupil:Teacher Ration equal to or less then 25
C) Class > 40, no extra available
D) Class =< 40, or Class > 40, extra teacher available
# %
Bhutan 148 102 4 158 260 63%Bumthang 1 7 0 6 13 93%Chhukha 9 8 1 10 18 64%Dagana 14 0 2 2 2 11%Gasa 0 1 0 1 2 100%Haa 1 1 0 5 6 86%Lhuentse 12 5 0 5 10 45%Mongar 26 7 0 10 17 40%Paro 1 4 0 11 15 94%Pema Gatshel 9 11 0 6 17 65%Punakha 0 4 0 11 15 100%Samdrupjongkhar 14 0 1 4 4 21%Samtse 5 0 0 4 4 44%Sarpang 2 0 0 9 9 82%Thimphu 1 2 0 25 27 96%Trashigang 15 21 0 18 39 72%Trashiyangtse 16 6 0 4 10 38%Trongsa 6 10 0 3 13 68%Tsirang 1 0 0 6 6 86%Wangduephodrang 6 5 0 11 16 73%Zhemgang 9 10 0 7 17 65%
Dzongkhag
Number of teachers less then number of sections
Number of teachers more then or equal to number of sections B+D
Analyzing the situation it seems that 60% of the (Community) Primary and Lower Secondary Schools in Bhutan do not have an acute shortage of teachers. They either have more teachers than sections or their enrolment is so small that Multi-Grade teaching is possible. The other schools do have a teacher shortage, with either classes that are too big or teachers teaching Multi-Grade to more than 25 students. During the academic year extra teachers will be sent to these schools, either temporary, expatriate or apprentice teachers. Thimphu is the only Dzongkhag with no teacher shortage. Dagana requires extra teachers in almost all its (C)PSs and LSSs. With regard to the situation in HSSs and MSSs schools table 6.11 gives an indication. It is observed that almost all of them have a Teacher Pupil ratio that is below the required norm. 60 of the 68 schools have a ratio below 32. Of the 8 schools that do not have sufficient teachers 5 are in Samtse. In these figures the 98 temporary teachers appointed in April 2008 have been taken into account. The class sizes in the MSS and HSS schools shows an almost equally impressive figure as the number of teachers. 55 schools are able to keep the average class size in their school below 40. This might of course have to do with the fact that in classes XI and XII, and especially in the Science stream, sections are not very big. They will have an influence on the average Class Size. All the schools in Thimphu have an average class size under 40, even though admission pressure is strong in Thimphu. The 2 Higher Secondary Schools in Chhukha have large classes; both have to, on average, allow more than 40 students in the classrooms. Schools in other dzongkhags also have to do this. In Samtse 5 of the 6 schools have to admit more students than the target in their classrooms. In almost all the MSSs and HSSs, the number of sections is smaller than the number of teachers, as it should be and even very populated schools have at least enough teachers to teach each section. For instance, the data on the teacher pupil ratio show that. Phuentsholing HSS has 21 sections and 37 teachers. Two schools how ever do not fulfill this requirement. Dorokha MSS and Phuntshothang MSS each have more sections than teachers, 17 teachers and 18 sections, and 19 teachers and 20 sections respectively. Both schools have crowded classrooms with an average class size of 50 students, and teacher:pupil ratios of over 50 students per teacher.

38
Table 6.11 : Teachers and Classrooms in Public HSS and MSS schools, March 2008
Number of schools
T:P ratio <= 32
T:P ratio > 32
Class <= 40 students
Class > 40 students
Class <= 40 students
Sections > Teachers
Bhutan 68 60 8 55 13 66 2Bumthang 3 3 0 3 0 3 0Chhukha 7 7 0 5 2 7 0Dagana 2 2 0 2 0 2 0Gasa 1 1 0 1 0 1 0Haa 1 1 0 1 0 1 0Lhuentse 2 2 0 2 0 2 0Mongar 4 4 0 3 1 4 0Paro 4 4 0 3 1 4 0Pema Gatshel 3 3 0 3 0 3 0Punakha 4 4 0 4 0 4 0Samdrupjongkhar 5 4 1 4 1 4 1Samtse 6 1 5 1 5 5 1Sarpang 4 3 1 3 1 4 0Thimphu 6 6 0 6 0 6 0Trashigang 5 5 0 4 1 5 0Trashiyangtse 2 2 0 2 0 2 0Trongsa 2 2 0 2 0 2 0Tsirang 2 1 1 2 0 2 0Wangduephodrang 3 3 0 2 1 3 0Zhemgang 2 2 0 2 0 2 0

39
7. EDUCATION FACILITIES To provide quality education it is important that facilities in the school are up to date. In this chapter the status of some of these facilities viz. water provision, electricity, telephone connection, laboratories, computers and classrooms, as reported by the schools is reflected. The chapter ends with an overview of the accessibility of the schools.
7.1 The Water Situation in Schools Based on the reports of the schools as to the number of tap stands in a school and the sufficiency of water supply, an analysis has been made of the water situation in our schools as shown by table 7.1. Table 7.1 Water situation in the schools, March 2008
Sufficient Water supply
Insufficient Water supply
Sufficient Water supply
Insufficient Water supply
Public, Day 4 25 226 130 10Public, Boarding 2 8 60 34Private 0 0 19 1 2Total 6 33 305 165 12
StatusNo Tapstand 1 or more Tapstands
No Information
60% of the schools reported to have sufficient water supply, the same percentage for boarding as for day schools. Around 42 boarding schools reported to have insufficient water supply, while 8 of these boarding schools have no tap stands for their students. When analyzing the water supply situation for day schools without tap stands, it was found that around half of them have a source or stream, especially the remote schools. In Table 7.2, a break-up of the remarks made by boarding and day schools with regard to water supply is presented. As shown earlier, around 60% of the boarding schools state they have sufficient water supply. Some of these still choose to make a remark with regard to their water supply, therefore only 46% is shown as having sufficient water supply. Most of the water problems in schools are to do with their source. Table 7.2 Remarks on water supply by status of schools, March 2008
scarccity of source
poor quality connectivity
insufficient maintenance cost
public disturbances
spring source
no water supply
temporary connection sufficient
Day 73 26 18 24 15 33 7 193
Boarder 27 8 5 6 3 5 1 48
Remarks Status of schools

40
The last table shows the average number of tap stands available for students by dzongkhag. Table 7.3 : Student-tapstand ratio by dzongkhag for schools with tapstands, March 2008
No of schools Student: Tapstand ratio
Bumthang 2 16 89Chukha 3 32 200Dagana 2 20 106Gasa 2 2 146Haa 2 8 374Lhuentse 1 25 72Mongar 2 47 52Paro 0 18 145Pema gatshel 1 30 70Punakha 3 17 116Samdrup Jongkhar 1 24 87Samtse 5 12 173Sarpang 1 14 167Thimphu 3 24 192Trashigang 5 56 59Trashiyangtse 0 30 58Trongsa 1 22 43Tsirang 1 10 70Wangdue 1 26 69Zhemgang 3 27 39
Dzongkhag No tapstandSchools with tapstands
7.2 Provision of classrooms, laboratories and computers in schools The number of classrooms available in a school is another facility that influences the quality of education. Some schools face shortage of classrooms and have to introduce shift system. Table 7.4 compares the number of classrooms with the number of sections. Comparing these two indicators shows the class room situation. The table has several columns. The first column shows the schools that reported to have more sections than classrooms. This does not automatically imply that there is a shortage of classrooms in this school, since in multi-grade situations several sections can share a classroom. Therefore schools where there are more sections than classrooms, are split into schools where multigrade teaching is possible and where it is not possible. Possible means that the Pupil:Teacher ratio is 25 or less, and that the school actually has enough classrooms to accommodate the children. The next columns show the number of schools per dzongkhag where the number of classrooms is the same as the number of sections and where the number of classrooms is more than the number of sections. Collecting information on classrooms was more difficult than collecting information on enrolment. A significant amount of schools did not give adequate information on their classrooms10. It is also unknown whether the classrooms reported in the statistics forms are permanent classrooms or temporary structures. Analysis of the information, as in table 7.4, indicates that most of the schools that gave information have enough classrooms.
10 This is mainly a short-coming of the data gathering technology used. Several schools ‘tick’ the box where the number of classrooms is asked.

41
Table 7.4 Classrooms per section, per dzongkhag, March 2008
MG not possible
MG possible
Bhutan 109 62 122 167 76% 31 63Bumthang 2 6 8 2 89% 27 1Chhukha 10 4 6 14 71% 37 3Dagana 5 0 6 11 77% 30 0Gasa 0 1 2 0 100% 19 1Haa 2 1 2 2 71% 22 3Lhuentse 8 5 8 3 67% 26 2Mongar 14 4 7 15 65% 26 9Paro 2 3 2 11 89% 34 5Pema Gatshel 6 7 8 9 80% 25 1Punakha 2 1 6 8 88% 28 4Samdrupjongkhar 7 0 8 11 73% 33 0Samtse 9 0 2 4 40% 45 2Sarpang 7 0 3 4 50% 45 3Thimphu 5 6 14 10 86% 47 4Trashigang 10 7 13 24 81% 23 7Trashiyangtse 9 4 7 7 67% 21 3Trongsa 3 3 3 7 81% 21 7Tsirang 4 0 2 3 56% 41 2Wangduephodrang 0 4 11 9 100% 29 3Zhemgang 4 6 4 13 85% 23 3
DzongkhagSections > classrooms No
information
Students per
classroom
% enough classrooms
Classrooms>Sections
Sections = classrooms
Laboratories in schools Another facility that is required in the schools are laboratories. Classes VII and VIII require a general science laboratory, while classes IX and above require separate laboratories for physics, chemistry, and biology. A computer laboratory is also required for class IX and above. Table 7.5 shows the current provision of laboratories in the schools. A word of caution is required with regard to data-collection. It is unclear what the using existing classrooms in the absence of dedicated laboratories, reported. The 3rd column refers to schools that have all 5 laboratories. In case a school has a General Science Laboratory and a Chemistry Laboratory, but does not have any other laboratories it is calculated under the 2nd column. 7.5 Laboratory by level of school, public schools, March 2008
No Laboratory General science laboratory
General science with other laboratories No information
CPS 245 15 0 1PS 65 16 0 0LSS 50 35 4 0MSS 5 12 27 0HSS 0 1 23 0 *Chemistry, Biology, Physics and computer laboratory From the above we can see that almost all the higher secondary schools have fully equipped general science laboratories as well as physics, chemistry, biology and computer laboratories. One school still has to construct 3 laboratories. Five Middle secondary schools do not have a laboratory at all as they have only recently been upgraded. The same is true for the lower secondary schools. Due to admission pressure so many schools were upgraded before putting in adequate facilities. This is one of the main challenges for the 10th FYP.

42
Computers in schools One of the goals of the 9th FYP was to equip all Higher and most of the Middle Secondary Schools with computers. IT literacy is seen as an invaluable asset for a future career. Therefore Computer Science and Computer Applications are offered, IT teachers continue to be trained, and schools are provided with computer laboratories and computer laboratory assistants, along with both hardware and software for IT education. Table 7.6 shows the results of this project. 7.6 Computers in the schools, March 2007
No. schools No. of computers
Average computer
per SchoolCPS 81 222 3 180 2PS 43 143 3 38 0LSS 70 279 4 19 2MSS 40 570 14 4 0HSS 24 565 24 0 0Total 258 1779 7 241 4PS 11 260 7 0 2LSS 3 42 22 0 0HSS 8 286 16 0 1Total 22 588 27 0 3
280 2367 34 241 7
With computerWithout
computerNo
information
PublicPrivate
Grand total
Level
All Higher Secondary Schools have computers, with an average of 24 per school. Of the 44 Middle Secondary Schools, 40 have computers, with an average of 14 computers per school. At the (C)PS and LSS level the number of computers is less. On average, the schools that have computers, have just a few and these are probably used by the office staff. Quite a surprising number of Community Primary Schools have computers, given the fact that a lot of them are in remote places, and some do not have access to electricity.
7.3 Electricity, telephone and internet connectivity The priority after the provision of basic facilities like water and classrooms is to ensure that schools have access to electricity, a working telephone-line and a working internet connection. This paragraph describes the current situation with regard to these facilities. For the schools at level VII and higher being connected is very important and computers and laboratories need electricity. Table 7.7: Electricity connectivity, per level, March 2008
Yes No % Yes No information Total
CPS 112 138 45% 11 261PS 51 29 64% 1 81LSS 62 20 76% 7 89MSS 36 6 86% 2 44HSS 23 1 96% 24Total 284 194 59% 21 499PS 9 100% 2 11LSS 3 100% 3HSS 8 100% 8Total 20 100% 2 22
LevelSchools with electricity connectivity
PublicPrivate

43
Almost 50% of the CPSs have electricity. While it is not clear whether the question of access to electricity may have been interpreted as including access to solar power, the data shows that a lot of areas in Bhutan are not yet electrified. Telephone access is another important facility which is necessary for ensuring communication between parents and the school, between the school and the dzongkhag and central administration etc. This can also benefit the larger community in case of remote schools. Table 7.8: Schools with working landline phone, per category, March 2008
Yes No % Yes No information Total
Urban 72 6 92% 5 83Semi-Urban 60 7 90% 2 69Semi-remote 90 29 76% 5 124Remote 60 63 49% 7 130Very remote 49 39 56% 2 90Difficult 2 1 67% 3Total 333 145 70% 21 499Urban 14 100% 5 19Semi-Urban 3 100% 3Total 17 100% 5 22
Private
CategoryWorking landline phone
Public
70% of the public schools in Bhutan report that they have a working landline phone. Even in the more remote areas around 50% of the schools can be contacted via the telephone. Internet facilities are now increasingly being introduced in our schools. Most schools with internet are connected via dial-up. However, this is not adequate for schools and a few Middle and Higher Secondary Schools are now moving from dial-up to lease-lines. Further IT facilities in schools are being enhanced with training of IT laboratory assistants in setting up and maintenance of Local Area Networks (LAN). Table 7.9: Internet connectivity per level, March 2008
Yes No % Yes No information Total
CPS 15 232 6% 14 261PS 11 70 14% 81LSS 30 52 37% 7 89MSS 22 21 51% 1 44HSS 19 5 79% 24Total 97 194 33% 22 499PS 7 100% 3 11LSS 2 100% 1 3HSS 7 100% 1 8Total 16 100% 5 22
LevelWorking Internet connection
PublicPrivate
In the following table the electricity, the telephone and the internet connection in percentages per dzongkhag are shown. This is to give an impression about the division of these services around the country. In Paro all schools have electricity. While in Haa 50% of the schools have internet connectivity, Gasa and Tsirang reported not having internet connectivity.
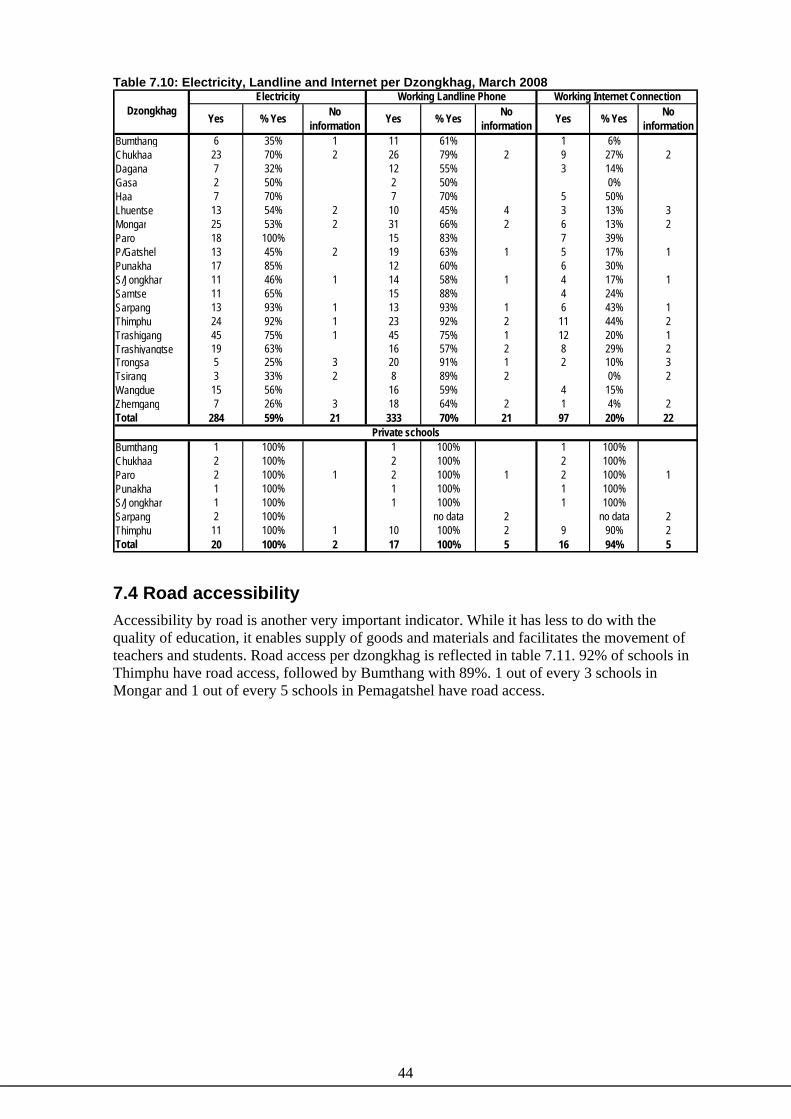
44
Table 7.10: Electricity, Landline and Internet per Dzongkhag, March 2008
Yes % Yes No information Yes % Yes No
information Yes % Yes No information
Bumthang 6 35% 1 11 61% 1 6%Chukhaa 23 70% 2 26 79% 2 9 27% 2Dagana 7 32% 12 55% 3 14%Gasa 2 50% 2 50% 0%Haa 7 70% 7 70% 5 50%Lhuentse 13 54% 2 10 45% 4 3 13% 3Mongar 25 53% 2 31 66% 2 6 13% 2Paro 18 100% 15 83% 7 39%P/Gatshel 13 45% 2 19 63% 1 5 17% 1Punakha 17 85% 12 60% 6 30%S/Jongkhar 11 46% 1 14 58% 1 4 17% 1Samtse 11 65% 15 88% 4 24%Sarpang 13 93% 1 13 93% 1 6 43% 1Thimphu 24 92% 1 23 92% 2 11 44% 2Trashigang 45 75% 1 45 75% 1 12 20% 1Trashiyangtse 19 63% 16 57% 2 8 29% 2Trongsa 5 25% 3 20 91% 1 2 10% 3Tsirang 3 33% 2 8 89% 2 0% 2Wangdue 15 56% 16 59% 4 15%Zhemgang 7 26% 3 18 64% 2 1 4% 2Total 284 59% 21 333 70% 21 97 20% 22
Bumthang 1 100% 1 100% 1 100%Chukhaa 2 100% 2 100% 2 100%Paro 2 100% 1 2 100% 1 2 100% 1Punakha 1 100% 1 100% 1 100%S/Jongkhar 1 100% 1 100% 1 100%Sarpang 2 100% no data 2 no data 2Thimphu 11 100% 1 10 100% 2 9 90% 2Total 20 100% 2 17 100% 5 16 94% 5
Private schools
DzongkhagElectricity Working Landline Phone Working Internet Connection
7.4 Road accessibility Accessibility by road is another very important indicator. While it has less to do with the quality of education, it enables supply of goods and materials and facilitates the movement of teachers and students. Road access per dzongkhag is reflected in table 7.11. 92% of schools in Thimphu have road access, followed by Bumthang with 89%. 1 out of every 3 schools in Mongar and 1 out of every 5 schools in Pemagatshel have road access.

45
7.11 Accessibility by road for public schools by Dzongkhag, March 2008
Yes No % No information
Total Public 251 241 51% 7Bumthang 16 2 89%Chukhaa 19 15 56% 1Dagana 12 10 55%Gasa 1 3 25%Haa 5 4 56% 1Lhuentse 9 17 35%Mongar 15 34 31%Paro 15 3 83%Pema Gatshel 7 23 23% 1Punakha 14 6 70%S/Jongkhar 10 15 40%Samtse 10 6 63% 1Sarpang 13 1 93% 1Thimphu 25 2 93%Trashigang 26 34 43% 1Trashiyangtse 10 19 34% 1Trongsa 13 10 57%Tsirang 4 7 36%Wangdue 18 9 67%Zhemgang 9 21 30%
Dzongkhag% Public schools with road access

46
8. Non Formal, Continuing and Special Education 8.1 Non Formal Education The joint efforts of the Dzongkha Development Authority (DDA) and the National Women’s Association of Bhutan (NWAB) gave birth to the Non-Formal Education (NFE) in 1992. The Ministry of Education formally took over NFE programme in 1994, now called the Non-Formal and Continuing Education Division (NFCED). There has been a tremendous growth in the number of NFE centers from 6 in 1992 with 300 learners to 747 centers with 13829 learners and 737 instructors in 2008. Learners can attend a basic literacy course followed by a post literacy course. There are fewer instructors than centers since courses in some centers are taught by regular teachers who are not reflected in this table. Table 8.1 gives the details per dzongkhag. It is interesting to note that participation of women in the NFE programme is high, both as instructors and learners. Participation in Samtse is the highest in absolute numbers while participation in Dagana is comparatively high. Table 8.1 NFE- centers, teachers, and learners (BLC, PLC) per Dzongkhag 2008
M F MF M F MF M F MF M F MFBhutan 747 322 414 736 3,071 6,799 9,870 1,111 2,848 3,959 4,182 9,647 13,829Bumthang 20 8 14 22 20 223 243 0 27 27 20 250 270Chukha 40 24 19 43 150 485 635 75 241 316 225 726 951Dagana 83 24 35 59 355 423 778 218 307 525 573 730 1,303Gasa 6 3 2 5 61 35 96 13 9 22 74 44 118Haa 13 2 9 11 23 77 100 29 51 80 52 128 180Lhuentse 32 18 16 34 90 231 321 34 70 104 124 301 425Mongar 79 34 42 76 277 681 958 77 231 308 354 912 1,266Paro 17 6 9 15 22 109 131 11 72 83 33 181 214Pemagatshel 39 21 19 40 85 356 441 28 229 257 113 585 698Punakha 26 11 19 30 98 229 327 20 52 72 118 281 399S/Jongkhar 35 21 13 34 154 274 428 51 219 270 205 493 698Samtse 59 24 40 64 599 900 1,499 94 210 304 693 1,110 1,803Sarpang 41 15 25 40 279 482 761 83 186 269 362 668 1,030Thimphu 38 20 38 58 34 555 589 9 124 133 43 679 722T/Gang 77 24 40 64 348 782 1,130 85 142 227 433 924 1,357T/Yangtse 22 10 11 21 59 165 224 32 104 136 91 269 360Trongsa 20 6 16 22 40 134 174 39 80 119 79 214 293Tsirang 35 16 15 31 253 291 544 27 47 74 280 338 618Wangdue 43 20 23 43 124 367 491 43 143 186 167 510 677Zhemgang 22 15 9 24 0 0 0 143 304 447 143 304 447
PLC Learners BLC+PLCDzongkhag Centres Instructors BLC learner
8.2 Continuing Education In 2006 the Ministry of Education started a pilot Continuing Education Programme at Kelki Private HSS, to offer adults who had to leave school before finishing their secondary education the opportunity to upgrade their qualifications. Presently the programme offers 2 year courses for completion of classes X and XII. Since most of the participants are in-service people, the classes are conducted in the evenings and on the weekends. In 2007 and 2008 the programme expanded to more schools in Paro and Chhukha. The programme has been found to be very popular, especially at classes XI and XII. This enrolment is not yet counted in the summary table since the CE programme is still in its pilot phase.

47
Table 8.2 Students and staff for Continuing Education Programme 2006 – 2008
Male Female Total Male Female Total Male Female TotalClass IX 24 12 36 7 20 27 14 17 31Class X 13 33 46 9 12 21 - - - Class XI 138 171 309 104 141 245 64 53 117Class XII 91 95 186 57 43 100 - - - Total 266 311 577 177 216 393 78 70 148
2006Class 2008 2007
8.3 Special Education The National Institute for the Disabled (NID) in Khaling caters to visually impaired children. As of 2008, there are 50 students and 13 teachers in the institute. Two other schools also cater to special needs education, contributing toward the ‘Education for All’ goals. Drukgyel LSS in Paro has a deaf education resource unit, while Changangkha LSS in Thimphu has facilities to teach both physically and mentally challenged children. These two schools are part of the RGoB’s effort to make schools as inclusive as possible and integrate special education into mainstream education. Table 8.3: Enrolment and Teaching Strength in NID 2002-2008
B G BG M F MF2008 30 20 50 13 0 132007 34 15 49 11 1 122006 23 18 41 11 1 122005 33 9 42 9 1 102004 27 11 38 9 1 102003 26 9 35 7 1 82002 28 9 37 7 1 8
Students Teachers
Enrolment figures in the NID show a slow increase over the years, especially compared to the spectacular enrolment increase in regular education. One of the challenges for the education sector is to ensure that all children with special needs receive suitable education so they can become full members of society.
8.4 Sanskrit Pathshalas There is presently 1 school in Sarpang catering to the study of Sanskrit for young children. There are 18 children in this school.

48
9. Tertiary, Vocational, International and Monastic Education 9.1 Tertiary education All publicly financed tertiary education in Bhutan is under the umbrella of the Royal University of Bhutan. At the moment 10 different institutes constitute the Royal University of Bhutan. For more specific details the RUB can be consulted. As can be seen girls’ enrolment in tertiary education is low compared to boys. Table 9.1 Staff and students in Royal University of Bhutan academic year 2007
B G BG Bht N/Bht Tot Bht N/Bht TotInstitutions:
1 College of Natural Resources, Lobesa 6 117 23 140 69 2 71 24 0 242 College of Science and Technology, Rinchhending 12 189 58 247 32 14 46 21 0 213 Institute of Language and Culture Studies, Semtokha 7 213 125 338 56 1 57 15 0 154 Jigme Namgyel Polytechnic, Dewathang 9 244 63 307 57 2 59 16 0 165 National Institute of Traditional Medicine, Thimphu 2 32 3 35 15 0 15 4 0 46 Paro College of Education, Paro 9 537 302 839 77 3 80 21 0 217 Royal Institute of Health Sciences, Thimphu 5 131 126 257 41 2 43 11 0 118 Royal Institute of Management, Semtokha 164 177 100 277 75 2 77 31 0 319 Samtse College of Education, Samtse 7 425 234 659 78 9 87 22 0 22
10 Sherubtse College, Kanglung 24 741 350 1091 88 42 130 32 0 32Total 245 2806 1384 4190 588 77 665 197 0 165
OthersNo. of courses
Students TeachersLevel of schoolsSl.
9.2 Vocational education Provision of vocational education is the responsibility of the Ministry of Labour and Human Resources. At the moment there are 7 Vocational Training institutes. Table 7.2 gives the details of the vocational institutes. For more specific details the Ministry of Labour and Human Resources can be contacted. Table 9.2 Staff and students in Vocational Training Institutes academic year 2007
Male Female Total male female Total Male female TotalPunakha Kuruthang VTI 118 50 168 11 4 15 9 5 14Wangdi Samthang VTI 88 9 97 12 0 12 7 1 8Bumthang Chumey VTI 136 91 227 10 3 13 1 0 1Trashigang RangjungVTI 121 53 174 15 1 16 10 1 11Sarpang ShershongVTI 79 56 135 8 1 9 7 0 7Trashiyangtse TIZC 61 42 103 12 2 14 6 0 6Thimphu NIZC 245 135 380 25 1 26 3 7 10
848 436 1284 93 12 105 43 14 57
Name of the institute
Total
Dzongkhag Students Teaching Non-Teaching
9.3 Students Abroad Primary and secondary education
A significant number of Bhutanese children are studying in primary and secondary schools abroad. Many Parents also send their children to schools in towns like Kalimpong, Darjeeling and Chennai in India. These children are funded privately.
Tertiary education Every year, the RGoB provides scholarships for class XII graduates to study various professions abroad. These slots are limited and merit based. Several other funding agencies like

49
the Government of India also provide undergraduate scholarships. Table 9.3 gives the number of undergraduate students with scholarships abroad. A significant number of students also study abroad through private funding. Table 9.4 gives the students studying privately in India and in other countries. The private student numbers are based upon the membership figures of the Bhutanese Student Associations in the different towns and countries. Table 9.3 Bhutanese Undergraduate students abroad with RGOB Scholarships, 2007
M F MF M F MF M F MF M F MF M F MF2008 34 8 42 27 7 34 4 1 5 5 3 8 70 19 892009 33 7 40 27 5 32 11 2 13 3 0 3 74 14 882010 9 2 11 54 9 63 7 2 9 2 0 2 72 13 852011 13 3 16 51 14 65 11 3 14 1 0 1 76 20 962012 1 0 1 23 6 29 14 2 16 2 3 5 40 11 512013 0 0 0 3 0 3 7 2 9 1 0 1 11 2 132014 0 0 0 0 0 0 14 0 14 0 0 0 14 0 14
Total 90 20 110 185 41 226 68 12 80 14 6 20 303 67 370
Other, (SDS, Thai Gov, etc.) TotalYear of
passing outIndia, RGOB India, GOI Other, RGOB
Table 9.4 Bhutanese privately funded Tertiary Education students abroad, 200711 Country Male Female TotalIndia 1148 1582 2730Thailand 7 9 16Nepal 1 0 1Phillipines 3 5 8USA 2 0 2United Kingdom 1 0 1Bangladesh 4 4 8Total 1166 1600 2766 The number of girls receiving scholarships is much lower than the number of boys. Interestingly the number of girls studying with private funds seems to be much higher than the number of boys. It remains one of the challenges to ensure that participation of girls stays at the same level as in Class X.
9.4 Monastic Education Monastic education is the oldest form of education in Bhutan. Today it continues to play an important role in the Bhutanese Education system. Most monastic schools are administered by the Central Monastic Body. For these schools enrolment data has been collected. Table 9.5 gives an overview of the enrolment in these schools. The Monastic body has reported that there are 7005 students in 388 monastic schools and 3 nunneries over Bhutan. This enrolment is significantly lower than the one reported for 2006, which was 9287. Information on those monasteries not administered by the central monastic body is not available in detail. The central monastic body has reported that in 2004, there were 5,149 learners enrolled in these monasteries. It is obvious that more boys than girls are enrolled in these schools.
11 The information on students abroad is not complete but based on BSA members.

50
Table 9.5 Enrolment in monastic schools administered by the central monastic body, 2007
DzongkhagMonastic schools Male Nunnery Female Total
Bhutan 388 6930 3 75 7005Chhukha 25 174 0 0 174Dagana 11 0 0 0 0Gasa 9 0 0 0 0Haa 18 0 0 0 0Lhuentse 10 281 0 0 281Mongar 27 0 0 0 0Paro 43 0 1 35 35Pemagatshel 5 125 1 25 150Punakha/Thimphu 71 2734 1 15 2749Samdrup Jongkhar 2 100 0 0 100Samtse 9 0 0 0 0Trashiyangtse 6 110 0 0 110Trashigang 30 359 0 0 359Trongsa/Bumthang 70 450 0 0 450Tsirang 5 110 0 0 110Wangdiphodrang 30 615 0 0 615Zhemgang 8 212 0 0 212Sarpang 9 146 0 0 146

51
10. Financing of Education 10.1. Free services and sharing of costs The Bhutanese education system is built upon the concept of free services from primary to tertiary level. Students are not only given free tuition but also provided with many facilities viz. stationary, textbooks, sports-items and boarding facilities and food based on need. The policy trend during the last few years is, however, to work towards cost-sharing with parents, especially amongst those populations that are in a position to do so. Accordingly students studying in the urban areas have had to buy their own stationeries since 1993. In general, all students are required to contribute to a School Development Fund at the following rates: − Community Primary and Primary Schools: Nu 30/- per student per annum − Lower Secondary Schools : Nu 100/- per student per annum − Middle and Higher Secondary Schools : Nu 200/- per student per annum
10.2. Annual budget The total budget provision for financial year 2006-2007 amounts to over Nu. 3500 million, with more than half the provision for the programmes administered by the dzongkhags. Table 10.1 Annual Budget Education Sector 2007 – 2008 (in Million Nu.) Sl No. Items Current Capital Total
1 National direction and educational services 293.49 851.98 1,145.472 NID, Khaling 4.40 0.38 4.793 Non Formal Education Centres* 0.00 0.00 0.004 Community Primary and Primary Schools 533.68 124.15 657.835 Lower, Middle & Higher Secondary Schools 970.35 347.90 1,318.256 School Procurement services 95.06 0.00 95.067 Dzongkha Development Services 11.94 1.22 13.168 Resource Centre Services 0.88 0.34 1.229 Gewog Education Services 0.05 22.85 22.90
Total 1,909.86 1,348.82 3,258.68
1 ILCS, Semtokha 17.14 12.41 29.562 Paro College of Education 37.46 54.48 91.943 Samtse College of Education 33.93 47.54 81.474 College of National Resource, Lobesa 21.31 13.41 34.725 College of Science & Technology, Rinchending 24.26 16.75 41.016 Jigme Namgyel Polytechnic, Dewathang 18.19 11.32 29.517 Sherubtse College, Kanglung 62.73 44.00 106.73
Total 215.03 199.91 414.94
1 Institute for Zorig Chusum, Tashiyangtse 7.05 0.70 7.752 National Institute for Zorig Chusum, Thimphu 20.00 3.72 23.723 Vocational Training Institute- Khuruthang 9.62 0.80 10.424 Vocational Training Institute- Samthang 10.15 0.69 10.845 Vocational Training Institute- Sarpang 6.92 3.28 10.206 Vocational Training Institute- Chumey 11.16 1.75 12.917 Vocational Training Institute- Rangjung 8.98 1.14 10.128 Construction Training Center, Thimphu 9.65 10.05 19.70
Total 83.52 22.12 105.65
Institutes & Colleges under RUB
*Budget for NFEC clubbed under Primary Education Services
Institutes under the MOLHR

52
Table 10.2 Education revised budget and expenditure (FY 06-07) by Dzongkhag (Nu. in Million
Cur. Cap. Tot. Cur. Cap. Tot. Cur. Cap. Tot. Cur. Cap. Tot. Cur. Cap. Tot. Cur. Cap. Tot. Cur. Cap. Tot.Bud. 14.95 6.13 21.07 26.05 8.49 34.54 0.21 0.05 0.26 5.80 - 5.80 1.02 - 1.02 0.04 0.50 0.54 48.06 15.16 63.22 Expe. 14.63 5.08 19.71 24.53 6.40 30.93 0.12 0.05 0.17 5.80 - 5.80 0.84 - 0.84 0.01 0.50 0.51 45.93 12.03 57.96 % 98% 83% 94% 94% 75% 90% 57% 92% 64% 100% 100% 83% 83% 28% 100% 94% 96% 79% 92%Bud. 23.36 6.92 30.28 94.98 28.59 123.57 0.13 0.06 0.19 7.14 - 7.14 1.45 - 1.45 0.05 0.50 0.55 127.11 36.06 163.18 Expe. 23.34 3.75 27.09 93.87 20.71 114.57 0.12 0.03 0.15 7.14 - 7.14 1.45 - 1.45 0.03 - 0.03 125.95 24.48 150.44 % 100% 54% 89% 99% 72% 93% 98% 52% 83% 100% 100% 100% 100% 58% 0% 5% 99% 68% 92%Bud. 16.49 6.46 22.95 14.62 1.62 16.24 0.15 - 0.15 2.93 - 2.93 1.71 - 1.71 0.10 - 0.10 36.00 8.09 44.09 Expe. 16.46 5.14 21.61 14.42 1.62 16.04 0.10 - 0.10 2.93 - 2.93 1.71 - 1.71 0.02 - 0.02 35.65 6.76 42.41
% 100% 80% 94% 99% 100% 99% 66% 66% 100% 100% 100% 100% 22% 22% 99% 84% 96%Bud. 5.90 0.84 6.74 6.46 43.11 49.58 - - - 1.63 - 1.63 - - - 0.05 0.50 0.55 14.04 44.45 58.49 Expe. 4.90 0.58 5.49 4.71 31.46 36.16 - - - 0.91 - 0.91 - - - 0.01 0.24 0.24 10.53 32.27 42.80
% 83% 69% 81% 73% 73% 73% 56% 56% 14% 47% 44% 75% 73% 73%Bud. 8.28 2.84 11.12 26.00 5.01 31.01 0.11 0.05 0.16 2.20 - 2.20 0.87 - 0.87 - - - 37.46 7.90 45.36 Expe. 7.75 2.65 10.40 24.03 3.20 27.23 0.11 0.04 0.15 2.20 - 2.20 0.51 - 0.51 - - - 34.60 5.89 40.49
% 94% 93% 94% 92% 64% 88% 99% 88% 96% 100% 100% 58% 58% 92% 75% 89%Bud. 19.03 10.39 29.42 18.57 4.51 23.08 0.12 0.05 0.17 7.10 - 7.10 2.19 - 2.19 0.05 - 0.05 47.05 14.95 62.00 Expe. 18.63 9.80 28.43 18.36 2.08 20.44 0.12 0.05 0.17 7.10 - 7.10 1.34 - 1.34 - - - 45.55 11.93 57.48 % 98% 94% 97% 99% 46% 89% 100% 100% 100% 100% 100% 61% 61% 0% 0% 97% 80% 93%Bud. 32.99 14.52 47.50 48.38 8.38 56.76 0.19 0.08 0.27 8.55 - 8.55 2.86 - 2.86 0.05 - 0.05 93.01 22.97 115.98 Expe. 32.60 9.74 42.34 47.35 6.54 53.89 0.19 0.08 0.27 8.55 - 8.55 2.86 - 2.86 0.05 - 0.05 91.58 16.36 107.94 % 99% 67% 89% 98% 78% 95% 97% 100% 98% 100% 100% 100% 100% 100% 100% 98% 71% 93%Bud. 13.07 1.45 14.53 66.02 28.68 94.69 0.18 0.05 0.23 5.68 - 5.68 1.25 - 1.25 0.05 - 0.05 86.25 30.18 116.42 Expe. 12.95 1.45 14.40 64.68 24.21 88.89 0.18 0.05 0.22 4.62 - 4.62 0.91 - 0.91 - - - 83.33 25.71 109.04 % 99% 100% 99% 98% 84% 94% 97% 98% 97% 81% 81% 73% 73% 0% 0% 97% 85% 94%Bud. 18.26 4.87 23.12 44.29 18.92 63.21 0.18 0.06 0.24 3.20 - 3.20 1.24 - 1.24 0.04 0.02 0.06 67.21 23.86 91.07 Expe. 17.73 3.53 21.25 42.48 14.01 56.49 0.17 - 0.17 3.20 - 3.20 1.24 - 1.24 0.01 - 0.01 64.83 17.54 82.37 % 97% 72% 92% 96% 74% 89% 94% 0% 70% 100% 100% 100% 100% 25% 0% 18% 96% 73% 90%Bud. 12.92 3.63 16.54 34.62 88.25 122.87 0.16 0.06 0.22 4.20 - 4.20 - - - 0.05 - 0.05 51.94 91.94 143.88 Expe. 12.91 3.32 16.23 34.50 46.69 81.19 0.16 0.06 0.22 4.20 - 4.20 - - - 0.05 - 0.05 51.82 50.08 101.89 % 100% 92% 98% 100% 53% 66% 100% 100% 100% 100% 100% 100% 100% 100% 54% 71%
Sl.No
Primary Secondary ZDS SPS NFE RCS TOTAL
1 Bumthang
2 Chukha
3 Dagana
4 Gasa
5 Haa
6 Lhuntshe
7 Mongar
8 Paro
9 P/Gatshel
10 Punakha
Dzongkhag
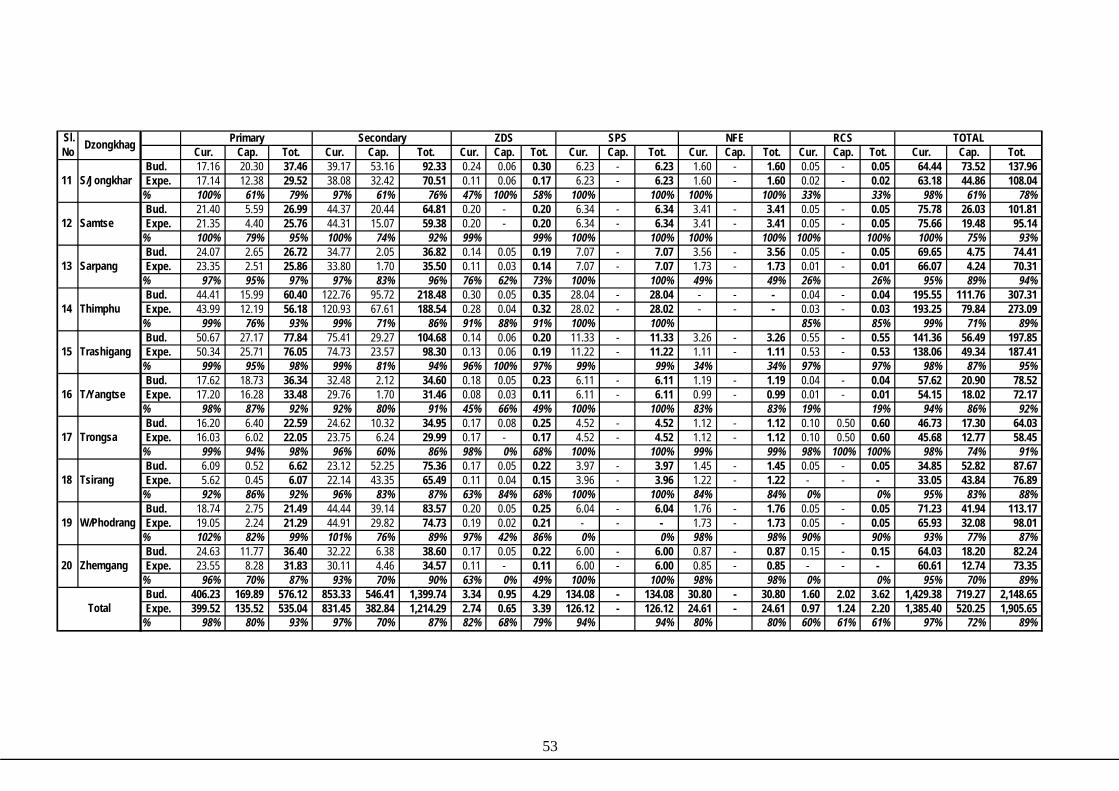
53
Cur. Cap. Tot. Cur. Cap. Tot. Cur. Cap. Tot. Cur. Cap. Tot. Cur. Cap. Tot. Cur. Cap. Tot. Cur. Cap. Tot.Bud. 17.16 20.30 37.46 39.17 53.16 92.33 0.24 0.06 0.30 6.23 - 6.23 1.60 - 1.60 0.05 - 0.05 64.44 73.52 137.96 Expe. 17.14 12.38 29.52 38.08 32.42 70.51 0.11 0.06 0.17 6.23 - 6.23 1.60 - 1.60 0.02 - 0.02 63.18 44.86 108.04 % 100% 61% 79% 97% 61% 76% 47% 100% 58% 100% 100% 100% 100% 33% 33% 98% 61% 78%Bud. 21.40 5.59 26.99 44.37 20.44 64.81 0.20 - 0.20 6.34 - 6.34 3.41 - 3.41 0.05 - 0.05 75.78 26.03 101.81 Expe. 21.35 4.40 25.76 44.31 15.07 59.38 0.20 - 0.20 6.34 - 6.34 3.41 - 3.41 0.05 - 0.05 75.66 19.48 95.14 % 100% 79% 95% 100% 74% 92% 99% 99% 100% 100% 100% 100% 100% 100% 100% 75% 93%Bud. 24.07 2.65 26.72 34.77 2.05 36.82 0.14 0.05 0.19 7.07 - 7.07 3.56 - 3.56 0.05 - 0.05 69.65 4.75 74.41 Expe. 23.35 2.51 25.86 33.80 1.70 35.50 0.11 0.03 0.14 7.07 - 7.07 1.73 - 1.73 0.01 - 0.01 66.07 4.24 70.31 % 97% 95% 97% 97% 83% 96% 76% 62% 73% 100% 100% 49% 49% 26% 26% 95% 89% 94%Bud. 44.41 15.99 60.40 122.76 95.72 218.48 0.30 0.05 0.35 28.04 - 28.04 - - - 0.04 - 0.04 195.55 111.76 307.31 Expe. 43.99 12.19 56.18 120.93 67.61 188.54 0.28 0.04 0.32 28.02 - 28.02 - - - 0.03 - 0.03 193.25 79.84 273.09 % 99% 76% 93% 99% 71% 86% 91% 88% 91% 100% 100% 85% 85% 99% 71% 89%Bud. 50.67 27.17 77.84 75.41 29.27 104.68 0.14 0.06 0.20 11.33 - 11.33 3.26 - 3.26 0.55 - 0.55 141.36 56.49 197.85 Expe. 50.34 25.71 76.05 74.73 23.57 98.30 0.13 0.06 0.19 11.22 - 11.22 1.11 - 1.11 0.53 - 0.53 138.06 49.34 187.41 % 99% 95% 98% 99% 81% 94% 96% 100% 97% 99% 99% 34% 34% 97% 97% 98% 87% 95%Bud. 17.62 18.73 36.34 32.48 2.12 34.60 0.18 0.05 0.23 6.11 - 6.11 1.19 - 1.19 0.04 - 0.04 57.62 20.90 78.52 Expe. 17.20 16.28 33.48 29.76 1.70 31.46 0.08 0.03 0.11 6.11 - 6.11 0.99 - 0.99 0.01 - 0.01 54.15 18.02 72.17 % 98% 87% 92% 92% 80% 91% 45% 66% 49% 100% 100% 83% 83% 19% 19% 94% 86% 92%Bud. 16.20 6.40 22.59 24.62 10.32 34.95 0.17 0.08 0.25 4.52 - 4.52 1.12 - 1.12 0.10 0.50 0.60 46.73 17.30 64.03 Expe. 16.03 6.02 22.05 23.75 6.24 29.99 0.17 - 0.17 4.52 - 4.52 1.12 - 1.12 0.10 0.50 0.60 45.68 12.77 58.45 % 99% 94% 98% 96% 60% 86% 98% 0% 68% 100% 100% 99% 99% 98% 100% 100% 98% 74% 91%Bud. 6.09 0.52 6.62 23.12 52.25 75.36 0.17 0.05 0.22 3.97 - 3.97 1.45 - 1.45 0.05 - 0.05 34.85 52.82 87.67 Expe. 5.62 0.45 6.07 22.14 43.35 65.49 0.11 0.04 0.15 3.96 - 3.96 1.22 - 1.22 - - - 33.05 43.84 76.89
% 92% 86% 92% 96% 83% 87% 63% 84% 68% 100% 100% 84% 84% 0% 0% 95% 83% 88%Bud. 18.74 2.75 21.49 44.44 39.14 83.57 0.20 0.05 0.25 6.04 - 6.04 1.76 - 1.76 0.05 - 0.05 71.23 41.94 113.17 Expe. 19.05 2.24 21.29 44.91 29.82 74.73 0.19 0.02 0.21 - - - 1.73 - 1.73 0.05 - 0.05 65.93 32.08 98.01 % 102% 82% 99% 101% 76% 89% 97% 42% 86% 0% 0% 98% 98% 90% 90% 93% 77% 87%Bud. 24.63 11.77 36.40 32.22 6.38 38.60 0.17 0.05 0.22 6.00 - 6.00 0.87 - 0.87 0.15 - 0.15 64.03 18.20 82.24 Expe. 23.55 8.28 31.83 30.11 4.46 34.57 0.11 - 0.11 6.00 - 6.00 0.85 - 0.85 - - - 60.61 12.74 73.35 % 96% 70% 87% 93% 70% 90% 63% 0% 49% 100% 100% 98% 98% 0% 0% 95% 70% 89%Bud. 406.23 169.89 576.12 853.33 546.41 1,399.74 3.34 0.95 4.29 134.08 - 134.08 30.80 - 30.80 1.60 2.02 3.62 1,429.38 719.27 2,148.65 Expe. 399.52 135.52 535.04 831.45 382.84 1,214.29 2.74 0.65 3.39 126.12 - 126.12 24.61 - 24.61 0.97 1.24 2.20 1,385.40 520.25 1,905.65 % 98% 80% 93% 97% 70% 87% 82% 68% 79% 94% 94% 80% 80% 60% 61% 61% 97% 72% 89%
14 Thimphu
11 S/Jongkhar
12 Samtse
20 Zhemgang
17 Trongsa
18 Tsirang
SPS NFE
19 W/Phodrang
15 Trashigang
16 T/Yangtse
13 Sarpang
RCS TOTAL
Total
Sl.No Dzongkhag Primary Secondary ZDS

54
Table 10.2b Top 5 Utilizers of Budget Table 10.2c Top underutilizer of Budget
Cur. Cap. Tot.93.01 22.97 115.98 91.58 16.36 107.94 98% 71% 93%
51.94 91.94 143.88 51.82 50.08 101.89 100% 54% 71%64.44 73.52 137.96 63.18 44.86 108.04 98% 61% 78%
195.55 111.76 307.31 193.25 79.84 273.09
99% 71% 89%64.03 18.20 82.24 60.61 12.74 73.35 95% 70% 89%
5 Zhemgang
3 S/Jongkhar
4 Thimphu
1 Mongar
2 Punakha
Sl.No Dzongkhag TOTAL
Cur. Cap. Tot.36.00 8.09 44.09 35.65 6.76 42.41 99% 84% 96%
86.25 30.18 116.42 83.33 25.71 109.04 97% 85% 94%
69.65 4.75 74.41 66.07 4.24 70.31 95% 89% 94%
141.36 56.49 197.85 138.06 49.34 187.41
98% 87% 95%57.62 20.90 78.52 54.15 18.02 72.17 94% 86% 92%
5 T/Yangtse
3 Sarpang
4 Trashigang
1 Dagana
2 Paro
Sl.No Dzongkhag TOTAL

55
10.3. Per head costs The estimated per head cost by school levels as given in table 8.3. Table 10.3 Estimated cost per student, May 2007
Schools & Institute under the Ministry of Education Cost per student per annum (in Nu)
Primary Schools 8,623 a) Day Scholars 8,305 b) Boarders 12,929 Lower Secondary Schools 11,768 a) Day Scholars 10,410 b) Boarders 14,947 Middle Secondary Schools 13,970 a) Day Scholars 11,910 b) Boarders 16,447 Higher Secondary Schools 16,566 a) Day Scholars 15,120 b) Boarders 19,657 National institute for the Disabled 104,356
InstituteS & Colleges under Royal University of Bhutan 61261ILCS, Semtokha 41,416 Paro College of Education, Paro 51,059 Samtse College of Education, Samtse 58,764 College of Natural Resources, Lobesa 140,021 College of Science & Technology, Rinchhending 68,082 Jigme Namgyel Polytechnic, Dewathang 61,188 Sherubtse College, Kanglung 54,735 Jigme Singye Wangchuck College of Business Studies no students in 2006
Institutes under the MoLHR 92,858 Institute for Zorig Chusum, Tashiyangtse 100,036 National Institute for Zorig Chusum, Thimphu 147,006 Vocational Training Institute- Khuruthang 76,150 Vocational Training Institute- Samthang 72,970 Vocational Training Institute- Rangjung 90,124 Construction Training Center, Thimphu 69,958 Vocational Training Institute- Sarpang no students in 2006Vocational Training Institute- Chumey no students in 2006*This is based on 2006-07 expenditures

56
Annexures
Annex 1. New and Upgraded schools in Bhutan in 2007 Schools Established in 2008 SL.No Dzongkhag School/location Level Remarks
1 Chukha 1 Kesari CPS Dayschool2 Dagana 2 Gumla CPS Dayschool3 Lhuentse 3 Baptong CPS Dayschool4 Punakha 4 Tashidingkha MSS Boarding
5 Broksar CPS Dayschool6 Kalapang CPS Dayschool7 Wangphu CPS Dayschool8 Orong MSS Boarding9 Garpawoong MSS Dayschool
10 S/Jongkhar PS Dayschool11 Babesa MSS Dayschool12 Olakha LSS Dayschool
8 Trashigang 13 Ritsangdung CPS Dayschool14 Langmadung CPS Dayschool15 Manan CPS Dayschool
10 Trongsa 16 Kartegang CPS Dayschool17 Samtengang PS Dayschool18 Rinchengang CPS Dayschool19 Migtana CPS Dayschool20 Repati CPS Dayschool21 Kikhar CPS Dayschool
Thimphu7
5 Mongar
S/Jongkhar6
9 Trashiyangtse
Zhemgang12
Wangdue11
Schools Upgraded in 2008 Sl. Dzongkhag School/location From To
1 Martshala LSS MSS2 Phuntshothang LSS MSS3 Pemathang PS LSS
2 Zhemgang 4 Gomphu PS LSS5 Sarpang MSS HSS6 Pelrithang LSS MSS7 Norbuling LSS MSS8 Sarpang PS LSS9 Jigmeling CPS LSS
4 Samtse 10 Dorokha LSS MSS11 Kangpara PS LSS12 Tashitse MSS HSS14 Kengkhar PS LSS15 Chali PS LSS16 Serzhong CPS LSS
7 Bumthang 17 Ura LSS MSS
Sl. Dzongkhag School/location From To1 Sarpang 1 Kuendrup PS HSS2 Chhukha 2 Phaojoding PS LSS3 Thimphu 3 Dr Tobgyel PS LSS
Sarpang3
S/Jongkhar1
Private schools
6 Mongar
5 Trashigang

57
Annex 2. Comparative enrolment Comparative Enrolment in Different Levels of Schools 07-08
2007 2008 +or- %* 2007 2008 +or- %* 2007 2008 +or- %* 2007 2008 +or- %* 2007 2008 +or- %* 2007 2008 +or- %*PP 887 946 59 6.7% 5,414 5111 (303) -5.6% 3,427 3339 (88) -2.6% 6,664 7019 355 5.3% 16,392 16415 23 0.1%I 450 488 38 8.4% 5,362 5130 (232) -4.3% 3,684 3366 (318) -8.6% 7,369 7115 (254) -3.4% 16,865 16099 (766) -4.5%II 371 399 28 7.5% 4,532 5152 620 13.7% 3,411 3498 87 2.6% 7,223 7497 274 3.8% 15,537 16546 1,009 6.5%III 224 286 62 27.7% 4,212 4180 (32) -0.8% 3,564 3279 (285) -8.0% 7,386 7249 (137) -1.9% 15,386 14994 (392) -2.5%IV 188 205 17 9.0% 3,966 4035 69 1.7% 3,606 3438 (168) -4.7% 7,139 7789 650 9.1% 14,899 15467 568 3.8%V 172 171 (1) -0.6% 3,159 3323 164 5.2% 3,093 3163 70 2.3% 7,026 7136 110 1.6% 13,450 13793 343 2.6%VI 102 155 53 52.0% 2,308 2771 463 20.1% 2,800 2730 (70) -2.5% 6,728 7029 301 4.5% 11,938 12685 747 6.3%
Sub-Total 2,394 2,650 256 10.7% 28,953 29,702 749 2.6% 23,585 22,813 (772) -3.3% 49,535 50,834 1,299 2.6% - - - - 104,467 105,999 1,532 1.5%VII 31 52 21 67.7% 11,308 11669 361 3.2% 548 584 36 6.6% 11,887 12305 418 3.5%VIII - 29 29 9,530 9843 313 3.3% 687 1047 360 52.4% 10,217 10919 702 6.9%
Sub-Total 31 81 50 20,838 21512 674 3.2% 1,235 1,631 396 32.1% 22,104 23,224 1,120 5.1%IX 15 19 4 26.7% 4,740 5125 385 8.1% 4,361 4612 251 5.8% 9,116 9756 640 7.0%X 57 29 (28) -49.1% 3,432 3527 95 2.8% 4,202 4405 203 4.8% 7,691 7961 270 3.5%
Sub-Total 72 48 (24) -33.3% - - - - - - - 8,172 8,652 480 5.9% 8,563 9,017 454 5.3% 16,807 17,717 910 5.4%XI 1,914 2541 627 32.8% 2,667 2885 218 8.2% 4,581 5426 845 18.4%XII 1,737 2109 372 21.4% 2,498 2622 124 5.0% 4,235 4731 496 11.7%
Sub-Total 3,651 4,650 999 27.4% - - - - - - - - - - 5,165 5,507 342 6.6% 8,816 10,157 1,341 15.2%Total 6,148 7,429 1,281 20.8% 28,953 29,702 749 2.6% 23,585 22,813 (772) (0) 78,545 80,998 2,453 3.1% 14,963 16,155 1,192 8.0% 152,194 157,097 4,903 3.2%
ClassHigher Secondary Schools TotalPrivate Schools Com. Primary Schools Primary Schools Lower & Middle Sec. Schools

58
Annex 3. Organization of the MoE Headquarters The National Assembly elects the Minister for a term of 5 years. The Minister is supported by the Ministry Secretariat, which is headed by a Secretary. The Secretariat is organized into the Policy and Planning Division (PPD), which also includes the IT-unit, the Administrative and Finance Division (AFD) and Human Resource Division (HRD). The Bhutan Board of Examinations (BBE) and the National Commission for UNESCO are also a part of the Secretariat, and are directly accountable to the Secretary. The Internal Audit Unit (IA) headed by a Chief Internal Auditor reports directly to the Minister. There are three Departments under the Ministry of Education; the Department of School Education (DSE), the Department of Adult and Higher Education (DAHE) and the Department of Youth and Sports (DYS). Each Department is headed by a Director, who is responsible for the implementation of the plans and policies of the department. Each Director is supported by Chief Programme Officers who head the various divisions under the department. The Department of School Education is organized into 4 Divisions and the School Liaison and Coordination Unit (SLC) which supports the Department. The 4 divisions are the Curriculum and Professional Services Division (CAPSD), the Education Monitoring & Support Service Division (EMSSD), the Programme Division (PD) and the School Planning and Building Division (SPBD. The Programme Division administers the following programmes: School Information Technology (IT), Special Education (SE), Early Childhood and Care Development (ECCD), School Agriculture, School Nutrition and Feeding and Private Schools development. CAPSD has a very close relation with the Paro College of Education (CoE). CAPSD-officers teach at the College in order to keep close contact with the teaching practice. The CoE is part of the Royal University of Bhutan. The Department of Adult and Higher Education is organized into the Scholarship Division (SD), the Tertiary Division and the Non Formal and Continuing Education Division (NFECED). This department is also responsible for liaison with the Royal University of Bhutan. The Department of Youth, Sports and Culture is organized into the Career Education and Counseling Division (CECD), Games and Sports Division (GSD), Scouts and Culture Division (SCD) and Education Media (EM). The Games and Sports Division also has the support of the National Sports Federations. The Department is further supported by the Youth Information Centre (YIC) for advocacy of information related to youth and the Youth Centre for organizing youth programmes. The next page shows the organizational structure of the ministry.

59
Annex 3.1 Organizational Structure, Ministry of Education List of AbbreviationsPPD Policy and Planning Division AFD Administrative and Finance Division HRD Human Resource Division IA Internal Auditor BBE Bhutan Board of Examinations DAHE Department of Adult and Higher Education NFCED Non Formal and Continuing Education Division SD Scholarship Division DSE Department of School Education SLC School Liaison and Coordination Unit EMSSD Education Monitoring & Support Service Division SPBD School Planning and Building Division CAPSD Curriculum and Professional Services Division DYS Department of Youth and Sports YIC Youth Information Centre YC Youth Center CECD Counseling Division EM Education Media SCD Scouts and Culture Division GSD Games and Sports Division
IA
Royal University of Bhutan
NFCED
SD
SLC
EMSSD
PD
SPBD
YC
National Sports Federation
YIC
CECD EM
SCD GSD
DAHE DSE DYS
Minister
Secretary
UNESCO
BBE
PPD
AFD
HRD
Dzongkhags
DEO’s
CAPSD

60
The following figure gives the number of staff working for the ministry of education Table 3.2 Staff strength of the Ministry of Education, 2008
M F MF M F MF M F MF M F MF1.00
Sub-total 0 0 0 2 1 3 2 0 2 4 1 52.002.01 Office of the Secretary 1 0 1 1 1 2 1 0 1 3 1 42.02 Internal Audit 2 0 2 0 0 0 0 0 0 2 0 22.03 Policy and Planning Division 5 1 6 1 2 3 1 0 1 7 3 102.04 Administration and Finance Division 9 7 16 5 4 9 8 1 9 22 12 342.05 Bhutan Board of Examinations 7 2 9 1 3 4 2 0 2 10 5 152.06 Human Resource Management Division 6 3 9 0 5 5 2 0 2 8 8 162.07 National Commission of Unesco 1 1 2 0 1 1 1 0 1 2 2 4
Sub-total 31 14 45 8 16 24 15 1 16 54 31 853.003.01 Department of School Education 51 4 55 3 6 9 10 2 12 64 12 763.02 Departement of Adult & Higher Education 5 1 6 0 4 4 2 2 4 7 7 143.03 Dpartment of Youth & Sports 17 7 24 6 5 11 3 1 4 26 13 39
Sub-total 73 12 85 9 15 24 15 5 20 97 32 129Grand total 104 26 130 19 32 51 32 6 38 155 64 219
Total
Office of the Minister
Secretariat
Directorates
Officers Support
Pool Staff(Drivers, Messengers,
Cleaners)Office

61
Annex 4. WFP-support
Day Day BoarderTotal Total Total Total Girls Boys Total Girls Boys Total
1 BUMTHANG1 JAKAR HSS HSS 0 0 0 101 0 0 0 66 35 1012 CHHUMEY MSS MSS 0 0 0 247 0 0 0 102 145 2473 TANG LSS LSS 0 3 0 79 0 0 0 42 40 824 URA MSS MSS 0 7 0 154 0 0 0 87 74 161
Sub Total 0 10 0 581 0 0 0 297 294 5912 CHUKHA 0 01 CHAPCHA MSS MSS 0 0 47 347 33 14 47 165 182 3472 RINCHENLING CPS CPS 48 0 0 0 24 24 48 0 0 03 CHHUKHA HSS HSS 0 0 0 318 0 0 0 144 174 3184 GETANA CPS CPS 0 125 0 0 0 0 0 45 80 1255 BAIKUNZA CPS CPS 126 0 0 0 49 77 126 0 0 06 BONGO PS PS 44 50 0 0 24 20 44 24 26 507 CHUNGKHA LSS LSS 78 157 21 125 46 53 99 122 160 2828 KETOKHA CPS CPS 70 0 0 0 33 37 70 0 0 09 KAMJI LSS LSS 26 213 1 213 6 21 27 206 220 426
10 DUNGNA LSS LSS 46 214 1 30 17 30 47 96 148 24411 METAKHA CPS CPS 105 0 0 0 58 47 105 0 0 012 SINCHULA PS PS 324 0 0 0 140 184 324 0 0 013 CHONGAYKHA CPS CPS 336 0 0 0 165 171 336 0 0 014 CHIMUNA PS PS 246 0 0 0 112 134 246 0 0 015 LOKCHINA LSS LSS 276 0 49 0 133 192 325 0 0 0
Sub Total 1725 759 119 1033 840 1004 1844 802 990 17923 DAGANA 0 01 DAGA MSS MSS 0 0 0 345 0 0 0 187 158 3452 SAMEY CPS CPS 135 9 0 0 73 62 135 3 6 93 PHEKOMA CPS CPS 208 0 0 0 100 108 208 0 0 04 DRUJEYGANG MSS MSS 0 0 0 377 0 0 0 179 198 3775 PHUENSUMGANG CPSCPS 176 0 0 0 97 79 176 0 0 06 GESARLING LSS LSS 324 0 43 0 165 202 367 0 0 07 ZINCHULLA CPS CPS 121 0 0 0 64 57 121 0 0 08 NIMTOLA CPS CPS 154 0 0 0 75 79 154 0 0 09 LUNGTENGANG CPS CPS 133 0 0 0 66 67 133 0 0 0
Sub Total 1251 9 43 722 640 654 1294 369 362 7314 GASA 0 01 BJISHONG MSS MSS 64 79 39 146 61 42 103 110 115 2252 GASA PS PS 111 0 0 0 57 54 111 0 0 03 LAYA CPS CPS 0 88 0 0 0 0 0 26 62 884 LUNANA CPS CPS 0 65 0 0 0 0 0 24 41 65
Sub Total 175 232 39 146 118 96 214 160 218 3784 HAA 0 01 JYENSA PS PS 204 0 0 0 98 106 204 0 0 02 JYENKHANA PS PS 0 196 0 0 0 0 0 104 92 1963 UGYEN DORJI HSS HSS 0 0 0 389 0 0 0 201 188 3894 SOMBEKHA PS CPS 85 0 0 0 46 39 85 0 0 05 RANGTSE CPS CPS 72 0 0 0 42 30 72 0 0 0
Sub Total 361 196 0 389 186 175 361 305 280 585
Primary (PP to Class 6)
Secondary (VII-XII )
Total WFP Beneficiaries
School Name LevelBoarder WFP BoardersWFP Day Students

62
Day Day BoarderTotal Total Total Total Girls Boys Total Girls Boys Total
5 LHUNTSE 0 01 NEY CPS CPS 36 0 0 0 15 21 36 0 0 02 PHUYUM HSS HSS 0 0 0 216 0 0 0 108 108 2163 THIMYUL LSS LSS 201 0 41 0 126 116 242 0 0 04 KHOMA LSS LSS 29 147 10 98 23 16 39 118 127 2455 TSHOCHHEN CPS CPS 119 0 0 0 57 62 119 0 0 06 WAMBUR CPS CPS 72 46 0 0 36 36 72 21 25 467 TANGMACHHU MSS MSS 0 0 0 400 0 0 0 152 248 4008 LADRONG CPS CPS 138 0 0 0 81 57 138 0 0 09 ZANGKHAR CPS CPS 5 109 0 0 2 3 5 48 61 109
10 GORTSUM CPS CPS 191 0 0 0 89 102 191 0 0 011 DUNGKAR PS PS 90 85 0 0 45 45 90 49 36 8512 ZHAM CPS CPS 64 64 0 0 32 32 64 32 32 64
Sub Total 945 451 51 714 506 490 996 528 637 11657 MONGAR 0 01 GYELPOZHING HSS HSS 0 0 0 543 0 0 0 245 298 5432 MONGAR HSS HSS 0 0 0 193 0 0 0 83 110 1933 TSAKALING PS PS 95 30 0 0 45 50 95 19 11 304 TSAMANG PS PS 6 131 0 0 4 2 6 60 71 1315 YADI MSS MSS 0 0 0 322 0 0 0 142 180 3226 THANGRONG PS PS 99 105 0 0 52 47 99 51 54 1057 BALAM CPS CPS 215 215 0 0 117 98 215 117 98 2158 DRAMETSE MSS MSS 0 0 0 291 0 0 0 119 172 2919 KENGKHAR LSS LSS 148 90 12 42 71 89 160 49 83 132
10 UDARIC CPS CPS 103 0 0 0 45 58 103 0 0 011 NAGOR LSS LSS 111 25 42 75 69 84 153 32 68 10012 PANGTHANG CPS CPS 84 0 0 0 39 45 84 0 0 013 SILAMBI CPS CPS 62 0 0 0 30 32 62 0 0 014 WAMA CPS CPS 42 0 0 0 25 17 42 0 0 015 DAKSA CPS CPS 95 0 0 0 41 54 95 0 0 016 YANGBARI CPS CPS 100 0 0 0 47 53 100 0 0 017 JURMEY PS PS 225 0 0 0 108 117 225 0 0 018 SERZONG LSS LSS 111 56 8 22 68 51 119 37 41 7819 ZUNGLEN PS PS 100 0 0 0 49 51 100 0 0 020 LINGKHAR CPS CPS 58 0 0 0 31 27 58 0 0 021 YARAGLA CPS CPS 42 0 0 0 19 23 42 0 0 022 WAICHUR CPS CPS 74 0 0 0 35 39 74 0 0 023 NARANG CPS CPS 173 0 0 0 72 101 173 0 0 0
Sub Total 1943 652 62 1488 967 1038 2005 954 1186 21408 PARO 0 01 DRUKGYEL HSS HSS 0 0 0 353 0 0 0 174 179 3532 DAWAKHA LSS LSS 0 80 0 67 0 0 0 71 76 1473 BITEKHA LSS LSS 0 29 0 66 0 0 0 54 41 954 GONEYTSAWA CPS CPS 0 63 0 0 0 0 0 31 32 63
Sub Total 0 172 0 486 0 0 0 330 328 6589 PEMAGATSHEL 0 01 NANGKOR HSS HSS 0 0 0 198 0 0 0 105 93 1982 PEMAGATSHEL MSS MSS 0 0 0 201 0 0 0 56 145 2013 TSEBAR LSS LSS 107 44 22 124 61 68 129 76 92 1684 GONPASINGMA LSS LSS 141 13 25 162 78 88 166 74 101 1755 YURUNG LSS LSS 122 22 26 162 82 66 148 72 112 1846 DUNGMIN CPS CPS 20 43 0 0 8 12 20 23 20 437 MIKURI CPS CPS 78 56 0 0 47 31 78 24 32 568 CHIMONG PS PS 65 24 0 0 29 36 65 10 14 249 DECHHELING LSS LSS 239 35 47 61 146 140 286 49 47 96
10 NGANGLAM LSS LSS 0 3 0 98 0 0 0 49 52 10111 NGANGLAM MSS MSS 0 0 0 0 0 0 0 0 0 31112 NORBUGANG CPS CPS 156 0 0 0 65 91 156 0 0 013 TSHATSI PS PS 65 60 0 0 35 30 65 25 35 6014 KHANGMA CPS CPS 90 0 0 0 46 44 90 0 0 015 REZIMO CPS CPS 64 0 0 0 36 28 64 0 0 016 DAGOR CPS CPS 96 0 0 0 42 54 96 0 0 017 THONGSA CPS CPS 79 0 0 0 31 48 79 0 0 018 WOONGCHILO CPS CPS 105 0 0 0 47 58 105 0 0 019 KERONG CPS CPS 48 0 0 0 24 24 48 0 0 0
Sub Total 1475 300 120 1006 777 818 1595 563 743 1617
WFP BoardersWFP Day Students
Secondary (VII-XII)
Total WFP Beneficiaries
School Name LevelBoarder
Primary (PP to Class 6)

63
Day Day BoarderTotal Total Total Total Girls Boys Total Girls Boys Total
10 PUNAKHA 0 01 TASHIDINGKHA MSS MSS 0 0 0 372 0 0 0 203 169 3722 PUNAKHA HSS HSS 0 0 0 315 0 0 0 171 144 3153 THINLEYGANG CPS CPS 0 161 0 0 0 0 0 83 78 1614 THINLEYGANG MSS MSS 0 0 0 419 0 0 0 215 204 4195 GOEN SHARI CPS CPS 145 0 0 0 73 72 145 0 0 0
Sub Total 145 161 0 1106 73 72 145 672 595 126711 S/JONGKHAR 0 0
1 GOMDAR LSS LSS 166 117 21 90 90 97 187 87 120 2072 LAURI PS PS 188 166 0 0 97 91 188 78 88 1663 MARTSHALA MSS MSS 0 0 26 186 14 12 26 64 122 1864 MARTSHALA CPS CPS 82 243 0 0 33 49 82 119 124 2435 MINJIWOONG LSS LSS 104 36 24 180 58 70 128 105 111 2166 ORONG LSS LSS 71 118 7 126 28 50 78 109 135 2447 YARPHU CPS CPS 161 0 0 0 77 84 161 0 0 08 ZAMTARI CPS CPS 111 0 0 0 60 51 111 0 0 09 BARZOR CPS CPS 131 0 0 0 55 76 131 0 0 0
10 SARJUNG CPS CPS 128 0 0 0 51 77 128 0 0 011 TSHOTSALO CPS CPS 69 0 0 0 28 41 69 0 0 012 DUNGMANMA CPS CPS 95 0 0 0 45 50 95 0 0 013 ORONG MSS MSS 0 0 6 199 2 4 6 73 126 199
Sub Total 1306 680 84 781 638 752 1390 635 826 146112 SAMTSE 0 0
1 DOROKHA MSS MSS 0 75 0 226 0 0 0 114 187 3012 SENGDHYEN CPS CPS 113 308 0 0 44 69 113 128 180 3083 DENCHHUKHA CPS CPS 376 0 0 0 176 200 376 0 0 04 MINDULING CPS (DUMCPS 304 0 0 0 148 156 304 0 0 05 TABA DAMTOE CPS 238 0 0 0 104 134 238 0 0 06 BARA CPS CPS 288 0 0 0 153 135 288 0 0 0
Sub Total 1319 383 0 226 625 694 1319 242 367 60913 SARPANG 0 0
1 UMLING CPS CPS 359 0 0 0 161 198 359 0 0 02 SARPANG HSS HSS 0 0 0 0 0 0 0 0 0 3723 NORBULING MSS MSS 0 0 0 192 0 0 0 85 107 192
Sub Total 359 0 0 192 161 198 359 85 107 56414 THIMPHU 0 0
1 GENEKHA LSS LSS 83 119 23 38 60 46 106 76 81 1572 LINGZHI CPS CPS 0 69 0 0 0 0 0 33 36 693 CHAMGANG LSS LSS 247 0 44 0 144 147 291 0 0 0
Sub Total 330 188 67 38 204 193 397 109 117 226
WFP Day Students WFP BoardersSchool Name Level
Boarder
Primary (PP to Class 6)
Secondary (VII-XII )
Total WFP Beneficiaries

64
Day Day BoarderTotal Total Total Total Girls Boys Total Girls Boys Total
15 TRASHIGANG 0 01 THONGRONG CPS CPS 80 0 0 0 37 43 80 0 0 02 TOKSHINGMANG CPS CPS 0 131 0 0 0 0 0 55 76 1313 RADI LSS LSS 0 2 0 206 0 0 0 102 106 2084 BUNARANGJUNG HSS HSS 0 0 0 239 0 0 0 116 123 2395 KANGPARA LSS LSS 85 107 10 51 42 53 95 69 89 1586 BIKHAR PS PS 207 37 0 0 109 98 207 24 13 377 TRASHIGANG MSS MSS 0 0 0 150 0 0 0 79 71 1508 UZORONG LSS LSS 124 101 38 169 83 79 162 136 134 2709 BIDUNG LSS LSS 0 44 0 228 0 0 0 137 135 272
10 JOENKHAR CPS CPS 69 0 0 0 28 41 69 0 0 011 SAKTENG PS PS 244 0 0 0 86 158 244 0 0 012 BREKHA CPS CPS 90 0 0 0 45 45 90 0 0 013 J.SHERUBLING HSS HSS 0 0 0 304 0 0 0 119 185 30414 NID KHALING PS 0 44 0 8 0 0 0 22 30 5215 LUMANG PS PS 14 89 0 0 8 6 14 49 40 8916 THREPHU CPS CPS 26 0 0 0 15 11 26 0 0 017 WAMRONG LSS LSS 23 22 0 163 7 16 23 83 102 18518 TASHITSE HSS HSS 0 0 0 433 0 0 0 253 180 43319 THUNGKHAR LSS LSS 134 0 26 127 73 87 160 49 78 12720 PASAPHU PS PS 69 0 0 0 37 32 69 0 0 021 MERAK PS PS 226 0 0 0 101 125 226 0 0 022 PHONGMEY PS PS 162 0 0 0 78 84 162 0 0 023 THRIMSHING CPS CPS 59 0 0 0 31 28 59 0 0 024 JERELIMI CPS CPS 90 0 0 0 43 47 90 0 0 025 KURICHILO CPS CPS 160 0 0 0 58 102 160 0 0 026 BERDUNGMA CPS CPS 58 0 0 0 22 36 58 0 0 027 DALIPHANGMA CPS CPS 54 0 0 0 28 26 54 0 0 028 CHIYA CPS CPS 92 0 0 0 47 45 92 0 0 029 BENSHINGMO CPS CPS 91 0 0 0 48 43 91 0 0 030 KANGLUNG MSS MSS 0 0 0 187 0 0 0 90 97 187
Sub Total 2157 577 74 2265 1026 1205 2231 1383 1459 284216 TRASHIYANGTSE 0 0
1 BAYLING HSS HSS 0 0 0 120 0 0 0 90 30 1202 TARPHEL CPS CPS 109 0 0 0 45 64 109 0 0 03 WOMANANG CPS CPS 83 0 0 0 40 43 83 0 0 04 TOKAPHU CPS CPS 87 0 0 0 44 43 87 0 0 05 TONGMIJANGSA LSS LSS 108 61 13 93 62 59 121 84 70 1546 TSENKHARLA MSS MSS 137 0 37 359 82 92 174 137 222 3597 JANGPHUTSE CPS CPS 100 0 0 0 52 48 100 0 0 08 KHENI LSS LSS 7 4 0 193 4 3 7 96 101 1979 MELONGKHAR CPS PS 91 0 0 0 48 43 91 0 0 0
10 THRAGOM CPS CPS 19 85 0 0 6 13 19 41 44 8511 YALANG CPS CPS 89 0 0 0 46 43 89 0 0 012 DALIKHER CPS CPS 54 0 0 0 22 32 54 0 0 013 BUMDELING LSS LSS 0 0 0 56 0 0 0 27 29 5614 DUKTI CPS CPS 30 0 0 0 14 16 30 0 0 0
Sub Total 914 150 50 821 465 499 964 475 496 971
Primary (PP to Class 6)
Secondary (VII-XII )
Total WFP Beneficiaries
School Name LevelBoarder WFP Day Students WFP Boarders

65
Day Day BoarderTotal Total Total Total Girls Boys Total Girls Boys Total
17 TRONGSA 0 01 BEMJI PS PS 66 0 0 0 35 31 66 0 0 02 SHERUBLING HSS HSS 0 0 0 88 0 0 0 44 44 883 TAKTSE MSS MSS 0 0 0 337 0 0 0 160 177 3374 KELA CPS CPS 45 0 0 0 25 20 45 0 0 05 TSHANGKHA LSS LSS 88 2 23 69 69 42 111 34 37 716 JANGBI CPS CPS 60 0 0 0 31 29 60 0 0 07 LANGTHEL LSS LSS 0 30 0 110 0 0 0 87 53 1408 KORPHU PS PS 82 0 0 0 38 44 82 0 0 09 NABJI CPS CPS 88 0 0 0 40 48 88 0 0 0
10 NIMSHONG CPS CPS 79 0 0 0 35 44 79 0 0 011 KARSHONG CPS CPS 0 50 0 0 0 0 0 27 23 50
Sub Total 508 82 23 604 273 258 531 352 334 68618 TSIRANG 0 0
1 PATALEY CPS CPS 288 0 0 0 141 147 288 0 0 02 DAMPHU HSS HSS 0 0 0 71 0 0 0 34 37 713 MENDRELGANG MSS MSS 0 0 0 275 0 0 0 129 146 2754 TSIRANGTOE LSS LSS 365 0 116 0 215 266 481 0 0 0
Sub Total 653 0 116 346 356 413 769 163 183 34619 WANGDUEPHODRANG 0 0
1 SAMTENGANG MSS MSS 0 0 0 242 0 0 0 135 107 2422 KHOTAKHA CPS CPS 196 0 0 0 106 90 196 0 0 03 JALA CPS CPS 76 0 0 0 38 38 76 0 0 04 SAMTENGANG PS PS 185 0 0 0 90 95 185 0 0 05 ADA/ATHANG CPS CPS 23 92 0 0 13 10 23 44 48 926 NAHI PS PS 45 66 0 0 22 23 45 35 31 667 SHA TASHA PS PS 50 206 0 0 34 16 50 101 105 206
WFP Day Students WFP BoardersBoarder
Primary (PP to Class 6)
Secondary (VII-XII )
Total WFP Beneficiaries
School Name Level

66
Day Day BoarderTotal Total Total Total Girls Boys Total Girls Boys Total
8 GASELO MSS MSS 0 0 0 218 0 0 0 121 97 2189 GASELO LSS LSS 0 74 0 161 0 0 0 126 109 235
10 DANGCHHU CPS CPS 99 0 0 0 68 31 99 0 0 011 NOBDING LSS LSS 0 0 0 138 0 0 0 63 75 13812 SEPHU CPS CPS 116 0 0 0 55 61 116 0 0 013 RAMEYCHEN CPS CPS 187 0 0 0 106 81 187 0 0 0
Sub Total 977 438 0 759 532 445 977 625 572 119720 ZHEMGANG 0 0
1 BARDOH CPS CPS 27 65 0 0 15 12 27 31 34 652 KHOMSHAR CPS CPS 119 96 0 0 63 56 119 48 48 963 LANGDURBI CPS CPS 103 17 0 0 46 57 103 9 8 174 BJOKA-DOGAR CPS CPS 73 67 0 0 44 29 73 15 52 675 TSHAIDANG CPS CPS 99 0 0 0 45 54 99 0 0 06 GOMPHU LSS LSS 59 58 11 43 32 38 70 48 53 1017 KAKTONG CPS CPS 148 0 0 0 60 88 148 0 0 08 YEBILAPTSA MSS MSS 0 0 0 0 76 0 0 3719 ZHEMGANG HSS HSS 0 0 0 343 0 0 0 175 168 343
10 BUDASHI CPS CPS 83 0 0 0 52 31 83 0 0 011 PANBANG LSS LSS 202 79 50 153 105 147 252 88 144 23212 PANTANG CPS CPS 58 121 0 0 22 36 58 57 64 12113 TASHIBI CPS CPS 60 53 0 0 29 31 60 26 27 5314 NIMSHONG CPS CPS 42 0 0 0 20 22 42 0 0 015 SHINGKHAR CPS CPS 16 134 0 0 7 9 16 73 61 13416 GOSHING CPS CPS 95 119 0 0 52 43 95 60 59 11917 TRADIJONG CPS CPS 68 0 0 0 37 31 68 0 0 018 DUNMANG CPS CPS 56 0 0 0 33 23 56 0 0 019 DEGELA CPS CPS 64 0 0 0 36 28 64 0 0 020 BARPONG CPS CPS 60 0 0 0 28 32 60 0 0 0
Sub Total 1432 809 61 539 726 767 1569 630 718 1719
Grand Total 217 17975 6249 909 14242 9113 9771 18960 9679 10812 21545
WFP Day Students WFP BoardersSchool Name Level
Boarder
Primary (PP to Class 6)
Secondary (VII-XII )
Total WFP Beneficiaries

57
Annex 5: Enrolment details by Dzongkhag, Category and Level

B G T ZLT Others1 Bumthang1 Jakar HSS U 16 0 0 0 0 0 0 0 0 0 123 193 109 67 257 235 492 5 17 3 25 19.72 Chumey MSS U 19 32 26 30 31 30 26 27 99 100 103 108 0 0 318 294 612 5 18 2 25 24.53 Ura MSS SU 13 26 31 16 26 24 34 27 69 80 65 0 0 0 200 198 398 2 9 1 12 33.24 Wangdicholing LSS U 24 85 77 96 100 101 100 105 118 125 0 0 0 0 437 470 907 8 24 0 32 28.35 Tang LSS SR 10 14 6 6 6 13 10 16 49 37 0 0 0 0 78 79 157 2 9 0 11 14.36 Jalikhar CPS U 7 43 40 48 51 51 35 39 0 0 0 0 0 0 141 166 307 2 7 0 9 34.17 Zangtherpo CPS SU 7 27 27 37 32 35 26 24 0 0 0 0 0 0 98 110 208 2 7 0 9 23.18 Zungnye CPS SU 7 16 23 17 21 14 12 17 0 0 0 0 0 0 53 67 120 1 5 0 6 20.09 Shingnyer CPS SR 6 13 1 11 10 6 0 7 0 0 0 0 0 0 26 22 48 1 2 0 3 16.0
10 Tangsibi CPS SR 7 12 10 8 10 14 4 7 0 0 0 0 0 0 34 31 65 1 2 0 3 21.711 Khangrab CPS SR 7 12 13 12 21 25 19 17 0 0 0 0 0 0 59 60 119 2 6 0 8 14.912 Gaytsa CPS SR 7 28 25 29 32 26 28 25 0 0 0 0 0 0 97 96 193 2 5 0 7 27.613 Kharsat CPS SR 6 7 13 0 18 9 10 10 0 0 0 0 0 0 24 43 67 1 1 0 2 33.514 Dhur CPS SR 7 18 12 12 14 14 11 11 0 0 0 0 0 0 53 39 92 1 3 0 4 23.015 Shingkhar CPS SR 6 13 0 6 6 7 8 3 0 0 0 0 0 0 22 21 43 0 3 0 3 14.316 Jigmiling CPS SR 7 8 11 10 16 11 11 10 0 0 0 0 0 0 38 39 77 1 3 0 4 19.317 Chhokhor Toe CPS R 7 16 17 17 6 14 10 12 0 0 0 0 0 0 47 45 92 1 4 0 5 18.418 Chungphel CPS R 5 0 9 0 7 4 7 4 0 0 0 0 0 0 18 13 31 1 2 0 3 10.319 Sonam Kuenphen Pvt. SU 6 0 0 0 0 0 0 0 0 0 0 0 88 103 99 92 191 1 3 6 10 19.1
Total 174 370 341 355 407 398 351 361 335 342 291 301 197 170 2099 2120 4219 39 130 12 181 23.3
2 Chukha1 Chukha HSS U 19 0 0 0 0 0 0 0 0 0 258 275 119 152 420 384 804 3 21 14 38 21.22 Phuentsholing HSS U 21 0 0 0 0 0 0 0 87 91 252 209 118 104 400 461 861 7 14 16 37 23.33 Gedu MSS U 31 91 112 102 76 125 129 100 152 88 107 47 0 0 559 570 1129 7 33 7 47 24.04 Darla MSS U 29 88 103 107 48 143 118 114 141 113 85 75 0 0 589 546 1135 5 28 8 41 27.75 Phuentsholing MSS U 29 47 49 118 112 121 120 72 146 137 124 74 0 0 567 553 1120 8 23 13 44 25.56 Chapcha MSS SU 10 0 0 0 0 0 0 0 80 85 118 111 0 0 196 198 394 2 11 5 18 21.97 Wangchu MSS SU 30 100 112 110 106 139 100 77 115 87 92 82 0 0 567 553 1120 6 30 9 45 24.98 Pasakha LSS U 25 276 162 138 130 139 93 99 66 56 0 0 0 0 578 581 1159 3 12 4 19 61.09 Phuentsholing LSS U 52 273 336 308 200 282 260 264 103 80 0 0 0 0 1017 1089 2106 9 61 5 75 28.1
10 Tsimalakha LSS SU 21 81 81 84 55 62 62 58 132 100 0 0 0 0 356 359 715 4 21 3 28 25.511 Chungkha LSS SR 10 33 28 23 28 37 44 42 90 56 0 0 0 0 216 165 381 1 8 1 10 38.112 Kamji LSS SR 13 35 24 29 30 54 51 48 112 115 0 0 0 0 261 237 498 1 13 1 15 33.213 Logchina LSS VR 9 51 48 42 41 40 23 36 24 29 0 0 0 0 196 138 334 1 6 0 7 47.714 Dungna LSS VR 9 38 68 39 34 41 25 15 17 14 0 0 0 0 178 113 291 1 8 0 9 32.315 Arekha PS SU 10 75 74 36 52 69 44 33 0 0 0 0 0 0 201 182 383 2 10 1 13 29.5
PPSec.School Level Type I II VI VIIVIVIII VIII IX X XI XII Total Bht
TPN/Bht Tot
58

16 Chapcha PS SU 7 23 21 22 17 21 16 22 0 0 0 0 0 0 73 69 142 2 6 0 8 17.817 Sinchula PS R 7 48 45 39 72 55 39 29 0 0 0 0 0 0 185 142 327 1 6 0 7 46.718 Bongo PS VR 7 20 12 8 11 16 16 11 0 0 0 0 0 0 47 47 94 1 3 0 4 23.519 Mebesa CPS SR 7 31 37 30 30 26 30 14 0 0 0 0 0 0 86 112 198 1 7 0 8 24.820 Shemagangkha CPS SR 7 15 8 14 9 8 14 13 0 0 0 0 0 0 35 46 81 1 3 0 4 20.321 Lobneykha CPS SR 7 9 9 11 12 6 9 4 0 0 0 0 0 0 29 31 60 1 2 0 3 20.022 Paga CPS SR 7 11 6 11 9 11 6 5 0 0 0 0 0 0 26 33 59 0 3 0 3 19.723 Wangdigatshel CPS SR 10 90 77 73 44 16 11 7 0 0 0 0 0 0 172 146 318 1 8 0 9 35.324 Rinchenling CPS SR 6 8 7 0 7 12 7 9 0 0 0 0 0 0 25 25 50 1 3 0 4 12.525 Meretsemo CPS SR 7 7 14 20 15 13 21 9 0 0 0 0 0 0 41 58 99 0 6 0 6 16.526 Alaykha CPS SR 5 15 28 25 28 18 0 0 0 0 0 0 0 0 64 50 114 0 4 0 4 28.527 Kesari CPS SR 2 64 0 0 0 0 0 0 0 0 0 0 0 0 43 21 64 0 1 0 1 64.028 Totogom CPS R 3 9 8 8 0 0 0 0 0 0 0 0 0 0 13 12 25 0 2 0 2 12.529 Tsimakha CPS VR 8 49 47 34 43 48 48 32 0 0 0 0 0 0 141 160 301 2 8 0 10 30.130 Metakha CPS VR 7 30 15 19 13 15 6 7 0 0 0 0 0 0 47 58 105 0 2 0 2 52.531 Ketokha CPS VR 7 5 9 14 6 15 10 11 0 0 0 0 0 0 37 33 70 0 3 0 3 23.332 Chongaykha CPS VR 9 57 47 46 33 31 54 68 0 0 0 0 0 0 171 165 336 0 7 0 7 48.033 Baikunza CPS VR 7 14 31 15 12 24 15 15 0 0 0 0 0 0 77 49 126 0 3 0 3 42.034 Getana CPS VR 7 23 18 23 11 14 17 19 0 0 0 0 0 0 80 45 125 0 3 0 3 41.735 Chimuna CPS VR 7 38 55 48 36 22 27 20 0 0 0 0 0 0 134 112 246 0 7 0 7 35.136 Reldri Pvt. U 12 0 0 0 0 0 0 0 0 0 0 0 277 177 224 230 454 3 7 7 17 26.737 Phajoding Pvt. U 10 120 31 30 16 19 11 11 8 0 0 0 0 0 131 115 246 4 10 5 19 12.9
Total 474 1874 1722 1626 1336 1642 1426 1264 1273 1051 1036 873 514 433 8182 7888 16070 78 403 99 580 27.7
3 Dagana1 Drujeygang MSS SU 13 0 0 0 0 0 0 0 125 107 117 77 0 0 229 197 426 1 15 4 20 21.32 Daga MSS SU 12 0 0 0 0 0 0 0 127 117 122 111 0 0 226 251 477 3 9 3 15 31.83 Dagapela LSS SU 16 51 68 86 107 89 62 84 71 41 0 0 0 0 323 336 659 2 13 0 15 43.94 Lhamoy Zingkha LSS SU 13 63 70 74 99 82 67 86 49 63 0 0 0 0 351 302 653 3 10 3 16 40.85 Geserling LSS SR 9 50 50 44 51 47 41 42 25 18 0 0 0 0 198 170 368 2 7 0 9 40.96 Samey PS SR 7 19 24 13 20 21 21 26 0 0 0 0 0 0 68 76 144 1 3 0 4 36.07 Daga PS SU 7 38 38 44 47 51 47 41 0 0 0 0 0 0 153 153 306 1 4 0 5 61.28 Tashiding CPS SU 5 31 38 38 37 41 0 0 0 0 0 0 0 0 90 95 185 0 4 0 4 46.39 Dogak CPS SR 7 23 29 34 37 41 61 39 0 0 0 0 0 0 134 130 264 0 6 0 6 44.0
10 Namchalla CPS SR 7 33 30 24 27 39 41 32 0 0 0 0 0 0 115 111 226 2 2 0 4 56.511 Pangna CPS SR 9 45 46 102 51 73 41 36 0 0 0 0 0 0 202 192 394 1 7 1 9 43.812 Lhaling CPS SR 7 27 38 46 48 37 20 18 0 0 0 0 0 0 110 124 234 2 4 0 6 39.013 Daleythang CPS SR 5 40 41 46 51 47 0 0 0 0 0 0 0 0 112 113 225 1 3 0 4 56.314 Phekoma CPS R 7 34 36 32 28 28 28 22 0 0 0 0 0 0 108 100 208 2 2 0 4 52.015 Nimtola CPS R 5 27 48 78 0 0 0 0 0 0 0 0 0 0 79 74 153 1 2 0 3 51.016 Lungtengang CPS R 6 21 14 24 30 24 20 0 0 0 0 0 0 0 67 66 133 0 3 0 3 44.317 Balaygang CPS R 3 26 50 43 0 0 0 0 0 0 0 0 0 0 63 56 119 1 1 0 2 59.5
59

18 Zinchella CPS R 3 41 40 40 0 0 0 0 0 0 0 0 0 0 57 64 121 0 1 0 1 121.019 Gangzor CPS R 3 37 68 0 0 0 0 0 0 0 0 0 0 0 58 47 105 0 1 0 1 105.020 Gumla CPS R 1 30 0 0 0 0 0 0 0 0 0 0 0 0 17 13 30 0 1 0 1 30.021 Phuensumgang CPS VR 7 16 27 22 33 27 26 24 0 0 0 0 0 0 78 97 175 1 4 0 5 35.022 Tshangkha CPS VR 7 39 36 41 49 43 39 27 0 0 0 0 0 0 144 130 274 1 4 0 5 54.8
Total 159 691 791 831 715 690 514 477 397 346 239 188 0 0 2982 2897 5879 25 106 11 142 41.4
3 Gasa1 Bjishong MSS SR 13 19 14 24 20 28 22 16 54 51 49 31 0 0 158 170 328 3 15 0 18 18.22 Gasa PS R 7 23 10 11 12 16 26 13 0 0 0 0 0 0 54 57 111 3 9 0 12 9.33 Laya CPS D 7 14 13 19 13 16 6 7 0 0 0 0 0 0 64 24 88 0 6 0 6 14.74 Luanana CPS D 7 17 5 8 10 7 12 6 0 0 0 0 0 0 41 24 65 0 2 0 2 32.5
Total 34 73 42 62 55 67 66 42 54 51 49 31 0 0 317 275 592 6 32 0 38 15.6
4 Haa1 Ugyen Dorji HSS U 21 0 0 0 0 0 0 0 83 95 206 204 60 50 334 364 698 5 20 6 31 22.52 Katsho LSS U 19 47 72 75 67 75 56 68 90 88 0 0 0 0 296 342 638 5 19 1 25 25.53 Tshaphel LSS SU 12 27 54 36 33 34 36 44 32 49 0 0 0 0 172 173 345 3 15 0 18 19.24 Damthang LSS SU 15 60 51 56 60 37 50 52 45 45 0 0 0 0 226 230 456 4 16 0 20 22.85 Gyensa PS SU 7 28 37 32 26 27 30 24 0 0 0 0 0 0 106 98 204 2 7 0 9 22.76 Jyenkhana PS SU 13 47 44 52 39 46 52 51 0 0 0 0 0 0 172 159 331 3 13 0 16 20.77 Sombaykha PS VR 7 16 26 11 8 8 9 7 0 0 0 0 0 0 39 46 85 1 4 0 5 17.08 Shari CPS R 3 10 20 24 0 0 0 0 0 0 0 0 0 0 25 29 54 0 2 0 2 27.09 Rangtse CPS R 3 32 21 19 0 0 0 0 0 0 0 0 0 0 30 42 72 0 3 0 3 24.0
10 Mochu CPS VR 3 0 6 3 9 0 0 0 0 0 0 0 0 0 5 13 18 0 2 0 2 9.0Total 103 267 331 308 242 227 233 246 250 277 206 204 60 50 1405 1496 2901 23 101 7 131 22.1
5 Lhuentse1 Phuyum HSS U 15 0 0 0 0 0 0 0 81 52 112 82 94 50 287 184 471 4 13 6 23 20.52 Tangmachu MSS SU 14 0 0 0 0 0 0 0 129 132 96 101 0 0 273 185 458 2 11 4 17 26.93 Khoma LSS SR 11 12 27 30 42 25 29 28 61 53 0 0 0 0 158 149 307 2 10 0 12 25.64 Thimyul LSS SR 9 34 31 26 40 33 27 24 30 14 0 0 0 0 126 133 259 3 8 1 12 21.65 Lhuentse PS U 9 35 58 45 50 47 39 35 0 0 0 0 0 0 146 163 309 1 9 0 10 30.96 Tangmachu PS SU 7 38 50 35 32 37 41 38 0 0 0 0 0 0 116 155 271 2 5 0 7 38.77 Minjey PS SR 7 16 19 16 19 28 19 28 0 0 0 0 0 0 64 81 145 1 4 0 5 29.08 Zangkhar PS R 7 11 17 19 9 30 16 12 0 0 0 0 0 0 64 50 114 1 3 0 4 28.59 Wambur PS R 7 20 14 22 16 22 6 18 0 0 0 0 0 0 61 57 118 0 5 0 5 23.6
10 Gortsum PS R 7 25 36 24 32 29 18 27 0 0 0 0 0 0 102 89 191 0 3 0 3 63.711 Ladrong PS R 7 30 20 18 19 22 13 16 0 0 0 0 0 0 57 81 138 2 2 0 4 34.512 Dungkhar PS VR 7 17 13 25 38 36 30 26 0 0 0 0 0 0 86 99 185 1 4 0 5 37.013 Autsho CPS SU 7 29 16 18 31 19 20 13 0 0 0 0 0 0 72 74 146 1 4 0 5 29.214 Zhamling CPS SR 4 4 6 5 5 0 0 0 0 0 0 0 0 0 11 9 20 0 1 0 1 20.0
60

15 Kupinyesa CPS SR 7 5 8 10 18 10 18 15 0 0 0 0 0 0 50 34 84 1 3 0 4 21.016 Domkhar CPS SR 6 9 11 13 13 14 17 0 0 0 0 0 0 0 42 35 77 0 3 0 3 25.717 Tshochen CPS R 7 7 18 22 22 18 20 12 0 0 0 0 0 0 62 57 119 1 3 0 4 29.818 Shawa CPS R 5 12 7 16 7 5 0 0 0 0 0 0 0 0 25 22 47 0 2 0 2 23.519 Dangling CPS R 7 9 15 19 13 25 31 19 0 0 0 0 0 0 57 74 131 0 3 0 3 43.720 Ganglakhema CPS R 7 19 12 18 12 14 9 17 0 0 0 0 0 0 62 39 101 1 2 0 3 33.721 Pangkhar CPS R 3 5 10 13 0 0 0 0 0 0 0 0 0 0 10 18 28 0 1 0 1 28.022 Zham CPS R 7 9 6 8 8 9 13 11 0 0 0 0 0 0 32 32 64 0 2 0 2 32.023 Baptong CPS R 1 16 0 0 0 0 0 0 0 0 0 0 0 0 8 8 16 0 1 0 1 16.024 Ney CPS R 6 0 7 5 4 11 9 5 0 0 0 0 0 0 25 16 41 1 2 0 3 13.725 Ongar CPS VR 6 0 5 10 6 18 11 12 0 0 0 0 0 0 33 29 62 1 2 0 3 20.726 Thuenpey CPS VR 3 11 4 6 0 0 0 0 0 0 0 0 0 0 17 4 21 0 1 0 1 21.0
Total 183 373 410 423 436 452 386 356 301 251 208 183 94 50 2046 1877 3923 25 107 11 143 27.4
7 Mongar1 Gyelpozhing HSS U 20 0 0 0 0 0 0 0 144 152 161 142 114 92 487 318 805 5 19 7 31 26.02 Mongar HSS U 17 0 0 0 0 0 0 0 0 0 223 143 114 103 341 242 583 4 17 11 32 18.23 Drametse MSS SU 17 37 37 43 32 32 38 31 82 116 54 78 0 0 309 271 580 4 15 3 22 26.44 Yadi MSS SU 19 30 34 22 22 43 38 30 96 132 98 95 0 0 337 303 640 4 18 1 23 27.85 Mongar LSS U 21 99 81 66 62 82 70 62 98 103 0 0 0 0 347 376 723 5 19 1 25 28.96 Kurichhu LSS U 11 67 50 66 51 53 56 48 35 49 0 0 0 0 221 254 475 3 8 2 13 36.57 Kilikhar LSS SU 10 32 27 42 46 47 40 33 40 33 0 0 0 0 161 179 340 3 9 0 12 28.38 Chaskhar LSS SR 13 43 45 49 43 35 36 39 42 35 0 0 0 0 189 178 367 2 6 0 8 45.99 Chali LSS SR 8 49 36 29 42 33 25 30 30 0 0 0 0 0 135 139 274 2 6 0 8 34.3
10 Sershong LSS R 8 20 25 22 24 32 27 25 29 0 0 0 0 0 98 106 204 3 6 0 9 22.711 Nagor LSS VR 10 14 27 39 32 0 12 17 53 67 0 0 0 0 156 105 261 1 7 0 8 32.612 Kengkhar LSS VR 9 56 42 34 27 26 25 32 53 0 0 0 0 0 173 122 295 2 5 0 7 42.113 Bumpazor PS SR 7 27 18 15 18 20 16 13 0 0 0 0 0 0 65 62 127 2 3 0 5 25.414 Tsamang PS R 7 35 15 14 19 12 19 26 0 0 0 0 0 0 75 65 140 1 3 0 4 35.015 Tsakaling PS R 7 16 10 15 16 29 27 14 0 0 0 0 0 0 62 65 127 1 3 0 4 31.816 Zunglen PS R 7 21 16 13 20 9 9 12 0 0 0 0 0 0 51 49 100 1 1 0 2 50.017 Thangrong PS R 7 38 37 39 22 30 20 18 0 0 0 0 0 0 101 103 204 1 6 0 7 29.118 Jurmey PS VR 7 41 33 31 36 29 25 30 0 0 0 0 0 0 118 107 225 0 3 0 3 75.019 Ngatshang CPS SU 7 23 22 24 26 25 25 22 0 0 0 0 0 0 74 93 167 1 6 0 7 23.920 Ridaza CPS SU 7 31 44 34 35 33 33 31 0 0 0 0 0 0 123 118 241 1 7 0 8 30.121 Lingmithang CPS SU 7 34 36 35 32 31 50 39 0 0 0 0 0 0 126 131 257 1 7 0 8 32.122 Sengor CPS SR 7 13 7 13 4 10 10 7 0 0 0 0 0 0 30 34 64 1 1 0 2 32.023 Chaskhar Pam CPS SR 6 11 24 21 15 15 10 0 0 0 0 0 0 0 62 34 96 1 2 0 3 32.024 Wama CPS SR 5 11 15 13 0 0 6 6 0 0 0 0 0 0 18 33 51 0 2 0 2 25.525 Muhung CPS R 5 0 12 12 11 0 15 11 0 0 0 0 0 0 34 27 61 1 1 0 2 30.526 Baging CPS R 7 27 23 13 30 17 7 8 0 0 0 0 0 0 55 70 125 1 2 0 3 41.727 Konbar CPS R 7 10 12 12 17 12 7 8 0 0 0 0 0 0 41 37 78 1 3 0 4 19.5
61

28 Balam CPS R 7 43 36 31 34 32 23 16 0 0 0 0 0 0 98 117 215 1 4 0 5 43.029 Ganglapong CPS R 7 15 13 11 7 10 9 17 0 0 0 0 0 0 43 39 82 1 1 0 2 41.030 Broksar CPS R 4 6 5 5 9 0 0 0 0 0 0 0 0 0 16 9 25 0 1 0 1 25.031 Banjar CPS R 7 11 4 7 11 10 8 5 0 0 0 0 0 0 25 31 56 0 2 0 2 28.032 Soenakhar CPS R 4 14 22 25 8 0 0 0 0 0 0 0 0 0 38 31 69 1 1 0 2 34.533 Resa CPS R 5 0 7 0 13 7 8 6 0 0 0 0 0 0 26 15 41 0 2 0 2 20.534 Thridangbi CPS R 6 18 13 19 16 12 16 0 0 0 0 0 0 0 50 44 94 1 2 0 3 31.335 Sherub Choling CPS R 4 12 17 23 5 0 0 0 0 0 0 0 0 0 28 29 57 0 2 0 2 28.536 Jaibab CPS R 3 7 9 18 0 0 0 0 0 0 0 0 0 0 15 19 34 0 2 0 2 17.037 Lingkhar CPS R 3 6 18 32 0 0 0 0 0 0 0 0 0 0 27 29 56 0 1 0 1 56.038 Narang CPS R 7 32 34 26 22 23 20 16 0 0 0 0 0 0 101 72 173 1 3 0 4 43.339 Waichur CPS R 5 12 15 18 17 12 0 0 0 0 0 0 0 0 39 35 74 0 2 0 2 37.040 Takhambi CPS R 7 7 2 4 6 10 5 6 0 0 0 0 0 0 27 13 40 1 1 0 2 20.041 Saling CPS R 6 12 0 9 5 7 9 6 0 0 0 0 0 0 21 27 48 1 1 0 2 24.042 Kalapang CPS R 2 0 5 16 0 0 0 0 0 0 0 0 0 0 9 12 21 0 2 0 2 10.543 Dagsa CPS VR 7 11 12 23 16 7 11 18 0 0 0 0 0 0 56 42 98 1 1 0 2 49.044 Yangbari CPS VR 6 16 0 22 14 17 16 17 0 0 0 0 0 0 55 47 102 0 2 0 2 51.045 Yaragla CPS VR 5 10 0 3 9 7 13 0 0 0 0 0 0 0 23 19 42 0 2 0 2 21.046 Pangthang CPS VR 7 5 19 19 11 12 11 8 0 0 0 0 0 0 46 39 85 0 2 0 2 42.547 Silambi CPS VR 6 11 7 16 10 7 12 0 0 0 0 0 0 0 32 31 63 1 1 0 2 31.548 Bakla CPS VR 2 6 0 11 0 0 0 0 0 0 0 0 0 0 8 9 17 0 1 0 1 17.049 Udaric CPS VR 7 26 16 18 12 8 10 13 0 0 0 0 0 0 58 45 103 0 2 0 2 51.5
Total 380 1065 982 1072 907 836 817 720 702 687 536 458 228 195 4830 4375 9205 61 223 25 309 29.8
8 Paro1 Drukgyel HSS U 20 0 0 0 0 0 0 0 0 0 351 245 169 135 459 441 900 6 14 11 31 29.02 Shari HSS SU 15 0 0 0 0 0 0 0 25 92 97 87 74 38 184 229 413 3 18 8 29 14.23 Shaba MSS U 13 0 0 0 0 0 0 0 104 125 169 112 0 0 242 268 510 4 14 5 23 22.24 Khangkhu MSS U 23 38 43 57 63 61 79 81 119 68 71 54 0 0 341 393 734 6 27 2 35 21.05 Gaupey LSS U 24 72 69 88 85 88 83 99 71 52 0 0 0 0 344 363 707 7 25 0 32 22.16 Drukgyel LSS U 18 68 72 73 63 59 72 48 72 75 0 0 0 0 280 322 602 6 25 1 32 18.87 Doteng LSS U 11 44 46 38 39 38 39 57 43 57 0 0 0 0 193 208 401 3 11 1 15 26.78 Lamgong(Lango) LSS U 18 92 85 99 104 115 92 92 87 92 0 0 0 0 400 458 858 6 21 2 29 29.69 Woochu LSS U 27 69 87 109 118 97 88 108 86 87 0 0 0 0 404 445 849 7 29 0 36 23.6
10 Wanakha LSS SU 10 61 46 55 45 25 36 24 19 16 0 0 0 0 142 185 327 2 3 0 5 65.411 Bitekha LSS SR 9 55 42 35 46 50 40 51 45 56 0 0 0 0 198 222 420 1 12 0 13 32.312 Dawakha LSS SR 9 48 41 29 34 38 40 58 43 47 0 0 0 0 174 204 378 0 12 1 13 29.113 Shaba PS U 21 117 110 113 126 110 109 88 0 0 0 0 0 0 403 370 773 5 22 0 27 28.614 Taju PS SU 13 84 66 72 72 78 42 35 0 0 0 0 0 0 249 200 449 3 16 0 19 23.615 Gonyetsawa PS R 7 10 13 7 11 10 10 3 0 0 0 0 0 0 33 31 64 1 4 0 5 12.816 Issuna CPS SU 7 16 15 16 11 15 11 10 0 0 0 0 0 0 47 47 94 1 3 0 4 23.517 Ramechetsekha CPS R 7 21 25 23 24 27 8 14 0 0 0 0 0 0 75 67 142 0 6 0 6 23.7
62

18 Nabesa CPS R 6 0 2 3 8 6 5 3 0 0 0 0 0 0 9 18 27 0 2 0 2 13.519 Yoezerling Pvt. U 9 126 32 26 8 13 0 0 0 0 0 0 0 0 110 95 205 3 8 1 12 17.120 K. Gangri Pvt. U 5 49 8 9 0 0 0 0 0 0 0 0 0 0 42 24 66 1 4 0 5 13.221 Tenzin Pvt. U 0 0 0 0 0 0 0 0 0 0 0 0 0 0 0 0 0 0 0 0 022 Jangchub Choling Pvt. U 0 0 0 0 0 0 0 0 0 0 0 0 0 0 0 0 0 0 0 0 023 Kuenga Pvt. SU 18 0 0 0 0 0 0 0 0 0 0 0 460 340 431 369 800 5 10 15 30 26.7
Total 290 970 802 852 857 830 754 771 714 767 688 498 703 513 4760 4959 9719 70 286 47 403 24.1
9 P/Gatshel1 Nangkhor HSS U 15 0 0 0 0 0 0 0 0 0 138 125 162 161 339 247 586 4 14 5 23 25.52 Pemagatshel MSS U 22 49 42 42 49 47 35 59 66 58 161 151 0 0 431 328 759 4 15 5 24 31.63 Nganglam MSS SU 11 0 0 0 0 0 0 0 0 0 139 263 0 0 238 164 402 2 12 3 17 23.64 Nganglam LSS SU 15 94 62 61 60 85 54 95 127 111 0 0 0 0 380 369 749 3 14 2 19 39.45 Shumar LSS SR 9 33 49 38 29 44 27 27 37 34 0 0 0 0 155 163 318 2 6 2 10 31.86 Gongpasingma LSS SR 12 24 16 19 22 22 27 24 110 77 0 0 0 0 189 152 341 2 10 1 13 26.27 Yurung LSS R 11 23 19 22 18 16 24 22 93 95 0 0 0 0 178 154 332 1 9 0 10 33.28 Tsebar LSS R 11 34 19 25 18 18 29 34 85 67 0 0 0 0 174 155 329 1 10 0 11 29.99 Dechenling LSS R 11 35 33 36 60 40 33 39 67 42 0 0 0 0 189 196 385 2 10 0 12 32.1
10 Chimong PS VR 6 14 16 0 16 12 15 16 0 0 0 0 0 0 50 39 89 0 3 0 3 29.711 Mikuri PS VR 7 24 16 30 16 17 15 16 0 0 0 0 0 0 62 72 134 1 4 0 5 26.812 Dungmin PS VR 6 0 9 9 9 12 13 14 0 0 0 0 0 0 33 33 66 1 3 0 4 16.513 Tshatsi PS VR 7 21 22 12 16 17 21 16 0 0 0 0 0 0 65 60 125 0 6 0 6 20.814 Khar CPS SR 7 28 20 31 19 26 24 29 0 0 0 0 0 0 81 96 177 1 6 0 7 25.315 Khothakpa CPS SR 7 33 29 41 27 33 26 20 0 0 0 0 0 0 107 102 209 0 6 0 6 34.816 Thongsa CPS SR 6 12 10 12 0 28 16 7 0 0 0 0 0 0 51 34 85 0 4 0 4 21.317 Woongchilo CPS SR 7 23 15 16 13 11 10 17 0 0 0 0 0 0 58 47 105 1 4 0 5 21.018 Dagor CPS R 6 21 25 0 13 15 13 11 0 0 0 0 0 0 54 44 98 0 2 0 2 49.019 Khangma CPS R 7 13 8 14 10 12 18 16 0 0 0 0 0 0 44 47 91 1 4 0 5 18.220 Shali CPS R 7 24 19 28 22 21 22 20 0 0 0 0 0 0 80 76 156 1 5 0 6 26.021 Khenrigonpa CPS R 6 0 14 16 13 11 15 16 0 0 0 0 0 0 47 38 85 0 4 0 4 21.322 Choekhorling CPS R 7 9 9 2 15 13 11 12 0 0 0 0 0 0 38 33 71 0 3 0 3 23.723 Kerong CPS R 6 0 8 8 3 10 8 8 0 0 0 0 0 0 24 21 45 0 2 0 2 22.524 Norbugang CPS R 7 24 10 25 31 30 28 17 0 0 0 0 0 0 96 69 165 0 4 0 4 41.325 Rezimo CPS VR 6 7 10 14 15 9 11 0 0 0 0 0 0 0 28 38 66 0 2 0 2 33.026 Nyaskhar CPS VR 4 5 8 0 5 6 0 0 0 0 0 0 0 0 12 12 24 0 1 0 1 24.027 Khenzor CPS VR 5 8 19 20 16 13 0 0 0 0 0 0 0 0 33 43 76 0 2 0 2 38.028 Laniri CPS VR 6 6 12 0 12 9 9 9 0 0 0 0 0 0 27 30 57 0 3 0 3 19.029 Chongshing CPS VR 5 11 10 0 7 14 0 7 0 0 0 0 0 0 20 29 49 0 3 0 3 16.330 Resinang CPS VR 5 7 13 8 8 8 0 0 0 0 0 0 0 0 27 17 44 0 2 0 2 22.031 Yelchen CPS VR 7 33 18 20 19 21 15 18 0 0 0 0 0 0 71 73 144 1 4 0 5 28.8
Total 254 615 560 549 561 620 519 569 585 484 438 539 162 161 3381 2981 6362 28 177 18 223 28.5
63

10 Punakha1 Punakha HSS U 19 0 0 0 0 0 0 0 0 0 143 275 173 132 364 359 723 6 26 10 42 17.22 Khuruthang MSS U 25 98 86 87 81 90 89 97 129 110 70 45 0 0 466 516 982 6 29 6 41 24.03 Thinleygang MSS SU 13 0 0 0 0 0 0 0 127 79 150 129 0 0 229 256 485 3 12 3 18 26.94 Trashhidingkha MSS SR 10 0 0 0 0 0 0 0 138 124 111 0 0 0 170 203 373 4 14 1 19 19.65 Bjijokha LSS SR 11 37 37 45 48 43 25 23 27 28 0 0 0 0 132 181 313 2 10 1 13 24.16 Kabesa LSS SR 16 81 66 74 75 71 44 48 74 36 0 0 0 0 234 335 569 5 14 1 20 28.57 Shengana LSS SR 9 21 26 23 30 30 23 20 21 12 0 0 0 0 104 102 206 3 8 1 12 17.28 Lobesa LSS SR 21 95 111 102 80 89 81 55 84 59 0 0 0 0 347 409 756 6 18 2 26 29.19 Thinleygang PS SU 7 38 30 48 49 49 55 58 0 0 0 0 0 0 160 167 327 3 10 0 13 25.2
10 Tshochasa PS SR 7 24 30 17 12 14 15 9 0 0 0 0 0 0 63 58 121 2 6 0 8 15.111 Logodama PS SR 18 107 80 102 94 83 78 61 0 0 0 0 0 0 285 320 605 4 18 0 22 27.512 Mendhagang CPS SU 7 39 37 33 30 34 34 27 0 0 0 0 0 0 118 116 234 1 9 0 10 23.413 Goenshari CPS SR 7 24 21 32 20 24 9 15 0 0 0 0 0 0 72 73 145 2 6 0 8 18.114 Laptsakha CPS SR 7 17 27 24 32 26 25 17 0 0 0 0 0 0 80 88 168 2 7 0 9 18.715 Norbugang CPS SR 7 12 10 11 6 5 9 7 0 0 0 0 0 0 30 30 60 1 3 0 4 15.016 Tahogang CPS SR 7 8 12 11 7 10 10 10 0 0 0 0 0 0 23 45 68 0 3 0 3 22.717 Phulusu CPS SR 2 4 8 0 0 0 0 0 0 0 0 0 0 0 9 3 12 0 2 0 2 6.018 Lakhu CPS SR 4 24 9 13 11 0 0 0 0 0 0 0 0 0 30 27 57 0 3 0 3 19.019 Wolathang CPS R 7 21 12 17 12 11 12 6 0 0 0 0 0 0 47 44 91 0 4 0 4 22.820 Nawakha CPS R 4 19 23 23 17 0 0 0 0 0 0 0 0 0 39 43 82 0 4 0 4 20.521 Ugyen Academy Pvt. U 24 0 0 0 0 0 0 0 0 0 19 29 369 381 422 376 798 7 23 6 36 22.2
Total 232 669 625 662 604 579 509 453 600 448 493 478 542 513 3424 3751 7175 57 229 31 317 22.6
11 S/Jongkhar1 Samdrupjongkhar MSS U 19 0 0 0 0 122 115 97 124 76 77 55 0 0 338 328 666 6 18 9 33 20.22 Garpawoong MSS MSS U 9 0 0 0 0 0 0 0 75 103 68 55 0 0 149 152 301 2 8 5 15 20.13 Phuntshothang MSS SR 20 104 132 116 77 104 99 116 114 78 53 0 0 0 538 455 993 2 14 3 19 52.34 Wooling CPS SR 7 10 42 33 49 49 40 34 0 0 0 0 0 0 138 119 257 1 5 0 6 42.85 Martshalla MSS R 7 0 0 0 0 0 0 0 65 80 77 0 0 0 140 82 222 1 7 0 8 27.86 Orong MSS R 6 0 0 0 0 0 0 0 0 0 205 0 0 0 130 75 205 1 7 3 11 18.67 Jomotshangkha LSS SU 14 41 62 66 44 51 60 59 35 43 0 0 0 0 228 233 461 2 9 2 13 35.58 Pemathang LSS R 10 48 46 59 52 65 56 35 34 0 0 0 0 0 202 193 395 1 7 0 8 49.49 Gomdar LSS R 10 31 43 54 36 52 46 48 78 51 0 0 0 0 240 199 439 2 6 2 10 43.9
10 Minjiwoong LSS R 13 17 17 19 13 15 13 33 103 101 0 0 0 0 178 153 331 2 6 0 8 41.411 Orong LSS R 12 37 32 39 50 49 63 42 84 83 0 0 0 0 248 231 479 2 8 3 13 36.812 Samdrupjongkhar PS U 13 131 137 146 104 0 0 0 0 0 0 0 0 0 260 258 518 1 16 0 17 30.513 Deothang PS U 17 103 89 83 86 111 108 85 0 0 0 0 0 0 325 340 665 1 16 3 20 33.314 Yarphu PS R 7 18 18 19 32 21 31 22 0 0 0 0 0 0 84 77 161 1 3 0 4 40.315 Martshala PS R 7 49 40 53 52 51 43 40 0 0 0 0 0 0 175 153 328 1 5 0 6 54.716 Lauri PS VR 7 50 63 60 48 49 50 34 0 0 0 0 0 0 179 175 354 1 3 0 4 88.517 Rikhey CPS SU 7 24 25 23 24 25 30 17 0 0 0 0 0 0 90 78 168 1 6 0 7 24.0
64

18 Barzor CPS R 4 26 36 42 27 0 0 0 0 0 0 0 0 0 76 55 131 0 2 0 2 65.519 Wangphu CPS R 3 41 11 9 0 0 0 0 0 0 0 0 0 0 30 31 61 0 2 0 2 30.520 Zamtari CPS VR 6 7 14 22 37 20 11 0 0 0 0 0 0 0 51 60 111 1 2 0 3 37.021 Monmola CPS VR 7 23 29 25 20 37 42 33 0 0 0 0 0 0 104 105 209 0 3 0 3 69.722 Tshotsalo CPS VR 7 11 11 13 6 14 8 8 0 0 0 0 0 0 41 30 71 0 2 0 2 35.523 Zangthey CPS VR 7 16 28 24 11 40 38 26 0 0 0 0 0 0 72 111 183 1 2 0 3 61.024 Dungmanma CPS VR 6 12 19 25 0 13 14 12 0 0 0 0 0 0 50 45 95 1 1 0 2 47.525 Sarjung CPS VR 7 26 24 16 19 15 15 13 0 0 0 0 0 0 77 51 128 1 3 0 4 32.026 Dechen Pvt. U 4 23 16 13 6 0 0 0 0 0 0 0 0 0 30 28 58 2 3 2 7 8.3
Total 236 848 934 959 793 903 882 754 712 615 480 110 0 0 4173 3817 7990 34 164 32 230 34.7
12 Samtse1 Samtse HSS U 19 0 0 0 0 0 0 0 0 157 156 99 94 49 276 279 555 5 15 12 32 17.32 Gomtu MSS U 35 221 211 204 194 169 155 125 151 89 88 58 0 0 862 803 1665 4 21 12 37 45.03 Peljorling MSS SU 39 112 185 181 216 219 146 157 155 109 102 85 0 0 867 800 1667 4 38 6 48 34.74 Yoeseltse(Ghumauney) MSS SU 24 83 103 110 113 91 99 62 104 99 75 58 0 0 518 479 997 5 17 5 27 36.95 Tendu MSS SU 27 177 175 141 147 149 103 119 102 88 67 38 0 0 688 618 1306 5 22 4 31 42.16 Dorokha MSS R 18 59 65 70 63 102 110 58 142 119 115 0 0 0 483 420 903 1 16 0 17 53.17 Samtse LSS U 27 138 130 157 150 168 114 128 217 0 0 0 0 0 583 619 1202 8 31 1 40 30.18 Chengmari PS SU 14 74 68 86 107 88 78 75 0 0 0 0 0 0 302 274 576 2 16 0 18 32.09 Denchukha PS VR 11 39 40 69 56 63 60 49 0 0 0 0 0 0 200 176 376 1 8 0 9 41.8
10 Sengdhyen PS VR 12 65 61 64 52 98 37 42 0 0 0 0 0 0 248 171 419 1 5 0 6 69.811 Mechetar CPS U 12 66 64 43 46 68 66 67 0 0 0 0 0 0 220 200 420 1 12 0 13 32.312 Chargharey CPS SU 11 64 45 65 62 65 43 34 0 0 0 0 0 0 218 160 378 0 9 0 9 42.013 Ugentse CPS SU 7 68 49 61 47 44 42 34 0 0 0 0 0 0 191 154 345 1 7 0 8 43.114 Bara CPS SR 9 48 98 73 47 79 33 0 0 0 0 0 0 0 182 196 378 2 3 0 5 75.615 Namgaycholing CPS SR 10 77 177 53 0 0 0 0 0 0 0 0 0 0 165 142 307 1 5 0 6 51.216 Mindruling CPS VR 7 40 63 51 34 39 43 32 0 0 0 0 0 0 156 146 302 0 4 0 4 75.517 Taba Dramtoe CPS VR 7 44 63 104 27 0 0 0 0 0 0 0 0 0 134 104 238 1 4 0 5 47.6
Total 289 1375 1597 1532 1361 1442 1129 982 871 661 603 338 94 49 6293 5741 12034 42 233 40 315 38.2
13 Sarpang1 Gelephu HSS U 16 0 0 0 0 0 0 0 0 0 182 214 61 67 277 247 524 4 14 10 28 18.72 Sarpang HSS U 19 0 0 0 0 0 0 0 0 135 193 314 51 0 387 306 693 5 16 10 31 22.43 Peltrithang MSS U 31 145 144 142 159 164 119 126 144 119 60 0 0 0 675 647 1322 7 28 1 36 36.74 Norbuling MSS SR 24 38 39 59 50 47 62 62 207 172 90 0 0 0 417 409 826 3 18 1 22 37.55 Gelephu LSS U 40 211 178 194 191 209 211 177 236 172 0 0 0 0 853 926 1779 8 31 6 45 39.56 Sarpang LSS U 25 138 132 140 121 165 138 124 121 0 0 0 0 0 497 582 1079 5 23 0 28 38.57 Dekiling LSS SU 12 48 55 56 60 80 67 52 57 52 0 0 0 0 289 238 527 2 12 0 14 37.68 Jigmiling LSS SU 8 45 46 48 53 50 48 41 33 0 0 0 0 0 189 175 364 1 9 0 10 36.49 Dechen Pelri (Jarwa) CPS SU 7 33 32 23 15 18 25 17 0 0 0 0 0 0 83 80 163 1 4 0 5 32.6
10 Serzhong CPS SU 7 36 34 39 25 36 34 25 0 0 0 0 0 0 122 107 229 1 6 0 7 32.7
65

11 Chuzagang CPS SR 9 63 42 52 43 56 34 46 0 0 0 0 0 0 165 171 336 1 8 0 9 37.312 Jigmecholing CPS SR 12 84 58 56 96 105 81 71 0 0 0 0 0 0 287 264 551 3 11 0 14 39.413 Umling CPS SR 7 43 43 68 49 61 52 43 0 0 0 0 0 0 198 161 359 1 8 0 9 39.914 Bhur CPS R 3 38 42 39 0 0 0 0 0 0 0 0 0 0 59 60 119 0 4 0 4 29.815 Retey CPS VR 7 6 12 13 10 8 9 4 0 0 0 0 0 0 36 26 62 0 2 0 2 31.016 Kuendrup Pvt. U 11 51 10 6 5 0 0 0 0 0 0 0 221 0 155 138 293 2 6 5 13 22.517 Samphel Pvt. U 5 46 31 25 15 20 0 0 0 0 0 0 0 0 69 68 137 1 5 0 6 22.8
Total 243 1025 898 960 892 1019 880 788 798 650 525 528 333 67 4758 4605 9363 45 205 33 283 33.1
14 Thimphu1 Yangchenphug HSS U 37 0 0 0 0 0 0 0 0 0 416 364 276 358 559 855 1414 10 21 29 60 23.62 Motithang HSS U 31 0 0 0 0 0 0 0 0 0 447 273 147 157 486 538 1024 8 30 21 59 17.43 Dechencholing MSS U 48 120 171 160 188 193 160 130 186 177 148 96 0 0 825 904 1729 13 52 12 77 22.54 Lungtenzampa MSS U 31 0 0 0 0 0 0 0 127 142 348 386 0 0 456 547 1003 8 28 16 52 19.35 Khasadrapchu MSS U 28 76 61 82 69 72 95 94 103 67 62 40 0 0 405 416 821 9 20 9 38 21.66 Babesa MSS U 7 0 0 0 0 0 0 0 68 38 131 0 0 0 136 101 237 3 8 3 14 16.97 Changangkha LSS U 26 46 42 72 111 84 95 110 173 175 0 0 0 0 441 467 908 5 28 3 36 25.28 Choden LSS U 10 0 0 0 0 0 0 0 134 161 0 0 0 0 141 154 295 2 7 2 11 26.89 Jigme Namgyel LSS U 35 121 99 120 106 118 124 158 232 238 0 0 0 0 618 698 1316 8 47 1 56 23.5
10 Zilukha LSS U 26 106 98 104 109 92 115 123 116 121 0 0 0 0 505 479 984 4 33 0 37 26.611 Changzamtog LSS U 31 91 94 122 171 171 118 119 293 244 0 0 0 0 707 716 1423 7 36 4 47 30.312 Loselling LSS U 23 102 108 110 89 115 92 90 117 143 0 0 0 0 458 508 966 5 28 2 35 27.613 Olakha LSS SU 14 89 72 55 59 58 53 47 0 0 0 0 0 0 236 197 433 2 17 0 19 22.814 Genekha LSS SR 9 21 25 26 36 35 31 28 37 24 0 0 0 0 127 136 263 2 8 1 11 23.915 Chamgang LSS SR 9 30 45 46 43 33 22 28 18 26 0 0 0 0 147 144 291 3 11 0 14 20.816 Jigme Losel PS U 20 90 110 142 91 126 121 119 0 0 0 0 0 0 383 416 799 3 26 0 29 27.617 Lungtenphu PS U 28 200 164 160 142 181 134 139 0 0 0 0 0 0 545 575 1120 6 30 1 37 30.318 Rinchen Kuenphen PS U 21 83 110 104 113 133 118 108 0 0 0 0 0 0 375 394 769 4 27 0 31 24.819 Changbangdu PS U 16 83 86 96 63 66 71 56 0 0 0 0 0 0 275 246 521 3 21 0 24 21.720 Zilnon Namgyeling PS U 23 53 111 147 100 109 112 120 0 0 0 0 0 0 394 358 752 4 29 0 33 22.821 Babesa PS U 22 135 136 141 117 114 118 108 0 0 0 0 0 0 426 443 869 6 19 1 26 33.422 Kuzshugchen CPS U 9 57 41 31 35 31 20 22 0 0 0 0 0 0 129 108 237 2 9 0 11 21.523 Hongtsho CPS U 7 33 24 31 30 29 20 22 0 0 0 0 0 0 91 98 189 0 6 0 6 31.524 Jemina CPS SU 5 48 28 43 25 20 0 0 0 0 0 0 0 0 90 74 164 1 6 0 7 23.425 Sisina CPS SU 6 30 32 17 15 17 14 0 0 0 0 0 0 0 54 71 125 1 7 0 8 15.626 Tshaluna CPS R 7 20 15 11 11 16 11 8 0 0 0 0 0 0 45 47 92 1 5 0 6 15.327 Lingzhi CPS D 7 12 8 12 15 11 5 6 0 0 0 0 0 0 36 33 69 1 4 0 5 13.828 Phuensum Pvt. U 8 43 24 16 13 5 8 9 0 0 0 0 0 0 66 52 118 3 8 0 11 10.729 Druk Pvt. U 14 39 47 50 44 25 32 24 14 29 0 0 0 0 164 140 304 4 15 4 23 13.230 Rinchen Pvt. U 20 0 0 0 0 0 0 0 0 0 0 0 380 370 353 397 750 6 11 14 31 24.231 Nima Pvt. U 20 0 0 0 0 0 0 0 0 0 0 0 368 389 346 411 757 5 13 14 32 23.732 Kelki Pvt. U 20 0 0 0 0 0 0 0 0 0 0 0 378 349 319 408 727 6 12 14 32 22.7
66

33 Sunshine Pvt. U 8 54 29 22 19 13 24 19 0 0 0 0 0 0 85 95 180 2 8 3 13 13.834 Early Learning Centre Pvt. U 19 60 69 58 48 36 38 46 0 0 0 0 0 0 182 173 355 4 17 3 24 14.835 Little Dragon Pvt. U 11 80 30 38 28 13 8 7 0 0 0 0 0 0 94 110 204 2 14 0 16 12.836 Dr. Tobgyel Pvt. U 17 48 71 47 52 39 38 39 30 0 0 0 0 0 191 173 364 5 13 4 22 16.537 Etho Meto (Rigsar) Pvt. SU 12 156 42 20 14 6 7 0 0 0 0 0 0 0 147 98 245 3 8 2 13 18.838 Rigpey Jungney Pvt. SU 4 31 8 2 0 0 0 0 0 0 0 0 0 0 26 15 41 1 2 0 3 13.739 Thimphu Pvt. SU 8 39 38 33 20 21 0 0 0 0 0 0 0 0 66 85 151 2 7 4 13 11.6
Total 697 2196 2038 2118 1976 1982 1804 1779 1648 1585 1552 1159 1549 1623 11129 11880 23009 164 691 167 1022 22.5
15 T/Gang1 Ranjung HSS U 14 0 0 0 0 0 0 0 0 0 143 153 118 117 303 228 531 4 12 8 24 22.12 Jigmesherubling HSS SU 18 0 0 0 0 0 0 0 0 0 196 191 169 172 433 295 728 3 10 13 26 28.03 Tashitse HSS SU 15 0 0 0 0 0 0 0 0 90 210 189 84 0 357 216 573 2 14 9 25 22.94 Trashigang MSS U 23 88 73 70 54 58 65 63 77 72 114 125 0 0 414 445 859 5 20 6 31 27.75 Kanglung MSS U 11 0 0 0 0 0 0 0 73 65 194 58 0 0 185 205 390 3 11 2 16 24.46 Ranjung LSS U 11 36 44 44 47 38 45 53 47 39 0 0 0 0 184 209 393 1 11 0 12 32.87 Khaling LSS SU 16 38 50 46 49 41 40 42 52 57 0 0 0 0 206 209 415 3 14 2 19 21.88 Yongphula LSS SU 11 42 50 65 39 39 44 48 30 45 0 0 0 0 206 196 402 2 14 1 17 23.69 Radhi LSS SU 14 40 33 41 34 32 36 29 161 109 0 0 0 0 266 249 515 3 11 2 16 32.2
10 Wamrong LSS SU 13 30 41 54 45 43 38 42 145 77 0 0 0 0 284 231 515 3 10 4 17 30.311 Bidung LSS SR 13 20 15 23 25 22 36 31 134 141 0 0 0 0 217 230 447 2 10 5 17 26.312 Bartsham LSS SR 11 31 34 38 38 46 42 56 51 36 0 0 0 0 159 213 372 2 10 1 13 28.613 Uzorong LSS SR 14 58 30 24 29 21 34 29 106 101 0 0 0 0 213 219 432 2 11 0 13 33.214 Kangpara LSS SR 9 26 22 26 27 34 35 26 61 0 0 0 0 0 143 114 257 1 7 0 8 32.115 Thungkhar LSS VR 11 18 29 16 20 24 18 20 48 111 0 0 0 0 175 129 304 2 10 0 12 25.316 Kanglung PS U 15 79 81 78 79 106 62 54 0 0 0 0 0 0 268 271 539 3 18 0 21 25.717 Galing PS SR 7 13 14 17 20 25 25 8 0 0 0 0 0 0 60 62 122 1 6 1 8 15.318 Phongmey PS SR 7 21 25 27 23 20 29 17 0 0 0 0 0 0 84 78 162 1 5 0 6 27.019 Bikhar PS SR 7 40 33 41 22 39 41 29 0 0 0 0 0 0 120 125 245 1 6 0 7 35.020 Chaling PS SR 7 26 35 30 36 36 24 30 0 0 0 0 0 0 115 102 217 1 6 0 7 31.021 Changmey PS SR 7 20 7 22 17 19 18 26 0 0 0 0 0 0 60 69 129 1 6 0 7 18.422 Merak PS SR 7 53 41 50 21 24 31 6 0 0 0 0 0 0 125 101 226 1 6 0 7 32.323 Lumang PS R 7 18 7 21 16 7 17 16 0 0 0 0 0 0 48 54 102 1 4 0 5 20.424 Tsangpo PS R 7 11 20 16 14 16 13 11 0 0 0 0 0 0 55 46 101 1 3 0 4 25.325 Pasaphu PS VR 7 6 5 7 8 13 17 13 0 0 0 0 0 0 32 37 69 1 3 0 4 17.326 Sakteng PS VR 7 50 42 46 40 27 27 12 0 0 0 0 0 0 158 86 244 1 6 0 7 34.927 Yangneer CPS SU 7 30 24 27 32 31 26 21 0 0 0 0 0 0 84 107 191 1 6 0 7 27.328 Gongthung CPS SU 7 35 41 19 22 26 22 18 0 0 0 0 0 0 84 99 183 1 5 0 6 30.529 Moshi CPS SU 7 23 33 27 25 27 24 26 0 0 0 0 0 0 100 85 185 0 6 0 6 30.830 Pam CPS SU 7 19 17 18 12 18 15 11 0 0 0 0 0 0 59 51 110 1 4 0 5 22.031 Barshong CPS SU 7 10 14 12 17 17 9 12 0 0 0 0 0 0 47 44 91 1 3 0 4 22.832 Rangshikhar CPS SR 6 8 10 0 12 5 9 8 0 0 0 0 0 0 29 23 52 0 2 0 2 26.0
67

33 Phegpari CPS SR 7 15 17 12 20 19 16 21 0 0 0 0 0 0 65 55 120 1 4 0 5 24.034 Saling CPS SR 7 16 15 11 14 22 14 14 0 0 0 0 0 0 52 54 106 1 6 0 7 15.135 Pakaling CPS SR 7 19 20 29 13 16 14 17 0 0 0 0 0 0 69 59 128 1 4 0 5 25.636 Tokshingmang CPS SR 7 24 20 38 47 43 31 31 0 0 0 0 0 0 132 102 234 1 5 0 6 39.037 Rongthung CPS SR 7 23 15 24 25 33 23 22 0 0 0 0 0 0 99 66 165 1 6 1 8 20.638 Tongling CPS SR 6 0 9 7 5 3 13 7 0 0 0 0 0 0 25 19 44 0 3 0 3 14.739 Thrakthrik CPS SR 2 5 15 0 0 0 0 0 0 0 0 0 0 0 13 7 20 0 1 0 1 20.040 Tshogonpa CPS R 7 12 11 14 16 9 18 13 0 0 0 0 0 0 44 49 93 1 3 0 4 23.341 Thrimshing CPS R 7 9 12 9 7 8 9 10 0 0 0 0 0 0 31 33 64 0 3 0 3 21.342 Ying Gom CPS R 4 12 10 17 11 0 0 0 0 0 0 0 0 0 21 29 50 1 1 0 2 25.043 Brekha CPS R 7 10 19 14 12 19 9 7 0 0 0 0 0 0 45 45 90 1 3 0 4 22.544 Yobinang CPS R 6 0 7 9 7 12 6 12 0 0 0 0 0 0 23 30 53 0 2 0 2 26.545 Kurichilo CPS R 7 23 27 21 20 22 24 23 0 0 0 0 0 0 102 58 160 0 5 0 5 32.046 Jangsheri CPS R 5 9 5 13 12 10 0 0 0 0 0 0 0 0 23 26 49 0 3 0 3 16.347 Samkhar CPS R 3 0 9 0 8 0 8 0 0 0 0 0 0 0 14 11 25 0 2 0 2 12.548 Joenkhar CPS R 6 0 9 11 14 13 15 9 0 0 0 0 0 0 41 30 71 1 2 0 3 23.749 Jomtshang CPS R 7 14 8 8 7 10 12 12 0 0 0 0 0 0 34 37 71 0 3 0 3 23.750 Chiya CPS R 7 16 16 12 15 13 6 16 0 0 0 0 0 0 46 48 94 0 5 0 5 18.851 Benshingmo CPS R 7 11 17 12 8 12 12 16 0 0 0 0 0 0 48 40 88 1 3 0 4 22.052 Jerelemi CPS R 7 15 17 20 6 14 9 9 0 0 0 0 0 0 47 43 90 1 2 0 3 30.053 Zordung (Threphuwoong) CPS R 3 15 13 19 0 0 0 0 0 0 0 0 0 0 29 18 47 0 2 0 2 23.554 Bepam CPS VR 7 13 15 20 15 7 13 10 0 0 0 0 0 0 43 50 93 0 3 0 3 31.055 Dungmanba CPS VR 7 23 14 14 8 10 12 12 0 0 0 0 0 0 41 52 93 0 3 0 3 31.056 Yabrang CPS VR 7 22 24 15 23 20 16 13 0 0 0 0 0 0 65 68 133 1 5 0 6 22.257 Thongrong CPS VR 7 18 9 16 7 11 15 6 0 0 0 0 0 0 44 38 82 0 3 0 3 27.358 Berdungma CPS VR 6 12 10 14 0 9 6 10 0 0 0 0 0 0 37 24 61 1 2 0 3 20.359 Threphu CPS VR 5 9 4 5 4 4 0 0 0 0 0 0 0 0 11 15 26 2 1 0 3 8.760 Ritsangdung CPS VR 2 26 27 0 0 0 0 0 0 0 0 0 0 0 28 25 53 0 1 0 1 53.061 Daliphangma CPS VR 3 14 25 16 0 0 0 0 0 0 0 0 0 0 28 27 55 0 2 0 2 27.5
Total 500 1274 1289 1305 1147 1193 1143 1047 985 943 857 716 371 289 6573 5986 12559 70 358 55 483 26.0
16 T/Yangtse1 Bayling HSS U 14 0 0 0 0 0 0 0 0 0 97 107 157 152 291 222 513 3 11 9 23 22.32 Tsenkarla MSS SU 20 38 33 20 25 26 26 35 52 64 183 151 0 0 362 291 653 5 20 1 26 25.13 Trashiyangtse LSS U 19 79 88 71 98 105 105 85 73 86 0 0 0 0 384 406 790 4 17 1 22 35.94 Kheni LSS SR 12 30 25 26 34 34 29 21 131 73 0 0 0 0 205 198 403 3 9 0 12 33.65 Tongijangsa LSS SR 10 26 17 22 20 33 22 29 64 44 0 0 0 0 131 146 277 1 8 0 9 30.86 Ramjar LSS SR 9 30 34 36 32 36 37 24 27 19 0 0 0 0 142 133 275 1 7 0 8 34.47 Bumdeling LSS SR 9 32 29 28 25 26 27 15 40 29 0 0 0 0 126 125 251 1 6 0 7 35.98 Jamkhar PS SR 7 13 18 17 18 19 38 24 0 0 0 0 0 0 68 79 147 1 6 0 7 21.09 Tarpel PS VR 7 25 16 7 15 18 16 13 0 0 0 0 0 0 65 45 110 0 3 0 3 36.7
10 Thragom CPS R 7 22 9 14 17 17 15 18 0 0 0 0 0 0 62 50 112 1 4 0 5 22.4
68

11 Duksum CPS SU 5 10 11 0 10 18 15 8 0 0 0 0 0 0 37 35 72 1 1 0 2 36.012 Tshangphuchen CPS SR 7 26 28 16 24 22 27 21 0 0 0 0 0 0 71 93 164 0 3 0 3 54.713 Tokaphu CPS SR 7 8 12 11 8 14 16 18 0 0 0 0 0 0 43 44 87 1 3 0 4 21.814 Tsaling CPS SR 5 23 10 9 12 11 0 0 0 0 0 0 0 0 38 27 65 0 3 0 3 21.715 Womanang CPS SR 7 16 9 14 8 10 15 11 0 0 0 0 0 0 43 40 83 0 3 0 3 27.716 Chakidemi CPS SR 7 10 25 17 14 10 13 10 0 0 0 0 0 0 47 52 99 0 4 0 4 24.817 Shongring CPS SR 5 12 13 11 0 17 17 0 0 0 0 0 0 0 43 27 70 0 2 0 2 35.018 Manam CPS SR 1 17 0 0 0 0 0 0 0 0 0 0 0 0 9 8 17 0 1 0 1 17.019 Pangtokha CPS R 7 13 10 17 14 15 17 16 0 0 0 0 0 0 46 56 102 1 2 0 3 34.020 Rabtey CPS R 3 0 16 0 4 10 0 0 0 0 0 0 0 0 15 15 30 0 1 0 1 30.021 Yallang CPS R 6 0 11 12 16 18 22 10 0 0 0 0 0 0 43 46 89 0 3 0 3 29.722 Shingkhar CPS R 5 15 19 16 16 7 0 0 0 0 0 0 0 0 29 44 73 0 2 0 2 36.523 Khamdang CPS R 8 38 32 41 69 35 29 25 0 0 0 0 0 0 127 142 269 1 5 0 6 44.824 Jangphutse CPS R 7 10 15 16 18 21 9 11 0 0 0 0 0 0 48 52 100 0 4 0 4 25.025 Langmadung CPS R 3 15 21 10 0 0 0 0 0 0 0 0 0 0 24 22 46 0 2 0 2 23.026 Shali CPS R 3 0 11 33 20 0 0 0 0 0 0 0 0 0 40 24 64 0 3 0 3 21.327 Dhalikhar CPS R 6 8 0 11 7 4 9 14 0 0 0 0 0 0 31 22 53 0 2 0 2 26.528 Lichen CPS VR 5 19 6 8 24 8 0 0 0 0 0 0 0 0 35 30 65 0 2 0 2 32.529 Dukti CPS VR 3 0 8 0 7 15 0 0 0 0 0 0 0 0 16 14 30 0 2 0 2 15.030 Melongkhar CPS VR 7 17 12 6 22 13 11 12 0 0 0 0 0 0 45 48 93 1 2 0 3 31.0
Total 221 552 538 489 577 562 515 420 387 315 280 258 157 152 2666 2536 5202 25 141 11 177 29.4
17 Trongsa1 Sherubling HSS U 13 0 0 0 0 0 0 0 81 72 69 85 58 63 227 201 428 3 12 4 19 22.52 Taktse MSS U 13 0 0 0 0 0 0 0 94 83 123 88 0 0 201 187 388 3 13 1 17 22.83 Tshangkha LSS SU 9 7 15 15 17 10 5 21 42 50 0 0 0 0 79 103 182 2 8 1 11 16.54 Kuengarapten LSS SU 9 15 14 21 19 20 24 23 27 32 0 0 0 0 95 100 195 3 6 0 9 21.75 Langthel LSS SR 32 28 28 48 36 48 34 55 61 49 0 0 0 0 163 224 387 3 13 0 16 24.26 Trongsa PS U 17 61 131 80 84 101 104 64 0 0 0 0 0 0 316 309 625 4 19 0 23 27.27 Bemji PS R 6 0 13 7 13 12 9 12 0 0 0 0 0 0 31 35 66 1 3 0 4 16.58 Korphu PS VR 7 13 3 11 11 12 14 18 0 0 0 0 0 0 44 38 82 1 4 0 5 16.49 Samcholing CPS SU 7 22 32 18 26 22 18 26 0 0 0 0 0 0 81 83 164 1 5 0 6 27.3
10 Tontongphey CPS SU 6 15 14 17 19 13 13 0 0 0 0 0 0 0 38 53 91 0 4 0 4 22.811 Namgaychoeling (Tangsibj CPS SR 6 12 13 13 13 6 7 0 0 0 0 0 0 0 31 33 64 0 2 0 2 32.012 Trashidingkha CPS SR 7 35 18 21 25 21 23 34 0 0 0 0 0 0 98 79 177 1 5 0 6 29.513 Baling CPS SR 6 15 14 25 22 13 17 0 0 0 0 0 0 0 47 59 106 1 3 0 4 26.514 Bjeezam CPS SR 7 15 17 23 12 16 16 13 0 0 0 0 0 0 67 45 112 1 5 0 6 18.715 Chendebji CPS SR 7 10 2 10 10 9 10 7 0 0 0 0 0 0 34 24 58 0 4 0 4 14.516 Kartegang CPS SR 2 29 13 0 0 0 0 0 0 0 0 0 0 0 21 21 42 0 1 0 1 42.017 Nimshong CPS R 6 12 15 16 16 15 5 0 0 0 0 0 0 0 44 35 79 0 3 0 3 26.318 Jangbi CPS R 6 13 13 11 8 8 7 0 0 0 0 0 0 0 29 31 60 1 2 0 3 20.019 Kela CPS R 5 13 0 9 7 7 9 0 0 0 0 0 0 0 20 25 45 0 2 0 2 22.5
69

20 Karshong CPS R 4 14 10 15 11 0 0 0 0 0 0 0 0 0 23 27 50 0 2 0 2 25.021 Simphu CPS R 5 6 8 7 7 9 0 0 0 0 0 0 0 0 19 18 37 0 2 0 2 18.522 Jongthang CPS R 3 4 2 19 0 0 0 0 0 0 0 0 0 0 11 14 25 0 2 0 2 12.523 Nabji CPS VR 6 15 19 17 10 0 12 14 0 0 0 0 0 0 48 39 87 0 3 0 3 29.0
Total 189 354 394 403 366 342 327 287 305 286 192 173 58 63 1767 1783 3550 25 123 6 154 23.1
18 Tsirang1 Damphu HSS U 18 0 0 0 0 0 0 0 0 0 150 151 130 133 333 231 564 5 14 8 27 20.92 Mendrelgang MSS SU 21 38 42 57 69 88 61 56 124 101 118 67 0 0 413 408 821 5 17 0 22 37.33 Damphu LSS U 31 107 127 169 178 173 167 148 212 146 0 0 0 0 711 716 1427 7 38 0 45 31.74 Tsirangtoe LSS R 12 37 43 64 47 54 58 67 65 53 0 0 0 0 271 217 488 1 13 0 14 34.95 Beteni PS SR 7 32 34 43 45 27 42 27 0 0 0 0 0 0 122 128 250 2 6 0 8 31.36 Salami PS SR 7 34 32 58 51 78 102 37 0 0 0 0 0 0 188 204 392 2 6 0 8 49.07 Shemjong CPS R 4 32 32 45 44 0 0 0 0 0 0 0 0 0 76 77 153 2 2 0 4 38.38 Gosaling CPS R 3 35 38 40 0 0 0 0 0 0 0 0 0 0 61 52 113 0 3 0 3 37.79 Patala CPS R 8 41 37 53 41 63 25 29 0 0 0 0 0 0 147 142 289 1 4 0 5 57.8
10 Gopini CPS R 2 35 38 0 0 0 0 0 0 0 0 0 0 0 35 38 73 0 2 0 2 36.511 Barshong CPS R 2 32 38 0 0 0 0 0 0 0 0 0 0 0 48 22 70 0 2 0 2 35.0
Total 115 423 461 529 475 483 455 364 401 300 268 218 130 133 2405 2235 4640 25 107 8 140 33.1
19 Wangdue1 Bajothang HSS U 16 0 0 0 0 0 0 0 0 0 145 126 115 131 275 242 517 5 21 5 31 16.72 Gaselo MSS U 10 0 0 0 0 0 0 0 0 0 127 118 0 0 110 135 245 2 10 4 16 15.33 Samtengang MSS SR 13 0 0 0 0 0 0 0 188 106 161 109 0 0 278 286 564 4 14 2 20 28.24 Wangdi LSS U 28 96 122 174 103 126 114 133 181 164 0 0 0 0 570 643 1213 5 29 2 36 33.75 Nobding LSS SR 11 40 43 42 23 29 27 23 79 82 0 0 0 0 204 184 388 3 10 0 13 29.86 Gaselo LSS SR 15 42 46 46 50 42 55 56 125 106 0 0 0 0 269 299 568 3 14 3 20 28.47 Tencholing PS U 23 148 148 170 122 118 114 92 0 0 0 0 0 0 454 458 912 7 26 0 33 27.68 Nahi PS SR 7 27 16 23 16 14 16 9 0 0 0 0 0 0 57 64 121 2 5 0 7 17.39 Rukubji PS SR 7 30 35 32 25 24 25 24 0 0 0 0 0 0 88 107 195 2 4 0 6 32.5
10 Phobjikha PS SR 11 51 38 47 53 57 54 55 0 0 0 0 0 0 145 210 355 3 10 0 13 27.311 Samtengang PS SR 12 59 50 57 58 34 52 38 0 0 0 0 0 0 179 169 348 3 12 0 15 23.212 Sha Tasha PS VR 7 31 41 41 42 41 36 25 0 0 0 0 0 0 121 136 257 2 5 0 7 36.713 Rinchengang CPS U 1 42 0 0 0 0 0 0 0 0 0 0 0 0 31 11 42 1 2 0 3 14.014 Sephu CPS SR 7 20 16 21 18 11 19 12 0 0 0 0 0 0 62 55 117 1 2 0 3 39.015 Bjena CPS SR 5 12 25 14 18 13 0 0 0 0 0 0 0 0 43 39 82 0 4 0 4 20.516 Rubesa CPS SR 5 23 15 10 19 27 0 0 0 0 0 0 0 0 37 57 94 0 3 0 3 31.317 Hebesa CPS SR 7 20 23 16 15 14 18 9 0 0 0 0 0 0 59 56 115 1 4 0 5 23.018 Bayta CPS SR 5 38 24 37 35 26 0 0 0 0 0 0 0 0 76 84 160 0 3 0 3 53.319 Migtana CPS SR 1 37 0 0 0 0 0 0 0 0 0 0 0 0 21 16 37 0 1 0 1 37.020 Kazhi CPS R 7 34 20 23 19 18 10 10 0 0 0 0 0 0 68 66 134 1 5 0 6 22.321 Khothaka CPS R 7 32 36 37 37 24 19 12 0 0 0 0 0 0 90 107 197 1 4 0 5 39.4
70

22 Dangchu CPS R 7 23 20 11 14 15 7 9 0 0 0 0 0 0 31 68 99 0 6 0 6 16.523 Phuensum Deki CPS R 5 15 18 21 13 18 0 0 0 0 0 0 0 0 37 48 85 0 5 0 5 17.024 Rameychen CPS R 7 25 25 22 32 32 29 22 0 0 0 0 0 0 83 104 187 2 3 0 5 37.425 Jala CPS R 7 15 15 17 11 6 5 7 0 0 0 0 0 0 38 38 76 0 6 0 6 12.726 Uma CPS R 7 11 15 19 16 7 11 9 0 0 0 0 0 0 48 40 88 1 3 0 4 22.027 Ada CPS VR 7 5 8 27 20 18 22 17 0 0 0 0 0 0 59 58 117 1 2 0 3 39.0
Total 245 876 799 907 759 714 633 562 573 458 433 353 115 131 3533 3780 7313 50 213 16 279 26.2
Zhemgang1 Zhemgang HSS U 19 0 0 0 0 0 0 0 83 111 144 159 119 139 415 340 755 2 16 9 27 28.02 Yebilepcha MSS SU 13 0 0 0 0 0 0 0 53 69 181 144 0 0 246 201 447 3 12 5 20 22.43 Zhemgang LSS U 18 74 79 84 64 71 72 59 55 42 0 0 0 0 295 305 600 4 16 1 21 28.64 Tingtibi LSS SU 14 55 45 50 57 48 43 52 66 70 0 0 0 0 242 244 486 3 12 3 18 27.05 Gomphu LSS SR 8 26 0 15 18 25 17 16 53 0 0 0 0 0 84 86 170 2 8 0 10 17.06 Panbang LSS R 14 46 53 42 67 45 66 51 127 110 0 0 0 0 338 269 607 1 12 0 13 46.77 Tshaidang PS SR 7 12 17 16 9 16 14 15 0 0 0 0 0 0 54 45 99 1 3 0 4 24.88 Buli PS SR 7 18 22 18 23 17 18 17 0 0 0 0 0 0 61 72 133 1 6 0 7 19.09 Shingkhar PS VR 7 14 25 18 29 27 20 17 0 0 0 0 0 0 70 80 150 1 5 0 6 25.0
10 Goshing PS VR 7 25 26 32 31 40 31 39 0 0 0 0 0 0 112 112 224 0 6 0 6 37.311 Nimshong PS VR 5 9 5 11 0 10 7 0 0 0 0 0 0 0 22 20 42 0 2 0 2 21.012 Pantang PS VR 7 14 16 15 34 52 25 23 0 0 0 0 0 0 100 79 179 1 5 0 6 29.813 Langdurbi PS VR 7 13 18 19 14 17 19 20 0 0 0 0 0 0 65 55 120 0 3 0 3 40.014 Bardo PS VR 7 15 15 12 12 12 10 16 0 0 0 0 0 0 46 46 92 1 3 0 4 23.015 Bjoka PS VR 7 17 16 16 27 21 26 22 0 0 0 0 0 0 81 64 145 1 6 0 7 20.716 Goling CPS SR 7 15 18 11 10 12 6 4 0 0 0 0 0 0 36 40 76 1 3 0 4 19.017 Tshanglajong CPS SR 6 3 10 3 9 16 5 0 0 0 0 0 0 0 21 25 46 0 1 0 1 46.018 Kikhar CPS SR 1 22 0 0 0 0 0 0 0 0 0 0 0 0 9 13 22 0 1 0 1 22.019 Repati CPS R 1 16 0 0 0 0 0 0 0 0 0 0 0 0 14 2 16 0 1 0 1 16.020 Digala CPS VR 4 8 7 21 28 0 0 0 0 0 0 0 0 0 28 36 64 0 1 0 1 64.021 Tradijong CPS VR 7 7 8 15 8 14 8 8 0 0 0 0 0 0 31 37 68 0 3 0 3 22.722 Thrisa CPS VR 7 8 14 15 13 16 16 21 0 0 0 0 0 0 53 50 103 0 4 0 4 25.823 Tashibi CPS VR 7 10 27 16 13 17 15 15 0 0 0 0 0 0 58 55 113 0 5 0 5 22.624 Tali CPS VR 7 12 9 16 10 3 13 10 0 0 0 0 0 0 37 36 73 1 2 0 3 24.325 Kaktong CPS VR 7 18 13 23 24 19 21 30 0 0 0 0 0 0 88 60 148 0 6 0 6 24.726 Dali CPS VR 3 5 8 2 0 0 0 0 0 0 0 0 0 0 8 7 15 0 1 0 1 15.027 Dunmang CPS VR 3 15 13 28 0 0 0 0 0 0 0 0 0 0 23 33 56 0 2 0 2 28.028 Barpong CPS VR 3 5 22 33 0 0 0 0 0 0 0 0 0 0 32 28 60 0 2 0 2 30.029 Budhasi CPS VR 3 24 25 34 0 0 0 0 0 0 0 0 0 0 31 52 83 0 2 0 2 41.530 Khomshar CPS VR 7 38 32 35 30 33 20 27 0 0 0 0 0 0 104 111 215 1 4 0 5 43.0
Total 220 544 543 600 530 531 472 462 437 402 325 303 119 139 2804 2603 5407 24 153 18 195 27.7
Grand Total 5238 16434 16097 16542 14996 15512 13815 12704 12328 10919 9699 7909 5426 4731 79527 77585 157112 916 4182 647 5745 27.3
71