generalized functional anova diagnostics for high
TRANSCRIPT

Generalized Functional ANOVA Diagnostics
for High Dimensional Functions
of Dependent Variables
Giles HookerCornell UniversityIthaca, New York
Abstract
We study the problem of providing diagnostics for high dimensionalfunctions when the input variables are known to be dependent. In suchsituations, commonly used diagnostics can place an unduly large emphasison functional behavior that occurs in regions of very low probability. In-stead, a generalized functional ANOVA decomposition provides a naturalrepresentation of the function in terms of low-order components.
This paper details a weighted functional ANOVA that controls for theeffect of dependence between input variables. The construction involveshigh dimensional functions as nuisance parameters and suggests a novelestimation scheme for it. The methodology is demonstrated in the contextof machine learning in which the possibility of poor extrapolation makesit important to restrict attention to regions of high data density.
Keywords: extrapolation, machine learning, variable importance, grid esti-mates
1 Introduction
This paper investigates the problem of diagnostics for high dimensional func-tions. A frequent source of such functions is in the field machine learning inwhich functions are estimated to predict some quantity of interest from a largeset of independent variables. This is the main motivating situation for this pa-per. Another setting in which these techniques are applicable is in the analysisof computer simulations. These functions have in common that they generallydo not have an easily understood algebraic formulation and may effectively beregarded as a ”black box”. Once such a function, F , is produced, there are anumber of questions that may be asked about it: Which variables are impor-tant? How does the function depend on them? In which variables are therestrong interactions? Does the function have a close representation in terms ofa sum of low-dimensional components?
1

Traditionally, diagnostics have been based on the average behavior of F asone or more variables are changed. Let x1, . . . , xd represent the d input variables.An effect can be defined for the first variable, x1, as being
f1(x1) =∫
F (x1, x2, . . . , xd)dx2 . . . dxd
where the integral is usually taken with respect to uniform measure over theinit cube. This definition fits into the formalism of the functional ANOVA thatprovides an elegant theoretical framework in which to understand these diag-nostics and build others. (Hooker 2004b) extends these diagnostics to measuresof variable and interaction importance, indicating how to represent a functionusing sums of low dimensional functions.
Problems arise with this form of diagnostic, however, when strong depen-dencies exist between the input variables. In such situations, integration over auniform measure can place a large amount of weight in regions of low probabil-ity mass. In machine learning, in which prediction functions are usually chosenfrom a very large class of candidates, function values in these regions shouldbe regarded as suspect. In other situations, we may not wish to place largeemphasis on functional behavior that occurs in regions of low probability.
The solution proposed in this paper relies on re-defining the functionalANOVA in terms of projections of the function of interest onto spaces of additivefunctions. Viewed in this context, the projection operator may be defined withrespect to any L2 weight function, provided certain identifiability constraintsare maintained.
We use a generalized definition of the functional ANOVA that is equivalentto one proposed by Stone (1994) and further studied by Huang (1998). Thesepapers examine the problem of function estimation from noisy data when thetrue function can be written as a sum of low dimensional components. Theyshow that good convergence results are obtainable when the correct set of com-ponents is used. This paper is somewhat different in focus; we expect that thefunction of interest is known, but that it cannot be recovered by low dimensionalcomponents. Instead, we wish to find a close representation of the function interms of such components. However, these components should not depend onspecifying a particular ANOVA structure.
Finding such a representation requires the estimation of high dimensionalcomponents for which the use of tensor-product bases examined in Stone (1994)are not computationally feasible. Instead, this paper proposes a novel estimationtechnique that involves estimating functions on a grid of points and we showthat this does provide a feasible estimate.
Structure of the paper
This paper begins with a demonstration of the problems associated withdiagnostic tools based on integral operators and lists a set of desired attributesin Section 2. It then presents a canonical description of the functional ANOVAin Section 3 and presents the proposed generalization in Section 4. We examine
2
this construction in the light of our desiderata in Section 5. We develop anovel estimation scheme to account for high-dimensional dependence in Section6 and suggest possible variations in Section 7. We present an estimate of samplevariance in Section 8. The method is validated in a simulated setting in Section9. We discuss the application of this methodology in the particular setting ofmachine learning in Section 10 and demonstrate its practical application to theCalifornia Housing data in Section 11.
The diagnostic tools proposed here assume a known and fixed function, anda known, fixed weight function. In practise the estimation of either is difficultand may produce highly variable results. In machine learning, there are manypossible estimation techniques, each of which will have its own variance proper-ties. We therefore have not included this source of variability into our analysis.However, we shall see that known additional variability in in either function canbe naturally incorporated into estimates of effect variance.
2 Integration and Extrapolation
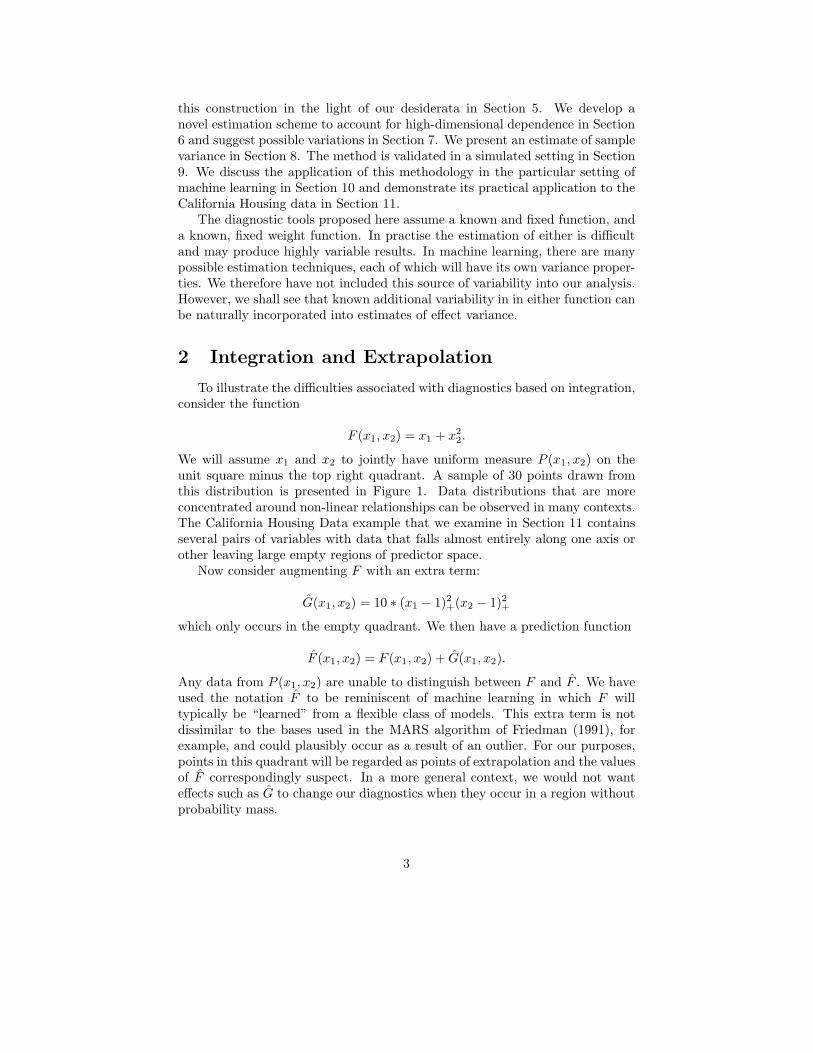
To illustrate the difficulties associated with diagnostics based on integration,consider the function
F (x1, x2) = x1 + x22.
We will assume x1 and x2 to jointly have uniform measure P (x1, x2) on theunit square minus the top right quadrant. A sample of 30 points drawn fromthis distribution is presented in Figure 1. Data distributions that are moreconcentrated around non-linear relationships can be observed in many contexts.The California Housing Data example that we examine in Section 11 containsseveral pairs of variables with data that falls almost entirely along one axis orother leaving large empty regions of predictor space.
Now consider augmenting F with an extra term:
G(x1, x2) = 10 ∗ (x1 − 1)2+(x2 − 1)2+
which only occurs in the empty quadrant. We then have a prediction function
F (x1, x2) = F (x1, x2) + G(x1, x2).
Any data from P (x1, x2) are unable to distinguish between F and F . We haveused the notation F to be reminiscent of machine learning in which F willtypically be “learned” from a flexible class of models. This extra term is notdissimilar to the bases used in the MARS algorithm of Friedman (1991), forexample, and could plausibly occur as a result of an outlier. For our purposes,points in this quadrant will be regarded as points of extrapolation and the valuesof F correspondingly suspect. In a more general context, we would not wanteffects such as G to change our diagnostics when they occur in a region withoutprobability mass.
3

0 0.5 1 1.5 20
0.5
1
1.5
2
x1
x2
A base distribution
Figure 1: A set of 30 points from a potential distribution of predictor variables.A quadrant with zero probability mass is indicated by the shaded region.
The effect of this extrapolation can be seen in Figure 2. These plots com-pare
∫F (x1, x2)dx2 with the conditional expectation E(F (x1, x2)|x1) and the
correct additive effect. Corresponding plots are given for the effect for x2. Bothdiagnostics are unsatisfactory. The integrated function is clearly influenced byG and this discrepancy can be made arbitrarily large. On the other hand, theconditional expectation fails to recover additive components and is distorted bythe change in the conditional distribution. The methods proposed in this paperrecover the desired effects.
Desiderata for diagnostics
Having illustrated the problems associated with diagnostic tools based onaveraging operators and before embarking on developing new tools, we shouldask what it is that a low-order representation of functional behavior shouldprovide. We suggest four main properties below.
Comprehensibility
Low order effects should represent some understandable and appropriatequantity. Since any low-dimensional representation of a function necessarilyremoves information about functional behavior, in what sense such a represen-tation captures that behavior should be well understood and appropriate.
4

0 0.5 1 1.5 21
2
3
4
5
6
7
8
x10 0.5 1 1.5 2
0
2
4
6
8
10
x2
Figure 2: A comparison of Functional ANOVA effects between F (x1, x2) (solid)and a learned approximation, F (x1, x2) (dashed). These two functions are in-distinguishable on the data in Figure 1. The left hand plot provides the ef-fect for x1, the right for x2. Dotted lines provide the conditional expectationsE(F (x1, x2)|x1) and E(F (x1, x2)|x2) with respect to the measure in Figure 1.
Optimality
A low dimensional representation should capture as much of the functionalbehavior as possible, under some well-defined metric. We would like to under-stand as much of the function as possible through visualizable effects. However,this can be too greedy in the sense that while individual effects may providea close approximation to functional behavior, taken together they can be mis-leading.
Additivity
A function that is truly additive in some set of variables on the support oftheir distribution should be exactly recoverable in terms of the additive compo-nents. Here, plots of conditional dependence are not satisfactory in being toogreedy in the sense above.
Faithfulness to the underlying measure
As demonstrated, product measures move probability mass to regions wherewe do not wish to measure, or place a large emphasis on, functional behavior.A good measure will put low weight on prediction values at these points.
5

3 The functional ANOVA
Diagnostics based on integral operators can be best understood through themachinery of the functional ANOVA. The definition of the functional ANOVAdecomposition is given as follows. Let F (x) : [0, 1]d → R be L2 over x =(x1, . . . , xd). We can then write
F (x) = f0 +d∑
i=1
fi(xi) +∑i�=j
fij(xi, xj) + . . . ,
a constant mean plus first order effects, plus second order effects and so on. Fordiagnostic purposes, we usually hope that F can be closely approximated by afew low-order terms.
For the generalization used in this paper, we will need to sum over allthe functional ANOVA effects. In order to make notation for that summationtractable we introduce the following multi-index notation: let u ⊆ {1, . . . , k},we denote by xu the subset of variables whose indexes are in u. Similarly x−u
indicates the variables with indexes not in u.We can now write F (x) as
F (x) =∑
u⊆{1,...,d}fu(xu)
with fu depending only on xu. For the sake of notational neatness, we writeu ⊆ d in place of u ⊆ {1, . . . , d} throughout the rest of the paper. With theseconventions, each effect fu is defined as
fu(x) =∫
x−u
(F (x) −
∑v⊂u
fv(x)
)dx−u, (1)
the integral of F over the variables x−u minus all the lower-order effects. Wewill refer to this as the ’standard’ functional ANOVA to distinguish it from ourproposed generalization.
A list of desirable properties for the functional ANOVA can be derived se-quentially:
Zero Means :∫
fu(xu)dxu = 0 for each u �= ∅.Orthogonality :
∫fu(xu)fv(xv)dx = 0 for u �= v.
Variance Decomposition : Let σ2(f) =
∫f(x)2dx then
σ2(F ) =∑u⊆d
σ2u(fu). (2)
We say that F is additive in u if we can write F (x) =∑
v⊂u gv(xv) for some{gv}v⊂u. In particular, if F is additive in u, then fu(xu) = 0 must hold. Thismeans that F is recovered exactly using terms of the lowest possible order.
6

The functional ANOVA decomposition has been studied in many contextsand appears in the literature as far back as Hoeffding (1948). Modern appli-cations have been in the study of Quasi Monte Carlo methods for integrationin Owen (2003). It has been used directly in a machine learning context andstudied in Stone (1994) and Huang (1998). Gu (2002) provides a comprehen-sive survey of this methodology and some recent numerical developments aregiven in Hegland (2002). Roosen (1995) and Jiang and Owen (2003) provideaccounts of the use of the standard functional ANOVA for the visualization ofhigh-dimensional functions. This definition should not be confused with thatgiven by Ramsay and Silverman (2005) in which a standard ANOVA variessmoothly with time.
This standard definition for the functional ANOVA already satisfies the firstthree desiderata outlined in the introduction. However, when the input variablesexhibit strong dependence, using this definition can place a large emphasis onregions that have low probability mass. In the next section we will present ageneralization that is also faithful to an underlying measure.
4 The functional ANOVA via projections
This paper makes use of a generalization of the functional ANOVA proposedin Stone (1994). We replace uniform measure on the unit cube with a generalmeasure w(x). The weighted functional ANOVA can be defined as the projectionof F onto a space of additive functions under the inner product
< f, g >w=∫
Rd
f(x)g(x)w(x)dx.
Explicitly, we will jointly define all the effects {fu(xu)|u ⊆ d} as satisfying
{fu(xu)|u ⊆ d} = argmin{gu∈L2(Ru)}u∈d
∫ ⎛⎝∑u⊆d
gu(xu) − F (x)
⎞⎠
2
w(x)dx (3)
under the hierarchical orthogonality conditions
∀v ⊆ u, ∀gv :∫
fu(xu)gv(xv)w(x)dx = 0. (4)
In fact, (3) will always be minimized at zero, providing an expansion of anyfunction in these terms. To see this, consider removing the full interaction termf{1,...,d} from (3), and defining it as the residual:
f{1,...,d}(x) = F (x) −∑u⊂d
fu(xu)
This is orthogonal to the closed set of functions which are additive in u by theprojection theorem (Luenberger (1969)) and therefore satisfies the conditions
7

(4). It will be useful, for the purposes of estimation, to retain the definition viathe optimality criterion and to remove the highest-order interaction.
This paper employs an equivalent definition for the functional ANOVA, re-placing (4) with explicit conditions defined for effects in L2. The followinglemma is proved in Appendix A:
Lemma 4.1. The orthogonality conditions (4) are true over L2(Rd) if and onlyif the integral conditions
∀u ⊆ d, ∀i ∈ u
∫fu(xu)w(x)dxidx−u = 0. (5)
hold.
That is, we require fu(xu) to integrate to zero with respect to the marginaldistribution of w on the variables xu, in each co-ordinate direction in u.
In Appendix B, we show that this definition leads to a unique decompositionunder general conditions on w. In particular, this is true whenever the supportof w is an open set. We also use these results in Section 6 when w consists of aseries of point masses on a grid.
It is easy to see that that the standard functional ANOVA effects are re-covered when w is given by uniform measure on the unit cube. Note that theconditions (5) usually appear as a consequence of the definition of the func-tional ANOVA save that the integral is now also taken over the variables x−u.This made no difference when w assumed the variables to be independent. It isrequired when the components are viewed as being the result of a projection.
A natural weight function to choose is the density function p(x) governingthe distribution of the input variables. The definition, however, is more generaland there are times when we might wish to use others. For example, if F (x) isregarded as being a realization of an heteroscedastic random process, we maywish w(x) to include information about its local variability. In machine learning,we may feel that it is more important to exclude large empty regions of predictorspace than to find an exact estimate of the density. Hooker (2004a) providesone algorithm for doing this.
5 Orthogonality, optimality and additivity
We will briefly examine the extent to which this decomposition satisfiesthe desiderata for functional diagnostics set out in the introduction. By defin-ing the functional ANOVA components in terms of a projection, we have al-ready demonstrated that the effects are a jointly optimal approximation toF . However, equation (3) does not easily satisfy our need for a comprehen-sible quantity. Further, it seems unrealistic to attempt to estimate all 2d ef-fects at once. Nonetheless, from (4), we can write an optimization criterionfor a single effect, defining fu(xu) as the first component of the collectiongu(xu), {gv(xv)|v ⊂ u}, g−u(x−u), {gv′(xv′ )| − u ⊂ v ⊆ −i, i ∈ u} that mini-mizes:
8

∫ ⎛⎝gu(xu) + g−u(x−u) +∑v⊂u
gv(xv) +∑i∈u
∑−u⊂v′⊆−i
gv′(xv′ ) − F (x)
⎞⎠
2
w(x)dx
(6)Here g−u is subject to the relaxed condition∫
g−u(x−u)w(x)dx−u = 0
and similarly ∫gv′⊂−j(xv′)w(x)dxjdx−u = 0
replaces the set of conditions given for each v ∈ −j and each j ∈ u. Effectively,we subsume
∑v⊂−u gv into g−u, treating x−u as a single variable, and relax our
constraints accordingly.We will make this explicit using a function F (x1, x2, x3, x4) with a four
dimensional argument and underlying measure μ(x1, x2, x3, x4). Suppose thatwe are interested in the effect f12. Then the orthogonality conditions (4) indicatethat f12 is orthogonal to g1234 = f123 + f124 + f1234. Further, although we needto estimate co-varying effects, we are happy to estimate g234 = f23 + f24 + f234
as a single function, similarly g134 and g34. This then requires us to estimatef12, f1, f2, g34, g134, g234 to minimize
∫(f12 + f1 + f2 + g34 + g134 + g234 − F )2 μ(x1, x2, x3, x4)dx1dx2dx3dx4.
This optimization must be done subject to the constraints (5). Firstly theunivariate effects integrate to zero:∫
f1(x1)μ(x1, x2, x3, x4)dx1dx2dx3dx4 = 0∫f2(x2)μ(x1, x2, x3, x4)dx1dx2dx3dx4 = 0
Then the effect f12 integrates to zero against μ for every value of x1 held con-stant. It also integrates to zero for every value x2 held constant.∫
f12(x1, x2)μ(x1, x2, x3, x4)dx2dx3dx4 = 0 ∀x1∫f12(x1, x2)μ(x1, x2, x3, x4)dx1dx2dx4 = 0 ∀x2
Finally, the controlling effects must each integrate to zero against μ while holdingone of their values constant. However, since we are not interested in separatingthe effects of x3 and x4, we only condition on both of these at once:∫
g34(x3, x4)μ(x1, x2, x3, x4)dx1dx2dx3dx4 = 0∫g134(x1, x3, x4)μ(x1, x2, x3, x4)dx2dx3dx4 = 0 ∀x1∫
g134(x1, x3, x4)μ(x1, x2, x3, x4)dx1dx2 = 0 ∀x3, x4∫g234(x2, x3, x4)μ(x1, x2, x3, x4)dx1dx3dx4 = 0 ∀x2∫
g234(x2, x3, x4)μ(x1, x2, x3, x4)dx1dx2 = 0 ∀x3, x4.
9

Throughout the paper we will use d′ to denote the cardinality of u. Theoriginal 2d − 1 terms have now been reduced to 2d′+1 − 1. Moreover, we cangroup the effects into two. Firstly, a projection,
∑v⊆u fv(xv) onto xu that we
would like to visualize and secondly, the remaining terms which act to controlfor the effect of covariance in the predictor variables.
In this setting we now have a comprehensible optimality criterion: we arefinding the best fit of F on the space of functions with no higher interaction thanu. Alternatively, fu is the best representation of F using only xu while control-ling for the additive effects of other sets of variables. Further, an examination ofthe form of the functions being optimized in (6) shows that if F really does havean additive component fu, then we must exactly recover F , and therefore fu.Finally, using an appropriate w allows us to concentrate the fitting criteria onregions that are regarded as important, usually through having high probabilitymass.
6 Grid measures and pointwise estimation
We have established a theoretical criterion by which we can produce a set ofdiagnostic tools that both preserve additivity and avoid evaluating a proposedfunction in regions of zero probability. In this section we propose a method toapproximate that criterion by a computationally feasible scheme.
For small d′, equation (6) presents a feasible number of terms to be esti-mated. However, we are still faced with the need to estimate 2d′−1 functionsof dimension d − 1 under integral constraints. For even moderate d, this isnot feasible using the tensor-products of piecewise polynomials studied in Stone(1994). The important realization here is that we are not interested in thosefunctions except to control for the covariance in the underlying predictor space.We will therefore confine ourselves to estimating all terms in the decompositiononly at a carefully chosen set of points.
Attempting to estimate these functions at a single point is, nominally, anunder-determined task - assuming the points to be distinct in all dimensions,the function can be recovered exactly at those points using only one predictor.However, following Lemma B.1, if the points are placed on a grid, then underthe right constraints the problem becomes a solvable linear system.
Let us start with a set of N points xi in Rd generated by a uniform dis-
tribution over the range of interest. Then we will take as our grid the set ofvalues:
{zj}Nd′+1
j=1 ={xu1,i1 , xu2,i2 , . . . , xuk,id′ , x−u,j
}N
i1,...,id′ ,j=1. (7)
This is formed by taking all possible combinations of values for the predictorsthat appear in the initial random collection. Here the vector x−u,j is treated as asingle value and its entries are not permuted with respect to each other. We willdenote by Iu the union of sets of subsets {v ⊆ u}, {−u}, {−u ⊂ v′ ⊆ −i|i ∈ u}.We will use the convention that zv,k denotes only those dimensions in the vectorzk which are indexed by v.
10
We now translate (6) into the problem of finding {fv(zv,k)|v ∈ Iu, k ∈1, . . . , N |v|} to minimize
Nd′+1∑i=1
w(zi)
(∑v∈Iu
fv(zv,i) − F (zi)
)2
(8)
under the constraints:
∀v ∈ Iu, ∀j ∈ v, ∀zv,k :N∑
i=1
⎛⎝d′−|v|+1∑
l=1
w(zv,i, z−v,l)
⎞⎠ fv(zv\j,k, zj,i) = 0 (9)
We can regard the effect values at the data points, fu(zi), as parameters tobe estimated. Then (8) can be written as a linear least squares problem:
minimise (Xf − F )T W (Xf − F ) (10)
where F is a vector whose ith component is F (zi), the vector f lists the value offu(zi) for each u and i and W is a diagonal matrix with w(zi) on the diagonal.This is minimized under the constraints (9), written as
Cf = 0. (11)
Here both X and C perform addition on the components of f . We index therows of X by k ∈ 1 . . .Nd′+1, corresponding to grid points. The columns areindexed by (v, j), for v ∈ Iu and j ∈ 1 . . .Nd′+1, corresponding to effects vevaluated at the grid points zv,j , then
[X ]k,(v,j) ={
1 if zv,j = zv,k
0 otherwise
This is a highly sparse system which corresponds to the matrix of effects thatwould be used to represent an ANOVA model for categorical predictors usingall but the highest-order interaction.
Cf is the matrix representation of (9). Its rows are indexed by (v′, j, k)corresponding to the sum over dimension j at zv′,k of fv′(zv′,k). Its columns areindexed the same way as X . We can then write the entries of C as being
[C](v′,j,k),(u,i) ={ ∑N
l=1 w(z−j,k, zj,l) if u = v and zv′\j,k = zu\j,i
0 otherwise .
This can be re-expressed as
C = Y W
with W representing a matrix with XT w on the diagonal and
11

[Y ](v′,j,k),(u,i) ={
1 if u = v and zv′\j,k = zu\j,i
0 otherwise
Solving via the method of Lagrange multipliers results in a very large, verysparse, weighted linear system of the form[
XT WX WY T
Y W 0
] [fλ
]=[
F0
]. (12)
where λ contains the set of Lagrange multipliers. To provide an idea of thepractical size of the system, using a grid with N points in each dimensions, thissystem has Nd′+1 equations in
d′∑j=0
(d′ + 1
j
)N j = (N + 1)d′+1 − Nd′+1 ≈ Nd′
unknowns and a further
d′∑j=1
(d′ + 1
j
)jN j−1 ≈ Nd′−1
constraining equations. Solving such a system is computationally feasible forsmall d′ and moderate N . Given that we are interested in visualizing effects oforder only 1 or 2, this is quite adequate.
Note that where w(z) is a product of univariate functions, this system exactlyreproduces the equivalent estimation of standard functional ANOVA effects, us-ing the zi as evaluation points. This can be seen by taking w to be a distributionof point masses on the grid of z’s.
The structure of this linear system allows for higher order effects if we employan iterative method. For large N or d′, even storing XT X can be prohibitive.However, since both X and C effectively act as known addition operators, theyneed not be stored at all. In this setting, Conjugate Gradient methods, canprovide a significant storage saving. See, for example, Press et al. (1997) for adescription of these methods and their properties.
The full product on Nd′+1 points is also not necessary. Lemma B.1 makesthe observation that identifiability only requires 2d′+1 points on a product gridunder the constraints (9). Thus we can reduce the computational complexitysignificantly by taking the original set of points in smaller groups and onlyforming products among those groups. The use of grid-based methods makethe estimates of fu(zk) highly correlated and produces smooth representationsof the effect when these points are interpolated. If multiple grids are used thatdo not share points, these estimates will become rough, necessitating a smoothwhen they are plotted.
A quick and easy alternative to the numerical methods suggested above is touse existing software for computing a weighted standard ANOVA with weightsgiven by the density at each evaluation point. Once a grid is formed and the
12

prediction and density functions evaluated on it, the values of that grid in eachdimension may be taken as being categorical values. An ANOVA, including allnecessary interactions, can then be calculated and the resulting coefficients usedas the vector f from (10). Standard ANOVA calculations do not include theconstraints (11), but instead typically set one co-efficient equal to zero. Thismay introduce a distortion since the effects will no-longer necessarily satisfy (4).Experimentation with such a method using the R statistical package found thatit gives very reasonable answers, but that it quickly became computationallyintensive when large numbers of grid points were used. Effect values can beundefined when there is zero marginal weight where they ought to occur. Rwas found to helpfully flag such values as missing and to produce holes in thecorresponding contour plots to indicate that this was the case.
7 Non-uniform sampling schemes
Using a base set of uniformly distributed points as the seed for the gridsused above suffers from the problem of poor coverage in large dimensions. Inparticular, if w is zero in large parts of predictor space, we run a risk of leavingthe solution to (8) undefined by giving weight zero to too many rows. Evenwhen a solution can be found, by effectively removing a large number of pointsfrom the estimation, we can increase the variance associated with the estimate.
An immediate solution to this problem is to try to concentrate the pointson regions of high weight and adjust w(x) accordingly. Since the points mustlie on a union of grids, using the original data as a seed and dividing w(x) bythe product of its marginals is a first solution.
There is a disadvantage to this approach in that we may desire to see theeffect plotted at points more uniformly distributed than the empirical marginalof the dimensions, xu, in question. In this case, taking a uniform sample, oruniformly-spaced points in only these dimensions may be appropriate. We canthen form a product distribution and divide by the marginal on x−u, treatingthis collection of variables as a single variate as in (6). This technique is em-ployed in Section 11. Quasi Monte Carlo approaches could also be used here toget a more even distribution of approximation points.
Specific models of the distribution of the underlying training data can pointto alternative, more efficient estimation schemes. Mixture of Gaussian models,or more general mixtures of products can be used to generate a grid measure foreach term in the mixture. These can then be employed to provide identifiabilityat both lower computational cost and avoiding using rows that are given zeroweight.
8 Estimates of sample variance
Variances for effect estimates are not commonly given as part of diagnosticsdisplays. Nonetheless, it is important to have some idea of how stable the dis-
13

played effects are. Estimates of effect variance under the proposed estimationscheme are complicated by two factors: the grid-based nature of the approxi-mation and the use of the weighting function w. The first of these will also bea concern for functional diagnostics based on the standard functional ANOVAwhen a set of grid points is used for evaluation. This occurs, for example, inthe partial dependence plots described in Section 10. In this section, we providean estimate of the variance of the proposed effect estimates and indicate how itmay accommodate variability in F and w.
While our effect estimates have a very similar flavor to that of the stan-dard (non-functional) ANOVA, the analysis of their variability is substantiallydifferent. For each point, the observation F (zi) can still be written as∑
v⊆u
gu,zi +∑j∈u
g−j,zi + g−u,zi + εi (13)
where εi =∑
v⊃u gv(zi). We have subscripted the zi here to mimic the standardANOVA effect. However, there may be dependence between εi and εj when itis known that zv,i = zv,k for some v. Moreover, the least squares criterion (8)is weighted by w(zi) which must also be considered to be random.
We propose a δ-method approximation of effect variance using the valuesw(zi) and w(zi)F (zi) as statistics. While these statistics are likely not to have anormal distribution, observe that the estimate as defined in (12) may be writtenas
f = Z(W )−1XT WF (14)
where Z(W ) represents the left hand side of (12). XT can be regarded as anaddition operator. In this case
XT(u,k),iG =
∑zu,j=zu,k
G(zj);
summing the weighted function values that correspond to the effect fu(xu,k).We now note that a sum in one co-ordinate j:
N∑i=1
w(zj,i, x−j)F (zj,i, x−j)
is a sum of independent random variables to which the central limit theorem canbe applied when we condition on x−j . Using these sums as statistics creates acomputationally more efficient estimate than using individual w(zi)F (zi) values.The resulting variance estimate will be the same, however, and we will employthe latter as providing a clearer exposition.
Similar calculations allow the terms XW to be expressed as sums of the w(xi)and hence the central limit theorem can also be employed with respect to them.Unfortunately, XT WX has terms involving individual w(xi), meaning that theδ-method approach must be regarded as being heuristic. We devote the rest of
14

this section to outlining how such an approach may be made computationallyfeasible.
The δ-method requires the derivatives of f with respect to WF and W . Thefirst of these is simply
Z(W )−1XT .
For the second, the derivative with respect to w(zi) may be given by
−Z(W )−1 dZ(W )dw(zi)
Z(W )−1XT WF = −Z(W )−1 dZ(W )dw(zi)
f
These vectors then form the columns of a large matrix which may be re-expressedas
−Z(W )−1
[XT F + λXT
Y fXT
]= −Z(W )−1D
where F and λ are a diagonal matrices with diagonals Xf and Y T λ respectivelyand f has f on the diagonal.
The covariance matrix of f and λ can now be written as
Z(W )−1[XT ΣF X − XT ΣFW DT − DΣT
FW X + DΣW DT]Z(W )−1
where ΣF , ΣW and ΣFW represent the co-variance matrices for F , W andbetween F and W respectively. These are calculated from the data, taking intoaccount the grid structure of the estimation. In particular, w(zi) and w(zj)are given non-zero correlation, σ2
v , if zi and zj agree on some subset v of theirindexes. This is calculated by the sample correlation of all pairs w(zi) and w(zj)for which zv,i = zv,j. There are 2Nd′
correlated pairs among N2(d′+1) entries inΣW , making this very sparse. ΣF and ΣFW are calculated in the same manner.
These estimates change if we fix the values of the estimation points in thedimensions u – we typically will take a fixed grid in the dimension of interest. Inthis case we need to calculate σ2
v,i for each point i in this grid. In this case, thematrices Σ become more sparse since the correlation between any two points isnon-zero only if they share the same z−u,k.
If F or w, or both, are regarded as random and some knowledge is assumedof their variance at each of the evaluation points, then the covariance matricesΣ may be augmented with these variances as well.
It is natural to view the proposed approximation to the effect fu as beinggiven by a linear interpolation of the calculated effect values. This would cor-respond to a finite element discretization of (6). Huang (1998) demonstratesthat a finite-element approach provides a consistent estimate and gives rates ofconvergence under independent sampling. The approach in this paper, however,involves terms of dimension d − 1 which are not amenable to a finite elementapproximation. If they were, the problem would reduce to straight-forward nu-merics. More formal analysis of these techniques are beyond the scope of this
15

paper, but would require the high dimensional terms to be explicitly regardedas nuisance parameters.
9 A simulated demonstration
The goal of the paper is to produce a diagnostic effect for a variable orset of variables that is capable of recovering additive functions while avoidingdistortion by functional behavior in regions of low probability. This sectiondemonstrates that the proposed weighted functional ANOVA, by taking otheradditive functions into account, does exactly this. This is true even if theadditive components share variables.
The example that we present is defined on the unit cube. We will take as afunction
F (x, y, z) = xy + xz + yz (15)
to which we will add a spurious term,
5I(x > 1/2, y > 1/2, z > 1/2)
where I(x > 1/2, y > 1/2, z > 1/2) is the indicator of all of x, y and z beinggreater that 1/2. This results in an approximation
F (x, y, z) = F (x, y, z) + 5I(x > 1/2, y > 1/2, z > 1/2)
We have chosen an indicator function to be particularly visible in contour plots.When the term is only non-zero outside the support of the underlying measure,we do not wish it to appear in the estimated effects.
To evaluate the weighted functional ANOVA, a sample of ten uniformlydistributed points was drawn and the product distribution of these points takenas in (7). Figure 3 presents contour plots of the second order effects for x andy for this function defined on three different measures. The first of these is theunit cube providing the standard functional ANOVA effects and the distortiondue to the spurious term is evident. The second subtracts the upper corner fromthe cube - exactly that part of the cube in which the spurious effect occurs. Herethe desired components – fφ + fx(x) + fy(y) + fxy(x, y) = xy – are recoveredexactly. The final distribution further removes all the upper corners from eachof the faces of the cube, leaving an “L”-shaped marginal distribution in eachpair of variables such as in Figure 1. The bivariate effects are again recovered,apart from in the top right corner where they are left appropriately undefined.
The second row of Figure 3 plots the corresponding standard deviationsof the effect estimates. Here, the standard deviation for the original functional
ANOVA effect is proprotional to the point-wise variability√
var(F (x, y, z)|x, y).However, the standard deviations for the generalized ANOVAs are quite differ-ent; effects are more variable in regions where the density has smaller supportand there are correspondingly fewer grid points, even though F has less variationover that support.
16

Uniform Corner-Deleted L-shaped marginals
0 0.2 0.4 0.6 0.8 10
0.2
0.4
0.6
0.8
1
0.2 0.4
0.4
0.4
0.6
0.6
0.6
0.8
0.8
0.8
1
1
1
3.3
3.3
3.5
3.5
3.7
3.7
3.9
4.1
x
y
0 0.2 0.4 0.6 0.8 10
0.2
0.4
0.6
0.8
1
0 0.2
0.2
0.4
0.4
0.4
0.6
0.6
0.6
0.8
0.8
0.8
1
1
1.2
1.2
1.4
1.6
1.8
x
y
0 0.2 0.4 0.6 0.8 10
0.2
0.4
0.6
0.8
1
x
y
00.1
0.2
0.2
0.3
0.3
0.3
0.4
0.4
0.4
0.5
0.5
0.5
0.6
0.6
0.6
0.7
0.7
0.8
0.8
0.9
0.9
1
1
0.02 0.04
0.04
0.06
0.06
0.06
0.08
0.08
0.08
0.1
0.1
0.1
0.1
0.12
0.1
2
0.12
0.14
0.140.14
0.90.9
0.9
2
0.92
0.94
x
y
0 0.2 0.4 0.6 0.8 10
0.2
0.4
0.6
0.8
1
0.04 0.06
0.06
0.0
8
0.08
0.08
0.1
0.1
0.1
0.1
2
0.12
0.12
0.1
4
0.14
0.14
0.14
0.160.16
0.160.16
0.1
6
0.4
2
0.42
0.4
8
0.48
0.5
0.5
0.52
0.52
0.54
0.56
x
y
0 0.2 0.4 0.6 0.8 10
0.2
0.4
0.6
0.8
1
0.04
0.06
0.06
0.0
6
0.080.08
0.0
80.1
0.1
0.1
0.1
2
0.12
0.12
0.1
4
0.1
4
0.16
0.16
x
y
0 0.2 0.4 0.6 0.8 10
0.2
0.4
0.6
0.8
1
Figure 3: Bivariate effects for x and y for the function (15) defined on threesuccessively more compact measures, the marginal distribution of each measuregiven by background shading. The bottom row gives point-wise standard errorsfor the effect plotted above.
10 Diagnostics for machine learning
Many current diagnostic tools make use of the standard functional ANOVAor some version of it. In doing this, they form product distributions at leastbetween sets of predictors. As such, they are vulnerable to distortion by effectsoccurring in regions of low probability. The functional ANOVA was employedwith a uniform distribution by Jiang and Owen (2003) and Roosen (1995) toprovide bivariate plots of low dimensional effects. A plot given for the effect ofxu would show
Fu(xu) =∑v⊆u
fv(xv),
the direct projection of F onto the subspace of predictors xu. Roosen (1995)suggests the presentation of a matrix of plots. Effects for individual predictorswould be given in the diagonal elements, with elements above the diagonalproviding the corresponding bivariate effect. Below the diagonals, we give theconditional variance of F at xu. That is∫
(F (x) − Fu(xu))2dx−u
17

which indicates the variability of F at the point xu. This also corresponds tothe sampling variability of a Monte Carlo integration and is used to create onestandard error bounds around the main effect plots. We have demonstrated thispresentation in Figure 5. We note, in particular, that if F can be expressed asGu(xu) + G−u(x−u), this variance should be constant. Neither constant vari-ance, nor the correspondence between variation and sample variance are main-tained for weighted functional ANOVAs. In this case it would be appropriateto display the weighted conditional variance:∫
w(x)(F (x) − Fu(xu))2dx−u.
in sub-diagonal elements. This quantity has been employed in Figure 6.The influence of the underlying distribution on effects has been partially
recognized in machine learning diagnostics. Friedman (2001) proposes plottingthe partial dependence, given by
fu(xu) =∫
x−i
F (x)dP−u (16)
where P−u is the marginal distribution of x−u. P−u can then be approximatedby the empirical marginal, giving the data-based estimate:
fu(xu) =1N
N∑i=1
F (xu, xi,−u). (17)
Both Friedman (2001) and Linton and Nielsen (1995) note that this estimaterecovers additive or multiplicative components up to constants.
Viewed as a projection operator, rather than as integration, this estimatecorresponds to the projection with respect to the measure Pu(xu)P−u(x−u),implicitly assuming xu and x−u to be independent. For the bivariate plotsdescribed in the introduction, the standard functional ANOVA is equivalent tothe partial dependence plot, both of them being misleading. Breiman (2001)makes use of a similar idea – randomly permuting the values of one of thevariables – to develop measures of variable importance.
The concern of this paper is is that a product distribution can place poten-tially large probability mass in areas of extrapolation. In these areas functionalbehavior is dictated by the properties of the particular learning technique em-ployed rather than the behavior of observed data. This can lead to significantdistortions in the effects that are presented. Polynomial models and models us-ing corresponding kernels can exhibit large Gibbs effects away from data. Thesethen produce effects that exibit larger variation than actually exists. More con-servative models that tend to finite constants at infinity are also problematicin allowing potentially interesting effects to be dampened out by large, emptyregions in which the function is close to flat. Further, both Gibbs effects andsome types of constant extrapolation – notably tree models – are highly variableunder re-sampling of the data. This results in unstable and misleading plots.
18

11 The California Housing Data
To illustrate the proposed methodology, we make use of the California Hous-ing Data, introduced in Pace and Barry (1997) as a real world demonstration.This data consists of the median house prices along with demographic variablesin 20640 regions of California, collected based on U.S. Census data. We re-moved 52 extreme outliers and used as attributes median income, median houseage, average number of bedrooms, population, average occupancy, latitude andlongitude co-ordinates to predict median house price given in units of $100,000.In order to do this, we used an ε−support vector machine, trained on thesedata using the default values in the MATLAB package libsvm from Chang andLin (2001). Support Vector Machines may be thought of as a kernel-regressionmethod that optimizes a soft-threshholded absolute-value criterion. For ourpurposes the resulting prediction function can be thought of simply as a blackbox.
There are several features of the California Housing Data that make it aninteresting example. The underlying distributions among some of the variablesmimic the distributions used above to describe problems with the standardfunctional ANOVA. In particular, ”L”-shaped bivariate distributions can beobserved between the average number of bedrooms, median income and averageoccupancy. Figure 4 demonstrates these distributions. Logically, the threevariables together must have a distribution similar to that used in the final plotin Figure 3. We also include a scatter plot of the latitude-longitude values forthese regions which we use as readily-understandable predictors on which todemonstrate functional effects.
Figure 5 presents a matrix of plots created using the method of partialdependence plots described above. The Support Vector Machine used is basedon a Gaussian kernel, meaning that its value tends to a constant away from data.The California Housing Data are highly concentrated and functional ANOVAtechniques based on a uniform distribution places so much emphasis on regionswithout data that the resulting effects are flat.
Here, both latitude and longitude show two peaks which correspond to theLos Angeles and San Francisco metropolitan areas. This is confirmed in thebivariate contour plot which also indicate a large reduction in house prices inthe Central Valley. The plot of bivariate conditional variance indicates thatthese peaks are also the region in which the Support Vector Machine showsgreatest variation. This is unsurprising; metropolitan areas have the greatestnumber and diversity of regions, providing more data in the remaining predictorvariables for the Support Vector Machine to use.
We now employ the weighted functional ANOVA . We have used the tech-niques in Hooker (2004a) to provide an estimate of the density of the predictorsfor the California Housing Data. This method represents the density as a bi-nary tree, taking constant values on non-overlapping rectangles. It attempts toclassify each point in predictor space as being either from the original data orgenerated from a uniform distribution. This density has then been used as aweight function in the weighted functional ANOVA and we have taken a set of
19

0 2 4 6 8 100
2
4
6
8
10
Average Bedrooms
Avera
ge O
ccupancy
0 5 10 15 200
2
4
6
8
10
Median Income
Avera
ge B
edro
om
s
0 5 10 15 200
2
4
6
8
10
Avera
ge O
ccupancy
Median Income−124 −122 −120 −118 −11632
34
36
38
40
42
longitude
latitu
de
Figure 4: Bivariate distributions for the California Housing Data. Clockwise:average number of bedrooms and average occupancy, median income and av-erage number of bedroms, median income and average occupancy and latitudeand longitude.
121 uniform grid points on the dimensions of interest, and 50 randomly sam-pled training points for the noise dimensions. The weight function has thenbeen divided by the marginal distribution on the noise variables.
Figure 6 compares the standard and weighted effects for this function on lat-itude and longitude. Both effects show noticeably greater peaks and variation,suggesting that the flat regions of extrapolation that made plots based on theuniform distribution flat, have also flattened out the effect for the partial depen-dence plot. The plot of bivariate weighted conditional variance also indicatesgreater concentration of variability in regions of high data density.
20

34 36 38 400.85
0.9
0.95
1
1.05
1.1
1.15
1.2
latitude
latitude main effect
0.85
0.9
0.9
0.9
0.9
0.9
5
0.95
0.9
5
0.95
0.950.
95
0.95 0.95
1
1
1
1
1
1
1
1
1
1
1
1.0
5
1.05
1.05
1.05
1.05
1.05
1.05
1.1
1.1
1.1
1.1
1.1
1.1
1.15
1.1
5
1.1
5
1.1
5
1.2
1.2
1.21.2
1.25
longitude
latitu
de
lat−lon joint effect
−124 −122 −120 −118 −116
33
34
35
36
37
38
39
40
41
longitude
latitu
de
lat−lon conditional variance
−124 −122 −120 −118 −116
33
34
35
36
37
38
39
40
41
0
0.01
0.02
0.03
0.04
0.05
0.06
0.07
0.08
−124 −122 −120 −118 −116
0.9
1
1.1
1.2
1.3
longitude
longitude main effect
Figure 5: A matrix of plots of effects for a regression Support Vector Machinetrained on the California Housing Data. The effects for latitude and longitudeare plotted in the diagonal elements. The upper diagonal provides the bivariateeffect and the lower diagonal the functional variance conditioned on the bivariatevalues of the two predictors.
12 Conclusion
This paper has presented a new approach to diagnostics for high dimensionalfunctions that takes into account the distribution of the input variables. Thisdistribution can have an important influence on the presentation of low dimen-sional effects and scores for variable importance. In machine learning, it alsoallows us to avoid regions of extrapolation where learned functions are unlikelyto provide reliable values.
The approach we take is developed through a weighted version of the func-tional ANOVA and we have proposed a novel estimation scheme to account forhigh dimensional co-variance among predictors. The scheme is computationally
21

34 36 38 400.85
0.9
0.95
1
1.05
1.1
1.15
1.2latitude weighted effect
latitude
0.4
0.6
0.8
0.8
0.8
0.8
1
1
1
11
1
1
1
1 11
1.2
1.2
1.2
1.2
1.2
1.4
1.4
longitude
latitu
de
lat−lon weighted effect
−124 −122 −120 −118 −116
33
34
35
36
37
38
39
40
41
longitude
latitu
de
lat−lon weighted variance
−124 −122 −120 −118 −116
33
34
35
36
37
38
39
40
41
0.2
0.4
0.6
0.8
1
1.2
−124 −122 −120 −118 −116
0.9
1
1.1
1.2
1.3longitude weighted effect
longitude
Figure 6: The effect of a regression Support Vector Machine trained on the Cali-fornia Housing Data for latitude and longitude. Generalized effects are given bysolid lines, standard effects by dashed lines on the diagonal plots. Thin dashedlines provide bounds based on the conditional variance of the Support VectorMachine and dotted lines give one standard error bounds based on the varianceof the effect estimate. The upper diagonal element presents the generalizedbivariate effect and the lower the generalized conditional variance.
intensive, involving the solution of a large, weighted linear system. However, itcan be made computationally tractable by exploiting the sparsity of the systemin a straight-forward manner. We have also provided approximate estimates ofthe variation due to sampling on a random grid. We have assumed that boththe prediction and weight functions are known and fixed, but indicated waysin which known uncertainty in each may be incorporated into the estimatedvariability of the scheme.
22

Acknowledgements
The author would like to thank Jerry Friedman and Art Owen for thought-ful comments in the development of the material. Input from Jim Ramsaysubstantially improved the presentation.
A Proof of Lemma 4.1
Lemma 4.1 The orthogonality conditions (4) are true over L2(Rd) if andonly if the integral conditions
∀u ⊆ d, ∀i ∈ u
∫fu(xu)w(x)dxidx−u = 0. (18)
hold.
Proof. If (5) is true, let i ∈ u\v. Then fv(xv) is constant across xi and x−u and
∫fv(xv)fu(xu)w(x)dxidx−u = fv(xv)
∫fu(xu)w(x)dxidx−u = 0.
Now suppose (5) to be false and∫fu(xu)w(x)dxidx−u �= 0
for some u, i and xu\i on a set of positive measure. The notation u\i indicatesu\{i} – the set u with element i removed. We can assume, moreover that (5)does hold for all v �= u and j �= i. Then set v = u\i and
fv =∫
fu(xu)w(x)dxidx−u.
It is easy to verify that (5) does hold for fv. However
< fu, fv >w=∫ (∫
fu(xu)w(x)dxidx−u
)2
dxu\i �= 0.
B Existence and uniqueness
In this appendix, we consider situations under which the generalized Func-tional ANOVA decomposition has a unique expression. Stone (1994) considereda decomposition defined for densities defined on hyper-rectangles of R
d andbounded away from zero and infinity. However, somewhat less restrictive con-ditions may be used and will show that the estimates given by (8) are alsounique.
23

For degenerate distributions - a bivariate distribution having support only onthe line x1 = x2, for example - any function F (x1, x2) can be exactly representedon the support of the distribution by f1(x1) = F (x1, x1) or f2(x2) = F (x2, x2).However, it is possible to show that a unique solution does exist under mildconditions on w(x).
In this section we outline the conditions under which the generalization iswell defined. The regularity condition that we require is the notion of gridclosure:
Definition B.1. A set Ω ⊆ Rd is grid closed if for any x ∈ Ω and u ⊂ d there
exists {yu �= x} ∈ Ω such that yuu = xu.
This means that for any point in Ω, we can move in each co-ordinate directionand find another point. For the sake of the simplicity of language, we willassociate a function with its support.
Definition B.2. A measure w is said to be grid closed if supp(w), is grid closed.
We have used the name “grid closed” to suggest the existence of a grid inΩ for every point x ∈ Ω. In fact, a full grid is not necessary and it is possibleto define fractal sets that are grid closed but which do not contain any grid.Nonetheless, for practical purposes we will use a full grid.
Grid closure is a weak condition implied by more common regularity condi-tions. In particular, any open set is grid closed. This notion of directly motivatesthe approximation scheme in Section 6 through the following observation:
Lemma B.1. Any grid or union of grids is grid closed.
Grid closure is essential to the following result
Lemma B.2. Let w be grid closed. For any {gu|u ⊆ d} ∈ L2w with at least
one gu �= 0 that satisfy the integral constraints (5), {gu|u ⊆ d} are linearlyindependent under the inner product defined by w.
Proof. Suppose {gu|u ⊆ d} are linearly dependent and write∑v⊆d
αvgv = 0
with αv = 0 if gv = 0. Choose u such that αu �= 0 and αv = 0, ∀v ⊃ u. Thengu =
∑v �⊃u βvgv.
Consider any point x = (xu, x−u) ∈ Ωw. By grid closure, there is some otherpoint y = (xu, y−u) ∈ Ωw. For any such y ∈ Ωw
gu(x) =∑v �⊃u
βvgv(xu, x−u) =∑v �⊃u
βvgv(xu, y−u) = gu(y)
and therefore for any given z−u, gu(xu) =∑
v �⊃u βvgv(xu, z−u) can be writtenas
24

∑v �⊃u
βvgv(xu, z−u) =∑v⊂u
fv(xv). (19)
for some functions {fv}v⊂u Now, observe that (4) implies∫gu(xu)fv(xv)w(x)dx = 0
for any fv by the condition (5). gu is therefore orthogonal to∑
v⊂u fv(xv) andwe must have gu = 0.
Grid closure is necessary here to ensure (19) holds. To demonstrate this,return to the example of a bivariate w with support only on the line y = x. Onthe support of w, f(x) = f(y) for any f and we cannot insist on being able towrite (19).
Linear independence states that each function has a unique representationin terms of lower order components. It is easy to see that the set
G =
{g : g =
∑v⊂d
gv(xv)
}
is closed in L2 under the inner product defined by w. Using the conditions (4),the following is now a direct corollary of the projection theorem (Luenberger(1969)):
Theorem B.1. For w grid closed and f ∈ L2w, (3) has a unique minimizer
under the constraints (5).
References
Breiman, L. (2001). Random forests. Machine Learning 45, 5–32.
Chang, C.-C. and C.-J. Lin (2001). Libsvm : a library for support vectormachines.
Friedman, J. H. (1991). Multivariate adaptive regression splines. Annals ofStatistics 19 (1), 1 – 141.
Friedman, J. H. (2001). Greedy function approximation: A gradient boostingmachine. Annals of Statistics 29 (5), 1189–1232.
Gu, C. (2002). Smoothing Spline ANOVA Models. New York: Springer.
Hegland, M. (2002). Adaptive sparse grids. In Proceedings of the 10th BiennialComputational Techniques and Applications Conference.
Hoeffding, W. (1948). A class of statistics with asymptotically normal distri-butions. Annals of Mathematical Statistics 19, 293–325.
Hooker, G. (2004a). Diagnosing extrapolation: Tree-based density estimation.In Proceedings of the Tenth ACM SIGKDD International Conference onKnowledge Discovery and Data Mining.
25

Hooker, G. (2004b). Discovering anova structures in black box functions.In Proceedings of the Tenth ACM SIGKDD International Conference onKnowledge Discovery and Data Mining.
Huang, J. Z. (1998). Projection estimation in multiple regression with appli-cation to functional anova models. Annals of Statistics 26, 242–272.
Jiang, T. and A. B. Owen (2003). Quasi-regression with shrinkage. Math.Comput. Simul. 62 (3-6), 231–241.
Linton, O. and J. P. Nielsen (1995). A kernel method of estimatingstructured nonparametric regression based on marginal integration.Biometrika 82 (1), 93–100.
Luenberger, D. G. (1969). Optimization by Vector Space Methods. New York:John Wiley & Sons.
Owen, A. B. (2003). The dimension distribution and quadrature test func-tions. Statistica Sinica 13 (1).
Pace, R. K. and R. Barry (1997). Sparse spatial autoregressions. Statisticsand Probability Letters 33, 291–297.
Press, W. H., S. A. Teukolski, W. T. Vetterling, and B. P. Flannery (1997).Numerical Recipes in C: The Art of Scientific Computing. Cambridge Uni-versity Press.
Ramsay, J. O. and B. W. Silverman (2005). Functional Data Analysis. NewYork: Springer.
Roosen, C. (1995). Visualization and Exploration of High-Dimensional Func-tions Using the Functional Anova Decomposition. Ph. D. thesis, StanfordUniversity.
Stone, C. J. (1994). The use of polynomial splines and their tensor productsin multivariate function estimation. Annals of Statistics 22, 118–171.
26