generation of fviii-specific tregs expressing a chimeric
TRANSCRIPT

Generation of FVIII-Specific Tregs Expressing a Chimeric Antigen Receptor (CAR) to Suppress
Inhibitor Development in Hemophilia A Mice
Rania Saboungi
Microbiology and Cell Science
College of Liberal Arts and Sciences
University of Florida
Mentor: Dr. Roland Herzog
Department of Pediatrics
College of Medicine
University of Florida
�1

Abstract
The development of inhibitory antibodies in hemophilia A patients who receive coagulation fac-
tor VIII (FVIII) replacement therapy necessitate new therapies to generate antigen-specific toler-
ance. Chimeric antigen receptors (CAR) are recombinant molecules that combine antigen bind-
ing and T-cell signaling functions by redirecting immune reactivity toward a chosen antigen. For
this project, we combined the specificity of CAR technology with regulatory T cell (Treg) thera-
py to produce human FVIII specific Tregs. We complexed the single-chain antigen recognizing
variable fragments of a human FVIII antibody to primary and co-stimulatory T cell signaling
domains (CD3ζ and CD28). We then inserted the CAR molecule into naturally occurring Tregs
to generate FVIII specific CAR-Tregs to suppress inhibitory antibody formation in hemophilia A
mice. The exquisite specificity of antigen recognition and signaling by CAR-Tregs may also re-
sult in activation-induced cell death (AICD) of the transduced cells. I am testing a series of muta-
tions in the Immunoreceptor Tyrosine-based Activation Motifs (ITAMs) of the CD3ζ chain do-
main, in order to dampen activation signals, which would help find a balance between antigen
specific activation and AICD of the CAR-Treg. These results should provide us with a superior
cell-therapy protocol for immune tolerance to hemophilia.
�2

Introduction
Hemophilia
Hemophilia A is a recessive X-linked clotting factor disorder in which patients have a de-
ficiency in coagulation factor VIII (FVIII). This lack of antihemophilic globulin causes critical
bleeding episodes in patients, as their body’s ability to form blood clots is impaired. The severity
of hemophilia is classified based on the percentage of normal FVIII levels present in the blood.
Persons with 5-40% FVIII level have mild hemophilia, persons with 1-5% FVIII level have
moderate hemophilia, and persons with <1% FVIII level have severe hemophilia (Rosendaal et
al., 2001). About 67% of patients suffer from severe hemophilia, and the majority of bleeding
cases are spontaneous while about one quarter of incidents occur after a trauma or injury (Baudo
et al., 2012).
Current hemophilia A treatment is based on plasma-derived or recombinant FVIII protein
replacement therapy. However, 20-30% of patients develop inhibitory anti-FVIII antibodies (in-
hibitors) when undergoing said therapies (Iorio et al., 2010). Conventionally, those patients are
then treated by Immune Tolerance Induction (ITI), which consists of frequent administrations of
high dose FVIII for a prolonged period ranging from 9-48 months; however, that method is time-
consuming, expensive, and sometimes ineffective (Yoon et al., 2016). Consequently, new thera-
pies to generate tolerance in hemophilia to prevent and reverse inhibitor formation, are emerging
(Sherman et al., 2017).
Regulatory T cells (Treg)
The adaptive immune system is comprised of B cells and T cells, which control humoral
immunity and cell-mediated immunity, respectively. T cells originate from hematopoietic stem
cells and differentiate into cells expressing either the CD4 glycoprotein or the CD8 glycoprotein
�3

on their surface. Regulatory T cells (Tregs) are CD4+ T cells that suppress innate and adaptive
immune cells and induce self-tolerance (Sakaguchi et al., 2006). To further understand their role,
let’s examine two contrasting human diseases. In cancer, an excess of Treg activity can inhibit
effector T cells from suppressing anti-tumor immunity, thus preventing the immune system from
destroying cancer tumor cells and hence their uncontrolled proliferation. In autoimmune dis-
eases, a deficiency in Treg activity and therefore lack of immune cell inhibition leads to autoim-
mune cells attacking the body’s own tissues (Onishi et al., 2016). As a result, the usage of Tregs
for immunotherapy is attractive as these cells control autoimmune reactions and tolerance to
transplantation (Takahashi and Sakaguchi, 2003).
Forkhead box protein P3 (FoxP3) is the transcription factor regulating the development,
differentiation, and function of Tregs (Fontenot et al., 2003). In addition to expressing the CD4
biomarker, Tregs express the interleukin-2 (IL-2) receptor α-chain, CD25 [table 1]. Effector T
cells (Teff) are of the CD4+CD25- phenotype. Both Tregs and Teffs also require T cell receptor
(TCR) stimulation and co-stimulation for their activation. The CD3 and CD28 biomarkers func-
tion as TCR signal transducers and thus their stimulation is required for Treg activation and ex-
pansion. Moreover, the CD69 biomarker is up-regulated when Tregs and Teffs are activated
(Singer et al., 2014). IL-2, a cytokine signaling molecule and T cell growth factor, is critical for
the peripheral expansion and survival of natural Tregs (Nelson, 2004). Naturally occurring Tregs
are derived in the thymus as a functionally mature subpopulation of T cells. Induced Tregs origi-
nate in the periphery from CD4+FoxP3- conventional T cells (Sakaguchi et al., 2006).
Consequently, the role of Tregs of the CD4+CD25-FoxP3- phenotype in tolerance to co-
agulation factors has emerged, as they can suppress both the B and T cells involved in inhibitor
formation (Cao et al., 2009). Although ex vivo polyclonal expanded Tregs have been shown to
�4

significantly reduce inhibitors in hemophilia A mice, they may be broadly immunosuppressive
(Sarkar et al., 2014); thus it is expected that antigen-specific Tregs would be more effective for
tolerance induction (Biswas et al., 2018).
Table 1. Treg markers relevant to their use as immunotherapy.
Singer et al., Front Immunol, 2014
Chimeric Antigen Receptors (CAR)
Chimeric antigen receptors (CAR) are recombinant receptors that provide both antigen-
binding and T-cell activating functions by redirecting immune reactivity toward a chosen antigen
(Sadelain et al., 2013). Any cell surface molecule and tumor antigen can be targeted through a
�5

CAR, independent of the major histocompatibility complex (MHC), peptide processing and hu-
man leukocyte antigen (HLA) expression. CAR-modified T cells therefore react with a broader
range of targets compared with native T cell receptors. Thus, CAR T-cells prove to be com-
pelling for cancer immunotherapy (Curran et al., 2012).
Figure 1. Structure of an antibody: Fab is the antigen-binding fragment region, and Fc is the fragment crystallizable tail region that interacts with cell surface Fc receptors and complement proteins, allowing activation of the immune system. A single chain variable fragment (ScFv) is a fusion protein of the variable regions of the heavy and light chains, connected by a linker. It is used for antigen-binding domains of artificial T cell receptors.
A chimeric antigen receptor design consists of a single chain variable fragment (ScFv)
domain, a transmembrane domain, a hinge (spacer region), and a co-stimulatory signaling do-
main acquired from CD3ζ [figure 1, figure 2]. ScFv retain the specificity of the original antibody;
CARs containing ScFv are not MHC-restricted and only recognize target antigens on the target
cell. The classification of CARs depends on the number of signaling domains present; a first-
generation CAR has one, a second-generation CAR has two, and a third-generation CAR has
three signaling domains (Dotti et al., 2013).
�6

Figure 2. Design of a 1st, 2nd and 3rd generation chimeric antigen receptor (CAR). (Dotti et al., 2013).
CAR-Treg Immunotherapy
Antigen specific Tregs to human FVIII are generated by engineering and retrovirally
transducing a CAR molecule with specificity to human FVIII (Yoon et al., 2016). Antigen recog-
nition via the single chain antibody variable regions triggers signaling via the CD28 and CD3ζ
co-stimulatory domains, which induces CAR-Treg activation and proliferation, without the need
for MHC restriction.
Figure 3. A 2nd generation CAR composed of a single chain variable fragment fused to co-stimulatory signaling domains CD28 and CD3ζ to mediate T-cell activation. The right diagram shows a FVIII specific CAR inserted into a Treg.
For this ongoing research project, a single chain variable fragment (ScFv) from a human
immunoglobulin directed against human FVIII has already been generated and fused to the CD3
�7

and CD28 signaling domains of a 2nd generation CAR [figure 3]. It has already been packaged
into a retroviral system, pMys-IRES-GFP (which allows for the delivery of genes to mammalian
cells), along with successful transduction in CD3/28 bead activated CD4+ T cells. The binding of
FVIII-CAR expressing Tregs to recombinant FVIII fused to the Fc portion of immunoglobulin
(Fc-FVIII) has been demonstrated [figure 4]. Activation of the retrovirally transduced human
FVIII-CAR Tregs to Fc-FVIII has been shown by assessing the upregulation of the CD69 activa-
tion marker 24 hours after stimulation [figure 5].
Figure 4. Binding to Fc-FVIII was tested using an A647 conjugated Fc antibody. GFP percentage indicates percent-age of transduced cells. Left: dot plot, right: histogram.
Figure 5. Figure illustrating FVIII specific up regulation of CD69 in Teff (left) and Treg (right) cells. Unstimulated cells and cells stimulated with an irrelevant antigen, FIX, do not up regulate CD69
�8

The CD3ζ domain has three pairs of Immunoreceptor Tyrosine-based Activation Motifs,
ITAM 1, ITAM 2, and ITAM 3, which direct phosphorylation and downstream cell activation,
proliferation and survival pathways of the T cell/Treg (Love et Hayes, 2010). Antigen recogni-
tion and signaling by CAR-Tregs may also result in activation-induced cell death (AICD) of the
transduced cells. Thus, over activation of the CAR-Treg must be prevented in order to prevent
cell death. Since ITAM-2 is essential to the function of the CAR-Treg and must remain intact,
single mutations of ITAM-1 and 3 in the CD3ζ-signaling domain of the CAR molecule will be
tested in hopes of dampening the signaling response but not preventing cell activation [figure 6]
(Combadiere et al., 1996; Kochenderfer et al., 2010).
Figure 6. Testing a series of mutations in the Immunoreceptor Tyrosine-based Activation Motifs (ITAMs) of the CD3ζ chain domain of the FVIII-CAR in order to dampen signaling to avoid activation induced cell death of the CAR-Treg.
Single point mutations of ITAM-1 and ITAM-3 were generated by GenScript (Piscat-
away, NJ), which will be restricted and cloned into a retroviral vector, Pmys, in order to trans-
duce into the mammalian cells. Three plasmids will be transfected using the Plate-E cell line:
�9

Native CAR (no ITAMs mutated), Crippled CAR (ITAM1 + ITAM3 mutated), ITAM-1mut CAR
(ITAM-1 mutated), and transduced into either Tregs or Teffs. These three CAR-Tregs and three
CAR-Teff variables will be subjected to an activation assay and GFP staining, then assessed
through flow cytometry in order to determine the percent activation and percent cell loss of each.
Thus, the goal of this investigation within this overarching research project is to possibly find a
balance between antigen specific activation and cell death of the CAR-Treg in order to optimize
the cell-therapy protocol for immune tolerance to hemophilia.
�10
Materials and Methods
Cloning into retroviral vector
Single point mutations of ITAM-1 and ITAM-3 were generated by GenScript in the
pUC57 cloning vector. We transformed the plasmids into chemically competent stable E. coli
cells. Plasmids were grown in 1L LB cultures and isolated by Maxiprep using the Zymo Prep
Kit (Zymo Research, Irvine, CA). ITAM-1mut and ITAM-3mut in the pUC57 backbone were then
restricted using the Xho1 and Not1 restriction enzymes (NEB) and ligated into the pMys IRES-
eGFP retroviral vector (Cell Biolabs Inc., San Diego, CA) using the T4 DNA ligase (Fermentas,
Waltham, MA). Positive colonies were confirmed by restriction digest with Xho1 and Not1 re-
striction enzymes and by PCR using primers specific for the CAR construct.
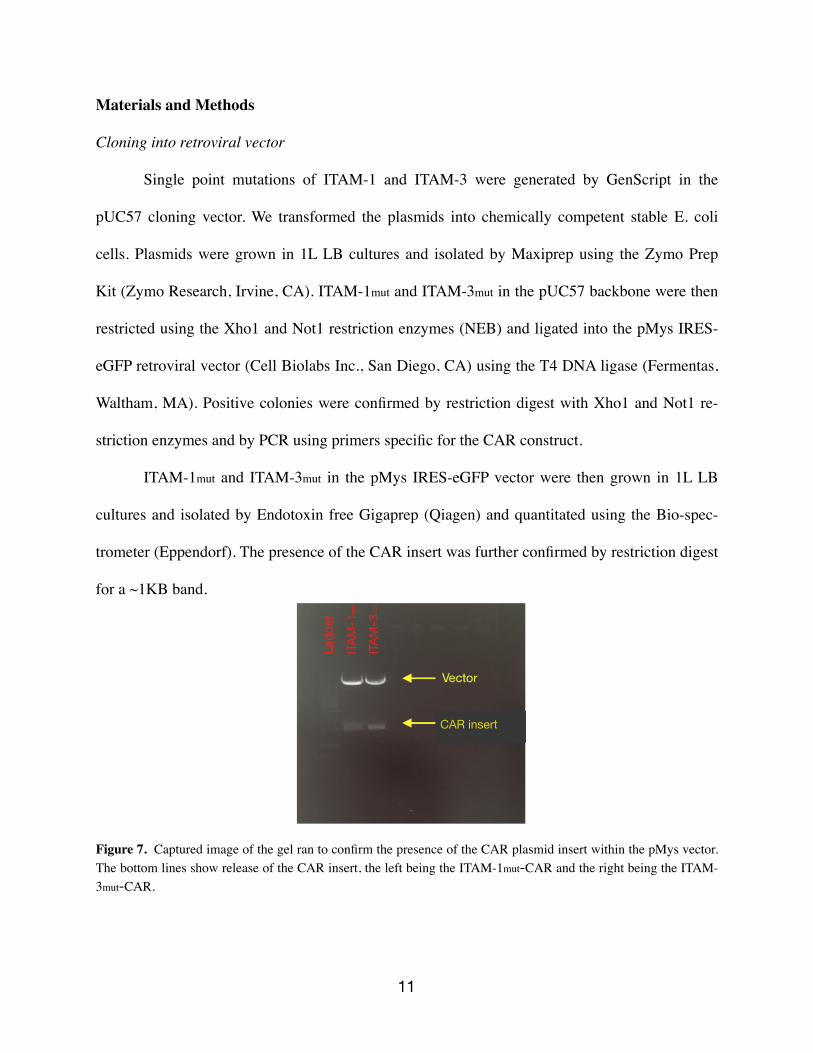
ITAM-1mut and ITAM-3mut in the pMys IRES-eGFP vector were then grown in 1L LB
cultures and isolated by Endotoxin free Gigaprep (Qiagen) and quantitated using the Bio-spec-
trometer (Eppendorf). The presence of the CAR insert was further confirmed by restriction digest
for a ~1KB band.
Figure 7. Captured image of the gel ran to confirm the presence of the CAR plasmid insert within the pMys vector. The bottom lines show release of the CAR insert, the left being the ITAM-1mut-CAR and the right being the ITAM-3mut-CAR.
�11
CAR insert

Using the Plat-E cell cell line
Plate-E culture media comprised of DMEM, 10% fetal bovine serum (FBS), 1ug/ml
puromycin, 10 ug/ml blasticidin, and 1% penicillin and streptomycin (Pen-Strep).
Day 1 - Split Plat-E cells
Washed T75 flask of Plat-E cells with PBS, trypsinized, flushed with 10 ml Plat-E media,
then combined with 20 ml Plate-E media. Split the 30 ml of media into 3 flasks.
Day 3 - Plating
Since cells in the 3 flasks have reached 70-90% confluency, made 12 10cm2 plates. 4
plates were labeled as Native CAR, 4 labeled as Crippled CAR and 4 labeled as ITAM1mut CAR.
Poly-L-lysin coating was added to the 12 plates and left to air-dry. Each flask was flushed with
11 ml transfection media, and 2.5 ml was added into each respective plate and 1 ml added back
into flask. The plates were topped with 7.5 ml transfection media and flasks were topped with 9
ml regular media. They were placed in incubator for the next day.
Day 4 - Transfection
Transfecting the Native CAR plasmid to 4 plates, the ITAM-1mut plasmid to 4 plates and
the Crippled CAR plasmid to 4 plates. In 50 ml tubes, warmed 5 ml of plain DMEM per plate.
Added 20 ug of the Myc plasmid per plate into the center of Native CAR tube and vortexed.
Added 20 ug of FVIII CAR Pmys GFP plasmid per plate into the center of Crippled CAR tube
and vortexed. Added 20 ug of Pmys ITAM-1 plasmid per plate into the center of ITAM-1mut
CAR tube and vortexed. Added 80 ul of Viafect transfection reagent (Promega, Madison, WI) per
plate into the center of each tube and vortexed. Incubated at room temperature for 20 min. Took
out the 12 plates from the previous day and removed 5 ml from each plate. Added 5 ml from re-
�12

spective tube into each of the labeled plates slowly, drop-wise, in a spiral manner, to cover entire
plate. Swirled gently and placed in incubator for 48 hours.
T-cell Activation
Harvested 6 spleens from 6 mice: Placed 2 spleens each in three tubes of PBS, labeled as
native CAR, crippled CAR and ITAM-1mut CAR. Kept cells cold by placing in ice bucket. Each
spleen contains 10^8 cells, thus each tube contains 2x10^8 total cells. To isolate Tregs, we posi-
tively selected for CD4+CD25+ cells, and to isolate effector T cells (Teff) we selected for
CD4+CD25- cells, using the MACS CD4+CD25+ Regulatory T Cell Isolation Kit (Miltenyi
Biotec, Auburn, CA). The following steps are repeated for each of the above three labeled tubes:
First, a single-cell suspension from the 2 spleens was prepared using a cell strainer and a 50-ml
tube. The tube was centrifuged for 5 min on 350xg at 4oC, then the supernatant discarded. The
cell pellet was resuspended in 2x400 ul of MACS buffer. To deplete non-CD4+ T cells, the non-1
CD4+ T cells are magnetically labeled and the CD25+ cells are fluorescently labeled, then mag-
netically separated using an LD column. Thus, 2x100 ul of the CD4+CD25+ Regulatory T Cell
Biotin-Antibody Cocktail was added. The tube was mixed well and incubated for 10 minutes in
the refrigerator. Next, 2x300 ul of MACS buffer, 2x200 ul of Anti-Biotin MicroBeads, and 2x100
µL of CD25-PE antibody were added. The tubes were mixed well and incubated for 15 minutes
in the refrigerator. An LD Column for each corresponding tube was placed in the magnetic field
of the MACS Separator, and rinsed with 2 mL of MACS buffer. Once column reservoir was
empty, the cell suspension was added onto the column. The total fraction of unlabeled CD4+ cells
that flowed through was collected as the column was washed with 2×1 mL of MACS buffer. The
cell suspension was centrifuged at 300×g for 5 minutes and supernatant discarded. Now, to posi-
Protocol gives reagent volumes per 10^8 cells. Since we have 2 spleens, we are working with 2x10^8 total cells, 1
thus using twice the volume of all indicated reagent volumes.
�13

tively select for the CD4+CD25+ cells, the CD25+ cells were magnetically labeled then magneti-
cally separated using an MS column. Thus, the cell pellet was resuspended in 2x900 µL of
MACS buffer then 2x100 µL of Anti-PE MicroBeads was added. The suspension was mixed well
and incubated for 15 minutes in the refrigerator. An MS Column for each corresponding tube was
placed in the magnetic field of the MACS Separator, and rinsed with 500 ul of MACS buffer.
Once column reservoir was empty, the cell suspension was added onto the column. As the col-
umn was washed with 2×500 uL of MACS buffer, the total eluted fraction of CD4+CD25- cells
that flowed through was collected and labeled in a tube as “Teff cells.” The column was then re-
moved from the separator and placed on a new tube labeled as “Treg cells”. 1 ml of MACS buf-
fer was pipetted onto the column, and the magnetically labeled CD4+CD25+ cells were flushed
out. There were a total of 6 tubes in the end: Native CAR-Treg; Native CAR-Teff; Crippled
CAR-Treg; Crippled CAR-Teff; ITAM-1mut CAR-Treg; ITAM-1mut CAR-Teff. All tubes were
centrifuged for 5 min at 350xg and the cell pellet was resuspended in 2x1ml of Treg media 2
(RPMI + IL-2). Three 12-well plates were labeled as Native CAR, Crippled CAR and ITAM1mut
CAR, and 4 wells of each plate were labeled as Treg, Treg, Teff, Teff. The Treg and Teff tubes
were plated at 1 million cells per well. To activate the T cells, 50 ul of Dynabeads Mouse T-Acti-
vator CD3/CD28 magnetic beads were added to each well. All plates were incubated for 48
hours.
Day 5 - Retronectin coating
Three untreated, 6-well tissue culture plates were labeled as Native CAR, Crippled CAR
and ITAM1mut CAR, and for each plate, 3 wells were labeled as Treg and 3 wells were labeled as
Teff. Retronectin (RN) was taken from the freezer and 25 ul was added to each well. Next, 1.25
Standard protocol calls for 1 ml of Treg media per 10^8 cells. Since each tube has 2x10^8 cells, twice the volume 2
of Treg media was added.
�14

ml of PBS was added directly to each well. Plates were shaken gently and placed in fridge for
use the next day.
Figure 8. Labeled Retronectin plate
Transfection media change
Took the 12 transfection plates from the previous day and discarded all 10 ml from each
plate. Added 10 ml of fresh Transfection Plate-E media into each plate and placed back into in-
cubator.
Day 6 - Transduction
Checked the 12 Plat-E transfection plates for GFP staining. GFP was present thus con-
firmed that transfection worked.
The transduction began by doing the blocking step first. Took out the three RN plates
from fridge and removed the RN from each well (avoided touching bottom of the well due to the
protein coating). Added 2 ml of PBS to each well and removed, then added 2 ml of 2% BSA
(Bovine Serum Albumin - blocking buffer) and incubated at room temperature for 20 min.
Meanwhile, centrifuge was preheated to 32oC. The 3 activated cell plates from Day 4 were re-
moved from incubator and all wells were flushed thoroughly and transferred into corresponding-
ly labeled FACS tubes: Native CAR - Treg; Native CAR - Teff; Crippled CAR - Treg; Crippled
CAR - Teff; ITAM-1mut CAR - Treg; ITAM-1mut CAR - Teff. The tubes were placed in a Mac-
sibead Magnetic Separator to get rid of the beads. After a red line (the beads) formed on the wall
of the tube, the cells were transferred into 6 new labeled tubes and centrifuged for 5 min at
�15

350xg, after which the supernatant was discarded. Concurrently, the media of all the Plat-E trans-
fection plates were removed and placed in correspondingly labeled tubes: Native CAR - Treg;
Native CAR - Teff; Crippled CAR - Treg; Crippled CAR - Teff; ITAM-1mut CAR - Treg; ITAM-
1mut CAR - Teff and spun down at 350xg for 5 min. The supernatant was decanted into new la-
beled tubes, and the pellets were discarded. The cells obtained from the magnetic separation
were resuspended in this Plat-E transfection supernatant. Now that the 20 min blocking step was
over, the BSA was removed from each well of the RN-coated plates, and 2 ml PBS was added
then removed. 7 ml of the cell/supernatant suspension was added to each of the correspondingly
labeled wells of the RN-coated plates. The plates were then balanced and centrifuged for 90 min
at 1200xg at 32oC. Once the spinoculation was over, the plates were removed and placed in the
incubator for 2 hours. Afterwards, the wells of the plates were flushed really well and the cells
removed and placed into new, labeled tubes. They were spun down for 5 min at 350xg and then
the pellet of each tube was resuspended in 3x1ml of Treg media. Three 12-well treated, tissue
culture plates were labeled as Native CAR, Crippled CAR, and ITAM-1mut CAR and for each,
three wells were labeled as Treg and 3 wells as Teff. The tubes were divided evenly into the cor-
respondingly labeled wells so that 1 ml was placed in each well. The plates were incubated for
48 hours.
Day 8 - CD69 activation assay
Three 24-well plates were labeled as Native CAR, Crippled CAR, and ITAM-1mut CAR,
and for each plate, 4 wells were labeled as Treg and 4 wells as Teff. The 4 wells for each were
labeled as 1-control, 2-FVIII, 3- Eloctate+Fc and 4- Fc-FIX. The plates from day 6 were re-
moved from the incubator and the correspondingly labeled cells (3 ml total for Treg and 3 ml to-
tal for Teff) were seeded evenly among the 4 wells, thus yielding approximately 750 ul per well.
�16

FVIII and Eloctate are added at 200 ng/ml of media, thus 30 ul of FVIII was added to wells 2, 30
ul of eloctate + 5 ul of Fc antibody added to wells 3, and 30 ul of Fc-FIX + 5 ul of Fc antibody
added to wells 4. The plates were incubated for 24 hours.
Figure 9. Labeled CD69 activation assay plate.
Day 9 - Flow Cytometry
The wells of each plate were flushed and placed into correspondingly labeled FACS
tubes. About 2 ml of PBS was added to each and tubes were spun at 350xg for 5min. The super-
natant was decanted and the tubes vortexed. 2 ul of the Anti-Mouse CD69 APC antibody was
added to each tube (Biolegend, San Diego, CA), then they were incubated for 15 min at 4oC.
About 3 ml of PBS was then added to each tube and spun at 350xg for 5min. The cells were re-
suspended in 300 ul of PBS then acquired on the BD Fortessa flow cytometer at the ICBR. Cells
were quantified for CAR transduced cells (GFP+) and CD69 expressing cells (APC+). Analysis
of GFP loss and CD69 activation was carried out using the FCS Express 6 software (DeNovo.
Glendale, CA).
�17
Results
We wanted to test, for the Native-CAR, Crippled-CAR, and ITAM-1mut-CAR Tregs and
Teffs, whether transduced cells underwent FVIII specific activation, and if this activation lead to
activation induced cell death (AICD). For this, we tested percent loss of transduced cells (GFP+),
which would indicate cell death, and percent CD69 expressing cells (APC+), which would indi-
cate activated cells. We used 4 different conditions for both transduced Tregs and Teffs 1) Con-
trol untreated samples, 2) Cells stimulated with 200ng/ml recombinant FVIII, 3) Cells stimulated
with FcFVIII (Eloctate) and cross-linked with anti-Fc antibody, and 4) Cells stimulated with an
irrevelant antigen, FcFIX+Fc antibody, to confirm how activation is antigen specific.
The original graphs created using the FCS Express 6 software are shown below for the
Native-CAR Tregs [figure 11], Crippled-CAR Tregs [figure 12], and ITAM-1mut-CAR Tregs
[figure 13]. The Native-CAR Tregs (with all ITAMs intact) had a relatively steady percentage of
GFP+ cells to the control, FVIII and FcFVIII (Eloctate), indicating minimal GFP+ cell loss upon
activation. There was an increase in percentage of CD69 activated cells to the FVIII and eloctate.
The Crippled-CAR Tregs (with double mutations in ITAM-1 and 3) had a steady percentage of
GFP+ cells to the control, FVIII and eloctate, indicating minimal to no GFP+ cell loss. However,
there was no increase in percentage of CD69 activated cells to the FVIII and eloctate, indicating
the inability of the Crippled-CAR Treg to signal and proliferate. The ITAM-1mut-CAR Tregs had
a steady and slightly increasing percentage of GFP+ cells to the control, FVIII and Eloctate, indi-
cating zero GFP+ cell loss. There was a significant increase in percentage of CD69 activated cells
to the FVIII and Eloctate, indicating the ability for an ITAM-1mut-CAR Treg to signal and prolif-
erate.
�18

Figure 10. Results of the flow cytometry quantifications for the Native CAR-Tregs, showing percent GFP+ trans-duced cells and percent CD69 activation marker. There was minimal to zero percentage GFP+ cell loss and an in-crease in percentage of CD69 activated cells.
�19

Figure 11. Results of the flow cytometry quantifications for the Crippled CAR-Tregs, showing percent GFP+ trans-duced cells and percent CD69 activation marker. There was minimal to zero percentage GFP+ cell loss and no in-crease in percentage of CD69 activated cells.
�20

Figure 12. Results of the flow cytometry quantifications for the ITAM-1mut CAR-Tregs, showing percent GFP+ transduced cells and percent CD69 activation marker. There was no percentage GFP+ cell loss and an increase in percentage of CD69 activated cells.
�21

The original graphs created using the FCS Express 6 software have been turned into his-
tograms for the Native-CAR Teff, Crippled-CAR Teff, and ITAM-1mut-CAR Teff [figure 14].
The Native-CAR Teff had an increase in percentage of CD69 activated cells to the FVIII and
eloctate, indicating signaling and proliferation of the Native-CAR Teff cell. The Crippled-CAR
Teff had no increase in percentage of CD69 activated cells to the FVIII and Eloctate, indicating
the inability of the Crippled-CAR Teff to signal and proliferate. The ITAM-1mut-CAR Teff had
an increase in percentage of CD69 activated cells to the FVIII and eloctate, indicating the ability
for the ITAM-1mut-CAR Teff to signal and proliferate.
Figure 13. Histogram analysis of the CD69 activation for the Native CAR-Teff (left), Crippled CAR-Teff (middle) and ITAM-1mut CAR-Teff (right) cells. The Native-CAR and ITAM-1mut-CAR Teff cells were able to signal and proliferate, whereas the Crippled-CAR Teff cells were not activated.
Percent CD69 activation was plotted in a bar graph to compare all three CAR-Treg cells
[figure 15]. The Crippled-CAR Treg showed no CD69 activation across the Control, FVIII and
Eloctate, however the Native-CAR Treg had about 2.7x CD69 activation to the FVIII from the
control baseline (10% to 28% activated cells), and the ITAM-1mut-CAR Treg had about 1.75x
CD69 activation to the FVIII from the control baseline (24% to 42% activated cells). Likewise,
percent CD69 activation was plotted in a bar graph to compare all three CAR-Teff cells [figure
16]. It was consistently shown that Crippled-CAR T cells are hindered from their ability to signal
�22

because there was no CD69 activation for the Crippled CAR-Teff either. However, there was a
greater percentage of increase in CD69 activation to the FVIII in the Native CAR-Teff and
ITAM-1mut CAR-Teff than in the Tregs (21% to 72% activated cells, and 14% to 55% activated
cells, respectively). Overall, we successfully mutated one ITAM without hindering its ability to
signal.
Figure 14. Percent of CD69 activation for the Native CAR-Tregs, Crippled CAR-Tregs, and ITAM-1mut CAR-Treg cells, acquired after 24 hours on the BD Fortessa flow cytometer at the ICBR.
Figure 15. Percent of CD69 activation for the Native CAR-Teff, Crippled CAR-Teff, and ITAM-1mut CAR-Teff cells, acquired after 24 hours on the BD Fortessa flow cytometer at the ICBR.
�23

To illustrate percent GFP cell loss for each T cell, the percent viable cells were normal-
ized and graphed. Example calculations for the Native CAR-Treg are as follows: The control was
normalized to 100%. The control had 15.85% GFP+ cells. Dividing 100 by 15.85 gives 6.309.
Each subsequent variable will now be multiplied by 6.309. The percent GFP+ cells for the FVIII
was 15.36%, and multiplying 15.36 by 6.309 gives 96.9. Repeating for the Eloctate and FIX
gives 95.3 and 93.2, respectively. Thus, since the percent viable cells for FVIII was about 97%,
this indicates that there was about a 3% GFP cell loss. The same calculations were repeated for
each CAR-Treg and CAR-Teff cells, and the results graphed in figures 17 and 18.
For both the Tregs and the Teff cells, the Crippled-CARs showed minimal to zero GFP+
cell loss, which is accounted for by the fact that these cells did not signal and proliferate. For the
Treg cells, the Native-CARs had very minimal cell loss and the ITAM-1mut-CARs had no cell
loss. For the Teff cells, both the Native-CARs and the ITAM-1mut-CARs had almost 50% GFP+
cell loss. The Teff showed greater GFP loss than the Tregs, indicating that Tregs are more resis-
tant to cell death.
Figure 16. Percent viable cells normalized for the Native CAR-Tregs, Crippled CAR-Tregs, and ITAM-1mut CAR-Treg cells, acquired after 24 hours on the BD Fortessa flow cytometer at the ICBR.
�24

Figure 17. Percent viable cells normalized for the Native CAR-Teff, Crippled CAR-Teff, and ITAM-1mut CAR-Teff cells, acquired after 24 hours on the BD Fortessa flow cytometer at the ICBR.
�25

Discussion
This investigation has demonstrated that with double ITAM mutations, the CAR-T cells
had no activation of CD69 (and hence no cell death). However, with a single ITAM mutation, the
CAR-T cells continued to activate, without causing cell death. For the Treg cells, the ITAM-1mut
CAR had only slightly less GFP loss than the Native CAR. Whereas for the Teff cells, ITAM-1mut
CAR did not make a difference in the GFP loss as it had similar percent cell loss as the Native
CAR. Furthermore, the Tregs overall seemed to prevent loss of GFP, making them more resistant
to cell death than the Teff cells.
Since all the data for the CAR transduced cells and CD69 expressing cells were quanti-
fied after 24 hours, this project could be repeated by expanding the Treg cells for longer to
achieve better transduction of Tregs. Although Treg therapy is already in use, it is, however, a
rare cell type and it is difficult to isolate or expand in large numbers. Antigen specific Tregs are
superior in lower numbers, hence why it was decided to insert antigen specificity into existing
Tregs by CAR expression.
Thus far, GFP loss has only been seen without a mechanism. It is assumed that it is acti-
vation-induced cell death (AICD), however, it was not confirmed in this investigation. For fur-
ther work, an Annexin V staining assay could be done on the CAR-T cells to test whether the 3
GFP loss is due to apoptosis, and hence, AICD.
By further exploring this investigation testing mutations in the signaling domain of the
FVIII-CAR, a superior cell-therapy protocol for immune tolerance to hemophilia could be
achieved. At the end of the study, we hope to establish that FVIII specific suppression by re-
Annexin V is used to detect apoptotic cells in flow cytometry.3
�26

direction of Tregs would reduce inhibitor titers to manageable levels. If successful, the approach
for expression in human cells can be developed, with the goal of translation to the clinic.
�27

Acknowledgements
I would like to thank Dr. Roland Herzog for his encouragement throughout my undergraduate
research studies and providing me with all resources to his lab. I would like to extend my sincere
gratitude to Dr. Moanaro Biswas for her dedicated guidance and mentorship throughout all of my
research projects. This work could not have been possible without her. Furthermore, I would like
to thank all of the members of the Herzog lab at the Cancer Genetics Research Complex at the
University of Florida for their support throughout my research experience.
�28

References
Rosendaal, F., Aledort, L., Lusher, J., Rothschild, C., Ingerslev, J. and White, G. (2001). Defini-tions in Hemophilia. Thrombosis and Haemostasis, 85(03), pp.560-560. doi:10.1055/s-0037-1615621
Baudo, F., Collins, P., Huth-Kuhne, A., Levesque, H., Marco, P., Nemes, L., Pellegrini, F., Teng-born, L. and Knoebl, P. (2012). Management of bleeding in acquired hemophilia A: results from the European Acquired Haemophilia (EACH2) Registry. Blood, 120(1), pp.39-46. doi:10.1182/blood-2012-02-408930
Iorio A, Halimeh S, Holzhauer S, et al. (2010). Rate of inhibitor development in previously un-treated hemophilia A patients treated with plasma-derived or recombinant factor VIII concen-trates: a systematic review. J Thromb Haemost. 8(6), pp.1256-1265. doi:10.1111/j.1538-7836.2010.03823.x.
Yoon, J., Schmidt, A., Zhang, A., Königs, C., Kim, Y. C., & Scott, D. W. (2016). FVIII-specific human chimeric antigen receptor T-regulatory cells suppress T- and B-cell responses to FVIII. Blood, 129(2), pp.238-245. doi:10.1182/blood-2016-07-727834
Sherman, A., Biswas, M. and Herzog, R. (2017). Innovative Approaches for Immune Tolerance to Factor VIII in the Treatment of Hemophilia A. Frontiers in Immunology, 8. doi:10.3389/fim-mu.2017.01604
Onishi H., Morisaki T., Katano M. (2016). Regulatory T Cells. In: Yamaguchi Y. (eds) Im-munotherapy of Cancer. Springer, Tokyo. doi:10.1007/978-4-431-55031-0_21
Takahashi, T. and Sakaguchi, S. (2003). Naturally Arising CD25+CD4+ Regulatory T Cells in Maintaining Immunologic Self-Tolerance and Preventing Autoimmune Disease. Current Molecu-lar Medicine, 3(8), pp.693-706. doi:10.2174/1566524033479429
Fontenot JD, Gavin MA, Rudensky AY. (2003) Foxp3 programs the development and function of CD4+CD25+ regulatory T cells. Nat Immunol (4), pp.330-336. doi:10.1038/ni904
Sakaguchi, S., Ono, M., Setoguchi, R., Yagi, H., Hori, S., Fehervari, Z., Shimizu, J., Takahashi, T. and Nomura, T. (2006). Foxp3+CD25+CD4+ natural regulatory T cells in dominant self-toler-ance and autoimmune disease. Immunological Reviews, 212(1), pp.8-27. doi:10.1111/j.0105-2896.2006.00427.x
Schmitt, E. and Williams, C. (2013). Generation and Function of Induced Regulatory T Cells. Frontiers in Immunology, 4. doi:10.3389/fimmu.2013.00152
Singer, B., King, L. and D’Alessio, F. (2014). Regulatory T Cells as Immunotherapy. Frontiers in Immunology, 5. doi:10.3389/fimmu.2014.00046
�29

Nelson, B. (2004). IL-2, Regulatory T Cells, and Tolerance. The Journal of Immunology, 172(7), pp.3983-3988. doi:10.4049/jimmunol.172.7.3983
Cao, O., Loduca, P. and Herzog, R. (2009). Role of regulatory T cells in tolerance to coagulation factors. Journal of Thrombosis and Haemostasis, 7, pp.88-91. doi:10.1111/j.1538-7836.2009.03417.x
Sarkar, D., Biswas, M., Liao, G., Seay, H., Perrin, G., Markusic, D., Hoffman, B., Brusko, T., Terhorst, C. and Herzog, R. (2014). Ex vivo expanded autologous polyclonal regulatory T cells suppress inhibitor formation in hemophilia. Molecular Therapy - Methods & Clinical Develop-ment, 1, p.14030. doi:10.1038/mtm.2014.30
Biswas, M., Kumar, S., Terhorst, C. and Herzog, R. (2018). Gene Therapy With Regulatory T Cells: A Beneficial Alliance. Frontiers in Immunology, 9. doi:10.3389/fimmu.2018.00554
Sadelain, M., Brentjens, R. and Rivière, I. (2013). The Basic Principles of Chimeric Antigen Re-ceptor Design. Cancer Discovery, 3(4), pp.388-398. doi:10.1158/2159-8290.cd-12-0548
Curran, K., Pegram, H. and Brentjens, R. (2012). Chimeric antigen receptors for T cell im-munotherapy: current understanding and future directions. The Journal of Gene Medicine, 14(6), pp.405-415. doi:10.1002/jgm.2604
Dotti, G., Gottschalk, S., Savoldo, B. and Brenner, M. (2013). Design and development of thera-pies using chimeric antigen receptor-expressing T cells. Immunological Reviews, 257(1), pp.107-126. doi:10.1111/imr.12131
Love, P. E., & Hayes, S. M. (2010). ITAM-mediated Signaling by the T-Cell Antigen Receptor. Cold Spring Harbor Perspectives in Biology, 2(6). doi:10.1101/cshperspect.a002485
Combadiere, B., Freedman, M., Chen, L., Shores, E., Love, P. and Lenardo, M. (1996). Qualita-tive and quantitative contributions of the T cell receptor zeta chain to mature T cell apoptosis. Journal of Experimental Medicine, 183(5), pp.2109-2117. doi:10.1084/jem.183.5.2109
Kochenderfer, J. N., Yu, Z., Frasheri, D., Restifo, N. P., & Rosenberg, S. A. (2010). Adoptive transfer of syngeneic T cells transduced with a chimeric antigen receptor that recognizes murine CD19 can eradicate lymphoma and normal B cells. Blood, 116(19), pp.3875-3886. doi:10.1182/blood-2010-01-265041
�30

Supplemental Information
Detailed procedure for cloning into the retroviral vector:
Before the transformation, agar plates were made using 250 mL of dH2O, 1 capsule of
LB medium, 3.75 g of agar and 250 ug of ampicillin. Two tubes with 25 ul of E. coli competent
cells were thawed on ice and labeled “ITAM-1mut” and “ITAM-3mut”. The 4 ug of ITAM-1mut
plasmid and 4 ug of ITAM-3mut plasmid were each diluted in a tube by adding 40 ul of nuclease-
free water. Next, 1 ul of the ITAM-1mut plasmid and 1 ul of the ITAM-3mut plasmid were each
removed and placed in new tubes with 9 ul of water added to each. Now the plasmids have been
diluted to 10 ng, thus 1 ul of each were taken and added to the tubes of competent cells. The
tubes were placed on ice for 30 min, then heat shocked for 90 sec in 42oC water bath, then
placed on ice for 3 min. 975 ul of SOC media was added to each tube and the cells were then in-
cubated in the 37oC shaker for 60 min. Meanwhile, four LB agar plates were warmed at room
temperature, of which two were labeled as ITAM-1mut and two as ITAM-3mut. For each plasmid,
one plate was spread with 50 ul of the transformed cells and one with 100 ul. The plates were
incubated overnight at 37oC.
To culture the colonies grown from last night, two 1 L flasks of LB broth selecting for
ampicillin, labeled as ITAM-1mut and ITAM-3mut, were used and placed in shaker incubator
overnight. The next day the cultures were spun down and isolated by performing a Maxiprep
procedure from the protocol of the Zymo Prep Kit. The ITAM-1mut and ITAM-3mut plasmids in
the pUC57 backbone were then restricted using the Xho1 and Not1 restriction enzymes (NEB)
and ligated into the pMys IRES-eGFP retroviral vector using the T4 DNA ligase.
Two 2-L flasks of LB broth were made using 1 L of dH2O and 4 agarose capsules in each
and autoclaving for 30 min. To check to make sure the colonies have the CAR plasmid insert in
�31

the Pmys vector, the colonies were grown in sixteen 15-ml tubes of LB broth. For tubes 1-8, a
colony from the ITAM-1mut plate was touched by a pipette and added into the tubes. The same
was done for tubes 9-16 from the ITAM-3mut plate. The tubes were incubated in 37oC shaker in-
cubator overnight.
For the mini-prep, sixteen ependorf tubes were labeled as 1-16. 1.5 ml from yesterday’s
tubes were removed and placed into each of the correspondingly labeled tubes and spun down
for 1 min at 10,000 rpm. This was repeated two more times until a total of 4.5 ml have been spun
down. The 16 ependorf tubes were resuspended in 200 ml of P1 buffer and inverted, then resus-
pended in 200 ml of P2 buffer and inverted. After incubating at room temperature for a few min,
they were resuspended in P3 buffer and inverted. The tubes were spun for 15 min at 13,000 rpm
then the supernatant was decanted into 16 newly labeled tubes. 500 ul of absolute ethanol was
added into each of the tubes and then spun down for 15 min at 13,000 rpm. The supernatant was
decanted and the pellet resuspended in 500 ul of 70% ethanol, then spun down for 15 min at
13,000 rpm. The supernatant was decanted and the pellet allowed to air dry after which it was
resuspended in 15 ul of H2O.
A 1% gel was made by 50 ml of 1xTAE, 0.5 g agarose powder and stained with ethidium
bromide. Two 10-well combs were used, where well 1 was loaded with 1 Kb DNA ladder, wells
2-9 were loaded with 4 ul of either the (1-8) ITAM-1mut plasmid for the first comb or the (9-16)
ITAM-3mut plasmid (for the second comb) + 6x loading dye, and well 10 was loaded with 1 ul of
Pmys + 6x loading dye. The gel was run for 40 min on 100 V and visualized under UV light and
an image was captured.
The Polymerase Chain Reaction (PCR) was run on a gel. For the 1-8 ITAM-1 colonies,
chose “1” and for the 9-16 ITAM-3 colonies, chose “15” and “16”. A maxi-prep was done on
�32

these three clones to check eloctate binding and activation. ITAM-1mut plasmid “1” was quanti-
fied by the nano-drop as 1.79 ug/ul, the ITAM-3mut plasmid “15” was quantified by the nano-
drop as 10.7 ug/ml, and the ITAM-3mut plasmid “16” didn’t work. A restriction was done for
each plasmid using the plasmid (ITAM-1mut “1”, ITAM-3mut “15”, or ITAM-3mut “16”), restric-
tion enzymes Xho1 and Not1, CutSmart buffer, and H2O and incubated in 37oC water bath for 2
hours. A 1% gel was ran on the three plasmids.
For the giga-prep, the bottle with the ITAM-1mut pellet and the bottle with the ITAM-3mut
pellet were resuspended in 125 ml of P1 buffer, vortexed, then resuspended in P2 buffer and in-
cubated for 5 min at room temperature. 125 ml of P3 buffer were added to each then centrifuged
for 5 min at 8,000xg. Meanwhile, two Qiafilter Giga cartridges, labeled as ITAM-1mut and
ITAM-3mut, were prepared on the necks of glass flasks and connected to a vacuum source. The
lysate was poured into the cartridge and the vacuum source was switched on slowly then
switched off. 50 ml of FWB2 buffer was added to each cartridge and the vacuum switch on then
turned off. 30 ml of ER buffer was added to the flasks with the filtered lysate and incubated on
ice for 30 min. Meanwhile, two Qiagen-tips 10,000 were equilibrated and 75 ml of QBT buffer
were added to each, allowing the column to empty by gravity flow into empty, waste bottles. The
filtered lysate were added to the Qiagen-tips and allowed to flow-through. They were washed
with 600 ml of QC buffer, then the DNA was eluted with 100 ml of QN buffer.
A restriction digest was done for ITAM-1mut and ITAM-3mut using the plasmids, restric-
tion enzymes Xho1 and Not1, Cutsmart buffer and H2O. The plasmids were run on a 1% g e l ,
and an image was captured indicating release of the CAR inserts.
�33