generation of liver specific endothelial cells for co-culture … · generation of liver specific...
TRANSCRIPT

Generation of liver specific endothelial cells for co-culturewith hepatocytes
Filipa Martins Ribeiro
Thesis to obtain the Master of Science Degree in
Biological Engineering
Supervisor(s): Professor Maria Margarida Fonseca Rodrigues Diogo and Eng. RubenBoon
Examination CommitteeChairperson: Professor Joaquim Manuel Sampaio CabralSupervisor: Professor Maria Margarida Fonseca Rodrigues DiogoMember of the Committee: Dr. Tiago Paulo Gonçalves Fernandes
September 2014

ii

Dedicated to all people that think research can change the world...
iii

iv

Acknowledgments
The Thesis that is lying in front of you is the result of six months of work. It represents my Master
thesis, for the conclusion of the Integrated Master in Biological Engineering at Instituto Superior Tecnico,
of Universidade (Tecnica) de Lisboa. Moreover, this Thesis is the result of the work developed at the
Stem Cell Institute of Leuven from KU Leuven, under the supervision of Prof. Verfaillie and Eng. Ruben
Boon, which I feel proud to say. Writing this Thesis was not the most amusing task I’ve done, probably
because it is summer and I rather be at the beach, but I cannot complain. It is a very interesting piece
of work and I learnt a lot doing it. I feel that this was the perfect way to end my Masters, no matter what
I will choose to do next.
For this reason, I start by thanking Prof. Catherine Verfaillie for the opportunity to do this Thesis at
the Stem Cell Institute of Leuven. It was a very nice experience and I learnt a lot. Thank you for your
wise advice. Then, I would like to thank Ruben Boon for all his patience, babysitting and teaching these
last six months. I will not forget all the things you taught me and the fact you never stopped helping me,
even with the most silly questions. I would also like to thank all the SCIL members (and especially the
Liver group) for all the advice and help during my days in the lab, and of course, for all the sweets and
cakes brought from all different places of this planet. My thanks also goes to all master students, that
have been through this together with me, for all the company, funny moments and relaxing times. I can
say that I made good friends there.
A special thank you to goes Prof. Margarida Diogo, for all help arranging everything during my leave,
and all the support and advice when I crazily decided to hand in this Thesis way earlier than expected. I
couldn’t make it without your help.
To my family... I don’t have so much to thank, but maybe more to apologize. It was not easy for you to
have me gone all of a sudden, especially like this. Life in the Lab was very busy and the rest of the day
was always for other activities or friends. Still, all of this is for you, my parents, brothers and grandfather,
that always have been and will be there for me.
My next thoughts go to my friends, both the new and the old ones. To the new ones, it was very very
nice to meet you. Leuven is a lovely city and we made a lovely group, the Erasmus Geeks, which were
probably the only students in Leuven that had to work all semester... Still I look forward to our reunion,
to make up for all the lost time. To the old friends, thank you for your support, for the random messages
now and then, and for all the surprises and visits. You must know that friends are the family we chose,
and I am very happy with mine. For those who are still doing thesis (and especially for the ones that
keep on doing it for way longer than expected), I wish you the best of luck.
Finally, I would like to thank the person that always has been there for me, during every moment,
every stressful situation, and every crisis of this Thesis: Thomas. I don’t know how I would do this
v

without you. You are an amazing person and you should be proud. Thank you for all help, all advice, all
corrections and for never complaining during such a stressful time.
Filipa Martins Ribeiro.
vi

Resumo
A importancia dos hepatocitos para a Industria farmaceutica e Medicina e irrenegavel. A hepatite toxica
e a maior causa de remocao de medicamentos do mercado, salientando a necessidade da criacao de
sistemas para o rastreio da toxicidade dos medicamentos. Alem disso, as doencas hepaticas afectam
600 Milhoes de pessoas e a falta de dadores para transplantes faz com que os hepatocitos sejam
a melhor solucao para o modelacao de doencas e criacao de novas terapias celulares. Numerosos
esforcos para a producao in vitro de hepatocitos a partir de celulas estaminais pluripotentes (PSCs)
tem sido empregues, contudo todos os protocolos existentes originam celulas imaturas. Uma solucao
para este problema passa pela co-cultura de hepatocitos com outras celulas do fıgado, uma vez que os
sinais das celulas vizinhas sao essenciais para a diferenciacao. Neste trabalho tentou-se gerar um dos
tipos de celulas hepaticas nao-parenquimais, os sinusoides hepaticas (LSECs), para co-cultura com
hepatocitos. LSECs sao celulas endoteliais (ECs) com caracterısticas especıficas do fıgado e por isso
a sua diferenciacao passa primeiro pela diferenciacao de PSCs em ECs, e so depois em LSECs. Para
a diferenciacao de ECs, foi escolhido um protocolo de tres passos, que foi melhorado com a adicao
de varias citoquinas e factores de crescimento. Concluiu-se que elevadas concentracoes de BMP4
juntamente com Activina A promovem a diferenciacao da mesoderme e por conseguinte, do endotelio,
e que a adicao de Wnt3A e de SB-43152 tambem e beneficial. Para a diferenciacao de ECs em LSECs,
foi criado um sistema induzıvel contendo factores de transcricao de LSECs.
Palavras-chave: Celulas endoteliais, Celulas endoteliais sinusoides hepaticas, Co-cultura
de hepatocitos com celulas nao-parenquimais hepaticas, Engeharia do fıgado, Linha celular induzıvel,
Sinusoides hepaticas.
vii

viii

Abstract
The importance of hepatocytes for both the pharmaceutical industry and medicine is undeniable. Drug-
induced liver disease is the main cause of pharmaceuticals retraction from the market, highlighting
the need to create a suitable high throughput screening system for evaluation of drug toxicity in the
human liver. Moreover, liver diseases affect 600 Million people worldwide and the lack of donors for
transplantation makes hepatocytes a valuable solution for disease modelling and for the creation of new
cellular therapies. Numerous efforts for the in vitro generation of hepatocytes from pluripotent stem cells
(PSCs) have been done, however all existent protocols generate only immature hepatic-like cells. A
solution for this problem may be their co-culture with other liver cells, as neighbour signalling is known
to be essential in in vivo differentiation. In this work we tried to generate one of the non-parenchymal
liver cells types, the liver specific endothelial cells (LSECs), for co-culture with hepatocytes. LSECs
are endothelial cells (ECs) with specific liver characteristics and thus, their generation firstly undergoes
PSCs differentiation into ECs and only then, specification into LSECs. For endothelial cell differentiation,
a three step protocol was chosen and to improve it, several cytokines and growth factors in different
concentrations were tested. With these studies, we concluded that high concentrations of BMP4 together
with Activin A play an important role in mesoderm induction and thus, in endothelial differentiation. The
application of Wnt3A and SB-43152 has also shown to be beneficial. For differentiation of ECs into
LSECs, an inducible system containing LSEC transcription factors was created.
Keywords: Co-culture of hepatocytes with non-parenchymal cells, Endothelial cells differenti-
ation, Inducible cell line, Liver engineering, Liver specific endothelial cells, Liver sinusoidal endothelial
cells.
ix

x

Contents
Acknowledgments . . . . . . . . . . . . . . . . . . . . . . . . . . . . . . . . . . . . . . . . . . . v
Resumo . . . . . . . . . . . . . . . . . . . . . . . . . . . . . . . . . . . . . . . . . . . . . . . . . vii
Abstract . . . . . . . . . . . . . . . . . . . . . . . . . . . . . . . . . . . . . . . . . . . . . . . . . ix
List of Tables . . . . . . . . . . . . . . . . . . . . . . . . . . . . . . . . . . . . . . . . . . . . . . xiii
List of Figures . . . . . . . . . . . . . . . . . . . . . . . . . . . . . . . . . . . . . . . . . . . . . xviii
Nomenclature . . . . . . . . . . . . . . . . . . . . . . . . . . . . . . . . . . . . . . . . . . . . . . xx
Glossary . . . . . . . . . . . . . . . . . . . . . . . . . . . . . . . . . . . . . . . . . . . . . . . . xxvii
1 Introduction 1
2 Literature review 3
2.1 Need for a renewable source of hepatocytes . . . . . . . . . . . . . . . . . . . . . . . . . . 3
2.2 Pluripotent stem cells as an unlimited source of cells . . . . . . . . . . . . . . . . . . . . . 6
2.3 Monolayer protocols for hepatocytes cells differentiation . . . . . . . . . . . . . . . . . . . 7
2.4 Non parenchymal liver cell types . . . . . . . . . . . . . . . . . . . . . . . . . . . . . . . . 9
2.5 Generation of liver specific endothelial cells from PSCs . . . . . . . . . . . . . . . . . . . 10
2.6 Protocols for endothelial cells differentiation . . . . . . . . . . . . . . . . . . . . . . . . . . 11
2.7 Improvement of endothelial cell differentiation . . . . . . . . . . . . . . . . . . . . . . . . . 13
2.7.1 Role of TGF-β pathway . . . . . . . . . . . . . . . . . . . . . . . . . . . . . . . . . 13
2.7.2 Role of FGFs signalling . . . . . . . . . . . . . . . . . . . . . . . . . . . . . . . . . 14
2.7.3 Role of VEGF signalling . . . . . . . . . . . . . . . . . . . . . . . . . . . . . . . . . 16
2.8 Generation of LSECs from endothelial cells . . . . . . . . . . . . . . . . . . . . . . . . . . 18
2.9 Creation of an inducible cell line expressing LSEC genes . . . . . . . . . . . . . . . . . . 18
3 Materials and methods 23
3.1 Cell culture . . . . . . . . . . . . . . . . . . . . . . . . . . . . . . . . . . . . . . . . . . . . 23
3.1.1 Embryonic stem cells maintenance . . . . . . . . . . . . . . . . . . . . . . . . . . . 23
3.1.2 Preparation of hESC for differentiation . . . . . . . . . . . . . . . . . . . . . . . . . 24
3.2 RNA extraction and cDNA synthesis . . . . . . . . . . . . . . . . . . . . . . . . . . . . . . 24
3.3 Quantitative Polymerase Chain Reaction (qPCR) . . . . . . . . . . . . . . . . . . . . . . . 25
3.4 Fluorescence-activated cell sorting (FACS) and flow cytometry analysis . . . . . . . . . . 25
3.5 Magnetic-activated cell sorting (MACS) . . . . . . . . . . . . . . . . . . . . . . . . . . . . 27
3.6 Plasmid construction . . . . . . . . . . . . . . . . . . . . . . . . . . . . . . . . . . . . . . . 27
3.6.1 Cloning procedures . . . . . . . . . . . . . . . . . . . . . . . . . . . . . . . . . . . 27
xi

3.6.2 Gel electrophoresis . . . . . . . . . . . . . . . . . . . . . . . . . . . . . . . . . . . 29
3.6.3 Gel purification . . . . . . . . . . . . . . . . . . . . . . . . . . . . . . . . . . . . . . 29
4 Results 31
4.1 Optimization of EC generation protocol . . . . . . . . . . . . . . . . . . . . . . . . . . . . . 31
4.1.1 Current protocol . . . . . . . . . . . . . . . . . . . . . . . . . . . . . . . . . . . . . 31
4.1.2 TGF-β pathway . . . . . . . . . . . . . . . . . . . . . . . . . . . . . . . . . . . . . . 34
4.1.3 Role of BMP4 in mesodermal commitment . . . . . . . . . . . . . . . . . . . . . . 39
4.1.4 Role of Wnt3A and FGFs in mesoderm commitment . . . . . . . . . . . . . . . . . 41
4.1.5 Final improvements . . . . . . . . . . . . . . . . . . . . . . . . . . . . . . . . . . . 45
4.2 Generation of LSECs: creation of a inducible cell line . . . . . . . . . . . . . . . . . . . . . 52
5 Discussion 57
5.1 Generation of Endothelial cells . . . . . . . . . . . . . . . . . . . . . . . . . . . . . . . . . 58
5.1.1 Improvement of the current protocol: the TGF-β pathway . . . . . . . . . . . . . . 58
5.1.2 Role of BMP4 in mesoderm differentiation . . . . . . . . . . . . . . . . . . . . . . . 59
5.1.3 Role of Wnt3A and FGFs in mesoderm differentiation . . . . . . . . . . . . . . . . 60
5.1.4 Final improvements . . . . . . . . . . . . . . . . . . . . . . . . . . . . . . . . . . . 61
5.2 Creation of an inducible cell line . . . . . . . . . . . . . . . . . . . . . . . . . . . . . . . . 63
6 Conclusions and future perspectives 67
Bibliography 85
A Gene expression profiles 87
B Flow cytometry plots 90
C Significancy tests for P14 and P15 96
D Vector selection from agarose gel electrophoresis 100
xii

List of Tables
3.1 List of primers used for qPCR . . . . . . . . . . . . . . . . . . . . . . . . . . . . . . . . . . 26
3.2 List of antibodies and isotypes used for FACS . . . . . . . . . . . . . . . . . . . . . . . . . 27
4.1 Concentrations of the cytokines used in protocols P1, P2, P3 and P4 . . . . . . . . . . . . 35
4.2 Concentrations of the cytokines used in protocols P5, P6, P7 and P8 . . . . . . . . . . . . 40
4.3 Concentrations of the cytokines used in protocols P9, P10, P11 and P12 . . . . . . . . . . 43
4.4 Concentrations of the cytokines used in protocols P9, P10, P11 and P12 . . . . . . . . . . 45
C.1 Values of ∆CT for protocols P1, P14 and P15 for PDGFR-α, KDR, CD31 and VE Cadherin
genes . . . . . . . . . . . . . . . . . . . . . . . . . . . . . . . . . . . . . . . . . . . . . . . 96
xiii

xiv

List of Figures
2.1 Distinguished features of mature hepatocytes . . . . . . . . . . . . . . . . . . . . . . . . . 4
2.2 Stages of liver damage . . . . . . . . . . . . . . . . . . . . . . . . . . . . . . . . . . . . . . 5
2.3 Applications of mature hepatocytes . . . . . . . . . . . . . . . . . . . . . . . . . . . . . . . 6
2.4 Direct differentiation of hESC into hepatocyte-like cells by mimicking embryonic develop-
ment . . . . . . . . . . . . . . . . . . . . . . . . . . . . . . . . . . . . . . . . . . . . . . . . 7
2.5 Generation of hepatocyte-like cells from PSCs via three stepwise protocols . . . . . . . . 8
2.6 Representation of the liver cell types . . . . . . . . . . . . . . . . . . . . . . . . . . . . . . 9
2.7 Direct differentiation of hESC into LSECs and ECs by mimicking embryonic development 11
2.8 Generation of endothelial cells from PSCs via three stepwise protocols . . . . . . . . . . . 12
2.9 Role of TGF-β pathway in endothelial cells differentiation from hESCs and involved cy-
tokines . . . . . . . . . . . . . . . . . . . . . . . . . . . . . . . . . . . . . . . . . . . . . . . 15
2.10 TGF-β signalling in endothelial cells . . . . . . . . . . . . . . . . . . . . . . . . . . . . . . 16
2.11 The VEGF receptor family . . . . . . . . . . . . . . . . . . . . . . . . . . . . . . . . . . . . 17
2.12 Zinc Finger Nuclease technology . . . . . . . . . . . . . . . . . . . . . . . . . . . . . . . . 19
2.13 FRT-flanked cassette from the Verfaillie Lab . . . . . . . . . . . . . . . . . . . . . . . . . . 20
2.14 Exchange of a FRT-flanked cassette contained in the AAVS1 locus of a modified cell line
by another FRT-flanked cassette . . . . . . . . . . . . . . . . . . . . . . . . . . . . . . . . 21
4.1 Flow cytometric isolation of hES cell-derived endothelial mesoderm cells at day 4 using
the Verfaillie protocol . . . . . . . . . . . . . . . . . . . . . . . . . . . . . . . . . . . . . . . 32
4.2 Gene expression analysis of mesoderm sorted cells differentiated from human ES cells
using the Verfaillie protocol at day 4(quantitative RT-PCR) . . . . . . . . . . . . . . . . . . 32
4.3 Flow cytometric isolation of hES cell-derived endothelial cells at day 10 using the protocol
from Verfaillie Lab . . . . . . . . . . . . . . . . . . . . . . . . . . . . . . . . . . . . . . . . 33
4.4 Gene expression analysis of endothelial sorted cells differentiated from human ES cells
using the Verfaillie protocol at day 10 (quantitative RT-PCR) . . . . . . . . . . . . . . . . . 33
4.5 Morphology of CD31 positive cells sorted at day 10. . . . . . . . . . . . . . . . . . . . . . 34
4.6 Flow cytometric isolation of hES cell-derived endothelial cells using the Verfaillie protocol
after 7 days of replating . . . . . . . . . . . . . . . . . . . . . . . . . . . . . . . . . . . . . 34
4.7 Gene expression analysis of mesoderm endothelial sorted cells differentiated from human
ES cells using the Verfaillie protocol (quantitative RT-PCR) after 7 days of replating . . . . 35
4.8 First protocols for the improvement of EC generation . . . . . . . . . . . . . . . . . . . . . 36
xv

4.9 Temporal gene expression analysis of pluripotency genes Oct4 and Nanog for cells differ-
entiated using protocols P1, P2, P3 and P4 . . . . . . . . . . . . . . . . . . . . . . . . . . 37
4.10 Temporal gene expression analysis of mesoderm genes Brachyury, PDGFR-α and PDGFR-
β for cells differentiated using protocols P1, P2, P3 and P4 . . . . . . . . . . . . . . . . . 37
4.11 Temporal gene expression analysis of endoderm genes Sox17 and Cxcr4 for cells differ-
entiated using protocols P1, P2, P3 and P4 . . . . . . . . . . . . . . . . . . . . . . . . . . 38
4.12 Temporal gene expression analysis of endothelial genes KDR, Tie2, CD31 and VE cad-
herin for cells differentiated using protocols P1, P2, P3 and P4 . . . . . . . . . . . . . . . 39
4.13 Temporal gene expression analysis of pluripotency genes Oct4 and Nanog for cells differ-
entiated using protocols P5, P6, P7 and P8 . . . . . . . . . . . . . . . . . . . . . . . . . . 40
4.14 Temporal gene expression analysis of mesoderm genes Brachyury, PDGFR-α and PDGFR-
β for cells differentiated using protocols P5, P6, P7 and P8 . . . . . . . . . . . . . . . . . 41
4.15 Temporal gene expression analysis of endoderm genes Sox17 and Cxcr4 for cells differ-
entiated using protocols P5, P6, P7 and P8 . . . . . . . . . . . . . . . . . . . . . . . . . . 41
4.16 Temporal gene expression analysis of endothelial genes KDR, Tie2, CD31 and VE cad-
herin for cells differentiated using protocols P5, P6, P7 and P8 . . . . . . . . . . . . . . . 42
4.17 TTemporal gene expression analysis of LSEC genes Sox17 and Cxcr4 for cells differenti-
ated using protocols P1, P2, P3, P4, P5, P6, P7 and P8 . . . . . . . . . . . . . . . . . . . 43
4.18 New protocols defined for the improvement of mesoderm differentiation and further EC
generation . . . . . . . . . . . . . . . . . . . . . . . . . . . . . . . . . . . . . . . . . . . . . 44
4.19 Temporal gene expression analysis of mesoderm genes Brachyury and PDGFR-α for
cells differentiated using protocols P9, P10, P11 and P12 . . . . . . . . . . . . . . . . . . 44
4.20 Temporal gene expression analysis of endoderm genes Sox17 and Cxcr4 for cells differ-
entiated using protocols P9, P10, P11 and P12 . . . . . . . . . . . . . . . . . . . . . . . . 45
4.21 Temporal gene expression analysis of endothelial genes KDR, Tie2, CD31 and VE cad-
herin for cells differentiated using protocols P9, P10, P11 and P12 . . . . . . . . . . . . . 46
4.22 Temporal gene expression analysis of mesoderm genes Brachyury and PDGFR-α for
cells differentiated using protocols P13, P14, P15 and P16 . . . . . . . . . . . . . . . . . . 47
4.23 Temporal gene expression analysis of endoderm genes Sox17 and Cxcr4 for cells differ-
entiated using protocols P13, P14, P15 and P16 . . . . . . . . . . . . . . . . . . . . . . . 47
4.24 Temporal gene expression analysis of endothelial genes KDR, Tie2, CD31 and VE cad-
herin for cells differentiated using protocols P13, P14, P15 and P16 . . . . . . . . . . . . 48
4.25 Comparison of the temporal gene expression analysis for mesoderm genes and endothe-
lial genes for the best protocols (P14 and P15) and the control (P1) at days 4, 6 and 10 of
differentiation . . . . . . . . . . . . . . . . . . . . . . . . . . . . . . . . . . . . . . . . . . . 49
4.26 Representation of the flow cytometric isolation values for KDR-expressing, PDGFR-α-
expressing and PDGFR-β-expressing cells at day 4, for protocols P13, P14, P15 and
P16. . . . . . . . . . . . . . . . . . . . . . . . . . . . . . . . . . . . . . . . . . . . . . . . . 49
4.27 Representation of the flow cytometric isolation values for KDR-expressing, PDGFR-α-
expressing and PDGFR-β-expressing cells at day 6, for protocols P13, P14, P15 and
P16. . . . . . . . . . . . . . . . . . . . . . . . . . . . . . . . . . . . . . . . . . . . . . . . . 50
xvi

4.28 Flow cytometric isolation of CD31-expressing cells differentiated with P13, P14, P15 and
P16 at day 6 . . . . . . . . . . . . . . . . . . . . . . . . . . . . . . . . . . . . . . . . . . . 51
4.29 Flow cytometric isolation of CD31-expressing cells differentiated with P15 at day 10 . . . 51
4.30 Structure of the MCS containing LSEC transcription factors genes. . . . . . . . . . . . . . 52
4.31 Agarose gel electrophoresis of the Vector, P2As sequences and LSEC genes to be cloned
into the MCS . . . . . . . . . . . . . . . . . . . . . . . . . . . . . . . . . . . . . . . . . . . 53
4.32 Agarose gel electrophoresis of TF2 high melting temperature PCR amplification product
and of the digested plasmid containing TF2 gene . . . . . . . . . . . . . . . . . . . . . . . 54
4.33 Agarose gel electrophoresis of the digested plasmids containing the Vector and P2As
ligation product . . . . . . . . . . . . . . . . . . . . . . . . . . . . . . . . . . . . . . . . . . 54
4.34 Agarose gel electrophoresis of the digested plasmids containing the Vector+P2As and
TF3 ligation product . . . . . . . . . . . . . . . . . . . . . . . . . . . . . . . . . . . . . . . 55
4.35 Agarose gel electrophoresis of the digested plasmids containing the Vector+P2As+TF3
and TF1 ligation product . . . . . . . . . . . . . . . . . . . . . . . . . . . . . . . . . . . . . 56
4.36 Agarose gel electrophoresis of the digested plasmids containing the Vector+P2As+TF3+TF1
and TF2 ligation product . . . . . . . . . . . . . . . . . . . . . . . . . . . . . . . . . . . . . 56
A.1 Temporal gene expression analysis of endoderm gene Gata6 for cells differentiated using
protocols P1, P2, P3, P4, P5, P6, P7 and P8 . . . . . . . . . . . . . . . . . . . . . . . . . 87
A.2 Temporal gene expression analysis of endothelial genes CD105, ENFB1 and Id1 for cells
differentiated using protocols P1, P2, P3 and P4 . . . . . . . . . . . . . . . . . . . . . . . 87
A.3 Temporal gene expression analysis of endothelial genes CD105, ENFB1 and Id1 for cells
differentiated using protocols P5, P6, P7 and P8 . . . . . . . . . . . . . . . . . . . . . . . 88
A.4 Temporal gene expression analysis of pluripotency genes Oct4 and Nanog for cells differ-
entiated using protocols P9, P10, P11 and P12 . . . . . . . . . . . . . . . . . . . . . . . . 88
A.5 Temporal gene expression analysis of endothelial genes CD105, ENFB1 and Id1 for cells
differentiated using protocols P9, P10, P11 and P12 . . . . . . . . . . . . . . . . . . . . . 88
A.6 Temporal gene expression analysis of pluripotency genes Oct4 and Nanog for cells differ-
entiated using protocols P13, P14, P15 and P16 . . . . . . . . . . . . . . . . . . . . . . . 89
A.7 Temporal gene expression analysis of endothelial genes CD105, ENFB1 and Id1 for cells
differentiated using protocols P13, P14, P15 and P16 . . . . . . . . . . . . . . . . . . . . 89
B.1 Flow cytometry plots of the of the bare population and KDR, PDGFR-α and PDGRF-β
controls and isotypes controls at day 4 . . . . . . . . . . . . . . . . . . . . . . . . . . . . . 90
B.2 Flow cytometric isolation of KDR, PDGFR-α and PDGFR-β expressing cells differentiated
with P13, P14, P15 and P16 at day 4 . . . . . . . . . . . . . . . . . . . . . . . . . . . . . . 92
B.3 Flow cytometry plots of the of the bare population and KDR, PDGFR-α and PDGRF-β
controls and isotypes controls at day 6 . . . . . . . . . . . . . . . . . . . . . . . . . . . . . 93
B.4 Flow cytometric isolation of KDR, PDGFR-α and PDGFR-β expressing cells differentiated
with P13, P14, P15 and P16 at day 6 . . . . . . . . . . . . . . . . . . . . . . . . . . . . . . 95
C.1 Significancy T-test for PDGFR-α gene between protocols P1 and P14, and P1 and P15 . 97
C.2 Significancy T-test for KDR gene between protocols P1 and P14, and P1 and P15 . . . . 97
xvii

C.3 Significancy T-test for CD31 gene between protocols P1 and P14, and P1 and P15 . . . . 98
C.4 Significancy T-test for VE Cadherin gene between protocols P1 and P14, and P1 and P15 99
D.1 Agarose gel electrophoresis of the digested Vector containig the P2As, Vector+P2As+HoxB
and Vector+P2As+HoxB+TFEC . . . . . . . . . . . . . . . . . . . . . . . . . . . . . . . . . 100
xviii

Nomenclature
AAVS1 Adeno-associated virus integration site 1
AM Adrenomedullin
BAL Bioartificial liver
bFGF basic Fibroblast growth factor
BMP Bone morphogenic protein
CMV Cytomegalovirus
CYP Cytochrome P450
DEX Dexamethason
DOX Doxycycline
EB Embryoid body
EC Endothelial cell
FGF Fibroblast growth factor
FLP Flipase
FRT Flippase recombinase target
HC Hepatic cell
hECS human Embrionic stem cell
HGF Hepatocyte growth factor
HpSC Hepatic stellate cell
HUVEC Human umbilical cord venous endothelial cells
iPSC induced Pluripotent stem cell
LDM Liver differentiation medium
LSEC Liver sinusoidal/specific endothelial cell
MCS Multiple cloning site
xix

NHEJ Non-Homologous End Joining
OSM Oncostatin M
PAF Platelet activating factor
PBS Phosphate-Buffered Saline
PSC Pluripotent stem cell
RA Retinoic acid
rtTA reverse tetracycline-controlled Transactivator protein
SA Splice acceptor
SM Staining medium
TAE Tris-Acetate-EDTA
TF Transcription factor
TGF Transforming growth factor
TK Tyrosine kinase
TRE Tetracycline responsive element
VEGF Vascular endothelial growth factor
Wnt3A Wingless-type MMTV integration site family, member 3A
ZFN Zinc Finger nuclease
xx

Glossary
AAT α-1 anti-Trypsin is a serine proteinase inhibitor,
generally known as serum trypsin inhibitor [1].
It belongs to the serpin superfamily and pro-
tects tissue from enzymatic and proteolytic ac-
tivity. This protein is mainly produced by ma-
ture liver cells and its absence causes severe
diseases to the human [1].
AFP α-Fetoprotein is a major plasma protein, mem-
ber of the albuminoid superfamily [2]. It is pro-
duced in the liver during fetal development and
it is thought to be the fetal form of albumin
[2]. As other members of the albuminoid fam-
ily, AFP can act as a carrier protein, binding
several types of molecules including steroids,
copper, bilirubin, fatty acids, retinoids, and fla-
vanoids [2].
Albumin Albumin is a globular protein produced by liver
cells. It is a secreted protein that occurs dis-
solved in the blood plasma, which is possible
due to its high solubility in water [3]. Albumin
maintains the plasma osmotic pressure needed
to maintain proper distribution of the body fluids
between blood vessels and tissue, and acts as
a carrier of ions, fatty acids, metabolites, biliru-
bin, drugs and hormones [3]. It is essential for
human body and it must be always circulating
in a certain amount, as lower or higher levels
may be deadly.
xxi

Brachyury is a protein encoded by the T box gene [4]. It
is the key transcription factor involved in the
regulation of mesoderm differentiation in ver-
tebrates, being the first transcription factor to
be expressed in the pan-mesodermally zone
and to become restricted to the axial mesoderm
(also known as notochord) upon gastrulation
[4]. Brachyury is also expressed in the posterior
mesoderm, being responsible for its differentia-
tion, as well as in axis elongation [4]. Brachyury
is essential for the formation of the posterior
body in all vertebrates as it establishes the em-
bryonic mesodermal progenitor niche [5].
CD105 Also called endoglin, is a proliferation-
associated and hypoxia-inducible type I
membrane glycoprotein, part of the TGF-β
signalling pathway. It has a crucial role in
angiogenesis, being abundantly expressed in
angiogenic endothelial cells [6].
CD31 Cluster of differentiation 31, also known as
platelet/endothelial cell adhesion molecule 1
(PECAM-1) is an integral membrane glycopro-
tein, expressed at high levels on early and
mature endothelial cells, platelets, monocytes,
neutrophils and some leukocytes at the cell
junctions [7]. CD31 is a member of the im-
munoglobulin superfamily, being involved in
leukocyte migration, angiogenesis, and integrin
activation [7]. As a membrane protein it can be
used as surface marker to identify and/or sort
cells (by FACS).
xxii
Cxcr4 C-X-C chemokine receptor type 4, also known
as fusin or CD184 is the receptor for the
CXC chemokine stromal cell-derived factor-1
(SDF1), which has essential functions on em-
bryo organogenesis [8]. CXCR4 is a critical
regulator of progenitor cells and stem cells mo-
bilization and recruitment during development
and hematopoiesis, being also related with an-
giogenesis [8]. Moreover, it is considered to be
a definitive endoderm marker as experimental
data show a strong correlation between Cxcr4
and FoxA2m as well as Cxcr4 and Sox17[9].
In fact, Cxcr4 is the most co-expressed factor
with the specific endoderm markers FoxA2 and
Sox17, being in combination with one of these,
a perfect way to identify definitive endoderm
populations [9].
FCGR2B Fc-γ receptor 2b is a sugar receptor/surface
protein present in LSECs.
Gata6 Gata binding factor 6 is a transcription factor
encoded by the gene with the same name,
which is a member of a small family of zinc
finger transcription factors [10]. It plays an im-
portant role in the regulation of cellular differ-
entiation and organogenesis in vertebrates de-
velopment [10]. It is mainly expressed during
early embryogenesis, being a marker for primi-
tive endoderm, and it can also be found in en-
doderm and mesoderm derived cells in later
embryogenesis, being linked to gut, lung and
heart development [10].Gata-6 expression can
be induced by BMP4.
xxiii

HNF4-α Hepatocyte nuclear factor 4 α also known as
NR2A1 (nuclear receptor subfamily 2, group A,
member 1) is a nuclear receptor protein [11].
It controls the expression of several genes, in-
cluding one of the most important for liver func-
tion, HNF1a (hepatocyte nuclear factor 1 al-
pha), a transcription factor that regulates the
expression of several hepatic genes [11]. More-
over, HNF4-α is related to the liver, kidney, and
intestines development, being expressed both
in early and later phases of liver development
and function [11].
KDR Kinase insert domain receptor, also known as
fetal liver kinase (flk-1), CD309 or vascular en-
dothelial growth factor receptor 2 (VEGFR-2),
is a type II receptor tyrosine kinase [12]. KDR
is one of two receptors for vascular endothelial
growth factor (VEGF), which has critical roles
in the growth and maintenance of vascular en-
dothelial cells and in the development of new
blood vessels [12].KDR is an early marker for
endothelial cell progenitors and can also be
found in hematopoietic cells.
LSECtin Lymph node Sinusoidal Endothelial C-type
lectin mediates attachment of filovirus and
coronavirus particles and regulates negatively
hepatic T-cell immune responde, being also a
suitable marker as it is widely expressed on
LSECs [13], [14].
Lsign Liver/lymph node-specific intercellular adhe-
sion molecule-3-grabbing noninteg rin is also
designed as CD209L [14]. This marker is
a calcium-dependent C-type lectins and it
is strongly and constitutively expressed on
LSECs and on endothelium in lymph nodes
[14]. Lsign acts as an attachment factor
for HCV (hepatitis C virus), HIV and other
lentivirus, and can also bind to ICAM-3 and
T cells, being a part of the immunological
synapse and regulating the hepatic T-cell im-
mune response [15], [13].
xxiv

MRC1 Mannose receptor C type 1, is a surface protein
present in LSECs.
Nanog Hoemobox protein Nanog is a divergent home-
odomain protein that directs propagation of un-
differentiated ES cells and acts as an intrinsic
effector of ESCs self-renewal [16]. It is con-
sidered to be the key factor for cell pluripo-
tency maintenance and one of the most impor-
tant factors for the understanding of the mech-
anisms used for stem cells to maintain pluripo-
tency. Nanog is expressed in the founder cells
of the early embryo and also in both totipotent
and pluripotent ESCs [16]. As Oct-4, differen-
tiation of ESCs results in its down-regulation.
In combination with other factors, as Oct-4 or
SOX2, it can be used to identify ESCs.
Oct-4 Octamer-binding transcription factor 4, also
designated as Oct-3, Oct-3/4, POU5F1 or NF-
A3, is one of the POU family transcription fac-
tors and the earliest expressed gene known
to encode a transcription factor developmen-
tally regulated during mammalian embryoge-
nesis [17]. It is expressed in totipotent and
pluripotent ESCs as well as primordial germ
cells and later female germ cells [18]. In order
to a stem cell sustain self-renewal and pluripo-
tency, a critical level of Oct-4 expression is re-
quired [19]. Differentiation of ESCs results in
down-regulation of Oct-4 as it is a master regu-
lator of pluripotency that controls lineage com-
mitment [19].
xxv

PDGFR-α and PDGFR-β Platelet-derived growth factor receptor α and
β are cell surface tyrosine kinases [20].
These proteins are receptors of platelet-derived
growth factor, a growth factor with an impor-
tant role in cell growth and division, in particular
in mesodermal differentiation and further mes-
enchymal cell differentiation [20]. While these
cells can be found in mesoderm cells, they are
not exclusive from this lineage; PDGFR-β can
also be found in fibroblasts and smooth muscle
and PDGFR-α in neural cells.
Sox17 This protein is a member of the transcrip-
tion factors family SOX, which play impor-
tant roles in early development and are often
used as markers to determine differentiation
of specific lineages [21]. Sox17 has functions
in the formation and maintenance of defini-
tive endoderm, vascular endothelium, and fetal
hematopoietic stem cells [21]. It acts as a cen-
tral component of the transcriptional network
for endormal differentiation as it binds and ac-
tivates several genes that promote differentia-
tion, stimulates directly the expression of Gata-
6 and Gata-4, which also promote endoderm
differentiation and moreover, it inhibits the tran-
scription of genes expressed in ESCs, as Sox2,
Nanog and Oct4 [21].
Tie2 Also known as TEK, is a tyrosine kinase re-
ceptor for angiopoietin 2. It is considered
as a endothelium-specific receptor tyrosine ki-
nase, essential for the development of embry-
onic vasculature [22]. Moreover, its presence is
so important that when knock out it causes the
embryo’s death due to defects in the formation
of microvessels [22]. It is localized in the en-
dothelium of neovessels in tissues undergoing
angiogenesis but also in arteries, veins, capil-
laries and healing wounds, being also related
with vascular maintenance [22].
xxvi

VE Cadherin Vascular endothelial cadherin, also known as
CD144 or Cadherin 5, is a class-1 transmem-
branar glycoprotein present in endothelial cells
[23]. It ensures cell adhesion, communication
and permeability through intracellular junctions
and it is considered essential for proper vascu-
lar development, as it maintains newly formed
vessels [23]. It is mainly present in young en-
dothelial cells.
xxvii

xxviii

Chapter 1
Introduction
Nowadays, researchers are able to define cancer, organ failure or hereditary diseases by a defect in a
certain cell type or by mutations in the DNA [24], [25]. Furthermore, they are increasingly efficient in
generating drugs that target these specific cellular programs, or in stabilizing and correcting the function
of misregulated proteins [26], [27]. Nevertheless, biomedical scientists fail to convert this knowledge into
therapies. This is mainly due to their inability to efficiently predict the occurrence of non-specific effects
of newly synthesized drugs, which happens in the liver [28], [29], [30]. As animal studies have proven
to be inadequate to predict human toxicity, there is now an urgent need for the development of new
high-throughput screening methods for the evaluation of drug toxicity that better resembles the human
physiology [30], [31], [32], [33] .
Isolation and subsequential culturing of primary liver cells, most notably hepatocytes (HCs), liver spe-
cific endothelial cells (LSECs) and hepatic stellate cells (HpSCs) have not been able to replace animal
testing [31],[34]. This happens because, on the one hand these cells are in short supply, as there are
not even enough livers for medical applications, being reserved mainly for transplantations. On the other
hand, because biopsy of the liver is very invasive and cannot be routinely performed to obtain these cells
from healthy donors [35], [36], [37]. In addition, isolated liver cells lose very quickly their hepatic features
and functionality when cultured in vitro [38], [39]. For these reasons, the main hope is to generate liver
cells from pluripotent stem cells (PSCs) [40].
PSCs have the capacity to divide indefinitely, to differentiate into all cell types of the human body, and
to repopulate an entire organ upon transplantation [41]. As hepatocytes represent the main cell type of
the liver and are responsible for all mature liver functions, which include metabolic regulation and drug
detoxification, several research groups are developing protocols for directing PSC fate to the hepatocyte
lineage [42], [43], [40]. By the sequential addition of growth factors and cytokines, they are able to ac-
tivate specific signalling pathways, which induce a fate switch and generate cells with some hepatocyte
features [40], [38]. The resulting cell populations remain however mixed and immature, and they are
still not suitable for high throughput drug screening [35], [44] . Even though these “hepatocyte-like cells”
display some drug detoxification activity and are able to get infected with hepatitis viruses, the major
hurdle of the field remains: it is still necessary to improve hepatocytes functionality in order to efficiently
correlate observed in vitro toxicity to human toxicity [33], [45], [46].
1

Despite major efforts, there is no available protocol for the generation of fully mature hepatocytes
[47], [48]. However, researchers have witnessed that when primary human hepatocytes or hepatocytes
generated from stem cells are co-cultured with endothelial cells, they exhibit more mature functions [49],
[50], [51] . This suggests that endothelial cells in general provide some unknown signals, either through
direct cell-cell contact or through secretion of growth factors that help maintain a mature phenotype [42],
[50]. Given the close interactions between hepatocytes and liver specific endothelial cells in vivo, it is
expected that co-culturing these cells in a 3D structure that resembles the liver lobule will provide even
better results than experiments done with non-specific endothelial cells, mainly human umbilical cord
venous endothelial cells (HUVEC)[52], [50], [51].
Since no protocols exist for the generation of endothelial cells with liver-specific features, we aim
to differentiate PSCs to endothelial cells and then, to induce a hepatic fate by overexpression of key
LSEC-specific transcription factors. If we are able to establish a renewable source of LSECs we hope
to improve the maturity of generated HCs and to gain insights into the interactions between HCs and
LSECs [52], [53].
2

Chapter 2
Literature review
2.1 Need for a renewable source of hepatocytes
Hepatocytes are specialized parenchymal cells that constitute the majority of the liver and, as shown in
Figure 2.1, have a wide range of functions. These include the regulation of glucose and lipid metabolism,
and the synthesis of proteins that are functional in the bloodstream (most notably albumin, alpha-
antitrypsin, clotting- and transport-factors) [42], [35], [40], [44]. Furthermore, hepatocytes represent
the main detoxifying cell type of the body and are responsible for the degradation of hormones, of xeno-
biotic substances and for the bioconversion of exogenously added compounds and drugs, spanning in
total over 500 classes of functions [32], [33], [54].
Due to their bioconversion functions, hepatocytes are of specific interest for toxicologists and the
pharmaceutical industry [30], [31], [32], [33]. A renewable pool of in vitro cultured hepatocytes could rep-
resent a high throughput system for the evaluation of drug metabolism (ADEMTox) and toxicity screening
[39], [45], [55]. Thus, this makes them one of the most studied cell types [56]. In recent years, drug in-
duced liver toxicity (DILI) has been the main cause of drug failure in Phase I or II clinical trials in the
pharmaceutical industry [44], [55]. In addition, more than 600 pharmaceuticals have been retracted
from the market since 1950, due to the same reason [57]. This happens because all initial drug screen-
ings are performed in animal models, which do not resemble human physiology and toxicity, and the
in vitro models such as hepatoma cell lines, do not present the normal function of human liver cells
[42], [58]. Therefore, there is a great need to obtain human hepatocytes for pharmaceutical industry
purposes, which would also lead to an increased drugs safety and lower the development costs [57],
[59].
As shown in Figure 2.1, drug metabolizing features of hepatocytes are mainly performed by enzymes
of the cytochrome P450 (CYP) family [42], [48], [60]. This family of enzymes is responsible for the first
biochemical conversion of xenobiotics and drugs, making them inactive and secretable [59]. While P450
activity is a function only present in fully mature and functional hepatocytes under the subform CYP3A4,
some subtypes such as CYP1A2 are already expressed in immature hepatic progenitors [44], [59], [61].
Unfortunately, mature functions are rapidly lost when primary hepatocytes are isolated and cultured in
3

Figure 2.1: Distinguished features of mature hepatocytes. These cells are involved in protein synthesisand storage; transformation of carbohydrates; synthesis of cholesterol, bile salts and phospholipids; anddetoxification of the blood by modification and excretion of endogenous and exogenous substances [54].
vitro. Within 5 days of culturing these cells completely lose their drug metabolizing capability and be-
come unusable for drug screening [39], [38]. Furthermore, primary hepatocytes are not expandable and
are very difficult to isolate, since liver biopsies are very invasive and donors are scarce [35], [36], [37],
[44]. A renewable source of functional hepatocytes would thus have a major impact in drug design and
screening, and it is absolutely necessary, as both animals and primary cells do not represent a good
alternative [31],[34].
In addition, a renewable source of mature hepatocytes could also be beneficial for medical applica-
tions [44]. Liver diseases affect 600 Million people worldwide, killing 1 Million people every year [42],[62].
Due to the Western live style, every year more and more people are suffering from fatty or fibrotic liver,
which eventually leads to cirrhosis and subsequential liver failure (see Figure 2.2) [62], [63]. Further-
more, hepatitis infections and drug induced liver damage are responsible for big portions of patients
suffering from liver failure [64]. While allogeneic orthotropic liver transplantation has dramatically im-
proved the treatment of end-stage liver diseases [63], there is still a high mortality rate associated due
4

to the complexity of the surgery and more often, post-surgical complications [54], [65]. Moreover, there
is a continuous need for immune suppression medication in these patients.
Figure 2.2: Stages of liver damage. The damage is represented in ascending order of severity. Liverdamage may be caused by patients lifestyle, which is the case of fatty and fibrotic liver, which eventuallyleads to cirrhosis and subsequential liver failure. Viral hepatitis also leads to the represented damages.
As if all complications were not enough, the number of viable donors is scarce and not enough to treat
all patients: transplantation lists are long and many patients die while waiting for a suitable transplant
[63]. Because this is the only current medical treatment available, multiple attempts to expand the avail-
ability of donor organs, such as opt-out organ donation programs, use of sub-optimal organs (deceased
cardiac donors or steatotic sub-optimal donor organs) or split donor transplantation have been employed
but failed to solve the problem [66], [37], [44]. Thus, all attempts to expand the availability of donor livers
have failed. Therefore, over the past years scientists have been putting an effort on expanding the avail-
ability of hepatocytes in vitro [42], [54]. Besides their important role for pharmaceutical industry, mature
hepatocytes are essential for regenerative medicine, as they can be used to develop disease models
and find new treatments; they can be used as cellular therapies in some liver diseases, overcoming the
need of a full liver; and, in a more futuristic perspective, they can be used to create biomedical devices
for liver diseases, such as a Bioartificial liver (BAL) to replace temporarily or permanently liver functions
in patients [42], [54], [67]. Thus, it is important to keep on trying to obtain them. Figure 2.3 summarizes
hepatocytes applications and their impact.
As it is not possible to obtain hepatocytes routinely and all the efforts to duplicate the available ones
have failed (because, as referred, these cells lose differentiation after a few days in culture) [39], [38], a
solution for this problem may be their generation in vitro [35], [44], [68]. Approaches for the in vivo gen-
eration of hepatocytes has been shown from a number of renewable sources ranging from embryonic
stem cells, over cells derived from the bone marrow to amniotic fluid stem cells [54].
5
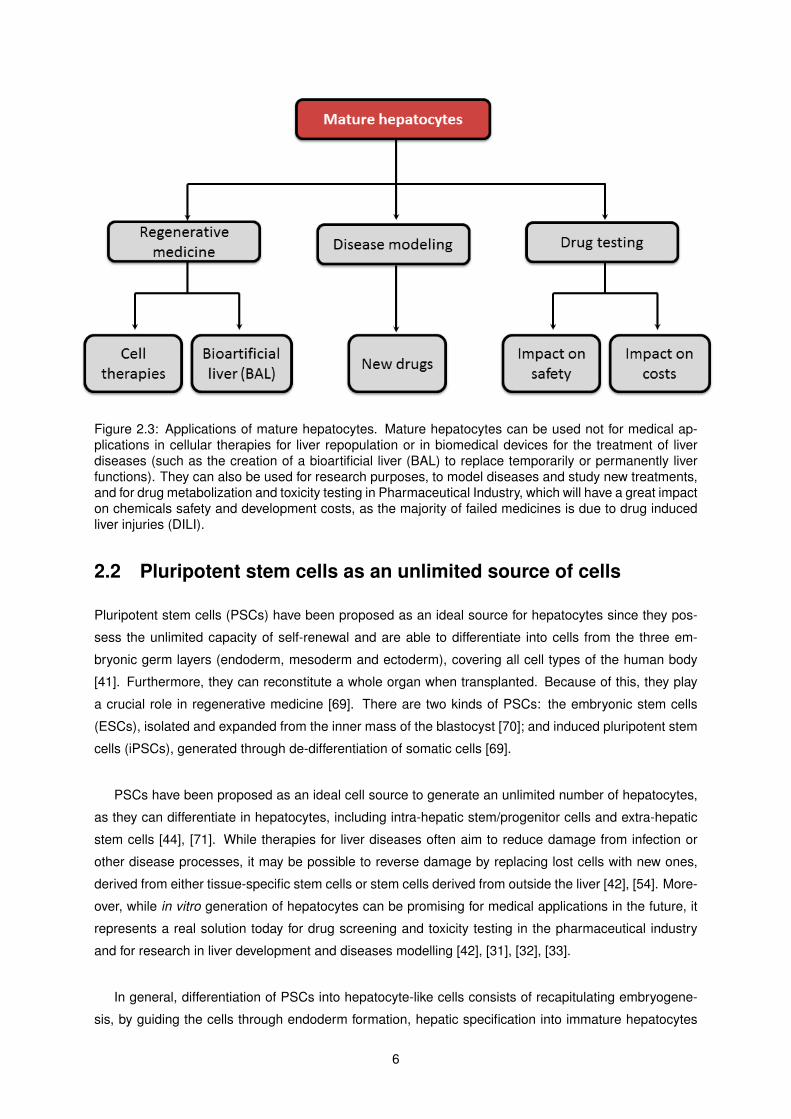
Figure 2.3: Applications of mature hepatocytes. Mature hepatocytes can be used not for medical ap-plications in cellular therapies for liver repopulation or in biomedical devices for the treatment of liverdiseases (such as the creation of a bioartificial liver (BAL) to replace temporarily or permanently liverfunctions). They can also be used for research purposes, to model diseases and study new treatments,and for drug metabolization and toxicity testing in Pharmaceutical Industry, which will have a great impacton chemicals safety and development costs, as the majority of failed medicines is due to drug inducedliver injuries (DILI).
2.2 Pluripotent stem cells as an unlimited source of cells
Pluripotent stem cells (PSCs) have been proposed as an ideal source for hepatocytes since they pos-
sess the unlimited capacity of self-renewal and are able to differentiate into cells from the three em-
bryonic germ layers (endoderm, mesoderm and ectoderm), covering all cell types of the human body
[41]. Furthermore, they can reconstitute a whole organ when transplanted. Because of this, they play
a crucial role in regenerative medicine [69]. There are two kinds of PSCs: the embryonic stem cells
(ESCs), isolated and expanded from the inner mass of the blastocyst [70]; and induced pluripotent stem
cells (iPSCs), generated through de-differentiation of somatic cells [69].
PSCs have been proposed as an ideal cell source to generate an unlimited number of hepatocytes,
as they can differentiate in hepatocytes, including intra-hepatic stem/progenitor cells and extra-hepatic
stem cells [44], [71]. While therapies for liver diseases often aim to reduce damage from infection or
other disease processes, it may be possible to reverse damage by replacing lost cells with new ones,
derived from either tissue-specific stem cells or stem cells derived from outside the liver [42], [54]. More-
over, while in vitro generation of hepatocytes can be promising for medical applications in the future, it
represents a real solution today for drug screening and toxicity testing in the pharmaceutical industry
and for research in liver development and diseases modelling [42], [31], [32], [33].
In general, differentiation of PSCs into hepatocyte-like cells consists of recapitulating embryogene-
sis, by guiding the cells through endoderm formation, hepatic specification into immature hepatocytes
6

(often referred as hepatoblast) and expansion, and hepatic maturation [42], [72], (see Figure 2.4).
Figure 2.4: Direct differentiation of hESC into hepatocyte-like cells by mimicking embryonic development.Embryonic liver development comprises three phases: endoderm commitment, hepatocyte specificationand hepatic maturation. Stem cells are collected from the inner mass of the blastocyst and derived invitro into endoderm and then hepatic lineages.
2.3 Monolayer protocols for hepatocytes cells differentiation
There are two types of protocols for hepatocyte differentiation using PSCs, which are dependent on the
way the cells are cultured: monolayer or 3D aggregates [54], [73] [74]. 3D aggregates are 3D spheroid
structures that mimic the embryoid body (EB). These are obtained by using specialized plates or by
the aggregation of the cells in suspension [73], [74]. Although EBs may replicate some of the cell-cell
interactions and cell-matrix signals experienced in vivo improving the differentiation [75], [76], the effi-
ciency is low and they lead to the production of alternate cell lineages, as EBs spontaneously develop
regional differentiation over time [42], [74]. Therefore, monolayer cultures (often co-cultures with feeder
cells) are preferable [77], [78]. For this kind of culture, PSCs differentiation is achieved by using several
growth factor cocktails, extracellular matrices and cell-cell contact to direct endodermal differentiation
and induce liver development [38], [40], [54].
7

Generally, endodermal differentiation is achieved through the addition of high concentrations of Ac-
tivin A, an activator of the transforming growth factor β (TGF-β) pathway that induces Sox17 and FoxA2,
important markers in endodermal differentiation [68], [72], [77], [79]. Other growth factors, metabolites
and antioxidants such as B27 supplement, bFGF or Wnt3A can be used, depending on the research
purpose (co-culture, specific tests, etc.) or protocol used [48], [68], [72]. Then, for hepatic induc-
tion, a combination of bone morphogenic proteins (generally BMP4) and fibroblast growth factors (e.g.
bFGF/FGF1) is applied to promote hepatic specification [78], [80]. While FGFs substitute cardiac meso-
derm signal, BMPs replace septum transversum mesenchyme signalling, inducing ventral endoderm to
adopt a hepatic fate [54], [79].
Hepatoblast differentiation and expansion is achieved by applying HGF (hepatocyte growth factor)
[60]. HGF promotes hepatoblast differentiation towards the hepatocyte lineage by inducing the expres-
sion of C/EBPα in albumin-negative fetal liver cells [81], [82], [79]. It also controls in vivo proliferation
of fetal hepatocytes and therefore can be used for further maturation of the immature hepatocytes [81].
The final differentiation step (hepatocytes maturation) differs a lot among protocols. Besides HGF, which
is known to control proliferation and maturation of immature hepatocytes, many other factors can be
applied, for example oncostatin M (OSM), dexamethason (DEX) or FGFs [42], [81], [83]. Differentiation
can be achieved from day 20-28 [72].
Figure 2.5 exemplifies some of the most used protocols for stem cell differentiation into hepatocyte-
like cells [78], [84], [85], [86].
Figure 2.5: Generation of hepatocyte-like cells from PSCs via three stepwise protocols. Schematic out-lining the differentiation kinetics and growth factors utilized in four commonly used protocols establishedby[84], [85], [78], [86].
Although differentiation of PSCs can generate hepatocyte-like cells, detailed analysis of gene ex-
pression, metabolic activity, growth potential and secretory function show that these fail in obtaining fully
functional primary hepatocytes [44], [54]. In fact, the final differentiated progeny contains only 15% ma-
8
ture hepatocyte-like cells that have functional activity in the 10-20% range of normal hepatocytes [44],
[72].
Looking at the wide variety of growth factors used in the presented protocols, not all factors and
pathways involved in hepatocytes differentiation are known [42], [87]. When immature hepatocytes are
placed in vivo, in damaged livers, they rapidly differentiate in fully mature and functional hepatocytes
[88], [42]. Thus, the next step to obtain mature hepatocytes in vitro may involve their co-culture with
other liver cells, because it is recognized that cell-cell signalling is very important for cellular differentia-
tion [89], [52], [54].
2.4 Non parenchymal liver cell types
Hepatocytes represent 70-80% of the liver cells and execute most of the liver metabolic, synthetic and
storage functions [44], [81]. However, these functions do not depend only on themselves: hepato-
cytes are supported and heavily influenced by the non-parenchymal liver cells, which interact with them
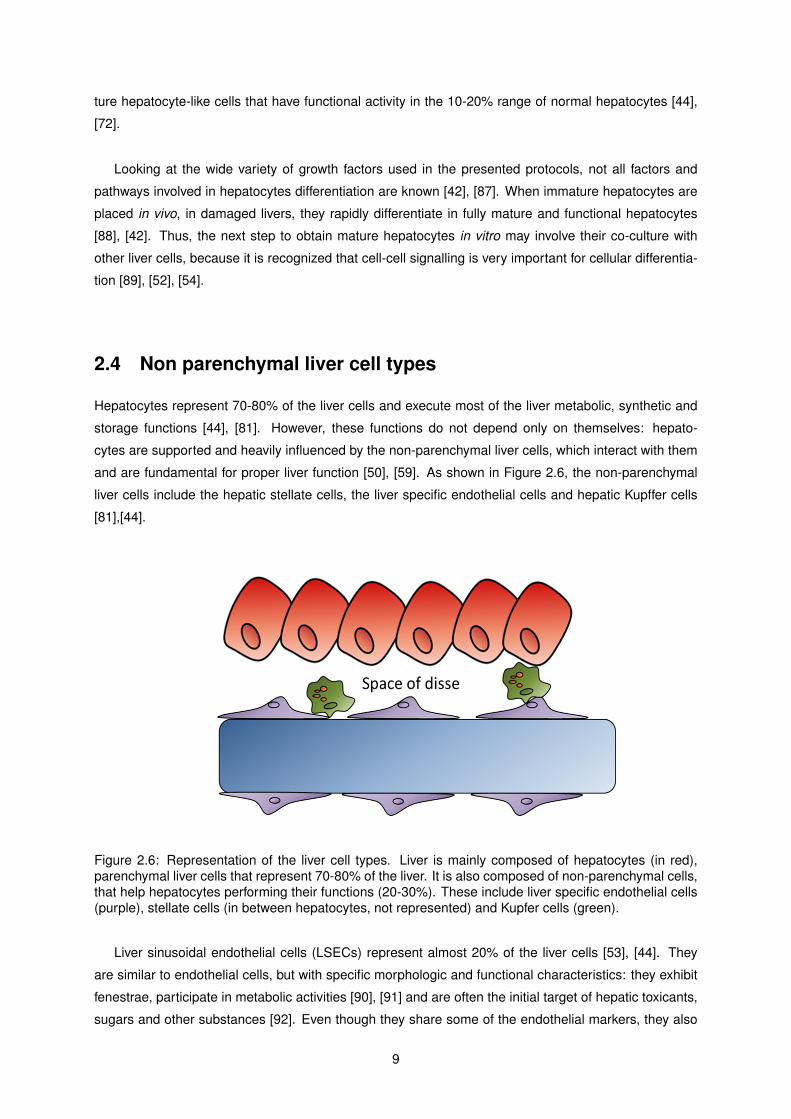
and are fundamental for proper liver function [50], [59]. As shown in Figure 2.6, the non-parenchymal
liver cells include the hepatic stellate cells, the liver specific endothelial cells and hepatic Kupffer cells
[81],[44].
Figure 2.6: Representation of the liver cell types. Liver is mainly composed of hepatocytes (in red),parenchymal liver cells that represent 70-80% of the liver. It is also composed of non-parenchymal cells,that help hepatocytes performing their functions (20-30%). These include liver specific endothelial cells(purple), stellate cells (in between hepatocytes, not represented) and Kupfer cells (green).
Liver sinusoidal endothelial cells (LSECs) represent almost 20% of the liver cells [53], [44]. They
are similar to endothelial cells, but with specific morphologic and functional characteristics: they exhibit
fenestrae, participate in metabolic activities [90], [91] and are often the initial target of hepatic toxicants,
sugars and other substances [92]. Even though they share some of the endothelial markers, they also
9
possess their own markers (for example, Lsing, FGCRB, Lsectin and MRC1) [13], [14], [15], [90]. LSECs
also excrete large particles and cells from the Disse space and eliminate soluble macromolecules and
colloidal particles from blood by active scavenging via specific endocytic receptors [93], [94], [95]. More-
over, they play a vital role in the balance of lipids, cholesterol and vitamins, and induction of hepatic
immune tolerance [50]. Because of the presence of fenestrae, LSECs are also named liver sinusoidal
endothelial cells.
Hepatic stellate cells (HpSCs) represent 5% of the liver cells and are located in the perisinusoidal
recesses, between adjacent hepatocytes [81], [96]. These cells are quiescent, producing small amounts
of ECM, storing vitamin A and secreting cytokines and growth factors [89], [44]. Kupffer cells, also
referred as resident macrophages, endocyte particles via phagocytosis and are generally attached to
LSECs [44], [97].
Like hepatocytes, LSECs and HpSCs rapidly lose their liver specific features when cultured in vitro
[98]. This makes them challenging to characterize and study. Recent studies have shown that when
LSECs and HpSCs are co-cultured together with hepatocytes, they both maintain their in vivo featured
and functionality [89], [53], [98]. Although it is not known why, the answer may be related to the growth
factors secreted by these cells, that mimic the in vivo situation [99]. Furthermore, a recent study shows
that the co-culture of human non-parenchymal liver cells with hESC promotes their differentiation into
hepatic-like cells [89], [52],[49]. Therefore, the co-culture of these cells with differentiated immature hep-
atocytes may enhance their differentiation towards more mature and functional hepatocytes.
Several studies have already shown the beneficial effects of co-cultures between hepatocytes and
endothelial cells [51]. Thus, the aim of this thesis will be first to generate endothelial cells and then
secondly, to induce them to a liver specific fate (LSECs). These cells will then be used in co-culture
systems with PSC-derived hepatocytes.
2.5 Generation of liver specific endothelial cells from PSCs
As for hepatocytes, PSCs are the ideal cell source for LSECs differentiation because they can generate
to all cell types, with an unlimited self-renewal capacity [41], [69]. Little is known about LSEC in vivo
development and precursors. Consequently, there are no protocols for their in vitro generation. Never-
theless, because LSECs are endothelial cells with liver-specific characteristics, we aim to obtain them
by firstly inducing endothelial differentiation and then, promoting a hepatic fate by overexpression of key
LSEC-specific genes [89], [50], [98].
In vivo, during the early stages of embryonic tissue specification, endodermal epithelial cells are
the initial stimuli for mesodermal cells differentiation into endothelial cells, causing changes in gene ex-
pression and cell division [100], [101], [102] . When mesoderm is formed (in the gastrulation process),
a subset of primitive mesodermal cells differentiates into angioblasts, primitive endothelial cells [102],
10
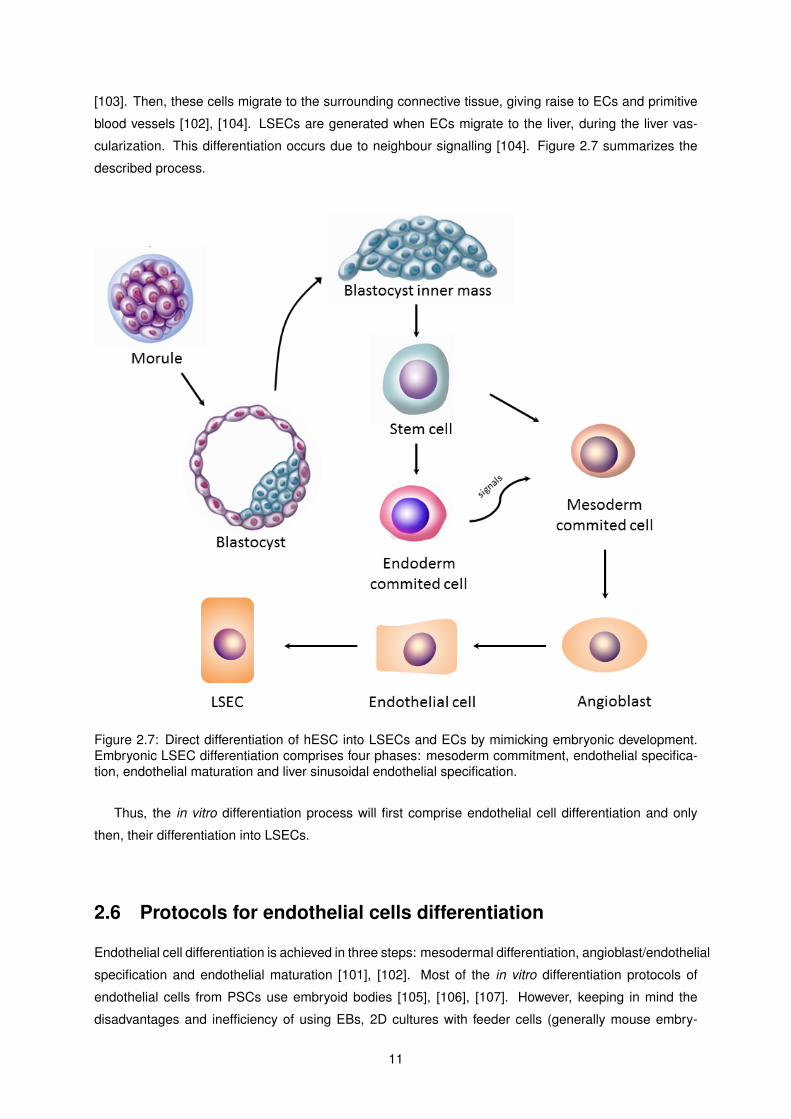
[103]. Then, these cells migrate to the surrounding connective tissue, giving raise to ECs and primitive
blood vessels [102], [104]. LSECs are generated when ECs migrate to the liver, during the liver vas-
cularization. This differentiation occurs due to neighbour signalling [104]. Figure 2.7 summarizes the
described process.
Figure 2.7: Direct differentiation of hESC into LSECs and ECs by mimicking embryonic development.Embryonic LSEC differentiation comprises four phases: mesoderm commitment, endothelial specifica-tion, endothelial maturation and liver sinusoidal endothelial specification.
Thus, the in vitro differentiation process will first comprise endothelial cell differentiation and only
then, their differentiation into LSECs.
2.6 Protocols for endothelial cells differentiation
Endothelial cell differentiation is achieved in three steps: mesodermal differentiation, angioblast/endothelial
specification and endothelial maturation [101], [102]. Most of the in vitro differentiation protocols of
endothelial cells from PSCs use embryoid bodies [105], [106], [107]. However, keeping in mind the
disadvantages and inefficiency of using EBs, 2D cultures with feeder cells (generally mouse embry-
11

onic fibroblasts, MEFs or OP9) are becoming more popular [108], [109], [110], [111], [112]. The most
used 2D method is the culture of ESCs in OP9 feeder cells layer [44], [113]. OP9 is a murine stromal
cell line that secretes cytokines and growth factors that lead the co-cultured cells to differentiate into a
hematopoietic lineage [114]. Feeder layers combined with sorting for endothelial markers and replating
can generate endothelial progenitor cells [114]. However, studies have shown that feeders interfere with
metabolic assessments [115].
A suitable alternative can be the differentiation of 2D cultures using fibronectin, matrigel or collagen
coated dishes, together with the addition of mesodermal and ECs specific growth factors and cytokines
[115]. The in vitro differentiation process starts with initial mesoderm commitment of the PSCs. For
that, BMP-4 is applied because it is known to mediate mesoderm function and differentiation during
embryogenesis [116], [117], [118]. In some protocols Activin A is also used, because it activates TGF-β
pathway, which plays an important role in different stages of mesoderm induction and endothelial spec-
ification in vivo [119], [120]. For endothelial specification, VEGF and bFGF are supplemented to the
culture medium [116], [119], [121]. VEGF (vascular endothelial growth factor) promotes angiogenesis in
vivo and bFGF promotes endothelial maturation [114], [121], [122], [123]. When endothelial specifica-
tion is achieved, primitive endothelial cells can be found in culture. For the endothelial maturation, VEGF
and bFGF are also used [119], [122], [124], [125]. In some cases, stem cell factor (SCF or kit ligand,
KL) and SB-431542 (a small molecule inhibitor of the TGF-β pathway) are also applied, because they
can improve the differentiation and maturation of ECs [111], [119].
After 14-20 days, depending on the protocol, endothelial cells are obtained, but always in a mixed
population [108], [112], [119]. Figure 2.8 gathers some of the most used protocols for PSC differentiation
into endothelial cells [108], [110], [111], [112].
Figure 2.8: Generation of endothelial cells from PSCs via three stepwise protocols. Schematic outliningthe differentiation kinetics and growth factors utilized in four commonly used protocols established by[108], [110], [111] and [112].
12

2.7 Improvement of endothelial cell differentiation
The in vitro generation of LSECs undergoes first the PSC differentiation into endothelial cells. For further
differentiation of ECs into LSECs, at the end of EC differentiation a pure population of cells is required.
However, the existent protocols generate a mixed population of endothelial (and other) cells in the end of
differentiation [110], [111] [112]. Thus, to generate LSECs is necessary to first improve the endothelial
cell differentiation process. Gain and loss of function studies in mice show that some growth-signalling
molecules and their receptors play an important role in the in vivo and in vitro differentiation of endothe-
lial cells in both embryonic and adult tissues. This is the case with the vascular endothelial growth factors
(VEGF), the transforming growth factors (TGF) and the angiopoietins (Tie1, 2 and 3), [122], [123], [126],
[127], [128]. Therefore, the study of these pathways can improve the differentiation protocols, in order to
generate more endothelial cells.
2.7.1 Role of TGF-β pathway
Transforming growth factor beta, also known as TGF-β, is a multifunctional cytokine related to the regu-
lation of proliferation, differentiation, migration and survival of several cell types [126], [128], [129]. It is
one of the best known members of a large family of secreted pleiotrophic growth factors [130]. Members
of the TGF-β superfamily have been recognized as crucial for both human ES cell pluripotency mainte-
nance and fate choices [120], [129].
TGF-β superfamily comprises two main signalling pathways: the TGF-β/Activin/Nodal group and the
bone morphogenetic protein/growth and differentiation factor (BMP/GDF) group [79], [120], [128]. These
extracellular cytokines transduce signals from the membrane to the nucleus by binding to a heteromeric
complex of serine/threonine kinase receptors, the TGF-β types I and II receptors [118]. This leads to
the phosphorylation of the receptor-regulated proteins, the R-Smads, which regulate the activity of their
target genes [118], [128], [131]. Activated R-Smads form a heterocomplex with a common mediator
(Smad4), which allows the regulation of gene expression in the nucleus [120], [122], [126], [131]. This
process occurs with the help of other cofactors or transcription factors. The two TGF-β groups activate
different types of R-Smads proteins to transduce their signals: TGF-β/Activin/Nodal activates Smad2
and Smad3, whereas BMP/GDF activates Smad1, Smad5 and Smad8 [120], [126], [131].
According to [132], Smad2-mediated Activin/Nodal signalling is essential for proper commitment of
several lineages, especially of mesendoderm. In vivo, TGF-β/Activin/Nodal signalling pathway leads
the appearance of the primitive streak in the posterior epiblast [120], [126], [133]. Then, as epiblast
cells ingress through the primitive streak, they undergo a epithelial to mesenchymal transition (EMT)
and become either mesoderm or definitive endoderm [133]. High levels of Nodal (a member of TGF-
β superfamily) are essential for endoderm specification during gastrulation, whereas low levels of this
signal lead to mesoderm specification [120], [126]. As Activin A binds to the same receptors as Nodal,
triggering similar intracellular events, and does not require previous activation, it can be used to mimic
Nodal activity in vitro [120], [133].
13

The role of TGF-β/Activin/Nodal signalling pathway in mesoderm and endoderm differentiation is
undeniable. However, studies on the effects of stimulating or inhibiting TGF-β/Activin/Nodal and BMP
signalling pathways in hESCs show that, although the first is permissive for differentiation towards a
mesoderm fate, it is not sufficient by itself [129], [134]. BMP signalling is essential for induction of meso-
derm differentiation in hESCs, by activating Smad1, Smad5 and Smad8. If this pathway is blocked, there
is no mesoderm differentiation, whereas if TGF-β/Activin/Nodal is blocked, only some defects are no-
ticed [129]. Therefore, the combination of both factors (Activin A and BMP4) is necessary for efficiently
induce mesoderm differentiation.
The TGF-β pathway is also important for further differentiation of mesoderm into endothelial lin-
eages. According to literature, TGF-β acts as an inhibitor of angiogenesis by promoting differentiation
of mesoderm into fibroblasts, inhibiting differentiation of ECs [126], [128], [130]. To regulate this, TGF-β
signalling pathway uses one TGF-β type II receptor (TGFR-II) and one type I receptor, an endothelium-
restricted activin receptor-like kinase (ALK5), which phosphorilate Smad2 and Smad3 and lead to the
inhibition of EC proliferation [128], [131]. In vitro, this pathway can be blocked by using a synthetic ALK5
kinase inhibitor, SB-431542 [111], to promote endothelial differentiation. Figure 2.9 summarizes the
necessary conditions for the in vitro generation of endothelial cells from hESCs.
Recent studies also show that TGF-β pathway can stimulate ECs proliferation, through the type I
ALK1 receptor and the phosphorylation of Smad1, Smad5 and Smad8 effectors [128], [130], [131].
Although ALK1 has an opposite effect to ALK5, these pathways interact with each other physically, pro-
viding endothelial cells a sophisticated mechanism to fine tune the endothelial function (see Figure 2.10)
[128], [126]. The balance between both pathways defines the activation state of the endothelium and it
is mediated by a co-receptor of the TGF-β pathway, endoglin (CD105) [131]. Thus, while TGF-β/ALK5
pathway leads to inhibition of EC migration and proliferation, TGF-β/ALK1 pathway leads to the induction
of these responses [128], [130].
Therefore, the promotion of TGF-β/ALK1 pathway can lead to the improvement of EC proliferation
[122]. This can be done using TGF-β/ALK1 ligands, as is the case with BMP4, Nodal and Activin A.
2.7.2 Role of FGFs signalling
Xenopus, also known as the sub-Saharan African frog, is a popular model for development studies in
research due to its fast embryonic development. As in humans, embryonic development comprises
differentiation into three germ layers (endoderm, mesoderm, and ectoderm) [135]. This specification
occurs after zygotic transcription by a complex interplay of signals and maternal determinants. One
of these maternal determinants is VegT, which can activate the transcription of several TGF-β family
members/Nodal-like signals (Vg1, Xnr1,2,4,5,6, BMP4 and Activin B), and acts with them to induce
endoderm and mesoderm formation [136]. Several studies have shown that these Nodal ligands are
essential for mesoderm formation, and that their absence results in the embryo’s death [135].
14

Figure 2.9: Role of TGF-β pathway in endothelial cells differentiation from hESCs and involved cy-tokines. Initial hESC differentiation requires the presence of Activin A. This will lead to a mesendodermlineage that can be further differentiated in endoderm or mesoderm lineages. Endoderm lineage can beobtained by applying high concentrations of Activin A, whereas mesoderm lineage can be generated byapplying low concentrations of Activin A. For this last lineage, the presence of BMP4 is also required.Endothelial differentiation is achieved by blocking TGF-β/ALK5 pathway, which can be done using asynthetic inhibitor, SB-431542.
In addition to Nodal signalling, FGF signalling is also crucial for mesoderm formation in Xenopus
[135], [136]. The disruption of this signalling in the embryo causes gastrulation defects and later loss
of trunk and tail tissues [136]. Moreover, FGF signalling is essential for proper expression of the early
mesodermal transcript, Xbra [135]. In vivo, multiple FGF ligands are involved in the regulation of meso-
derm formation, as is the case with FGF4 and FGF8 [135]. These factors are essential for paraxial
mesoderm formation. Although this has not yet been proven for humans, in many different organisms
the pathways involved in early development work in the same way. Therefore, FGFs can also play an
important role in early mesodermal development in human cells and may improve the generation of ECs.
15

Figure 2.10: TGF-β signalling in endothelial cells. TGF-β can bind to two distinct TGF-β type II/type Ireceptor complexes : ALK5 and ALK1. Activation of ALK5 inhibits endothelial cell proliferation, whereasALK1 produces opposite responses. Endoglin is an auxiliary receptor that modulates TGF-β signallingresponses: it stimulates TGF-β/ALK1 but inhibits TGF-β/ALK5 signalling.
2.7.3 Role of VEGF signalling
VEGF, or vascular endothelial growth factor, is a signal protein that induces vasculogenesis and angio-
genesis by regulation of several endothelial functions such as growth, permeability, survival, vascular
tone and production of vasoactive molecules [123], [124], [125]. Because of this, it plays a crucial role
in vascular development. The activity of VEGF is mediated through three tyrosine kinase receptors that
become active (through dimerization and transphosphorylation) in the presence of VEGF: VEGFR-1
(Flt-1), VEGFR-2 (KDR/Flk-1) and VEGFR-3 (Flt-4) [124], [137]. While VEGFR-1 and VEGFR-2 play
several important roles in endothelial cell differentiation and proliferation, VEGFR-3 is only found in en-
dothelial cells in early embryonic stages, becoming then confined to lymphatic endothelial cells [122],
[124]. Figure 2.11 summarizes the VEGF tyrosine kinase receptors family and their roles.
VEGFR-2 is widely recognized as a major receptor in transducing the effects of VEGF into endothe-
lial cells, being the most important factor in VEGF-induced mitogenesis and proliferation [124], [125].
Furthermore, receptor activation of VEGFR-2 during angiogenesis leads to the production of platelet ac-
tivating factor (PAF), which stimulates EC mitosis and migration. PAF also participates in inflammatory
cell response and adhesion, and promotes the expression of potent angiogenic factors and chemokines
16

Figure 2.11: The VEGF receptor family. The three signalling tyrosine kinase receptors VEGFR-1 (flt-1), VEGFR-2 (KDR flk-1), and VEGFR-3 (flt-4) consist of seven immunoglobulin-like structures in theextracellular domain, a single transmembrane region (not shown), and a consensus tyrosine kinasedomain (represented in green oval). VEGFR-1 and VEGFR-2 play important roles in endothelial celldifferentiation including EC proliferation, survival, migration, mobility and permeability. VEGFR-3 playssimilar roles but only in lymphatic endothelial cells. Signalling events initiated in endothelial cells uponVEGFR-2 activation and respective responses are also represented in a simplified scheme.
(like acid fibroblast factor, basic fibroblast growth factor (bFGF) and macrophage inflammatory protein
2) for EC growth [122], [125].
The role of VGFR-1 is less clear, even though it has 10-fold more affinity to VEGF. This is due to
the fact that VEGFR-1 has much weaker kinase activity and is unable to generate mitogenic response
in endothelial cells [123], [124]. Recent studies show that VEGFR-1 is important for the growth of blood
vessels at early stages of vascular development, as well as for the emergence of the liver primodium at
a very early stages of liver development [122], [137]. The absence of this protein during liver organo-
genesis results in incomplete formation of sinusoidal architecture and decreased fenestrations in LSECs
[122], [125].
Therefore, the presence of VEGF is not only indispensable for endothelial differentiation but also for
LSECs differentiation.
17

2.8 Generation of LSECs from endothelial cells
There is no known method for LSEC generation. However, one in vitro study suggests that Adrenomedullin
(AM) can help promoting it [138]. AM and its receptor system are expressed in the liver by LSECs and
exert protective effects through the modulation of apoptosis, immune responses, and cellular adhesion
[139], [140], [141]. Moreover, it is a multifunctional peptide with properties ranging from inducing vasore-
laxation to acting as a regulator of cellular growth [139], [140]. A study has shown that AM can promote
ECs differentation into LSECs by upregulation of markers, through the modulation of AM–RAMP2 (the
receptor-activity modifying protein of AM) [138]. However, the mechanisms involved in this process are
still unknown.
For this reason, it is preferable to use other methods [138]. One of the options is to use the transcrip-
tion factors involved in LSEC differentiation in vivo. Little is known about which transcription factors play
an important role in LSEC differentiation, and almost nothing about the respective signalling pathways
[13], [98],[122]. However, it is possible to create a cell line that can be activated to overexpress LSEC
transcription factors whenever wanted, in order to promote in vitro differentiation of ECs into LSECs
[78], [142]. This system is called an inducible system, and has already been done and proven to be
successful for other cell types [142], [143], [144].
2.9 Creation of an inducible cell line expressing LSEC genes
As referred, differentiation can also be achieved by generating a genetically engineered PSC cell line
containing a system that enhances the expression of some genes involved in the differentiation process.
This is already performed in the Verfaillie Lab with hepatocytes in order to improve hepatocyte cell mat-
uration.
The inducible cell lines available in the Verfaillie Lab were created by integrating an FRT-flanked cas-
sette in a “safe” gene locus, using the zinc-finger nuclease technology. This technology uses zinc finger
nucleases (ZFNs), artificial restriction enzymes which are composed of a DNA-binding domain fused to
a DNA-cleavage domain [145], [146], [147]. The DNA-cleavage domain comprises a type II restriction
endonuclease for DNA cleavage, Fok-1 [145], [148]. The DNA-binding domain is composed of three
to six individual zinc fingers, a class of engineered DNA-binding proteins that recognize specifically 3
to 6 nucleotides (9 to 18 basepairs) of a specific sequence [149], [148], [150]; a three ZNF pair can
recognize 18 basepairs, which is enough to target a single locus in a mammalian genome [148], [149].
ZNFs facilitate genome editing by creating a double-stranded break in DNA at a user-specified loca-
tion [146], [147]. A double-stranded break is important for site-specific mutagenesis in that it stimulates
the cell’s natural DNA-repair processes, namely homologous recombination and Non-Homologous End
Joining (NHEJ) [149], [150]. For that to happen, the cleavage domain must be first dimerized [150]. By
providing the cell with a template containing the homologous sequence and a donor sequence, one can
very specifically introduce donor DNA into a specific locus [146], [148]. Figure 2.12 summarizes the zinc
finger technology.
18

Figure 2.12: Zinc Finger Nuclease (ZFN) technology. Each ZFN consists of two functional domains: aDNA-binding domain composed of 3 individual zinc fingers, that recognize specifically 9bp, and a DNA-cleaving domain comprised of the nuclease domain of Fok-1. When the DNA-binding and DNA-cleavingdomains are fused together, a highly-specific pair of ’genomic scissors’ is created and the DNA is cutted.This process is called FN-mediated genome editing. ZFN can be delivered to the cell nucleus by eitherby transfection, electroporation or viral delivery.
In this specific case the user-specified location is the AAVS1 locus. The AAVS1 locus, also known
as PPP1R2C locus, is located in the 19th human chromosome and it is considered as a safe location
to host a DNA fragment with a certain function (for example, a genes cassette), as it has an open chro-
matin structure with transcription-competent properties and no known adverse effect on the cell from
the inserted DNA fragment of interest [151]. A cassette is a mobile element that includes a gene (most
commonly an antibiotic-resistance gene) and an integrase-specific recombination site [152]. The FRT-
flanked cassette is a cassette that possesses a flippase (FLP) recombinase target (FRT) sequence that
flanks the genomic region of interest. When a FRT-flanked cassette is incorporated in a cell, it can be
specifically recognized by the enzyme flippase and exchanged by another FRT flanked cassette contain-
ing genetic information of interest [153]. This second cassette can be inserted, for example, in a vector,
19

which is easy to deliver to the cell nucleus . The FRT-cassette from the Verfaillie Lab, which is contained
in the engineered cell line, is composed of a EF1a promoter and a hygromycin resistance - Herpes Sim-
plex Virus - thymidine kinase (TK) (see Figure 2.13),for selection of this cassette (and consequently of
the cell line).
Figure 2.13: FRT-flanked cassette built in the Verfaillie Lab. This is composed of two flippase recom-binase target (FRT) sequences that flank the genomic region of interest (in blue), a EF1a promoter(in green) and a hygromycin resistance - Herpes Simplex Virus - thymidine kinase (in orange). TheFRT sequences allow the enzyme flippase to recognize and exchange the current cassette by anotherFRT-flanked cassette.
As referred, the FRT-flanked cassette can be exchanged by flippase for another FRT-flanked cas-
sette (see Figure 2.14). This second cassette has to contain a universal promoter and a drug selection
gene (to allow isolation of pure PSC) as well as a lineage specific promoter with a fluorochrome or a
drug resistance gene (for instance hygromycin or puromycin resistance). Fluorochrome /drug resistance
expression can then be used to positively select for a specific population. For the exchange to happen,
the second cassette also needs to contain the FRT sequences flanking the genetic information to be
integrated in the genome, as flippase recognizes a pair of FRT sequences [153]. Random integration
of the vector cassette in the genome is ensured by the thymidine kinase (TK) contained in the original
cell line cassette. TK has the capacity to metabolize doxycycline (DOX) into a toxic compound and thus,
when DOX is present in the medium, it leads to cell death. Therefore, if the cassette is integrated in the
correct place, no toxic compounds are produced. If the cassette is not placed correctly in the site of the
initial cassette, the TK killer gene will be activated, leading to cellular death.
To promote LSEC differentiation, the engineered cell line available in the Verfaillie Lab can be used
to create a cell line expressing LSEC transcription factors. Using a pTripZ vector containing the cassette
represented in Figure 2.14, which is also available in the Verfaillie Lab, a multiple cloning site (MCS) can
be created to insert LSEC genes, through simple steps of digestion and ligation, with the appropriate
enzymes. The FRT-flanked cassette present in this plasmid contains a tetracycline-controlled transcrip-
tional activation system, which is activated in the presence of doxycycline (DOX) [154]. This kind of sys-
tem is known as Tet-On, based on a reverse tetracycline-controlled transactivator protein (rtTA). rtTa is a
fusion protein comprising a Tet repressor binding protein TetR (derived from the TC resistance operon in
Escherichia coli transposon Tn10), and a strong transactivator domain of VP16 from the Herpes Simplex
Virus [155]. The rtTA protein regulates the expression of a certain gene under transcriptional control of
a tetracycline responsive element (TRE), which comprises a Tet operator (tetO) sequence concatemers
(18 mer) fused to a minimal promoter derived from human cytomegalovirus (CMV min) [155]. rtTA can
only recognize tetO sequences in TRE of the target gene in the presence of DOX, leading then to the
expression of the genes downstream from that site by activating the CMV min promoter [154], [155]. This
20

Figure 2.14: Exchange of a FRT-flanked cassette contained in the AAVS1 locus of a modified cell line byanother FRT-flanked cassette. This process is mediated by the enzyme flippase, which recognizes andexchanges the FRT-flanked cassettes. The cassette to be inserted in the modified cell line is an induciblecassette, containing a Tet-On system with a reverse tetracycline-controlled transactivator protein (rtTA).In the presence of doxycycline, the rtTa protein recognizes the tetO sequence contained in TRE element,leading to the activation of a CMV minimal promoter and transcription of the genes contained in the MCS.The cassette also contains a puromycin drug resistance gene for selection and a splice acceptor site(SA) to allow its transcription.
kind of systems is called Inducible System, as the expression of the genes of interest is only activated if
DOX is added to the medium. Downstream of the TRE, a multiple cloning site (MCS) can be created. A
MCS is a segment of DNA containing several unique restriction sites. Thus, by simple steps of cloning
(digestions and ligations), the MCS can be created and a set of genes can be inserted in this site. The
cassette comprises also a puromycin drug resistance gene, that allows the selection of the cell line after
the cassette is exchanged, and a splice acceptor site (SA) for its transcription to occur.
21

22

Chapter 3
Materials and methods
3.1 Cell culture
3.1.1 Embryonic stem cells maintenance
The human embryonic stem cell line used for this research was a H9 (WA09) from WiCell Research
Institute, which is derived from human blastocyst. These cells were kept undifferentiated in 6-well plates
with a mouse fibroblasts feeder layer, treated with mitomycin C. Cells were fed by using a hESC medium
prepared in the laboratory. 500 mL of this medium is composed of: 285 mL of DMEM-F12+Hepes
(Invitrogen), 100 mL of KnockOutTM Serum Replacement (Invitrogen), 2.5 mL of L-glutamine (Sigma),
3.5 µL of β-Mercaptoethanol 500 mM (Sigma), 5 mL of NEAA 100x (Invitrogen) and 0.5 mL of Pen-
incilin/Streptomycin 100x (Peptrotech). The cell manipulation was done under sterile conditions in a
vertical laminar flow bench, the Airstreamr Class II BioSafety Cabinet (Esco). The hESCs were incu-
bated at 37◦C with 5% of CO2 in a cell incubator (Binder).
Normally, once per week the cells were passaged with a ratio of 1:6. Determination of the splitting
day was based on the presence of differentiated colonies. When the cells were split, the first step was
the aspiration of the differentiated colonies, previously marked under the microscope, using a vacuum
system. After that, the culture medium was removed and the cells were washed with 1 mL of Phosphate-
Buffered Saline (PBS) (Gibcor). To detach the cells from the plate, 1 mL of Collagenase IV (Gibcor)
was applied and the cells were incubated for 5 minutes at 37◦C.
After incubation, the colonies should exhibit detached edges when observed under the microscope.
If that was verified, Collagenase IV was removed and 1 mL of DMEM (Gibcor) or hESC maintenance
media (without bFGF) was added. To separate the cells from the colonies, the colonies were scratched
with a tip. Then, to promote complete detachment, the colonies were scraped with a scraper. The single
cells floating in the medium were collected into a Falcon tube. As some cells may still remain in the
wells, 1 mL more of DMEM or hESC maintenance media (without bFGF) is added to wash them, being
subsequentially collected into the same Falcon tube.
The collected cells were then centrifuged for 5 minutes at 300g. Afterwards, the medium was re-
23
moved and 6 mL of hESC maintenance medium was added into the Falcon (1 mL per number of final
wells). For pellet detachment, the Falcon tube was gently inverted until all cells were spread in the
medium, under the form of small colonies. Afterwards, 1 mL of mixture was added in a drop-wise man-
ner to each well of the previously prepared 6-well plates, containing already the feeder cells and 1.5 mL
of hESC maintenance medium.
3.1.2 Preparation of hESC for differentiation
Prior to differentiation, hESCs were passaged to 24-well plates coated with Matrigel (BD Biosciences),
in the absence of feeder cells. For cell maintenance, a specific feeder-free medium, mTeSRTM (Stem
Cell Technologies), was selected.
For cell passaging, the old media was removed and the cells were washed with 1 mL of PBS. To
detach the cells, 1 mL of Trypsin 0,05% (Gibcor) was added and the cells were incubated for 5 minutes
at 37◦C. The usage of trypsin facilitates the attainment of single cell colonies. After incubation, trypsin
was removed and 1mL of DMEM or hESC maintenance media (without bFGF) was added. With that, the
wells were washed by pipetting up and down and then, the medium containing the cells was collected
into a Falcon tube. To collect the cells that may remain in the wells, 1 mL more of DMEM or hESC
maintenance media (without bFGF) was added and used to wash the well.
The collected cells were then centrifuged for 5 minutes at 300g. Afterwards, the medium was re-
moved and 1 mL mTeSRTM media was added per well. Finally, in order to seed 175000 cells per well
(in 500 µL), the cells were counted with a Nucleocounterr (Chemometec) and diluted with the appropri-
ate volume of mTeSRTM . The cells were then added in a drop-wise manner to the previously prepared
plates and cultured at 37 ◦C with 5% of CO2 in mTeSRTM media, until 60-70% of confluence was
reached.
When confluence was achieved, differentiation could start. For that, Liver Differentiation Medium
(LDM) prepared in the laboratory was used, together with the right concentrations of growth factors
specific to each different protocol. 500 mL of medium is composed of: 285 mL of DMEM LG (Invit-
rogen), 200 mL of MCDB pH=7.2 (Sigma), 5 mL of Penincilin/Streptomycin 100x (Invitrogen), 5 mL of
L-Ascorbic Acid 2.9 g/L (Sigma), 1.25 mL of ITS (Invitrogen), 1.25 mL of LA-BSA 100x (Sigma), 0.5 mL
of β-Mercaptoethanol 500 mM (Invitrogen) and 2 mL of Dexametasone 250 µM. All growth factors used
were provided by Peprotechr and stored at -80◦C in a stock concentration of 10 ng/µL.
3.2 RNA extraction and cDNA synthesis
For gene expression analysis, the cells were lysated and the RNA was collected, at different time points.
For that, at the day of RNA collection, the old media was removed and the cells were washed with 1 mL
of PBS (Gibcor). To extract the RNA from the cells, 350 µL of Lysis Buffer RLT (Sigma) (with 10 µL/mL
24

of β-Mercaptoethanol) was applied and pipetted up and down, to promote cell detachment. Then, the
mixture was collected into an Eppendorf tube. Afterwards, to avoid spilling of the lysis buffer into the
other wells of the plate, the well where the RNA was extracted was washed twice and left with 1 mL of
PBS. The collected lysates were stored at -80◦C.
To isolate the RNA from the lysates, a commercially available GenEluteTM Mammalian Total RNA
Miniprep Kit (Sigma) was used. The RNA extraction was performed following the protocol provided by
the supplier. In the end, the RNA fragments were eluted in 50 µL of Elution Solution from the kit and
the RNA concentration was measured at 260 nm and 280 nm with a NanoDrop ND-1000 UV-Vis Spec-
trophotometer (Thermo Scientific).
For gene expression analysis, cDNA was synthesized from the extracted RNA by mixing 2 µL of
Reverse Transcriptase (RT) Enzyme Mix and 10 µL of 2x RT Reaction Mix from SuperScriptr III Re-
verse Transcriptase (First-strand synthesis Supermix for qRT-PCR kit from Invitrogen). Moreover, 1 µg
of RNA was added to the mix (with a maximum of 8 µL) and also nuclease-free water up to 20 µL, in
case less than 8 µL of RNA is used. The reactions were performed in a Thermal Cycler 2720 (Applied
Biosystemsr), with a first cycle at 25◦C for 10 minutes, then a second at 50◦C for 45 minutes and finally
a third cycle at 85◦C for 5 minutes. Then, 1 µL of RNAse H from SuperScriptr III Reverse Transcriptase
kit was added to each tube, and the tubes were further incubated at 37◦C for 20 minutes. In the end,
the cDNA samples were diluted with 180 µL of nuclease-free water and stored at -20◦C.
3.3 Quantitative Polymerase Chain Reaction (qPCR)
The Quantitative Polymerase Chain Reaction (qPCR) was carried out using an Applied Biosystemsr
ViiATM 7 Real Time PCR System (Life Technologies) and respective software, with qPCR FrameStarr
384-well PCR plates (4titude) and dsDNA-binding reporter Platinumr SYBRr Green (Invitrogen), of
which 5 µL were added to each well. Moreover, 1 µL of a 2.5 µM mix of forward and reverse primers,
3 µL of H2O and 2 µL of template cDNA were added to each well. Primer sequences can be found in
Table 3.1. Triplicates were made of each gene and cDNA sample. For data analysis, the outliers were
removed and the ∆CT of each condition was calculated. ∆CT values were then normalized with the
housekeeping gene GAPDH. The graphs, means and standard error of the means of each gene for the
different protocols and days were obtained with GraphPad Prismr 5 software.
3.4 Fluorescence-activated cell sorting (FACS) and flow cytome-
try analysis
For fluorescence-activated cell sorting (FACS) and flow cytometry analysis, the cells were detached
using a 2 mM EDTA-PBS solution (Gibcor) and by pipetting up and down. The dissociated cells were
collected into a Falcon tube, being filtered through its cell strainer cap (35-µm mesh).
25

Gene Sense Sequence
GAPDH Forward TCAAGAAGGTGGTGAAGCAGGReverse ACCAGGAAATGAGCTTGACAAA
Oct4 Forward TCGAGAAGGATGTGGTCCGAReverse GCCTCAAAATCCTCTCGTTG
Nanog Forward CCTGTGATTTGTGGGCCTGReverse GACAGTCTCCGTGTGAGGCAT
Brachyury Forward ACCCAGTTCATAGCGGTGACReverse AAGCTTTTGCAAATGGATTG
PDGFR-α Forward AACCCTGCTGATGAAAGCACReverse TCCTTTCTAGCATGGGGACA
PDGFR-β Forward CCCTTATCATCCTCATCATGCReverse CCTTCCATCGGATCTCGTAA
Sox17 Forward CGCTTTCATGGTGTGGGCTAAGGACGReverse TAGTTGGGGTGGTCCTGCATGTGCTG
Crcx4 Forward CACCGCATCTGGAGAACCAReverse GCCCATTTCCTCGGTGTAGTT
Gata6 Forward CCCTACTCGCCCTACGTGReverse GGACAGGTCCTCCAGCAG
KDR Forward ACAACCAGACGGACAGTGGTReverse AGCCTTCAGATGCCACAGAC
CD31 Forward TCTGCACTG CAGGTATTGACAAReverse CTGATCGATTCGCAACGGA
Tie2 Forward TGCCCAGATATTGGTGTCCTReverse CTCATAAAGCGTGGTATTCACGTA
VE Cadherin Forward GTTCACGCATCGGTTGTTCReverse TCTGCATCCACTGCTGTCA
CD105 Forward AAGACCAGGAAGTCCATAGGReverse TGCGAGTAGATGTACCAGAG
Id1 Forward TTGGAGCTGAACTCGGAATCReverse CAGGCTGGATGCAGTTAAGG
ENFB1 Forward GTTCTCGACCCCAACGTGTTReverse CAGGCTTCCATTGGATGTTGA
Lsectin Forward CTTCCTCACTCGGAACACGReverse GGTCAGCAGTTGTGCCTTTT
FCGRB Forward CAAAGTTGGGGCTGAGAACAReverse CCCTGTCCTCCCCAAGGGGAA
MRC1 Forward TCCTGTCCATCAGGAGAAGGReverse ATTTCTGTGATTCGGCATCC
Lsign Forward CTGTCCCAAGGACTGGACATReverse CGTGCCTTCCTGATTTAGGT
Table 3.1: List of primers used for qPCR.
The tubes were then span down, the medium was removed and the pellet was resuspended in 150
mL of Staining Medium (SM, composed of 5% of Fetal Bovine Serum (FBS) (Gibco) in PBS (Gibco)).
This volume was subsequentially divided into three flow cytometry tubes (BD Biosciences) and the pri-
mary antibodies and isotype controls were added (see Table 3.2). The antibodies and isotopes are kept
stored at 4◦C, in the dark.
The cells were then incubated for 15 minutes at room temperature and after that, 150 mL of PBS was
added to each tube, to remove the non-ligated antibodies. Then, the tubes were centrifuged at 300g
for 5 min and supernatant was discarded. Afterwards, the pellet was resuspended in 150 mL of PBS,
the tubes were centrifuged again at 300g for 5 minutes and the supernatant was discarded. Finally, the
26

pellet was resuspended in 200 mL of SM.
Antibody Color Catalogue Nr Stock Conc. Incubation (100 µL) IsotypeKDR (Flk1) PE 560494 25 µg/ml 5 µl Mouse IgG1, kCD140a (PDGFR-α) PE 556002 12.5 µg/ml 8 µl Mouse IgG2a, kCD140b (PDGFR-β) PE 558821 50 µg/ml 2 µl Mouse IgG2a, kCD31 PE 555446 6.25 µg/ml 16 µl Mouse IgG1, kMouse IgG1, k PE 555749 50 µg/ml 2 µl -Mouse IgG2a, k PE 555574 50 µg/ml 2 µl -
Table 3.2: List of antibodies and isotypes used for FACS from BD Biosciences.
The stained cells were analysed (and in the case of FACS also sorted) on a fluorescence-activated
cell sorter BD FACSCantoTM (BD Biosciences) using FACSDiva software (BD Biosciences). The fluo-
rochromes were excited at 488nm. Green fluorescence was detected using 502 LP and 530/30 filters
and red fluorescence using 556LP and 585/42 filters.
3.5 Magnetic-activated cell sorting (MACS)
For Magnetic activated cell sorting, the cells were detached using a 2 mM EDTA-PBS solution (Gibcor)
and by pipetting up and down. The dissociated cells from each well were divided by two Falcon tubes.
Then, one part was resuspended in an incubation buffer (1x DPBS without Ca+2 and Mg+
2 , 0.5% BSA)
and antibody CD31-PECAM1 (BD Biosciences), and the other was resuspended in incubation buffer
and isotype control (mouse IgG1, BD Biosciences). Both were then incubated for 1h. After that, the
tubes were centrifuged (600g, 6 minutes) and the supernatant was removed. The cells were the washed
and re-suspended in labeling buffer (1x DPBS without Ca+2 and Mg+
2 , 0.5% BSA, 2 mM EDTA) and
anti-PECAM1 microbeads (Miltenyi Biotec) for 30 minutes.
To sort the CD31-positive cells, a MiniMACSTM kit (Miltenyi Biotec) was used, together with a
MiniMACSTM separator and MACS magnetic column. Before separation, the column was rinsed with
separation. The column was then loaded and washed three times with separation buffer (1x DPBS
without Ca+2 and Mg+
2 , 0.5% BSA, 2 mM EDTA) to collect the unlabeled cells (CD31 negative cells).
During that, the magnetically labeled cells were retained on the MACS column. Afterwards, the positive
cells were eluted and the resultant fraction was analyzed with a flow cytometer BD FACSCantoTM (BD
Biosciences), to obtain the percentage of CD31 positive cells.
3.6 Plasmid construction
3.6.1 Cloning procedures
The PCR reactions were performed using a Phusion DNA Polymerase (New England BioLabs) and re-
spective buffer (Buffer Phusion Red). The reaction included 100 ng of template, 10 µL of buffer Phusion
27

Red (New England BioLabs), 5 µL of 1x dNTPs (prepared from 100 mM dNTPs set PCR grade, Invitro-
gen), 5 µL of a 5 µM mix of forward and reverse primer, 0.2 µL of Phusion enzyme and nuclease-free
water up to 50 µL. The reactions were performed in a Thermal Cycler 2720 (Applied Biosystemsr) with
a first cycle at 96 ◦C for 5 minutes, then a second cycle at 96◦C for 30 seconds, 58◦C for 30 seconds
and 72◦C for 1 minute per kb of template, repeated for 25 times, and finally a third cycle at 10◦C until
samples were stored at -20◦C.
The high melting temperature (HMT) PCR was performed using also a Phusion DNA Polymerase
(New England BioLabs), but with a special buffer (Buffer Phusion Green) and 1x DMSO (New England
BioLabs). The reaction included 100 ng of template, 10 µL of buffer Phusion Red (New England Bio-
Labs), 0.6 µL of 1x DMSO (New England BioLabs), 5 µL of 1x dNTPs (prepared from 100 mM dNTPs
set PCR grade, Invitrogen), 5 µL of a 5 µM mix of forward and reverse primer, 0.2 µL of Phusion enzyme
and nuclease-free water up to 50 µL. The reactions were performed in a Thermal Cycler 2720 (Applied
Biosystemsr) with a first cycle at 96 ◦C for 5 minutes, then a second cycle at 96◦C for 30 seconds, 68,
70 or 72 ◦C for 30 seconds and 72◦C for 1 minute per kb of template, repeated for 35 times, and finally
a third cycle at 10◦C until samples were stored at -20◦C.
The digestion reactions were performed using enzymes from Fermentas (Thermo Scientific) and their
respective buffers. The digestion reactions included 1 µg of template, 1 µL of enzyme, 2 µL of buffer
and water up to 20 µL. The double digestions were done using the appropriate buffer and the concentra-
tions supplied by the manufacturer (at http://www.thermoscientificbio.com/webtools/doubledigest/). The
reactions were run for 3h at 37◦C, followed by inactivation at 85◦C for 15 minutes, in a Thermal Cycler
2720 (Applied Biosystemsr). Both PCR and digestion products were cleaned using a Quick PCR purify
kit (Invitrogen).
The ligations were performed using a T4 DNA Ligase (New England BioLabs). The ligation reaction
included 15 ng of Vector, 2 µL of buffer Ligase (New England BioLabs), 1 µL of Ligase, the calculated
concentration of Insert (CIns), given by the Equation 3.1, and water up to 20 µL. In the Equation 3.1, 5
represents five times more concentration of insert than of vector, V represents the vector concentration
used (15 ng), SIns represents the size of the insert and SV the size of the vector. A ligation reaction
without insert was also performed as control. The ligation reactions were performed overnight at 22◦C.
CIns =5V SIns
SV(3.1)
For plasmid selection, 25 µL of heat-shock 5α competent Escherichia coli cells (New England Bio-
labs) were mixed with 2.5 µL of ligated DNA without pipetting up and down. After 30 minutes of diffusion
on ice, the bacteria were submitted to 42◦C for 45 seconds and then incubated for 2 minutes on ice.
The transformants were rescued for 1h at 37◦C using 250 µL of SOC outgrowth medium (New Eng-
land BioLabs), in an Innova 40 shaker (New Brunswick Scientific). Subsequentially, they were plated on
LB agar plates, which were then incubated overnight at 37◦C in a Heraeus incubator (Thermo Scientific).
28

The plasmids were then isolated from the selected colonies with a Quick plasmid miniprep kit (Invit-
rogen), after overnight growth in LB broth (Sigma). This was done by following the protocol provided by
the supplier. In the end, the plasmids were eluted with 30 µL of the Elution Solution from the kit, and the
DNA concentrations were measured at 260 nm and 280 nm with a NanoDrop ND-1000 UV-Vis Spec-
trophotometer (Thermo Scientific). The plasmids confirmation was done with digestion, using specific
enzymes. One of the correct colonies was selected and sequenced for confirmation.
The Sanger sequencing was performed to confirm that the selected plasmids were correct. This was
done at each step of the plasmid construction. The samples were prepared using a Big-dye sequencing
kit (Applied Biosystemsr) and a X-terminator purification kit (Applied Biosystemsr), according to the
protocols provided by the supplier. Then, the samples were sent to the Sequencing Centre.
3.6.2 Gel electrophoresis
The PCR amplification products and the digestions were confirmed visually using agarose gel elec-
trophoresis. The gels made for that were composed of 1% Agarose (Sigma) in buffer Tris-Acetate-EDTA
(TAE) 1x (prepared from buffer TAE 10X (Bioland Scientific) diluted in MiliQ water), stained with Syber
Safe DNA Gel Stain (Invitrogen) in a ratio of 1:30000. The DNA samples to be loaded were mixed with
6x Blue Gel Loading dye (New England BioLabs). A 1kb ladder (Invitrogen) was used as guide. The gels
were run in a Biorad Power PAC 300 at 135V and 400mA, on average for 20 minutes. The photographs
of the gels were taken using a Transiluminator Biorad Gel DOC XR+ and respective software.
3.6.3 Gel purification
Purification of the extracted gel bands was done using a Quick gel extraction kit (Invitrogen), following
the instructions provided by the supplier.
29

30

Chapter 4
Results
4.1 Optimization of EC generation protocol
4.1.1 Current protocol
The first step for LSEC generation is the generation of endothelial cells (ECs). In the Verfaillie Lab there
is already an established protocol for the generation of ECs (see Figure 2.8). However, this protocol
gives raise to a mixed population, indicating that differentiation is not exclusive towards endothelial lin-
eages.
In order to look into the progression of the differentiation, gene expression of several genes and at
different time points was analysed, using the technique of qPCR. To determine the amount of differen-
tiated cells at each step of differentiation, FACS technique was used to sort the cells based on their
surface markers, but only when found appropriate (for the best protocols).
When taking a look at the cells generated by the available protocol at the Verfaillie Lab, FAC sort-
ing at day 4 indicates that only 20-40% of the cells are mesoderm, as they express PDGFR-α marker,
and 30-50% are mesoderm/endothelial committed cells as they are positive for KDR, a mesoderm/early
endothelial marker (see Figure 4.1). Although there is a small number of mesoderm/endothelial com-
mitted cells, sorted KDR positive cells present a high expression of KDR and PDGFR-α genes, when
compared to negative and hESCs cells, as it can be seen in the expression profiles represented in Fig-
ure 4.2. Mature endothelial markers, which is the case with VE cadherin, are not yet expressed by day 4.
Although gene expression of the KDR sorted cells was high for mesoderm and early endothelial
genes by day 4, by day 10 there is only 10-15% of endothelial/CD31 positive cells (see Figure 4.3).
CD31 is an endothelial cell surface marker only expressed in endothelial cells, and therefore can be
used to identify them. The low amount of endothelial cells at the end of differentiation suggests that
it is not exclusive for endothelial lineages, and most of the cells are directed towards other lineages.
When taking a look at the amount of PDGFR-β cells by day 10 (see Figure 4.3), about 74% is positive.
Late expression of this marker indicates that differentiation is being directed towards mesenchymal lin-
eages, possibly fibroblasts, supporting the theory that differentiation is going towards other cell lineages.
31

Figure 4.1: Flow cytometric isolation of KDR-expressing (right) and PDGFR-alpha-expressing (left) hEScell-derived endothelial mesoderm cells at day 4, using the protocol from the Verfaillie Lab [108].
Figure 4.2: Gene expression analysis of mesoderm KDR sorted cells differentiated from human ES cells(quantitative RT-PCR) at day 4, using the Verfaillie protocol. Expression level of the differentiated cellswas calculated relative to the housekeeping gene, GAPDH. Pluripotency gene Oct4, mesoderm genePDGFR-α, early endothelial marker KDR and mature endothelial gene VE cadherin were analyzed atday 4 for KDR positive and negative cells, and compared to normal expression in hESCs.
Although the little number of CD31 positive cells, gene expression analysis to these cells show that
they present high expression of endothelial genes (see Figure 4.4).
To obtain a pure population of endothelial cells, CD31 positive cells were MAC sorted and replated
at day 10. However, seven days after replating the cells appear morphologically as fibroblasts, when
comparing with day 10 (before replating) - see Figure 4.5).
Sorting of these cells (Figure 4.6) show that seven days after replating only 22% remains CD31 pos-
itive. When comparing the gene expression profile of these cells with the CD31 positive sorted cells
at day 10 of differentiation, a significant decrease can be noted for all endothelial genes. In fact, the
32

Figure 4.3: Flow cytometric isolation of CD31-expressing (right) and PDGFR-β-expressing (left) hEScell-derived endothelial cells at day 10, using protocol from the protocol from the Verfaillie Lab [108].
Figure 4.4: Gene expression analysis of endothelial CD31 sorted cells differentiated from human EScells using the protocol from Verfaillie Lab at day 10 (quantitative RT-PCR). Expression level of thedifferentiated cells was calculated relative to the housekeeping gene, GAPDH. Early endothelial markerKDR and endothelial genes CD31, VE cadherin, Tie2 and CD105 expression was analysed at day 10 forCD31 positive (black bars) and negative cells (grey bars), and compared to normal expression in hESCs(white bars).
expression profile at day 7 of replating becomes similar to the expression profile of CD31 negative cells,
as can be seen in Figure 4.7. This indicates that differentiation is lost when cells are kept in culture,
which may be related to the low number of endothelial cells that are generated.
Thus, the first goal of this thesis was the improvement of the endothelial cell (EC) generation proto-
col. The improvements were done over the available protocol, by testing the effect of different mesoderm
and endothelial signals/transcription factors and their concentrations during the differentiation process.
It is believed that a population with a bigger amount of ECs can be successfully replated after sorting
and thus, it can be used for generation of LSECs.
33

Figure 4.5: Morphology of CD31 positive cells sorted cells and after 7 days replating. On the left,morphology of MAC sorted cells for CD31 marker after replating. On the right, morphology of the samecells 7 days after replating.
Figure 4.6: Flow cytometric isolation of CD31-expressing hES cell-derived endothelial cells after 7 daysof replating. Cells were differentiated using the protocol from the Verfaillie Lab [108], then sorted withMACS for CD31 marker and replated. After 7 days, cells were detached with EDTA and FAC sorted forCD31.
4.1.2 TGF-β pathway
As referred in Chapter 2, TGF-β pathway plays an important role in mesodermal differentiation and in
angiogenesis. To generate endothelial cells from mesoderm, it is essential that TGF-β/Alk5 pathway is
blocked, or else cells differentiate naturally into fibroblasts (mesenchymal cells). For that, a synthetic
inhibitor named SB-43152 can be used.
Based on this, the first improvement applied to the protocol for endothelial cell generation was the
addition of this inhibitor from day 4, when mesoderm cells start differentiating into ECs. This protocol
was named P1 and was used as control for all further experiments. Considering the importance of this
inhibitor, its effect in differentiation when applied earlier (from D2-D10) was also tested.
34

Figure 4.7: Gene expression analysis of endothelial CD31 sorted cells differentiated from human EScells using the protocol from Verfaillie Lab at day 10 and after 7 days of replating (quantitative RT-PCR).Expression level of the differentiated cells was calculated relative to the housekeeping gene, GAPDH.Early endothelial marker KDR and endothelial markers CD31, VE cadherin, Tie2 and CD105 expressionwere analysed at day 10 for the CD31 positive (grey bars) and negative cells (black bars), and comparedto normal expression in hESCs (white bars) and to the expression of MAC sorted replated cells after 7days in culture (red bars).
The second improvement applied was related with mesoderm differentiation. The fact that a low
amount of endothelial cells is generated with the Verfaillie protocol is associated with its low yield in
mesoderm differentiation (about 50%). For endothelial differentiation, hESCs have to undergo meso-
derm differentiation. Thus, improvement of hESC differentiation into mesoderm is required for the im-
provement of endothelial differentiation. According to literature, low concentrations of Activin A direct
differentiation towards mesoderm, together with BMP4 (see Figure 2.9). In the Verfaillie protocol BMP4
is already supplied, but not Activin. Thus, the second improvement was the addition of Activin A for the
two first days of differentiation (D0-D2), together with SB-43152. This was done in two different concen-
trations to determine the effect of this cytokine and its concentration in mesoderm differentiation.
In sum, Figure 4.8 summarizes the first four protocols tested. The concentrations used in each pro-
tocol can be found in Table 4.1.
Act A(D0-D2)
BMP4(D0-D6)
SB-43152(D4-D10) or (D2-D10)*
VEGF(D4-D10)
bFGF(D4-D10)
P1 -
20 ng/mL 2 µL/mL 50 ng/mL 20 ng/mLP2 5 ng/mLP3 10 ng/mLP4* -
Table 4.1: Concentrations of the cytokines used in protocols P1, P2, P3 and P4.
To determine which protocol helps promoting best the differentiation towards mesoderm and en-
35

Figure 4.8: First protocols for the improvement of EC generation, based on [108]. Protocol P1 includesthe addition of SB-43152 from D4 to D10, a synthetic TGF-β/ALK5 inhibitor that promotes the gener-ation of endothelial cells. Protocols P2 and P3 include also the addition of Activin A, a TGF-β ligandthat promotes mesoderm differentiation of hESCs, in a lower and a higher concentration, respectively.Protocol P4 tests the effect of adding SB-43152 from day 2.
dothelial cells, gene expression was analysed using qPCR, at days 2, 4, 6 and 10 of differentiation.
Firstly, to determine the evolution of the differentiation state of the hESCs along the differentiation
process, the expression of two pluripotency genes (Oct4 and Nanog) was analyzed. Oct4 plays an
important role In hESCs self-renewal and pluripotency maintenance[19]. Nanog directs propagation of
undifferentiated ES cells and acts as an intrinsic effector of ESCs self-renewal, being a key factor for cell
pluripotency maintenance [16]. Both genes are expressed in totipotent and pluripotent ESCs. Figure
4.9 represents the expression levels of these genes during the differentiation process. As expected, the
expression levels of both pluripotency genes decrease along the differentiation process for all protocols,
as cells are differentiating.
The first step of hESCs differentiation into ECs is mesodermal commitment. Thus, the evolution
of the mesodermal genes expression during differentiation was analysed. For that, mesoderm genes
Brachyury, PDGFR-α and PDGFR-β were selected and their expression measured at days 2, 4 and 6
for Brachyury (early marker), and also at day 10 for PDGFR-α and PDGFR-β (later markers). Brachyury
is the first transcription factor to be expressed in the posterior mesoderm, causing its differentiation and
being essential for the formation of the posterior body in all vertebrates [5]. PDGFR-α and PDGFR-β
play an important role in cell growth and division, especially in mesodermal differentiation [20], but not
exclusively (they can also be found in other cell lineages, such as neural and mesenchymal). Figure
4.10 shows the expression levels of these genes in the referred time points.
As expected, Brachyury expression is already high by day 2, when mesoderm differentiation is only
starting. However, a decrease in gene expression is verified by day 4, when mesodermal differentiation
36

Figure 4.9: Temporal gene expression analysis of pluripotency genes Oct4 and Nanog for cells differen-tiated using protocols P1 (black bar), P2 (grey bar), P3 (dark grey bar) and P4 (light grey bar) throughquantitative RT-PCR. Bars are means ± standard deviation, n=3. Expression level of the differentiatedcells was calculated relative to the housekeeping gene, GAPDH. Expression levels were measured atdays D2, D4, D6 and D10 of differentiation. D0 is represented in white with grey strips as comparison.
Figure 4.10: Temporal gene expression analysis of mesoderm genes Brachyury, PDGFR-α and PDGFR-β for cells differentiated using protocols P1 (black bar), P2 (grey bar), P3 (dark grey bar) and P4 (lightgrey bar) through quantitative RT-PCR. Bars are means ± standard deviation, n=3. Expression levelof the differentiated cells was calculated relative to the housekeeping gene, GAPDH. Expression levelswere measured at days D2, D4, D6 and D10 of differentiation. D0 is represented in white with grey stripsas comparison.
is at its maximum. This suggests that, although some mesodermal differentiation is detected (already
by day 2), some of it is lost by day 4 and although Brachyury is a early mesoderm marker, its expres-
sion should be kept constant until day 4. For the later mesodermal gene PDGFR-α, gene expression
increases from day 2 to day 4, as hESCs differentiate into mesoderm cells, decreasing afterwards when
mesodermal cells go towards other lineages, as expected. PDGFR-β expression does not seem to
change throughout the differentiation.
Although mesoderm differentiation is verified through the increase in the gene expression levels, no
significant difference between the protocols and the control (P1) can be verified.
For the same time points, endoderm gene expression was also analysed because the use of Ac-
tivin and LDM can lead differentiation towards endoderm. For that, the expression of endoderm genes
Sox17, Gata6 and Cxcr4 was measured. Since endodermal differentiation is not wanted, expression
levels must remain low during the differentiation process. Taking a look at the expression profiles of
37
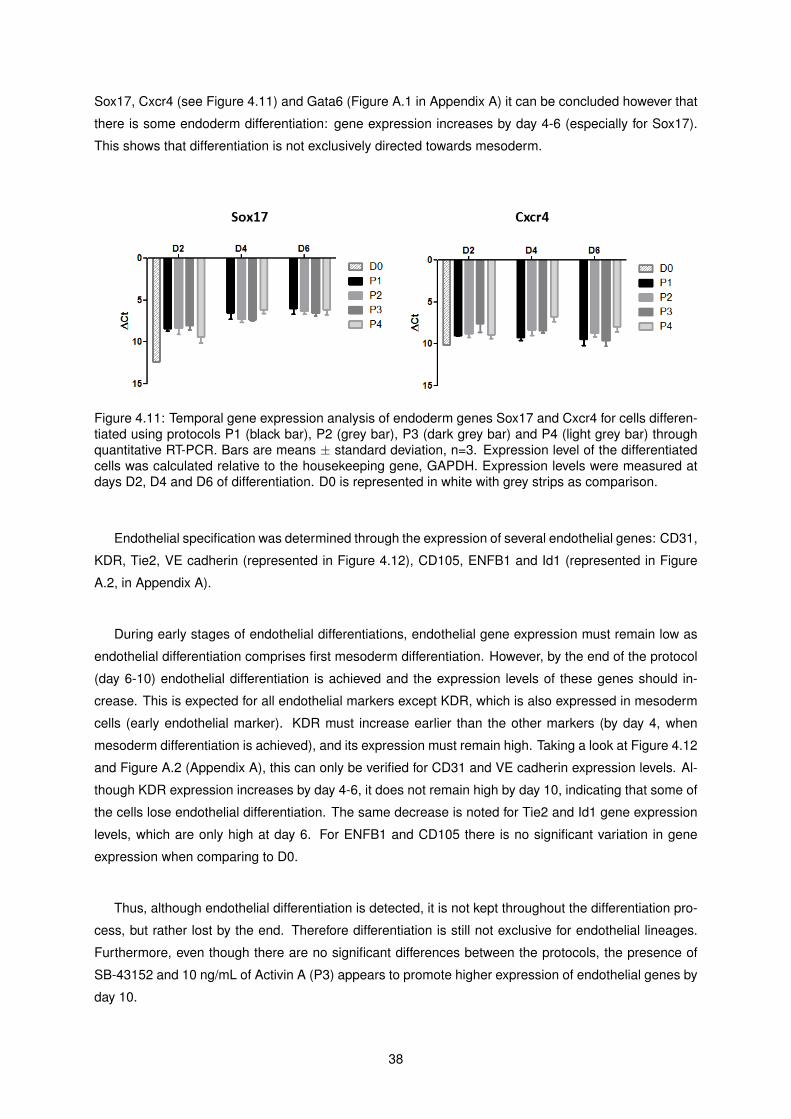
Sox17, Cxcr4 (see Figure 4.11) and Gata6 (Figure A.1 in Appendix A) it can be concluded however that
there is some endoderm differentiation: gene expression increases by day 4-6 (especially for Sox17).
This shows that differentiation is not exclusively directed towards mesoderm.
Figure 4.11: Temporal gene expression analysis of endoderm genes Sox17 and Cxcr4 for cells differen-tiated using protocols P1 (black bar), P2 (grey bar), P3 (dark grey bar) and P4 (light grey bar) throughquantitative RT-PCR. Bars are means ± standard deviation, n=3. Expression level of the differentiatedcells was calculated relative to the housekeeping gene, GAPDH. Expression levels were measured atdays D2, D4 and D6 of differentiation. D0 is represented in white with grey strips as comparison.
Endothelial specification was determined through the expression of several endothelial genes: CD31,
KDR, Tie2, VE cadherin (represented in Figure 4.12), CD105, ENFB1 and Id1 (represented in Figure
A.2, in Appendix A).
During early stages of endothelial differentiations, endothelial gene expression must remain low as
endothelial differentiation comprises first mesoderm differentiation. However, by the end of the protocol
(day 6-10) endothelial differentiation is achieved and the expression levels of these genes should in-
crease. This is expected for all endothelial markers except KDR, which is also expressed in mesoderm
cells (early endothelial marker). KDR must increase earlier than the other markers (by day 4, when
mesoderm differentiation is achieved), and its expression must remain high. Taking a look at Figure 4.12
and Figure A.2 (Appendix A), this can only be verified for CD31 and VE cadherin expression levels. Al-
though KDR expression increases by day 4-6, it does not remain high by day 10, indicating that some of
the cells lose endothelial differentiation. The same decrease is noted for Tie2 and Id1 gene expression
levels, which are only high at day 6. For ENFB1 and CD105 there is no significant variation in gene
expression when comparing to D0.
Thus, although endothelial differentiation is detected, it is not kept throughout the differentiation pro-
cess, but rather lost by the end. Therefore differentiation is still not exclusive for endothelial lineages.
Furthermore, even though there are no significant differences between the protocols, the presence of
SB-43152 and 10 ng/mL of Activin A (P3) appears to promote higher expression of endothelial genes by
day 10.
38

Figure 4.12: Temporal gene expression analysis of endothelial genes KDR, Tie2, CD31 and VE cadherinfor cells differentiated using protocols P1 (black bar), P2 (grey bar), P3 (dark grey bar) and P4 (light greybar) through quantitative RT-PCR. Bars are means ± standard deviation, n=3. Expression level of thedifferentiated cells was calculated relative to the housekeeping gene, GAPDH. Expression levels weremeasured at days D4, D6 and D10 of differentiation. D0 is represented in white with grey strips ascomparison.
4.1.3 Role of BMP4 in mesodermal commitment
Although endothelial generation was detected with the applied improvements, no significant improve-
ments between protocols were observed in terms of gene expression levels. The addition of Activin A
seems to promote slightly EC generation in the end of differentiation, but it shows no effect on mesoderm
differentiation. Thus, for further improvement of EC generation, mesoderm differentiation still has to be
improved.
As BMP4 is the most important signal for mesodermal commitment (see Chapter 2), the effect of a
higher concentration of this cytokine was tested in the conditions of the four improved protocols, gener-
ating four new protocols. Table 4.2 summarizes the new concentrations used in each protocol.
39

Act A(D0-D2)
BMP4(D0-D6)
SB-43152(D4-D10) or (D2-D10)*
VEGF(D4-D10)
bFGF(D4-D10)
P5 -
50 ng/mL 2 µL/mL 50 ng/mL 20 ng/mLP6 5 ng/mLP7 10 ng/mLP8* -
Table 4.2: Concentrations of the cytokines used in protocols P5, P6, P7 and P8.
Once again, differentiation was examined through gene expression analysis using qPCR at days 2,
4, 6 and 10.
Gene expression of pluripotency genes Oct 4 and Nanog showed that differentiation is achieved, as
their levels decrease with time (see Figure 4.13), taking similar values to protocols P1, P2, P3 and P4.
Figure 4.13: Temporal gene expression analysis of pluripotency genes Oct4 and Nanog for cells differ-entiated using protocols P5 (black bar), P6 (grey bar), P7 (dark grey bar) and P8 (light grey bar) throughquantitative RT-PCR. Bars are means ± standard deviation, n=3. Expression level of the differentiatedcells was calculated relative to the housekeeping gene, GAPDH. Expression levels were measured atdays D2, D4, D6 and D10 of differentiation. D0 is represented in white with grey strips as comparison.
When taking a look at the mesoderm genes expression, represented in Figure 4.14, no improve-
ments can be detected. In fact, PDGFR-β expression levels seem to increase slightly at the end of
differentiation, suggesting that there can even be more cells differentiating into mesenchymal lineages.
Brachyury and PDGFR-α gene expression levels are the same. A close look between protocols shows
that P7 presents a slightly higher expression of Brachyury and PDGFR-α. Even though this difference is
not significant, it suggests that the presence of higher BMP4 may improve mesoderm commitment, but
only in the presence of higher concentrations of Activin A.
The same is observed for endoderm gene expression levels. No significant changes can be detected
(see Figure 4.15 and Figure A.1 in Appendix A).
Endothelial genes expression levels, represented in Figure 4.16 and in Figure A.3 in Appendix A,
show no significant changes for KDR, Tie2, VE cadherin, CD105, ENFB1 and Id1, when comparing
with the previous protocols. However, for CD31 gene, expression levels seem to improve a bit, but only
for protocol P7. This suggests that high BMP4 combined with a higher concentration Activin A and the
40
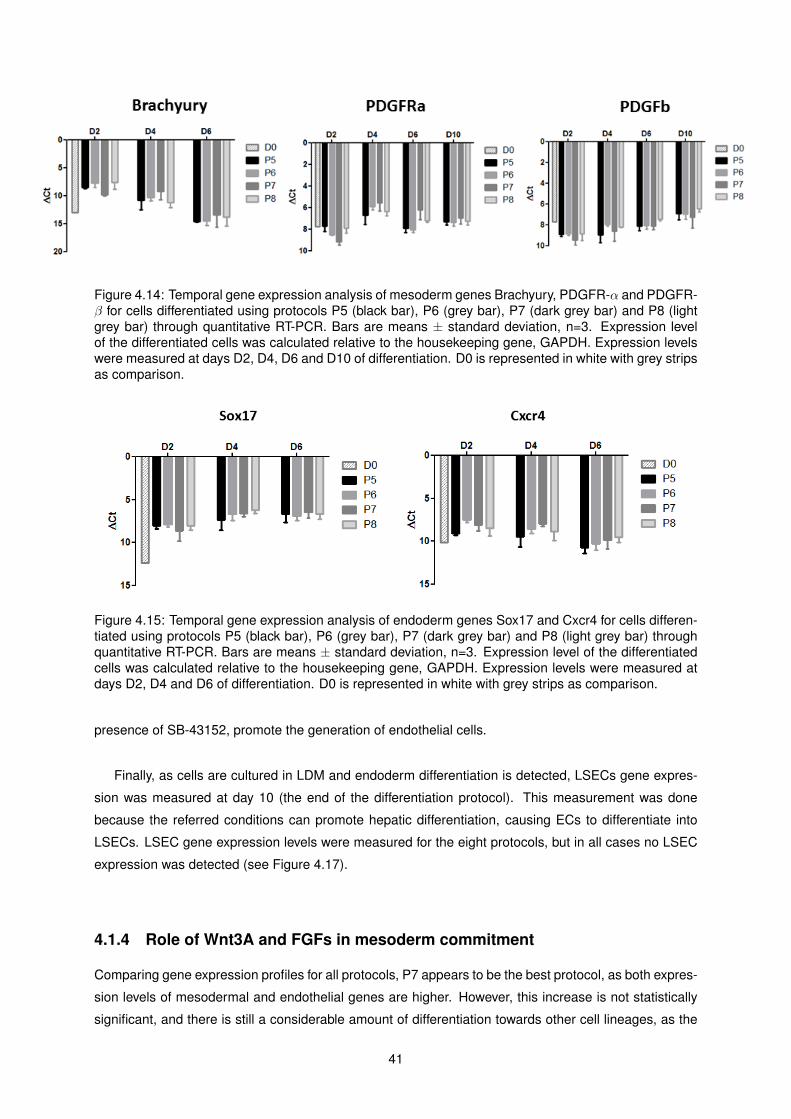
Figure 4.14: Temporal gene expression analysis of mesoderm genes Brachyury, PDGFR-α and PDGFR-β for cells differentiated using protocols P5 (black bar), P6 (grey bar), P7 (dark grey bar) and P8 (lightgrey bar) through quantitative RT-PCR. Bars are means ± standard deviation, n=3. Expression levelof the differentiated cells was calculated relative to the housekeeping gene, GAPDH. Expression levelswere measured at days D2, D4, D6 and D10 of differentiation. D0 is represented in white with grey stripsas comparison.
Figure 4.15: Temporal gene expression analysis of endoderm genes Sox17 and Cxcr4 for cells differen-tiated using protocols P5 (black bar), P6 (grey bar), P7 (dark grey bar) and P8 (light grey bar) throughquantitative RT-PCR. Bars are means ± standard deviation, n=3. Expression level of the differentiatedcells was calculated relative to the housekeeping gene, GAPDH. Expression levels were measured atdays D2, D4 and D6 of differentiation. D0 is represented in white with grey strips as comparison.
presence of SB-43152, promote the generation of endothelial cells.
Finally, as cells are cultured in LDM and endoderm differentiation is detected, LSECs gene expres-
sion was measured at day 10 (the end of the differentiation protocol). This measurement was done
because the referred conditions can promote hepatic differentiation, causing ECs to differentiate into
LSECs. LSEC gene expression levels were measured for the eight protocols, but in all cases no LSEC
expression was detected (see Figure 4.17).
4.1.4 Role of Wnt3A and FGFs in mesoderm commitment
Comparing gene expression profiles for all protocols, P7 appears to be the best protocol, as both expres-
sion levels of mesodermal and endothelial genes are higher. However, this increase is not statistically
significant, and there is still a considerable amount of differentiation towards other cell lineages, as the
41

Figure 4.16: Temporal gene expression analysis of endothelial genes KDR, Tie2, CD31 and VE cadherinfor cells differentiated using protocols P5 (black bar), P6 (grey bar), P7 (dark grey bar) and P8 (light greybar) through quantitative RT-PCR. Bars are means ± standard deviation, n=3. Expression level of thedifferentiated cells was calculated relative to the housekeeping gene, GAPDH. Expression levels weremeasured at days D4, D6 and D10 of differentiation. D0 is represented in white with grey strips ascomparison.
improvements applied show no effect on mesoderm differentiation. Therefore, mesoderm differentiation
still has to be improved.
From literature, it is known that Wnt3A induces mesoderm differentiation in cardiomyocyte differenti-
ation protocols [156]. Thus, the effect of this cytokine was tested. In addition, studies have shown that
some FGFs (like FGF4 and FGF8) play a fundamental role in the in vivo development of mesoderm and
endothelial lineages in some animal models, such as Xenopus and Zebrafish [135], [136]. Gene dele-
tion studies of these cytokine genes show severe defects in vascular system formation of the embryos,
which leads to their death within days. Although no studies have shown that this is true for humans,
these cytokines were also tested, in order to determine if they could also promote endothelial generation
in human cells.
Since high concentrations of BMP4 and Activin A together seem to promote endothelial differentia-
tion, the concentrations of these cytokines applied in P7 were selected for all further improved protocols.
Furthermore, considering the role of Activin A in mesoderm differentiation, its presence for longer peri-
ods (D0-D4) also was studied. Figure 4.18 summarizes the protocols combining the referred improve-
ments. Concentrations used in each protocol can be found in Table 4.3.
42

Figure 4.17: Temporal gene expression analysis of LSEC genes Sox17 and Cxcr4 for cells differentiatedusing protocols P1 (grey bar), P2 (dark grey bar), P3 (light grey bar), P4 (grey bar with black dots),P5 (grey bar with black ), P6 (grey bar with black squares), P7 (white bar) and P8 (white bar withstripes) through quantitative RT-PCR. Bars are means± standard deviation, n=3. Expression level of thedifferentiated cells was calculated relative to the housekeeping gene, GAPDH. Expression levels weremeasured at day 10, the end of differentiation. D0 is expression represented in black as comparison.
Act A(D0-D2) or (D0-D4)*
BMP4(D0-D6)
Wnt3A(D0-D2)
FGF4, FGF8(D0-D4)
SB-43152(D4-D10)
VEGF(D4-D10)
bFGF(D4-D10)
P9
10 ng/mL 50 ng/mL
- -
2 µL/mL 50 ng/mL 20 ng/mLP10* - -P11 50 ng/mL -P12 20 ng/mL
Table 4.3: Concentrations of the cytokines used in protocols P9, P10, P11 and P12.
Differentiation was again controlled through gene expression analysis using qPCR. This time only
days 4, 6 and 10 were selected as timepoints look into gene expression.
Pluripotency genes follow again the expected expression profiles, which are presented in Figure A.4
in Appendix A.
Taking a look at mesoderm genes expression levels, presented in Figure 4.19, it can be seen that
Brachyury expression is higher at day 4, when comparing with the previous protocols. In fact, at day
4 the expression values are as high as they were at day 2 for the previous cases. No measurements
43

Figure 4.18: New protocols defined for the improvement of mesoderm differentiation and further ECgeneration. These protocols were based on [108], but including SB-43152 from D4-D10, high concen-trations of BMP4 (50 ng/mL) and Activin A in a concentration of 10 ng/mL. Protocol P9 is the same asP7, and is used as control for the rest of the protocols. Protocol P10 includes the addition of Activin A forlonger periods (from D0-D4). Protocol P11 includes the addition of Wnt3A for D0-D2 as well as protocolP12, which also includes the addition of FGF4 and FGF8 from D0-D4.
were done at day 2, so the same cannot be concluded for day 2. Nevertheless, the improvement by
day 4 suggests that mesodermal commitment is more successful in the new protocols. By day 6, gene
expression levels start decreasing, taking values closer to day 0 levels, as cells start differentiating into
endothelial cells. The same can be verified for PDGRF-α, which also takes higher values than before.
However, in this case, its expression does not decrease by day 10, but it is kept constant.
Figure 4.19: Temporal gene expression analysis of mesoderm genes Brachyury and PDGFR-α for cellsdifferentiated using protocols P9 (black bar), P10 (grey bar), P11 (dark grey bar) and P12 (light greybar) through quantitative RT-PCR. Bars are means ± standard deviation, n=3. Expression level of thedifferentiated cells was calculated relative to the housekeeping gene, GAPDH. Expression levels weremeasured at days D4, D6 and D10 of differentiation. D0 is represented in white with grey strips ascomparison.
Although an increase in mesoderm gene expression is detected (especially for the protocols with
44

longer Activin A or Wnt3A), looking at Figure 4.20, an increase in endoderm gene expression is also
noticeable.
Figure 4.20: Temporal gene expression analysis of endoderm genes Sox17 and Cxcr4 for cells differen-tiated using protocols P9 (black bar), P10 (grey bar), P11 (dark grey bar) and P12 (light grey bar) throughquantitative RT-PCR. Bars are means ± standard deviation, n=3. Expression level of the differentiatedcells was calculated relative to the housekeeping gene, GAPDH. Expression levels were measured atdays D2, D4 and D6 of differentiation. D0 is represented in white with grey strips as comparison.
In addition, although mesoderm generation seems to have improved, endothelial genes expression
levels show no significant changes for all genes (KDR, Tie2, CD31, VE cadherin, CD105, ENFB1 and
Id1), when comparing with the previous protocols. Gene expression profiles of these genes are repre-
sented in Figure 4.21 for the first four genes, and in Figure A.5 in Appendix A for the last three.
4.1.5 Final improvements
Although mesoderm commitment appears to have improved, no progress in endothelial cell generation
was made, as gene expression levels stay the same.
As seen previously in Section 4.1.2, a higher Activin A concentration at the beginning of differenti-
ation seems to promote it towards endothelial cells, in the end. Thus, a higher concentration of Activin
was tested in the same conditions of protocols P9, P10, P11 and P12, to try to improve EC generation
at the end of the differentiation protocol. Table 4.4 sums up the concentrations used.
Act A(D0-D2) or (D0-D4)*
BMP4(D0-D6)
Wnt3A(D0-D2)
FGF4, FGF8(D0-D4)
SB-43152(D4-D10)
VEGF(D4-D10)
bFGF(D4-D10)
P13
25 ng/mL 50 ng/mL
- -
2 µL/mL 50 ng/mL 20 ng/mLP14* - -P15 50 ng/mL -P16 20 ng/mL
Table 4.4: Concentrations of the cytokines used in protocols P13, P14, P15 and P16.
Once more, differentiation was controlled through gene expression analysis using qPCR. Samples
were taken at days 4, 6 and 10 as time points to look into gene expression. Again, pluripotency gene
45

Figure 4.21: Temporal gene expression analysis of endothelial genes KDR, Tie2, CD31 and VE cadherinfor cells differentiated using protocols P9 (black bar), P10 (grey bar), P11 (dark grey bar) and P12 (lightgrey bar) through quantitative RT-PCR. Bars are means ± standard deviation, n=3. Expression levelof the differentiated cells was calculated relative to the housekeeping gene, GAPDH. Expression levelswere measured at days D4, D6 and D10 of differentiation. D0 is represented in white with grey strips ascomparison.
expression levels were analysed and follow the expected profiles (Figure A.6 in Appendix A).
Considering the role of Activin A in both mesoderm and endoderm differentiation, when an increased
concentration of this cytokine is applied, higher expression levels of mesoderm and/or endoderm genes
may be obtained. However, taking a look at Figures 4.22 and 4.23, the expression levels are similar to
the ones from the protocols used in Section 4.1.4. This is due to the fact that the concentration used is
still lower than the necessary to promote endoderm differentiation and as seen before, variation of the
concentration of Activin A does not affect mesoderm commitment.
Endothelial gene expression levels are, as expected, higher. Looking at Figures 4.24 and A.7 from
Appendix A, this is very clear for KDR, CD31, VE cadherin, and CD105 genes, some of the most im-
portant endothelial markers. In addition, expression of KDR stays high at day 10, which did not happen
before. This suggests that endothelial differentiation is not only higher but also maintained by the end of
the protocol, meaning that less cells lose differentiation towards other lineages.
Taking into consideration all data, protocols P14 and P15 seem to produce the best results. In fact,
when comparing gene expression levels of these protocols with P1 (the control protocol), there is a
46

Figure 4.22: Temporal gene expression analysis of mesoderm genes Brachyury and PDGFR-α for cellsdifferentiated using protocols P13 (black bar), P14 (grey bar), P15 (dark grey bar) and P16 (light greybar) through quantitative RT-PCR. Bars are means ± standard deviation, n=3. Expression level of thedifferentiated cells was calculated relative to the housekeeping gene, GAPDH. Expression levels weremeasured at days D4, D6 and D10 of differentiation. D0 is represented in white with grey strips ascomparison.
Figure 4.23: Temporal gene expression analysis of endoderm genes Sox17 and Cxcr4 for cells differenti-ated using protocols P13 (black bar), P14 (grey bar), P15 (dark grey bar) and P16 (light grey bar) throughquantitative RT-PCR. Bars are means ± standard deviation, n=3. Expression level of the differentiatedcells was calculated relative to the housekeeping gene, GAPDH. Expression levels were measured atdays D2, D4 and D6 of differentiation. D0 is represented in white with grey strips as comparison.
considerable improvement in both mesoderm and endothelial gene expression levels (see Figure 4.25).
Significancy tests were done for P14 and P15, for day 10, showing that the differences are close to sig-
nificant (see data on Appendix C). Therefore, this suggests that high BMP4, higher Activin A, presence
of SB-43152 and also Wnt3A (for P15) help improving EC generation.
To confirm that a higher amount of mesoderm and endothelial cells can be obtained in a quantitative
way, flow cytometry analysis using the appropriate markers was performed for protocols P13, P14, P15
and P16.
Firstly, cells were sorted at day 4 for mesoderm markers PDGFR-α, PDGFR-β and KDR (which is
also endothelial marker). Looking at Figure 4.26, it is possible to see that 40-50 % of the cells are
PDGFR-α positive, which means that they are mesoderm cells. The same is verified for PDGFR-β
(about 40-50 % of positive cells). Moreover, about 70% of the cells are KDR positive at day 4. This
means that about 70% of the cells are differentiated into mesoderm or endothelial progenitors by this
47

Figure 4.24: Temporal gene expression analysis of endothelial genes KDR, Tie2, CD31 and VE cadherinfor cells differentiated using protocols P13 (black bar), P14 (grey bar), P15 (dark grey bar) and P16 (lightgrey bar) through quantitative RT-PCR. Bars are means ± standard deviation, n=3. Expression levelof the differentiated cells was calculated relative to the housekeeping gene, GAPDH. Expression levelswere measured at days D4, D6 and D10 of differentiation. D0 is represented in white with grey strips ascomparison.
day. This represents a significant improvement, when comparing to the original Verfaillie protocol, where
only 30-50 % of the cells were KDR positive at day 4. Original flow cytometry plots of the four protocols,
controls and isotypes are presented in Figures B.1 and B.2 in Appendix B.
Flow cytometry analysis was also performed for the same markers at day 6, to determine if meso-
derm cells were differentiating towards endothelial or other lineages. As KDR is both a marker for
mesoderm and endothelial cells, the number of cells expressing this marker should remain constant.
A decrease in KDR positive cells implies that some mesoderm or endothelial differentiation is lost. In
addition, PDGFR-α and PDGFR-β positive cell number must decrease, as mesoderm cells go to en-
dothelial cells. If the value is kept constant or if it increases, differentiation is being directed towards
other lineages, as these markers are also expressed in other cell types. From Figure 4.27, it is possible
to see that, as expected, PDGFR-α positive cell number decreases, showing that mesoderm cells are
differentiating. However, as KDR positive cell number also decreases (by about 10 %), some endothelial
differentiation is lost. Moreover, PDGFR-β positive cell number increases by about the same amount.
Thus, the loss of mesoderm/endothelial cells may be due to the fact that these differentiate towards
mesenchymal cell lineages instead of endothelial.
48

Figure 4.25: Comparison of the temporal gene expression analysis for mesoderm genes and endothelialgenes PDGFR-α, KDR, CD31 and VE cadherin for the best protocols P14 (light grey bar) and P15 (darkgrey bar) and the control, P1 (black bar) at days 4, 6 and 10 of differentiation. Protocols P14 and P15are based on P1, but with higher concentration of BMP4, Activin A and for P15, the presence of Wnt3A.Significance t-test assuming unequal variances at day 10 show no significant difference (see AppendixC). Bars are means ± standard deviation, n=3.
Figure 4.26: Representation of the flow cytometric isolation values for KDR-expressing (right), PDGFR-α-expressing (middle) and PDGFR-β-expressing (left) hES cell-derived endothelial cells at day 4, forprotocols P13 (black bars), P14 (grey bars), P15 (dark grey bars) and P16 (black striped bars). N=1.
Original flow cytometry plots for KDR, PDGFR-α and PDGFR-β markers and isotype and specific
controls are presented in Figures B.3 and B.4 of Appendix B.
Between all protocols, P14 and P15 seem to produce the best results. This was already seen before,
with gene expression analysis, and can also be verified through the flow cytometry analysis. In fact, P15
generates the highest amount of KDR positive cells among all protocols, with a smaller decrease in this
49

Figure 4.27: Representation of the flow cytometric isolation values for KDR-expressing (right), PDGFR-α-expressing (middle) and PDGFR-β-expressing (left) hES cell-derived endothelial cells at day 6, forprotocols P13 (black bars), P14 (grey bars), P15 (dark grey bars) and P16 (black striped bars). N=1.
number by day 6, together with a smaller increase in PDGFR-β positive cells.
By day 6, the number of endothelial cells (CD31 positive cells) was also measured. Since by day 6
endothelial differentiation is only starting, a low number of CD31 positive cells was expected. Taking a
look at Figure 4.28, that can be verified as only 2.2-6.2 % endothelial cells are obtained. Nevertheless,
protocols P14 and P15 show to be the best, with the higher number of endothelial cells generated (4.9
% and 6.2 %, respectively).
For the best protocol, cells were sorted at day 10 for CD31 marker, in order to determine the amount
of endothelial cells obtained at the end of differentiation. Figure 4.29 represents the obtained flow cy-
tometry plots and respective number of positive cells, for n=3. With this protocol, 20-25 % of endothelial
cells can be obtained in the end, which represents a 10-15% improvement over the initial protocol.
CD31 positive sorted cells were replated after sorting, but did not survive. This could be one of the
outcomes, as FACS is a very violent technique for the cells. Firstly cells are detached from the plate
using an EDTA solution, which causes cellular death, and then cells are funnelled through a narrow
opening that ends in a nozzle, which only allows cells to pass one by one, destroying a lot of cells.
After that, cells still have to go through a laser selection and travel through tubes until they reach the
appropriate deposit. All this pressure causes a lot of damage from which most of cells cannot recover.
To bypass this problem, cells can be sorted using MACS. This technique also allows high specificity
sorting of cells but the purity in the end is lower. Other options includes the creation of a reporter cell
line that allows the selection of endothelial cells through a drug resistance gene or fluorescent protein
expression, or the splitting of the cells every 2 days during differentiation, as low density protocols are
known to help giving rise to a pure population in the end of differentiation.
50

Figure 4.28: Flow cytometric isolation of CD31-expressing cells differentiated with protocols (a)P13, (b)P14, (c) P15 and (d) P16, at day 6. In the flow cytometry information Table, the positive endothelial cellpopulation is named P2. N=1. Specific controls and isotype samples are presented in Figure B.3, inAppendixB.
Figure 4.29: Flow cytometric isolation of CD31-expressing hES cell-derived endothelial cells with proto-col P15 at day 10, for n=3. About 20-25 % of endothelial cells are obtained.
51

4.2 Generation of LSECs: creation of a inducible cell line
As the mechanisms and pathways involved in LSEC differentiation are mostly unknown, and the usage
of adrenomedulin is not very reliable, the creation of an inducible system expressing some of the tran-
scription factors (TFs) involved in the differentiation of LSECs seems to be the best choice for LSEC
generation.
As referred, in the Verfaillie Lab there is already an engineered cell line available, which contains a
flippable cassette in the AAVS1 locus that can be easily exchanged for another cassette, contained in a
vector. For that, a vector based on pTripZ, with the inducible cassette represented in Figure 2.14 from
Chapter 2, can be used. This vector contains a CMV minimal promoter, which is activated in the pres-
ence of DOX. Thus, to create an inducible system, the TFs genes must be inserted after this promoter.
For that, a multiple cloning site has to be created in that site.
The construction of the MCS is done through simple steps of cloning such as amplification, digestion
and ligation. The selection of the TF genes to insert on the MCS was done from a list of TFs, which are
known to be involved in LSEC differentiation. This list was provided by Prof. dr. Aernout Luttun, from
the Endothelial Cells Biology group of the Faculty of Biomedical Sciences of KU Leuven. Considering
the available space (about 3-4kb) three LSEC TFs were chosen: TF2, TF3 and TF1.
For the insertion of the TF genes in the vector, first the restriction sites have to be created. In addition,
as the TFs genes will be cloned sequentially, to guarantee that three separate proteins are translated,
P2A sequences also have to be inserted between restriction sites. The P2As are sequences encoding
two aminoacids that, when translated, act as cleavage sites. Placed in between TFs, these will allow
the cleavage of each of the TF encoded proteins separately. With the first TF gene, a KOZAK sequence
will also be added to the MCS after the promoter to guarantee translation of the TFs genes. Figure 4.30
shows the elements that constitute the designed MCS.
Figure 4.30: Structure of the MCS containing LSEC transcription factors genes. The MCS is composedof three LSEC genes: TF1 (blue), TF2 (yellow) and TF3 (red), with two P2A sequences (grey) in betweengenes for separation of the proteins after translation and a KOZAK sequence (orange), before the first TF,to promote gene transcription. The restriction sites were cloned with the P2As and TF gene sequencesusing for that appropriate primers. The MCS was designed by simple steps of digestion and ligation.
First step for the MCS construction was the PCR amplification of the P2As (P2A-1 and P2A-2) and
transcription factors coding genes, and Vector digestion. The templates used were available in the
Verfaillie Lab, and the correspondent primers were designed from the P2As and TF genes sequences
using UCSC In-Silico PCR. Designed primers included the restriction sites for the addition of the TFs
genes: P2A-1 primers contained Afl II and Age I restriction sites; P2A-2 primers contained Age I and
52

Mlu I restriction sites; TF1 primers contained Afl II and Eco RV restriction sites, as well as the KOZAK
sequence; TF2 primers contained Age I and Cla I restriction sites; and TF3 primers contained Hpa I and
Mlu I restriction sites. The list of primers used and respective sequences can be found in Chapter 3,
Table ??.
For the MCS creation, the Vector to be used was digested (using Afl II and Mlu I enzymes). After
digestion, the product was run in a 1% agarose gel for selection of the correct band (the Vector band)
and further Gel purified. The amplified PCR products were also run in a 1% agarose gel, to confirm the
amplification of the correct genes (through the band sizes). Both gels are presented in Figure 4.31.
Figure 4.31: Agarose gel electrophoresis of the (a) Vector, digested with Afl II and Mlu I, (b) PCRamplified P2A-1 and P2A-2 sequences and (c) PCR amplified LSEC genes to be cloned into the MCS(TF2, TF3 and TF1). In (a), Vector band (11kb) was extracted and gel purified. 1kb ladder was used inthe three gels. All gels are 1% of Agarose.
After confirmation of the bands with correct sizes, P2As and TFs products were PCR purified. It is
important to notice that amplification of TF2 failed as only a primers band can be seen. Further analysis
of the TF2 gene showed that this gene has a high GC content. This means that its amplification requires
a high annealing temperature (70.8◦C) and for that, special primers with a high melting temperature are
required. New primers were designed and the amplification repeated with several different annealing
temperatures (68, 70 and 72 ◦C), but amplification was very low (see Figure 4.32). As a last try, the
template vector of this gene was digested and the band correspondent to TF2 (see Figure 4.32) was
amplified by high melting temperature PCR.
The next step was insertion of the P2As in the Vector. For that, the P2As were digested: P2A-1 was
digested with Afl II and AgeI and P2A-2 was digested with Age I and Mlu I. After digestion, the P2As
were ligated to the already digested vector and the result, transformed into 5α competent (Escherichia
coli) cells for Vector amplification and further selection.
53

Figure 4.32: Agarose gel electrophoresis of (a) high melting temperature PCR amplification productof TF2 TF gene with three different annealing temperatures: 68, 70 and 72 ◦C; and (b) of the digestedplasmid containing TF2 gene (1.2kb). 1kb ladder was used in the two gels. Both gels are 1% of Agarose.
Knowing the sequence of the Vector and P2As, it is easy to predict the sequence of the resultant
product of this ligation. Thus, its digestion with one or two enzymes will generate a product containing
fragments with specific sizes, that present a specific band pattern when ran in a gel. To obtain a ligated
vector containing both P2As, twelve colonies were selected and after their plasmids were extracted, they
were digested with Bgl II and Eco RV enzymes and ran in a gel. Figure 4.33 shows the obtained band
pattern. With this digestion, the correctly ligated Vector produces two bands: one with 7kb and other
with 1.5kb.
Figure 4.33: Agarose gel electrophoresis of the digested plasmids extracted from the 12 selectedcolonies, transformed with the product of Vector and P2As ligation. Plasmids were digested with BglII and Eco RV enzymes. The correctly ligated vector should present two bands with 7kb and 1.5kb. 1kbladder was used. Gel is 1% of Agarose.
Based on this, colony 2 was selected. The respective plasmid was then sequenced to confirm it had
the correct sequence.
After confirmation, the Vector (containing the P2As) was digested to take in TF3, with HpaI and Mlu
I. As the two enzymes are not compatible, digestion was done sequentially. The digested vector was
54

run in a 1 % agarose gel for selection of the vector band and further gel purified (see Figure D.1 in
Appendix D). TF3 PCR amplified product was also digested with the same enzymes. After purification,
it was ligated to the digested purified vector, and inserted in bacteria. This time, twenty-four colonies
were selected and digested with Bgl II. The result is presented in Figure 4.34 and the expected bands
for the corrected ligated plasmid were 7kb and 1.5kb. Colony 22 was selected.
Figure 4.34: Agarose gel electrophoresis of the digested plasmids extracted from the twenty-four se-lected colonies, transformed with the product of Vector+P2As and TF3 ligation. Plasmids were digestedwith Bgl II enzyme. The correctly ligated vector should present two bands with 7kb and 1.5kb. 1kb ladderwas used. Gel is 1% of Agarose.
Once again the plasmid containing now the P2As and TF3 was digested to add in TF1. This was
done using Afl II and Eco RV. After digestion, vector selection (see Figure D.1 in Appendix D) and pu-
rification, the Vector was ligated to the TF1 PCR amplification product, that was also digested with the
same enzymes. The ligated product was then transformed in bacteria and twelve colonies were se-
lected. The colonies were then digested with Pst I. Two bands with 3kb are expected for the digested
product of the correctly ligated vector. Based on Figure 4.35, colony 2 was selected.
Finally, the Vector with the P2As, TF3 and TF1 was sequentially digested with Age I and Cla I
enzymes and selected (see Figure D.1 in Appendix D). Then, it was ligated to the TF2 PCR ampli-
fied product, that was also digested with the same enzymes, and transformed using bacteria. Twelve
colonies were selected and digested with BamHI. Figure 4.36 shows the obtained band profiles. Three
bands with 5kb, 3.7kb and 2.1kb for the correctly ligated vector are expected but no correct colonies
were obtained.
55
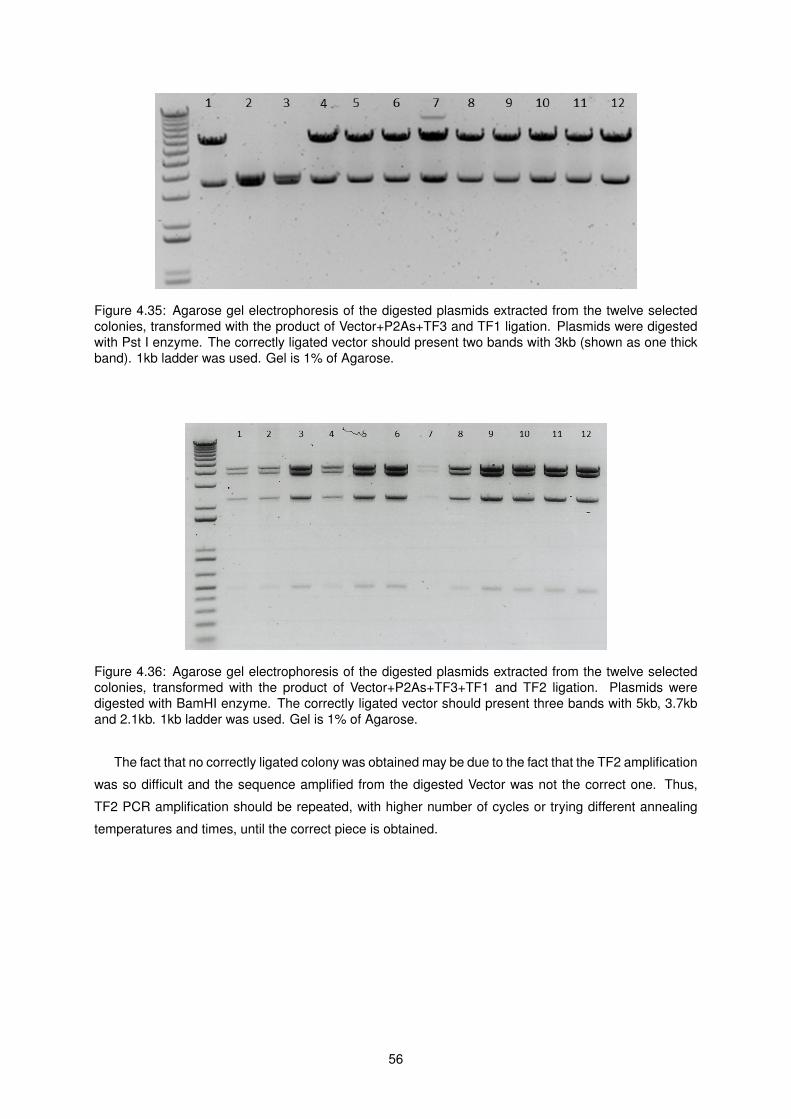
Figure 4.35: Agarose gel electrophoresis of the digested plasmids extracted from the twelve selectedcolonies, transformed with the product of Vector+P2As+TF3 and TF1 ligation. Plasmids were digestedwith Pst I enzyme. The correctly ligated vector should present two bands with 3kb (shown as one thickband). 1kb ladder was used. Gel is 1% of Agarose.
Figure 4.36: Agarose gel electrophoresis of the digested plasmids extracted from the twelve selectedcolonies, transformed with the product of Vector+P2As+TF3+TF1 and TF2 ligation. Plasmids weredigested with BamHI enzyme. The correctly ligated vector should present three bands with 5kb, 3.7kband 2.1kb. 1kb ladder was used. Gel is 1% of Agarose.
The fact that no correctly ligated colony was obtained may be due to the fact that the TF2 amplification
was so difficult and the sequence amplified from the digested Vector was not the correct one. Thus,
TF2 PCR amplification should be repeated, with higher number of cycles or trying different annealing
temperatures and times, until the correct piece is obtained.
56

Chapter 5
Discussion
Generation of non-parenchymal liver cells for co-culture with hepatic cells may be the answer to solve the
problems associated with the in vitro generation of mature hepatocytes. The fact that the pathways and
cytokines involved in liver differentiation are not yet fully understood leads to the generation of cultures
with an unpredictable degree of variability, with only 10-20 % of the functionality of normal hepatocytes
[54], [72], [77]. One of the reasons why all protocols for hepatocyte generation fail is because they all
forget about the importance of neighbour signalling in hepatocyte differentiation. In vivo, it is widely
known that neighbour cells provide important signalling to each other, promoting cell differentiation [44],
[54].
Although hepatocytes constitute the majority of liver cells, the liver is also composed of non-parenchymal
cells, such as the liver specific endothelial cells (LSECs), the hepatic stellate cells and the Kupfer cells
[44]. These cells help hepatocytes performing their functions and are involved in their in vivo differen-
tiation [50]. To perform the co-cultures of liver non-parenchymal cells with immature hepatocytes, it is
necessary to generate them. The collection of these cells from human livers is not a feasible option, as
the number of available donor livers is not even enough for medical applications [42]. Thus, their in vitro
generation is required and for that, PSCs are the ideal source [71].
In vitro studies have shown that when endothelial cells are cultured directly with mouse ESCs, they
promote ESC differentiation into hepatocyte-like cells [50]. Furthermore, human LSECs help maintaining
human hepatocyte differentiation when they are cultured together [89], [98]. Considering the importance
of these cells, the focus of this Thesis was the generation of LSECs for further co-culture with immature
hepatocytes.
LSEC in vitro differentiation starts with the hESCs differentiation into endothelial cells. As the current
available protocols for endothelial cell differentiation generate only a low number of ECs in a mixed pop-
ulation, the first step was the optimization of one of these protocols, the Verfaillie protocol.
57

5.1 Generation of Endothelial cells
5.1.1 Improvement of the current protocol: the TGF-β pathway
The first improvements that were applied included the addition of low concentrations of Activin A in
the beginning of differentiation (D0-D2), and SB-43152 from day 4. According to the literature, these
cytokines play an important role in mesoderm and endothelial cell differentiation, respectively, partici-
pating in the TGF-β pathway [128], [131], [133]. Based on this, four protocols were created, all including
SB-43152: P1 (control), P2 and P3 also with the addition of Activin A (in two different concentrations, 5
and 10 ng/mL, respectively), and P4 with longer SB-43152 (from day 2) - see Figure 4.8 for a summary
of the protocol conditions .
As it can be seen through the pluripotency genes expression levels of Oct4 and Nanog (see Figure
4.9), differentiation was achieved. To determine whether this differentiation was towards endothelial lin-
eages, mesoderm and endothelial gene expression was analysed. Endoderm gene expression was also
measured since LDM (liver differentiation medium) was used as culture medium. LDM contains signals
for hepatic differentiation, which first undergoes endoderm commitment. In addition, Activin A can also
promote endoderm differentiation, as seen in Chapter 2.
According to Figure 4.10, there is differentiation towards mesoderm, as both Brachyury, PDGFR-α
and PDGFR-β mesoderm genes are expressed. However, when cells should be in the peak of meso-
dermal differentiation (day 4), Brachyury expression decreases, indicating that cells are differentiating
towards other lineages. Although mesoderm differentiation is detected, it is not exclusive, as endoderm
gene expression is also detected (see in Figure 4.11). Because the expression of endoderm genes takes
the same values for all the protocols, endoderm differentiation cannot be attributed to the presence of
Activin A, since it is not present in all protocols. Furthermore, the concentrations used are significantly
below the necessary to promote endoderm differentiation. Thus, the verified endoderm differentiation
may be due to the usage of LDM as medium for differentiation.
Analysis of endothelial gene expression levels shows that endothelial differentiation is also achieved.
As it can be seen in Figures 4.12 and A.2, gene expression of endothelial markers remains low at the
beginning (during mesoderm differentiation), increasing then by the end (day 6-10), when endothelial dif-
ferentiation is accomplished. This is visible for all endothelial genes studied (CD31, VE cadherin, CD105
and ENFB1), except for KDR, Tie2 and Id1. Although this is not expected for Tie2 and Id1, it is normal
for KDR, as this marker is present in both mesoderm and endothelial cells. Thus, KDR is considered an
early endothelial marker, normally being expressed earlier than the other endothelial markers (by day
4), when mesoderm differentiation is completed. As KDR is present in both mesoderm and endothelial
cells, its expression should remain constant from day 4 until the end of differentiation. However that is
not verified, suggesting that throughout the differentiation process some of the mesoderm/endothelial
differentiation is lost towards other cell types. Therefore, although differentiation is achieved, it is not
exclusive for endothelial lineages.
58

In conclusion, although no significant differences between protocols were detected, the presence of
SB-43152 and 10 ng/mL of Activin A (P3) seem to promote higher expression of endothelial genes by
day 10.
5.1.2 Role of BMP4 in mesoderm differentiation
Despite the improvements applied in 5.1.2, there is still loss of differentiation towards other lineages,
which will bring forth a mixed population at the end of differentiation. As endothelial differentiation first
undergoes mesoderm differentiation, improving the latter may help improving the former. Moreover, the
presence of endoderm cells also shows the need to improve mesoderm differentiation, which may lead
to a decrease in the amount of endoderm differentiation.
In Section 5.1.2, Activin A was added to promote mesoderm commitment. However, no improve-
ments in mesoderm gene expression where detected when comparing with the control (P1) and with
the protocol where Activin was not added (P4). From literature, it is known that although Activin A helps
generating mesoderm, it is BMP4 that plays a decisive role in mesoderm differentiation [129]. Thus,
a higher concentration of this cytokine (50 ng/mL) was applied in the conditions of the four protocols
presented in Section 5.1.2, to test its effect on mesoderm differentiation.
Nevertheless, when taking a look at mesoderm gene expression (in Figure 4.14) it is possible to
conclude that there are no significant changes with the presence of higher concentrations of BMP4.
The gene expression levels are about the same when comparing with the first four protocols, except
for protocol P7. In this case, Brachyury and PDGFR-α gene expression levels seem to be a bit higher
by day 4-6. Even though there is no statistical significant difference between these expression levels
and the control P1, the observed increase suggests that higher concentrations of BMP4 may promote
mesoderm differentiation, but only in the presence of Activin.
The PDGFR-β expression levels also seem to increase with higher concentrations of BMP4, espe-
cially by day 10. PDGFR-β is a marker for mesenchymal lineages, which is present for example in
fibroblasts and smooth muscle cells. Its late expression means that cells are differentiating into these
lineages. This happens because BMP4 promotes mesoderm differentiation, which can then go to en-
dothelial or mesenchymal lineages. As no effort is done to promote the increased differentiation into
mesoderm towards ECs, cells differentiate naturally into mesenchymal cell types. This increase is less
noticeable for protocol P7.
Endoderm and endothelial gene expression levels also maintain the same values as for the first four
protocols (see Figures 4.15 and 4.16), except for the CD31 gene. In this case, a small improvement
in gene expression can be detected, especially for protocol P7. Thus, although BMP4 does not really
improve mesoderm differentiation, its effect seems visible in terms of endothelial differentiation. This
may be related to the fact that endothelial cell differentiation is promoted by TGF-β/ALK1 pathway, from
which BMP4 is a ligand. Although no BMP4 is supplied after day 6, the use of matrigel can make it
59

stuck in this layer and stay longer in contact with the cells. It is important to note that this increase was
already predicted by the mesoderm gene expression levels of P7, where a smaller increase in PDGFR-β
expression by day 10 (and thus in loss of differentiation) was detected.
At the end of differentiation (day 10), expression of LSEC markers (Lsecting, FCGR2b, MRCI and
Lsign) was also analysed and compared with the values for day 0 (see Figure 4.17). Because cells were
cultured in LDM and no effort to promote LSECs generation was done, nor enough differentiation time
was provided, no LSECs were expected – and no LSECs were obtained.
In conclusion, the presence of SB-43152 and high concentrations of BMP4 together with a higher
concentration of Activin A seem to improve the generation of ECs, as they promote a small increase in
mesoderm and (mostly) in endothelial gene expression. Thus, these conditions must be used for further
improvements.
5.1.3 Role of Wnt3A and FGFs in mesoderm differentiation
In the conditions from Section 5.1.2, minor improvements in EC differentiation were achieved. Yet, no
statistically significant improvements in terms of mesoderm and endothelial gene expression levels were
obtained. The fact that a significant part of the cells differentiate towards other lineages, including en-
doderm and mesenchymal lineages, remains the main issue. Thus, the improvement of mesoderm
differentiation may be the key to improve ECs generation.
For that, Wnt3A, FGF4 and FGF8 were used. From cardiomyocyte differentiation protocols, Wnt3A
is known to induce mesoderm generation [156]. Moreover, FGF4 and FGF8 are fundamental for the
development of mesoderm and endothelial lineages in some animal models, which can also be true for
humans [135]. Therefore, the effect of Wnt3A, FGF4 and FGFG8 were tested. In addition, as Activin
A also directs differentiation towards mesoderm, its effect when applied for a longer period was also
tested. Thus, four protocols with the concentrations of P7 (high BMP4 and Activin A) were defined: P9
was defined as control, P10 included longer Activin A, P11 included Wnt3A, and P12 included Wnt3A,
FGF4 and FGF8 (see Figure 4.18).
Taking a look at Figure 4.19, it can be concluded that with the new protocols, the mesoderm differ-
entiation was improved. In fact, looking at Brachyury and comparing with the previous protocols, it is
possible to see that expression levels at day 4 take values as high as the ones for day 2 in the previous
protocols. The same can be said about PDGRF-α and KDR expression levels, which are also higher
than before. In addition, KDR expression does not decrease by day 10 but is kept constant, showing that
there is less loss of differentiation towards other lineages. Once again, although there is no statistical
difference, the improvements in mesoderm gene expression seem to be higher for the protocols where
higher concentrations of BMP4 and Activin A are used together. This increase in mesoderm expression
is followed by an increase in endoderm gene expression levels (see Figure 4.20), which suggests that
although the applied conditions improve differentiation, it is improved towards both cell lineages (meso-
60

derm and endoderm).
Despite the improvements achieved in mesoderm differentiation, no improvements were obtained
for EC generation, as the expression levels of endothelial genes remain the same (see Figure 4.21).
Thus, even though more mesoderm differentiation may be achieved, mesoderm cells are not differen-
tiating towards endothelial cells but possibly to other lineages (probably mesenchymal). Therefore, the
improvements achieved in mesoderm differentiation must be complemented with improvements in di-
recting mesoderm cells towards endothelial lineages.
5.1.4 Final improvements
In Section 5.1.3, mesoderm differentiation was improved but no effect on endothelial cell generation was
obtained. As mesoderm gene expression is higher, more mesoderm cells seem to be generated and
thus, directing its differentiation towards endothelial lineages will naturally generate more endothelial
cells.
As seen before in Section 5.1.1, a higher concentration of Activin A seems to help directing differ-
entiation towards endothelial cells. Thus, and taking into account the limit concentration from which
differentiation is endorsed towards endoderm (50 ng/mL), a higher concentration of Activin A (25 ng/mL)
was tested in the conditions of the protocols from Section 5.1.3, in order to promote more endothelial
differentiation. This allowed keeping the improvements verified for mesoderm commitment, as it can be
seen in Figure 4.22, since the same conditions were maintained. Furthermore, no changes are verified
in terms of endoderm gene expression (see Figure 4.23).
Looking at Figure 4.24, it can be deduced that with these conditions, endothelial differentiation is im-
proved. Higher gene expression levels can be observed in all protocols, especially for the genes KDR,
CD31 and VE cadherin, some of the most important endothelial markers. Moreover, KDR expression
increases until day 10, showing that more endothelial differentiation is obtained. The referred improve-
ments are especially high for protocol P14 and P15, when comparing to the control protocol P1 (see
Figure 4.25). P14 and P15 combine high BMP4 with higher Activin A with, in the case of P14, longer Ac-
tivin A and in the case of P15, Wnt3A. This shows once more that BMP4 and Activin A together play an
important role in mesoderm and endothelial differentiation, especially for longer periods. Furthermore,
Wnt3A also has an important role in mesoderm (and thus, further endothelial) differentiation. Between
the two protocols, P15 seems to be the best, showing that Wnt3A has a stronger effect on mesoderm
differentiation than longer Activin.
In conclusion, Activin A and BMP4 have shown to be fundamental for both mesoderm and endothe-
lial differentiation, especially when high concentrations of both cytokines are used together. In addition,
Wnt3A has shown to induce major improvements in mesoderm differentiation. With the applied improve-
ments, not only differentiation towards endothelial cells seems higher but also differentiation towards
other cell lineages seems to be lower. To validate these conclusions in quantitative terms, these four
61

protocols were sorted using flow cytometry. This technique allows the quantification of mesoderm and
endothelial cells in culture through the use of tagged antibodies for specific cell surface markers.
To determine the amount of mesoderm cells that were generated, flow cytometry analysis for meso-
derm markers KDR, PDGFR-α and PDGFR-β was performed, at days 4 and 6. Observing Figure 4.26,
by day 4 about 70-80 % of the cells are KDR, and 40-50 % are PDGFR-α and PDGFR-β. This is a
significant improvement when comparing with the initial protocol, especially for KDR positive cells, as
double the amount of cells is generated. The fact that the number of PDGFR-α and PDGFR-β positive
cells does not match with the number of KDR positive cells at day 4 is because KDR is both a mesoderm
and endothelial marker. Thus, KDR positive cells at day 4 are both mesoderm and already endothelial
committed cells. To confirm this, a double staining should be performed.
By day 6, the amount of mesoderm cells should decrease, as differentiation goes towards endothelial
cells. This must be verified for all markers except KDR, which as referred, is also present in endothelial
cells. Thus, as for gene expression levels, the amount of KDR positive cells should remain constant.
Taking a look at Figure 4.27, PDGFR-α expression decreases. However, it is possible to see that KDR
expression also decreases (about 10 %) instead of being kept constant or increasing. This means that
from D4 to D6, 10 % of the cells lose differentiation to other cell lineages. Most probably, mesoderm
cells differentiate into other lineages, as it is natural for mesoderm cells to undergo mesenchymal differ-
entiation if nothing is done to prevent it. Although double sorting or reporter cell lines had to be used
to prove this, the fact that PDGFR-β expression increases from D4 to D6 in the same proportion as the
KDR decreases helps supporting this theory. PDGFR-β expression should decrease as cells differenti-
ate towards endothelial lineages, as seen for PDGFR-α. The fact that it does not happen suggests that
some mesoderm cells differentiate into mesenchymal, as PDGFR-β is also a marker of mesenchymal
cells. Nevertheless further confirmation, for example with other mesenchymal markers, is necessary.
When comparing the amount of mesoderm cells obtained with each of the different protocols, it is
possible to conclude once again that P15 is the best protocol. With this protocol, not only a higher
amount of mesoderm (and endothelial) cells is obtained (PDGFR-α, PDGFR-β and KDR positive cells),
but also a smaller decrease in the number of KDR positive cells by day 6 is noted. In addition, the
increase in PDGFR-β positive cells by day 6 is the least significant. Thus, P15 allows the generation of a
higher number of endothelial cells with a smaller amount of other cell types in the final population. These
observations support the reasoning made with the gene expression profiles for this protocol, where al-
though the improvements had no statistical significance when comparing with P1, the gene expression
levels of KDR and CD31 genes seemed higher.
Finally, to determine the improvements gained in the end of the differentiation in terms of endothelial
cells number, P15-derived cells were sorted for CD31 marker at day 10. With this, 20-25 % of positive
cells were obtained. When comparing to the data obtained in Section 4.1.1, it can be seen that this rep-
resents an improvement of 10-15 % in the number of CD31 positive cells generated at the end, which is
a relative improvement of 200 %. With this amount of endothelial cells, it is believed that replating of the
sorted cells can produce a pure population of cells for further differentiation into LSECs. Therefore, after
62

10 days of differentiation, differentiated cells were sorted for CD31 marker and the positive cells were
replated.
Nonetheless, replated cells did not survive. The most probable cause of replating failure is the vio-
lence of the FACS technique, which causes a lot of damage to the cells and leads to this outcome. As
alternative, MACS technique can be used. Although there is less purity and a bigger loss of cells as-
sociated with this technique, the amount generated must be enough for subsequential replating. Other
solutions include the usage of a low density protocol or the creation of a reporter cell line, containing a
fluorescent protein or a selection gene that allows easy sorting of endothelial cells.
In conclusion, the protocol for the generation of endothelial cells was improved. With these exper-
iments, it was proven that both BMP4 and Activin A promote mesoderm differentiation. In addition,
BMP4 is more efficient in directing mesoderm differentiation, which is due to the fact that it is essential
for mesoderm formation in vivo, whereas Activin A is only permissive. Furthermore, Activin A seems
to influence mostly endothelial differentiation, rather than mesoderm, which can be due to the fact that
Activin A is also a TGF-β/ALK1 ligand. Even though Activin A is only applied in the early days of differ-
entiation, its effect on endothelial differentiation is visible, especially in protocol P14, where it is applied
for a longer period of time (D0-D4). This supports the fact that Activin A may help EC generation through
TGF-β/ALK1 pathway. Thus, one of the further improvements to be tested is the application of Activin
A for longer periods (until or even after day 6). The same can be tested with BMP4, which is also a
TGF-β/ALK1 ligand. The presence of Wnt3A was also proven to be successful, because as seen with
protocol P15, it helps promoting mesoderm differentiation. Its effect for longer periods or higher con-
centrations must also be tested. In addition, SB-43152 is also beneficial for endothelial differentiation,
even though no direct comparison between the control protocol P1 and the original Verfaillie protocol
was done. The fact that a higher amount of endothelial cells is generated with P15 (which contains SB-
43152), when comparing with the Verfaillie protocol, suggests that it may help EC differentiation. Thus,
a further comparison between there protocols should be done. In addition, as the role of SB-43152
is known to be important for EC differentiation [111], other concentrations of SB-43152 or even other
TGF-β inhibitors (for example, stronger inhibitors or the combination of two) must be tested. The loss of
differentiation observed towards mesenchymal lineages shows that TGF-β/ALK5 pathway is not entirely
blocked to direct all mesoderm differentiation towards endothelial lineages and thus, the use of higher
concentrations of SB-43152 or stronger inhibitors is necessary.
5.2 Creation of an inducible cell line
For LSECs generation, the activation/overexpression of the transcription factor genes involved in the
LSEC in vivo differentiation seems to be the most reliable option. However, little is known about LSECs
and almost nothing about the cytokines and pathways involved in these genes expressions. A solution
for this problem is the creation of an inducible cell line containing a cassette with these genes. With
that, it is possible to overexpress the genes within the cassette without the use of cytokines and growth
factors.
63

To create an inducible cell line with LSEC genes it is necessary to know which genes are involved in
LSEC differentiation. From a collaboration with Prof. dr. Aernout Luttun’s laboratory (Endothelial Cells
Biology group), a list with the transcription factor genes involved in this process was acquired. This list
was obtained by performing microarray studies on human LSECs. Knowing the genes involved in LSEC
differentiation, it is possible to create the referred inducible cell line.
The Verfaillie laboratory already has inducible cell systems for hepatocytes generation, allowing the
overexpression of some hepatic genes that may help promoting hepatocytes maturation. Thus, the stem
cell line and plasmid were already made and could be used for the creation of the LSEC inducible cell
line. Only the multiple cloning site (MCS) containing the LSEC transcription factors (TF) genes had to
be created. Based on the available space and available TF gene templates, TFEC, Gata4 and HoxB
genes were selected. Figure 4.30 shows the designed MCS, which contains a KOZAK sequence to
promote genes transcription and two P2A sequences for cleavage of the proteins, as they are translated
together. Although the P2As add aminoacids to the protein sequences, which can lead to misfolding
or even protein deactivation, the number of aminoacids added is small (only two) and thus should not
affect protein functionality. P2A sequences have been used before, proving efficient and safe, without
any effects on the proteins. To insert these elements in the MCS, the KOZAK sequence was placed in
the primer of the first gene in the MCS, whereas the P2As were cloned like the genes (through digestion,
ligation and transformation steps).
The first steps of MCS construction were the amplification of the P2As and TF sequences, and con-
firmation of the correct amplified pieces (using agarose gel electrophoresis). It is important to note that
the primers used to amplify the P2As and TFs contained the restriction sites necessary for subsequential
insertion of the following sequences in the MCS. For their insertion in the MCS, the amplified products
were digested at each step, together with the Vector: firstly to take in the P2As and then, sequentially for
each of the TF genes. After Vector digestion, the P2As were ligated and the product was transformed
into bacteria. From several colonies, one of the correctly ligated plasmids was selected and then again
digested, ligated with the next TF gene, transformed and selected. The same steps were repeated for
all TFs, until all genes were inserted in the MCS.
Although ligation has been successfully for all other sequences, it failed for Gata4 gene. This may
be related with the fact that Gata4 was very difficult to amplify. In fact, its amplification cannot be done
using normal PCR, as the Gata4 sequence has a high GC content. Thus, high melting temperature
PCR, with appropriate high melting temperature primers, is required. Several high melting temperature
PCRs with different annealing temperatures, elongation times and number of cycles were tried, but no
results. The sequence of the Gata4 gene was finally obtained by digesting the plasmid containing this
gene template, and isolating and purifying the band with Gata4. However, the fact that ligation was
not successful suggests that probably the DNA piece extracted from the digested vector did not contain
Gata4 or was not enough for ligation. Thus, further efforts to amplify Gata4 from its template must be
done. This can include, for example, other annealing temperatures, a higher number of amplification
cycles or even a new template.
64

In conclusion, the Vector containing the MCS was created, with already 2 of the 3 TFs inside. The
cloning of the third TF gene is ongoing and the ligated plasmids obtained at each step are being con-
firmed with sequencing. After the MCS is obtained, the inducible stem cell line will be transformed and
then, differentiation will be started. Firstly differentiation will be directed with cytokines through meso-
derm and endothelial lineages and then, around day 10, the inducible system will be switched on, with
the application of DOX.
Once the LSECs are generated, co-cultures with immature hepatocytes can be performed. A first
approach for this can be the use of monolayer cultures, as it has been proved successful for other cell
types (e.g. co-cultures of hepatocytes with endothelial cells) [157]. Further approaches include the cre-
ation of 3D co-culture systems to mimic the in vivo environment.
65

66

Chapter 6
Conclusions and future perspectives
With this experimental work, endothelial cells were differentiated from hESCs and the protocol for that
was successfully improved. Even though no protocols for LSEC generation are yet available, the creation
of a inducible cell line with LSEC TFs seemed to be a suitable alternative, as this approach was suc-
cessful in other cell lines [143], [144], [142]. The need for hepatocytes is widely recognized in both the
pharmaceutical industry and medicine fields, and the solution for the generation of mature hepatocytes
may be their co-cultures with LSECs or other non-parenchymal cells [44], [42], [45], [39], [62]. Thus,
the work developed can play an important role in this field and can have an impact in the generation of
mature hepatocytes in vitro.
Furthermore, the improvements developed for the generation of endothelial cells are not only vital
for the differentiation of LSECs and hepatocytes (as endothelial cells can be used by themselves for
co-cultures with hepatocytes to improve their maturation [51]), but also for other fields. The circulatory
system is one of the most important organs in the human body and it is related to all organs. Like for the
liver, endothelial cells can be used for the generation of mature cells in other organs, providing the ap-
propriate neighbour signals. Moreover, cardiac diseases are responsible for more than 30 % of deaths
worldwide and thus, the generation of ECs may have an impact on disease modelling and research for
new therapies [158], [159], [160], [161], [162].
In quantitative terms, the developed improvements represent an increase of 10-15 % in the final num-
ber of endothelial cells obtained, when comparing with the original protocol (and a relative improvement
of 200 %). BMP4 has shown to play an essential role in mesoderm cell differentiation, which leads to
an improvement in the generation of endothelial cells at the end of differentiation. This improvement is
only significant when Activin A is also present in the medium. Furthermore, Wnt3A showed to have a
remarkable effect on mesoderm differentiation, improving significantly the gene expression levels and
the amount of generated mesoderm cells, when added together with the previous cytokines.
The addition of Activin A by itself did not demonstrate any significant improvements in terms of
mesoderm differentiation. Yet, Activin A seems to have an important effect on endothelial differentia-
tion, especially in higher concentrations. Although this may be related to the activation of TGF-β/ALK1
pathway, which promotes differentiation of mesoderm cells towards endothelial cells, Activin A is added
67

before endothelial differentiation. The fact that matrigel is used as matrix can trap the Activin added
or produced by the cells, promoting this effect. Nevertheless, the cause of this effect should be further
investigated.
Further improvements on the generation of endothelial cells may include the application of Activin
A or BMP4 in later days of differentiation to test their role in the activation of TGF-β/ALK1 pathway. In
addition, as the presence of Wnt3A was also proven successful, its effect for longer periods or higher
concentrations must also be tested.
Although no direct comparison between the Verfaillie protocol and P1 was done, the presence of
SB-43152 was proven to be beneficial in other cases [111], [163]. Thus, the effect of other concentra-
tions of SB-43152 or other TGF-β inhibitors should be tested. To sustain this conclusions, a comparison
between the Verfaillie protocol and P1 must be performed.
For LSEC generation, an inducible cell line containing LSEC TFs was selected as approach. For
that, an inducible cassette containing a MCS with the TF genes had to be made. The inducible cassette
was already available in the Verfaillie Lab and only the MCS had to be created. Considering the available
space in the vector, three TF genes were selected. Two of these are already cloned and the third one is
ongoing. After cloning and confirmation of the third TF, the plasmid containing the inducible system and
the MCS will be transformed. For this, a cell line with a cassette that can be switched with the plasmid
cassette is used.
After generation of the inducible cell line, it is then possible to generate LSECs. That will be done in
two different ways: by inducing the cell line at day 10, after endothelial differentiation; and by inducing
it already by day 6, after mesoderm differentiation. This second approach will be tested, together with
the addition of cytokines for endothelial differentiation, as some suggest that LSECs may come from a
common progenitor of EC and not from their differentiation. Thus, the induction of the cell line at day
6 may promote differentiation from that precursor and be more successful than the differentiation from
endothelial cells.
With the LSEC generation, co-cultures with hepatocytes can be tried. This can be performed by
using monolayer systems, which is already done with endothelial cell sheets [157], or by creating a 3D
co-culture structure that resembles the liver lobule, mimicking the in vivo situation of liver development.
68

Bibliography
[1] N Kalsheker. Alpha 1-antitrypsin: structure, function and molecular biology of the gene. Bio-
science reports, 9(2):129–138, April 1989. ISSN 0144-8463.
[2] G J Mizejewski. Alpha-fetoprotein structure and function: relevance to isoforms, epitopes, and
conformational variants. Experimental biology and medicine (Maywood, N.J.), 226(5):377–408,
May 2001. ISSN 1535-3702.
[3] J W Hawkins and A Dugaiczyk. The human serum albumin gene: structure of a unique locus.
Gene, 19(1):55–58, August 1982. ISSN 0378-1119.
[4] Corinna B Scholz and Ulrich Technau. The ancestral role of brachyury: expression of NemBra1
in the basal cnidarian nematostella vectensis (anthozoa). Development genes and evolution, 212
(12):563–570, January 2003. ISSN 0949-944X. doi: 10.1007/s00427-002-0272-x.
[5] Benjamin L Martin and David Kimelman. Brachyury establishes the embryonic mesodermal pro-
genitor niche. Genes & development, 24(24):2778–2783, December 2010. ISSN 1549-5477. doi:
10.1101/gad.1962910.
[6] Sarah E Duff, Chenggang Li, John M Garland, and Shant Kumar. CD105 is important for angio-
genesis: evidence and potential applications. FASEB journal: official publication of the Federation
of American Societies for Experimental Biology, 17(9):984–992, June 2003. ISSN 1530-6860.
doi: 10.1096/fj.02-0634rev.
[7] H S Baldwin, H M Shen, H C Yan, H M DeLisser, A Chung, C Mickanin, T Trask, N E Kirschbaum,
P J Newman, and S M Albelda. Platelet endothelial cell adhesion molecule-1 (PECAM-1/CD31):
alternatively spliced, functionally distinct isoforms expressed during mammalian cardiovascular
development. Development (Cambridge, England), 120(9):2539–2553, September 1994. ISSN
0950-1991.
[8] A Caruz, M Samsom, J M Alonso, J Alcami, F Baleux, J L Virelizier, M Parmentier, and
F Arenzana-Seisdedos. Genomic organization and promoter characterization of human CXCR4
gene. FEBS letters, 426(2):271–278, April 1998. ISSN 0014-5793.
[9] Annett Kurtz, Andreas Bosio, Dirk Winnemoller, and Sebastian Knoebel. Highly efficient differen-
tiation of hPSC into hepatocyte-like cells by selection of CXCR4 (CD184)+ definitive endoderm
(DE) cells. 6th Annual Meeting for Australasian Society for Stem Cell Research, October 2013.
69

[10] Jun Ho Lee, Ki Sung Hong, Charlie Mantel, Hal E Broxmeyer, Man Ryul Lee, and Kye-Seong Kim.
Spontaneously differentiated GATA6-positive human embryonic stem cells represent an important
cellular step in human embryonic development; they are not just an artifact of in vitro culture. Stem
cells and development, 22(20):2706–2713, October 2013. ISSN 1557-8534. doi: 10.1089/scd.
2013.0083.
[11] F L Chartier, J P Bossu, V Laudet, J C Fruchart, and B Laine. Cloning and sequencing of cDNAs
encoding the human hepatocyte nuclear factor 4 indicate the presence of two isoforms in human
liver. Gene, 147(2):269–272, September 1994. ISSN 0378-1119.
[12] X Yang and C L Cepko. Flk-1, a receptor for vascular endothelial growth factor (VEGF), is ex-
pressed by retinal progenitor cells. The Journal of neuroscience: the official journal of the Society
for Neuroscience, 16(19):6089–6099, October 1996. ISSN 0270-6474.
[13] Li Tang, Juntao Yang, Wanli Liu, Xiaoming Tang, Jie Chen, Dianyuan Zhao, Min Wang, Feng Xu,
Yantao Lu, Biao Liu, Qihong Sun, Lingqiang Zhang, and Fuchu He. Liver sinusoidal endothelial
cell lectin, LSECtin, negatively regulates hepatic t-cell immune response. Gastroenterology, 137
(4):1498–1508.e1–5, October 2009. ISSN 1528-0012. doi: 10.1053/j.gastro.2009.07.051.
[14] P. F. Lalor, W. K. Lai, S. M. Curbishley, S. Shetty, and D. H. Adams. Human hepatic sinusoidal
endothelial cells can be distinguished by expression of phenotypic markers related to their spe-
cialised functions in vivo. World journal of gastroenterology: WJG, 12(34):5429–5439, September
2006. ISSN 1007-9327.
[15] Jason P. Gardner, Robert J. Durso, Robert R. Arrigale, Gerald P. Donovan, Paul J. Maddon, Tat-
jana Dragic, and William C. Olson. L-SIGN (CD 209l) is a liver-specific capture receptor for hep-
atitis c virus. Proceedings of the National Academy of Sciences of the United States of America,
100(8):4498–4503, April 2003. ISSN 0027-8424. doi: 10.1073/pnas.0831128100.
[16] Ian Chambers, Douglas Colby, Morag Robertson, Jennifer Nichols, Sonia Lee, Susan Tweedie,
and Austin Smith. Functional expression cloning of nanog, a pluripotency sustaining factor in
embryonic stem cells. Cell, 113(5):643–655, May 2003. ISSN 0092-8674.
[17] S L Palmieri, W Peter, H Hess, and H R Scholer. Oct-4 transcription factor is differentially ex-
pressed in the mouse embryo during establishment of the first two extraembryonic cell lineages
involved in implantation. Developmental biology, 166(1):259–267, November 1994. ISSN 0012-
1606. doi: 10.1006/dbio.1994.1312.
[18] H R Scholer, A K Hatzopoulos, R Balling, N Suzuki, and P Gruss. A family of octamer-specific
proteins present during mouse embryogenesis: evidence for germline-specific expression of an
oct factor. The EMBO journal, 8(9):2543–2550, September 1989. ISSN 0261-4189.
[19] H Niwa, J Miyazaki, and A G Smith. Quantitative expression of oct-3/4 defines differentiation,
dedifferentiation or self-renewal of ES cells. Nature genetics, 24(4):372–376, April 2000. ISSN
1061-4036. doi: 10.1038/74199.
[20] M Hannink and D J Donoghue. Structure and function of platelet-derived growth factor (PDGF)
and related proteins. Biochimica et biophysica acta, 989(1):1–10, July 1989. ISSN 0006-3002.
70

[21] Kathy K Niakan, Hongkai Ji, Rene Maehr, Steven A Vokes, Kit T Rodolfa, Richard I Sherwood,
Mariko Yamaki, John T Dimos, Alice E Chen, Douglas A Melton, Andrew P McMahon, and Kevin
Eggan. Sox17 promotes differentiation in mouse embryonic stem cells by directly regulating ex-
traembryonic gene expression and indirectly antagonizing self-renewal. Genes & development,
24(3):312–326, February 2010. ISSN 1549-5477. doi: 10.1101/gad.1833510.
[22] A L Wong, Z A Haroon, S Werner, M W Dewhirst, C S Greenberg, and K G Peters. Tie2 expression
and phosphorylation in angiogenic and quiescent adult tissues. Circulation research, 81(4):567–
574, October 1997. ISSN 0009-7330.
[23] S Gory-Faure, M H Prandini, H Pointu, V Roullot, I Pignot-Paintrand, M Vernet, and P Huber. Role
of vascular endothelial-cadherin in vascular morphogenesis. Development (Cambridge, England),
126(10):2093–2102, May 1999. ISSN 0950-1991.
[24] Henry Rivera, Begona Merinero, Mercedes Martinez-Pardo, Ignacio Arroyo, Pedro Ruiz-Sala, Be-
len Bornstein, Clara Serra-Suhe, Esther Gallardo, Ramon Marti, Maria J. Moran, Cristina Ugalde,
Luis A. Perez-Jurado, Antoni L. Andreu, Rafael Garesse, Magdalena Ugarte, Joaquin Arenas,
and Miguel A. Martin. Marked mitochondrial DNA depletion associated with a novel SUCLG1
gene mutation resulting in lethal neonatal acidosis, multi-organ failure, and interrupted aortic arch.
Mitochondrion, 10(4):362–368, June 2010. ISSN 1872-8278. doi: 10.1016/j.mito.2010.03.003.
[25] C. Lengauer, K. W. Kinzler, and B. Vogelstein. Genetic instabilities in human cancers. Nature, 396
(6712):643–649, December 1998. ISSN 0028-0836. doi: 10.1038/25292.
[26] Mary-Ellen Taplin. Drug insight: role of the androgen receptor in the development and progression
of prostate cancer. Nature Clinical Practice. Oncology, 4(4):236–244, April 2007. ISSN 1743-
4262. doi: 10.1038/ncponc0765.
[27] Stuart K. Calderwood, Md Abdul Khaleque, Douglas B. Sawyer, and Daniel R. Ciocca. Heat
shock proteins in cancer: chaperones of tumorigenesis. Trends in Biochemical Sciences, 31(3):
164–172, March 2006. ISSN 0968-0004. doi: 10.1016/j.tibs.2006.01.006.
[28] Paul B. Watkins and Randall W. Whitcomb. Hepatic dysfunction associated with troglitazone.
New England Journal of Medicine, 338(13):916–917, March 1998. ISSN 0028-4793, 1533-
4406. doi: 10.1056/NEJM199803263381314. URL http://www.nejm.org/doi/abs/10.1056/
NEJM199803263381314.
[29] Jean-Frederic Colombel, Edward V. Loftus, William J. Tremaine, Laurence J. Egan, W.Scott Harm-
sen, Cathy D. Schleck, Alan R. Zinsmeister, and William J. Sandborn. The safety profile of inflix-
imab in patients with crohn’s disease: The mayo clinic experience in 500 patients. Gastroen-
terology, 126(1):19–31, January 2004. ISSN 00165085. doi: 10.1053/j.gastro.2003.10.047. URL
http://linkinghub.elsevier.com/retrieve/pii/S0016508503017153.
[30] Naga Chalasani, Robert J. Fontana, Herbert L. Bonkovsky, Paul B. Watkins, Timothy Davern,
Jose Serrano, Hongqiu Yang, and James Rochon. Causes, clinical features, and outcomes from
a prospective study of drug-induced liver injury in the united states. Gastroenterology, 135(6):
71

1924–1934.e4, December 2008. ISSN 00165085. doi: 10.1053/j.gastro.2008.09.011. URL http:
//linkinghub.elsevier.com/retrieve/pii/S0016508508016740.
[31] Esther F.A Brandon, Christiaan D Raap, Irma Meijerman, Jos H Beijnen, and Jan H.M Schellens.
An update on in vitro test methods in human hepatic drug biotransformation research: pros and
cons. Toxicology and Applied Pharmacology, 189(3):233–246, June 2003. ISSN 0041008X.
doi: 10.1016/S0041-008X(03)00128-5. URL http://linkinghub.elsevier.com/retrieve/pii/
S0041008X03001285.
[32] J. Drews. Drug discovery: A historical perspective. Science, 287(5460):1960–1964, March
2000. ISSN 00368075, 10959203. doi: 10.1126/science.287.5460.1960. URL http://www.
sciencemag.org/cgi/doi/10.1126/science.287.5460.1960.
[33] Anett Ullrich, Donna B. Stolz, Ewa C. Ellis, Stephen C. Strom, George K. Michalopoulos, Jan G.
Hengstler, and Dieter Runge. Long term cultures of primary human hepatocytes as an alternative
to drug testing in animals. ALTEX, 26(4):295–302, 2009. ISSN 1868-596X.
[34] Ron McKay. Stem cells — hype and hope. Nature, 406(6794):361–364, July 2000. ISSN 0028-
0836. doi: 10.1038/35019186. URL http://www.nature.com/doifinder/10.1038/35019186.
[35] Cheul H. Cho, Natesh Parashurama, Eric Y. H. Park, Kazuhiro Suganuma, Yaakov Nahmias,
Jaesung Park, Arno W. Tilles, Francois Berthiaume, and Martin L. Yarmush. Homogeneous differ-
entiation of hepatocyte-like cells from embryonic stem cells: applications for the treatment of liver
failure. FASEB journal: official publication of the Federation of American Societies for Experimen-
tal Biology, 22(3):898–909, March 2008. ISSN 1530-6860. doi: 10.1096/fj.06-7764com.
[36] R Busuttil. The utility of marginal donors in liver transplantation. Liver Transplantation, 9(7):651–
663, July 2003. ISSN 15276465. doi: 10.1053/jlts.2003.50105. URL http://doi.wiley.com/10.
1053/jlts.2003.50105.
[37] C. E. Broelsch, J. C. Emond, P. F. Whitington, J. R. Thistlethwaite, A. L. Baker, and J. L. Lich-
tor. Application of reduced-size liver transplants as split grafts, auxiliary orthotopic grafts, and
living related segmental transplants. Annals of Surgery, 212(3):368–375; discussion 375–377,
September 1990. ISSN 0003-4932.
[38] Erich Knop, Augustinus Bader, Klaus Bker, Rudolf Pichlmayr, and Karl-Friedrich Sewing. Ultra-
structural and functional differentiation of hepatocytes under long-term culture conditions. The
Anatomical Record, 242(3):337–349, July 1995. ISSN 0003-276X, 1097-0185. doi: 10.1002/ar.
1092420307. URL http://doi.wiley.com/10.1002/ar.1092420307.
[39] Rolf Gebhardt, Jan G. Hengstler, Dieter Muller, Reinhild Glockner, Peter Buenning, Britta Laube,
Eva Schmelzer, Martina Ullrich, Dietmar Utesch, Nicola Hewitt, Michael Ringel, Beate Reder
Hilz, Augustinus Bader, Angelika Langsch, Thomas Koose, Hans-Jorg Burger, Jochen Maas, and
Franz Oesch. New hepatocyte in vitro systems for drug metabolism: metabolic capacity and
recommendations for application in basic research and drug development, standard operation
procedures. Drug Metabolism Reviews, 35(2-3):145–213, August 2003. ISSN 0360-2532. doi:
10.1081/DMR-120023684.
72

[40] David C. Hay, Debiao Zhao, Judy Fletcher, Zoe A. Hewitt, Doris McLean, Alai Urruticoechea-
Uriguen, James R. Black, Cliff Elcombe, James A. Ross, Roland Wolf, and Wei Cui. Efficient
differentiation of hepatocytes from human embryonic stem cells exhibiting markers recapitulating
liver development in vivo. Stem Cells, 26(4):894–902, April 2008. ISSN 10665099, 15494918. doi:
10.1634/stemcells.2007-0718. URL http://doi.wiley.com/10.1634/stemcells.2007-0718.
[41] C. Verfaillie. Pluripotent stem cells. Transfusion Clinique et Biologique, 16(2):65–69, May 2009.
ISSN 12467820. doi: 10.1016/j.tracli.2009.04.006. URL http://linkinghub.elsevier.com/
retrieve/pii/S1246782009000718.
[42] R. E. Schwartz, H. E. Fleming, and S. N. Bhatia. Pluripotent stem cell-derived hepatocyte-like
cells. Biotechnology Advances. ISSN 0734-9750. doi: 10.1016/j.biotechadv.2014.01.003. URL
http://www.sciencedirect.com/science/article/pii/S0734975014000056.
[43] Dagmara Szkolnicka, Wenli Zhou, Balta Lucendo-Villarin, and David C. Hay. Pluripotent
stem cell-derived hepatocytes: potential and challenges in pharmacology. Annual Review
of Pharmacology and Toxicology, 53:147–159, 2013. ISSN 1545-4304. doi: 10.1146/
annurev-pharmtox-011112-140306.
[44] Laura Ordovas, Yonsil Park, and Catherine M. Verfaillie. Stem cells and liver engineering. Biotech-
nology Advances, 31(7):1094–1107, November 2013. ISSN 07349750. doi: 10.1016/j.biotechadv.
2013.07.002. URL http://linkinghub.elsevier.com/retrieve/pii/S073497501300116X.
[45] Yi-Chin Toh, Teck Chuan Lim, Dean Tai, Guangfa Xiao, Danny van Noort, and Hanry Yu. A
microfluidic 3d hepatocyte chip for drug toxicity testing. Lab on a Chip, 9(14):2026–2035, July
2009. ISSN 1473-0197. doi: 10.1039/b900912d.
[46] J.S. Kulkarni and A. Khanna. Functional hepatocyte-like cells derived from mouse embryonic
stem cells: A novel in vitro hepatotoxicity model for drug screening. Toxicology in Vitro, 20(6):
1014–1022, September 2006. ISSN 08872333. doi: 10.1016/j.tiv.2005.12.011. URL http://
linkinghub.elsevier.com/retrieve/pii/S0887233306000166.
[47] Lakshmi Rambhatla, Choy-Pik Chiu, Pratima Kundu, Yun Peng, and Melissa K Carpenter. Gener-
ation of hepatocyte-like cells from human embryonic stem cells. Cell transplantation, 12(1):1–11,
2003. ISSN 0963-6897. PMID: 12693659.
[48] Yu-Fan Chen, Chien-Yu Tseng, Hsei-Wei Wang, Hung-Chih Kuo, Vincent W Yang, and Oscar K
Lee. Rapid generation of mature hepatocyte-like cells from human induced pluripotent stem cells
by an efficient three-step protocol. Hepatology (Baltimore, Md.), 55(4):1193–1203, April 2012.
ISSN 1527-3350. doi: 10.1002/hep.24790. PMID: 22095466 PMCID: PMC3779307.
[49] C Guguenguillouzo, B Clement, G Baffet, C Beaumont, E Morelchany, D Glaise, and A Guillouzo.
Maintenance and reversibility of active albumin secretion by adult rat hepatocytes co-cultured
with another liver epithelial cell type. Experimental Cell Research, 143(1):47–54, January 1983.
ISSN 00144827. doi: 10.1016/0014-4827(83)90107-6. URL http://linkinghub.elsevier.com/
retrieve/pii/0014482783901076.
73

[50] Yeonhee Kim and Padmavathy Rajagopalan. 3D hepatic cultures simultaneously maintain primary
hepatocyte and liver sinusoidal endothelial cell phenotypes. PloS one, 5(11):e15456, 2010. ISSN
1932-6203. doi: 10.1371/journal.pone.0015456.
[51] Chan Du, Karthikeyan Narayanan, Meng Fatt Leong, and Andrew C. A. Wan. Induced pluripotent
stem cell-derived hepatocytes and endothelial cells in multi-component hydrogel fibers for liver
tissue engineering. Biomaterials, 35(23):6006–6014, July 2014. ISSN 1878-5905. doi: 10.1016/
j.biomaterials.2014.04.011.
[52] Rena N.B. Bhandari, Lisa A. Riccalton, Andrew L. Lewis, Jeffrey R. Fry, Alison H. Hammond,
Saul J.B. Tendler, and Kevin M. Shakesheff. Liver tissue engineering: A role for co-culture systems
in modifying hepatocyte function and viability. Tissue Engineering, 7(3):345–357, June 2001. ISSN
1076-3279, 1557-8690. doi: 10.1089/10763270152044206. URL http://www.liebertonline.
com/doi/abs/10.1089/10763270152044206.
[53] Odette Morin and Claire Normand. Long-term maintenance of hepatocyte functional activ-
ity in co-culture: Requirements for sinusoidal endothelial cells and dexamethasone. Journal
of Cellular Physiology, 129(1):103–110, October 1986. ISSN 0021-9541, 1097-4652. doi:
10.1002/jcp.1041290115. URL http://doi.wiley.com/10.1002/jcp.1041290115.
[54] Alejandro Soto-Gutierrez, Hesham Basma, Nalu Navarro-Alvarez, Basak E. Uygun, Martin L.
Yarmush, Naoya Kobayashi, and Ira J. Fox. Differentiating stem cells into liver. Biotechnology
and Genetic Engineering Reviews, 25(1):149–164, 2008. URL http://www.tandfonline.com/
doi/abs/10.5661/bger-25-149.
[55] Albert P Li. Screening for human ADME/tox drug properties in drug discovery. Drug Discovery
Today, 6(7):357–366, April 2001. ISSN 13596446. doi: 10.1016/S1359-6446(01)01712-3. URL
http://linkinghub.elsevier.com/retrieve/pii/S1359644601017123.
[56] P Sancho-Bru, P Roelandt, N Narain, K Pauwelyn, T Notelaers, T Shimizu, M Ott, and C Verfaillie.
Directed differentiation of murine-induced pluripotent stem cells to functional hepatocyte-like cells.
J Hepatol, 54(1):98–107, Januar 2011. URL http://www.ncbi.nlm.nih.gov/pubmed/20933294.
[57] Eva-Maria Materne, Alexander G. Tonevitsky, and Uwe Marx. Chip-based liver equivalents for
toxicity testing–organotypicalness versus cost-efficient high throughput. Lab on a Chip, 13(18):
3481–3495, September 2013. ISSN 1473-0189. doi: 10.1039/c3lc50240f.
[58] M. Teresa Donato, Ramiro Jover, and M. Jose Gomez-Lechon. Hepatic cell lines for drug hepa-
totoxicity testing: limitations and strategies to upgrade their metabolic competence by gene engi-
neering. Current Drug Metabolism, 14(9):946–968, November 2013. ISSN 1875-5453.
[59] Michael N. Berry and Anthony M. Edwards, editors. The Hepatocyte Review. Springer Nether-
lands, Dordrecht, 2000. ISBN 978-90-481-5402-9, 978-94-017-3345-8. URL http://link.
springer.com/10.1007/978-94-017-3345-8.
[60] Mitsuru Inamura, Kenji Kawabata, Kazuo Takayama, Katsuhisa Tashiro, Fuminori Sakurai, Kazu-
fumi Katayama, Masashi Toyoda, Hidenori Akutsu, Yoshitaka Miyagawa, Hajime Okita, Nobutaka
74

Kiyokawa, Akihiro Umezawa, Takao Hayakawa, Miho K Furue, and Hiroyuki Mizuguchi. Efficient
generation of hepatoblasts from human ES cells and iPS cells by transient overexpression of
homeobox gene HEX. Molecular therapy: the journal of the American Society of Gene Therapy,
19(2):400–407, February 2011. ISSN 1525-0024. doi: 10.1038/mt.2010.241. PMID: 21102561
PMCID: PMC3034848.
[61] Monica Ek, Therese Soderdahl, Barbara Kuppers-Munther, Josefina Edsbagge, Tommy B. An-
dersson, Petter Bjorquist, Ian Cotgreave, Bengt Jernstrom, Magnus Ingelman-Sundberg, and In-
ger Johansson. Expression of drug metabolizing enzymes in hepatocyte-like cells derived from
human embryonic stem cells. Biochemical Pharmacology, 74(3):496–503, August 2007. ISSN
00062952. doi: 10.1016/j.bcp.2007.05.009. URL http://linkinghub.elsevier.com/retrieve/
pii/S0006295207002936.
[62] Stevan A Gonzalez and Emmet B Keeffe. Chronic viral hepatitis: epidemiology, molecular biology,
and antiviral therapy. Frontiers in bioscience (Landmark edition), 16:225–250, 2011. ISSN 1093-
4715. PMID: 21196168.
[63] Robin D. Hughes, Ragai R. Mitry, and Anil Dhawan. Current status of hepatocyte transplan-
tation:. Transplantation, 93(4):342–347, February 2012. ISSN 0041-1337. doi: 10.1097/
TP.0b013e31823b72d6. URL http://content.wkhealth.com/linkback/openurl?sid=WKPTLP:
landingpage&an=00007890-201202270-00002.
[64] J. Bernuau, B. Rueff, and J. P. Benhamou. Fulminant and subfulminant liver failure: definitions
and causes. Seminars in Liver Disease, 6(2):97–106, May 1986. ISSN 0272-8087. doi: 10.1055/
s-2008-1040593.
[65] Robert A. F. M. Chamuleau, Tanja Deurholt, and Ruurdtje Hoekstra. Which are the right cells to
be used in a bioartificial liver? Metabolic Brain Disease, 20(4):327–335, December 2005. ISSN
0885-7490, 1573-7365. doi: 10.1007/s11011-005-7914-4. URL http://link.springer.com/
10.1007/s11011-005-7914-4.
[66] M Thamara P R Perera, Darius F Mirza, and Elwyn Elias. Liver transplantation: Issues for the
next 20 years. Journal of gastroenterology and hepatology, 24 Suppl 3:S124–131, October 2009.
ISSN 1440-1746. doi: 10.1111/j.1440-1746.2009.06081.x. PMID: 19799690.
[67] H Yamamoto. Differentiation of embryonic stem cells into hepatocytes: Biological functions and
therapeutic application. Hepatology, 37(5):983–993, May 2003. ISSN 02709139. doi: 10.1053/
jhep.2003.50202. URL http://doi.wiley.com/10.1053/jhep.2003.50202.
[68] David C Hay, Judy Fletcher, Catherine Payne, John D Terrace, Ronald C J Gallagher, Jan Snoeys,
James R Black, Davina Wojtacha, Kay Samuel, Zara Hannoun, Anne Pryde, Celine Filippi, Ian S
Currie, Stuart J Forbes, James A Ross, Philip N Newsome, and John P Iredale. Highly effi-
cient differentiation of hESCs to functional hepatic endoderm requires ActivinA and wnt3a signal-
ing. Proceedings of the National Academy of Sciences of the United States of America, 105(34):
12301–12306, August 2008. ISSN 1091-6490. doi: 10.1073/pnas.0806522105. PMID: 18719101
PMCID: PMC2518825.
75

[69] Giovanni Amabile and Alexander Meissner. Induced pluripotent stem cells: current progress and
potential for regenerative medicine. Trends in Molecular Medicine, 15(2):59–68, February 2009.
ISSN 14714914. doi: 10.1016/j.molmed.2008.12.003. URL http://linkinghub.elsevier.com/
retrieve/pii/S1471491409000161.
[70] B. E. Reubinoff, M. F. Pera, C. Y. Fong, A. Trounson, and A. Bongso. Embryonic stem cell lines
from human blastocysts: somatic differentiation in vitro. Nature Biotechnology, 18(4):399–404,
April 2000. ISSN 1087-0156. doi: 10.1038/74447.
[71] Zhenzhen Zhang, Jianfang Liu, Yang Liu, Zheng Li, Wei-Qiang Gao, and Zuping He. Generation,
characterization and potential therapeutic applications of mature and functional hepatocytes from
stem cells. Journal of Cellular Physiology, 228(2):298–305, February 2013. ISSN 00219541. doi:
10.1002/jcp.24150. URL http://doi.wiley.com/10.1002/jcp.24150.
[72] Minoru Tomizawa, Fuminobu Shinozaki, Takao Sugiyama, Shigenori Yamamoto, Makoto
Sueishi, and Takanobu Yoshi. Induced pluripotent stem cells as a source of hepato-
cytes. In Deepa Bhartiya, editor, Pluripotent Stem Cells. InTech, August 2013. ISBN
978-953-51-1192-4. URL http://www.intechopen.com/books/pluripotent-stem-cells/
induced-pluripotent-stem-cells-as-a-source-of-hepatocytes.
[73] Mick Bhatia, Andrew G. Elefanty, Susan J. Fisher, Roger Patient, Thorsten Schlaeger, and Evan Y.
Snyder, editors. Current Protocols in Stem Cell Biology. John Wiley & Sons, Inc., Hoboken, NJ,
USA, June 2007. ISBN 9780470151808.
[74] Hossein Baharvand, Seyed M. Hashemi, Saeid Kazemi Ashtiani, and Ali Farrokhi. Differentia-
tion of human embryonic stem cells into hepatocytes in 2d and 3d culture systems in vitro. The
International Journal of Developmental Biology, 50(7):645–652, 2006. ISSN 0214-6282. doi:
10.1387/ijdb.052072hb. URL http://www.intjdevbiol.com/paper.php?doi=052072hb.
[75] Reproducible, ultra high-throughput formation of multicellular organization from single cell
suspension-derived human embryonic stem cell aggregates. 3. ISSN 1932-6203. doi: 10.1371/
journal.pone.0001565. URL http://www.ncbi.nlm.nih.gov/pmc/articles/PMC2215775/.
[76] Kazuo Takayama, Kenji Kawabata, Yasuhito Nagamoto, Keisuke Kishimoto, Katsuhisa Tashiro,
Fuminori Sakurai, Masashi Tachibana, Katsuhiro Kanda, Takao Hayakawa, Miho Kusuda Furue,
and Hiroyuki Mizuguchi. 3d spheroid culture of hESC/hiPSC-derived hepatocyte-like cells for
drug toxicity testing. Biomaterials, 34(7):1781–1789, February 2013. ISSN 1878-5905. doi:
10.1016/j.biomaterials.2012.11.029.
[77] Hesham Basma, Alejandro Soto-Gutierrez, Govardhana Rao Yannam, Liping Liu, Ryotaro Ito,
Toshiyuki Yamamoto, Ewa Ellis, Steven D Carson, Shintaro Sato, Yong Chen, David Muirhead,
Nalu Navarro-Alvarez, Ronald J Wong, Jayanta Roy-Chowdhury, Jeffrey L Platt, David F Mercer,
John D Miller, Stephen C Strom, Naoya Kobayashi, and Ira J Fox. Differentiation and transplan-
tation of human embryonic stem cell-derived hepatocytes. Gastroenterology, 136(3):990–999,
March 2009. ISSN 1528-0012. doi: 10.1053/j.gastro.2008.10.047. PMID: 19026649 PMCID:
PMC2732349.
76

[78] Thomas Touboul, Nicholas R F Hannan, Sebastien Corbineau, Amelie Martinez, Clemence Mar-
tinet, Sophie Branchereau, Sylvie Mainot, Helene Strick-Marchand, Roger Pedersen, James
Di Santo, Anne Weber, and Ludovic Vallier. Generation of functional hepatocytes from human em-
bryonic stem cells under chemically defined conditions that recapitulate liver development. Hepa-
tology (Baltimore, Md.), 51(5):1754–1765, May 2010. ISSN 1527-3350. doi: 10.1002/hep.23506.
PMID: 20301097.
[79] M Schuldiner, O Yanuka, J Itskovitz-Eldor, D A Melton, and N Benvenisty. Effects of eight growth
factors on the differentiation of cells derived from human embryonic stem cells. Proceedings of
the National Academy of Sciences of the United States of America, 97(21):11307–11312, October
2000. ISSN 0027-8424. doi: 10.1073/pnas.97.21.11307. PMID: 11027332 PMCID: PMC17196.
[80] K S Zaret, J Watts, J Xu, E Wandzioch, S T Smale, and T Sekiya. Pioneer factors, genetic compe-
tence, and inductive signaling: programming liver and pancreas progenitors from the endoderm.
Cold Spring Harbor symposia on quantitative biology, 73:119–126, 2008. ISSN 1943-4456. doi:
10.1101/sqb.2008.73.040. PMID: 19028990 PMCID: PMC2773436.
[81] Aaron M. Zorn. Liver development. In StemBook. Harvard Stem Cell Institute, Cambridge (MA),
2008. URL http://www.ncbi.nlm.nih.gov/books/NBK27068/.
[82] George K Michalopoulos, William C Bowen, Karen Mule, and Jianhua Luo. HGF-, EGF-, and
dexamethasone-induced gene expression patterns during formation of tissue in hepatic organoid
cultures. Gene expression, 11(2):55–75, 2003. ISSN 1052-2166.
[83] Kazuo Takayama, Mitsuru Inamura, Kenji Kawabata, Kazufumi Katayama, Maiko Higuchi, Kat-
suhisa Tashiro, Aki Nonaka, Fuminori Sakurai, Takao Hayakawa, Miho Kusuda Furue, and Hi-
royuki Mizuguchi. Efficient generation of functional hepatocytes from human embryonic stem
cells and induced pluripotent stem cells by HNF4a transduction. Molecular therapy: the journal
of the American Society of Gene Therapy, 20(1):127–137, January 2012. ISSN 1525-0024. doi:
10.1038/mt.2011.234.
[84] Karim Si-Tayeb, Fallon K Noto, Masato Nagaoka, Jixuan Li, Michele A Battle, Christine Duris,
Paula E North, Stephen Dalton, and Stephen A Duncan. Highly efficient generation of human
hepatocyte-like cells from induced pluripotent stem cells. Hepatology (Baltimore, Md.), 51(1):
297–305, January 2010. ISSN 1527-3350. doi: 10.1002/hep.23354. PMID: 19998274 PMCID:
PMC2946078.
[85] Zhihua Song, Jun Cai, Yanxia Liu, Dongxin Zhao, Jun Yong, Shuguang Duo, Xijun Song,
Yushan Guo, Yang Zhao, Han Qin, Xiaolei Yin, Chen Wu, Jie Che, Shichun Lu, Mingxiao Ding,
and Hongkui Deng. Efficient generation of hepatocyte-like cells from human induced pluripo-
tent stem cells. Cell research, 19(11):1233–1242, November 2009. ISSN 1748-7838. doi:
10.1038/cr.2009.107. PMID: 19736565.
[86] Philip Roelandt, Jolien Vanhove, and Catherine Verfaillie. Directed differentiation of pluripotent
stem cells to functional hepatocytes. Methods in molecular biology (Clifton, N.J.), 997:141–147,
2013. ISSN 1940-6029. doi: 10.1007/978-1-62703-348-0 11. PMID: 23546753.
77

[87] Aranzazu Sanchez. Growth factor- and cytokine-driven pathways governing liver stemness and
differentiation. World Journal of Gastroenterology, 16(41):5148, 2010. ISSN 1007-9327. doi:
10.3748/wjg.v16.i41.5148. URL http://www.wjgnet.com/1007-9327/full/v16/i41/5148.htm.
[88] Nelson Fausto. Liver regeneration and repair: Hepatocytes, progenitor cells, and stem cells.
Hepatology, 39(6):1477–1487, June 2004. ISSN 0270-9139, 1527-3350. doi: 10.1002/hep.20214.
URL http://doi.wiley.com/10.1002/hep.20214.
[89] Petra Krause, Farahnaz Saghatolislam, Sarah Koenig, Kirsten Unthan-Fechner, and Irmelin
Probst. Maintaining hepatocyte differentiation in vitro through co-culture with hepatic stellate cells.
In vitro cellular & developmental biology. Animal, 45(5-6):205–212, June 2009. ISSN 1543-706X.
doi: 10.1007/s11626-008-9166-1. PMID: 19184253.
[90] Irwin M. Arias, editor. The liver: biology and pathobiology. John Wiley & Sons, Chichester, West
Sussex, UK ; Hoboken, NJ, 5th ed edition, 2009. ISBN 9780470723135.
[91] R Fraser, B R Dobbs, and G W Rogers. Lipoproteins and the liver sieve: the role of the fenestrated
sinusoidal endothelium in lipoprotein metabolism, atherosclerosis, and cirrhosis. Hepatology (Bal-
timore, Md.), 21(3):863–874, March 1995. ISSN 0270-9139.
[92] Robert S McCuskey. Sinusoidal endothelial cells as an early target for hepatic toxicants. Clinical
hemorheology and microcirculation, 34(1-2):5–10, 2006. ISSN 1386-0291.
[93] D P Praaning-van Dalen, A M de Leeuw, A Brouwer, and D L Knook. Rat liver endothelial cells
have a greater capacity than kupffer cells to endocytose n-acetylglucosamine- and mannose-
terminated glycoproteins. Hepatology (Baltimore, Md.), 7(4):672–679, August 1987. ISSN 0270-
9139. PMID: 3301616.
[94] Tore Seternes, Karen Sørensen, and Bard Smedsrød. Scavenger endothelial cells of vertebrates:
a nonperipheral leukocyte system for high-capacity elimination of waste macromolecules. Pro-
ceedings of the National Academy of Sciences of the United States of America, 99(11):7594–
7597, May 2002. ISSN 0027-8424. doi: 10.1073/pnas.102173299. PMID: 12032328 PMCID:
PMC124295.
[95] B Smedsr?d, H Pertoft, S Gustafson, and T C Laurent. Scavenger functions of the liver endothelial
cell. Biochemical Journal, 266(2):313–327, March 1990. ISSN 0264-6021. URL http://www.
ncbi.nlm.nih.gov/pmc/articles/PMC1131134/. PMID: 2156492 PMCID: PMC1131134.
[96] Laurie D DeLeve, Xiangdong Wang, Liping Hu, Margaret K McCuskey, and Robert S McCuskey.
Rat liver sinusoidal endothelial cell phenotype is maintained by paracrine and autocrine regulation.
American journal of physiology. Gastrointestinal and liver physiology, 287(4):G757–763, October
2004. ISSN 0193-1857. doi: 10.1152/ajpgi.00017.2004. PMID: 15191879.
[97] D P Praaning-Van Dalen and D L Knook. Quantitative determination of in vivo endocytosis by rat
liver kupffer and endothelial cells facilitated by an improved cell isolation method. FEBS letters,
141(2):229–232, May 1982. ISSN 0014-5793. PMID: 7095151.
78

[98] Sandra March, Elliot E Hui, Gregory H Underhill, Salman Khetani, and Sangeeta N Bhatia. Mi-
croenvironmental regulation of the sinusoidal endothelial cell phenotype in vitro. Hepatology (Bal-
timore, Md.), 50(3):920–928, September 2009. ISSN 1527-3350. doi: 10.1002/hep.23085. PMID:
19585615 PMCID: PMC2890242.
[99] Vania M.M Braga. Cell–cell adhesion and signalling. Current Opinion in Cell Biology, 14(5):
546–556, October 2002. ISSN 09550674. doi: 10.1016/S0955-0674(02)00373-3. URL http:
//linkinghub.elsevier.com/retrieve/pii/S0955067402003733.
[100] Steven A Vokes and Paul A Krieg. Endoderm is required for vascular endothelial tube forma-
tion, but not for angioblast specification. Development (Cambridge, England), 129(3):775–785,
February 2002. ISSN 0950-1991.
[101] Thomas J. Poole and J. Douglas Coffin. Vasculogenesis and angiogenesis: Two distinct morpho-
genetic mechanisms establish embryonic vascular pattern. Journal of Experimental Zoology, 251
(2):224–231, August 1989. ISSN 0022-104X, 1097-010X. doi: 10.1002/jez.1402510210. URL
http://doi.wiley.com/10.1002/jez.1402510210.
[102] W Risau and I Flamme. Vasculogenesis. Annual review of cell and developmental biology, 11:
73–91, 1995. ISSN 1081-0706. doi: 10.1146/annurev.cb.11.110195.000445.
[103] Jeffrey M. Isner and Takayuki Asahara. Angiogenesis and vasculogenesis as therapeutic strate-
gies for postnatal neovascularization. Journal of Clinical Investigation, 103(9):1231–1236, May
1999. ISSN 0021-9738. doi: 10.1172/JCI6889. URL http://www.jci.org/articles/view/6889.
[104] Annette Schmidt, Klara Brixius, and Wilhelm Bloch. Endothelial precursor cell migration during
vasculogenesis. Circulation research, 101(2):125–136, July 2007. ISSN 1524-4571. doi: 10.
1161/CIRCRESAHA.107.148932.
[105] Wei-jun Su, Bao-yu Wang, Xiang-he Song, Li-na Wang, Yan-hua Liu, Man-qian Zhou, Ling-ling
Tong, and Zong-jin Li. [differentiation of human embryonic stem cells to endothelial cells via im-
proved three-dimension approach]. Zhongguo Yi Xue Ke Xue Yuan Xue Bao. Acta Academiae
Medicinae Sinicae, 34(6):539–544, December 2012. ISSN 1000-503X. doi: 10.3881/j.issn.
1000-503X.2012.06.001.
[106] D. Vittet, M. H. Prandini, R. Berthier, A. Schweitzer, H. Martin-Sisteron, G. Uzan, and E. Dejana.
Embryonic stem cells differentiate in vitro to endothelial cells through successive maturation steps.
Blood, 88(9):3424–3431, November 1996. ISSN 0006-4971.
[107] Gi Dae Kim, Gi Jin Kim, Ji Hyun Seok, Hyung-Min Chung, Kew-Mahn Chee, and Gyu-Seek Rhee.
Differentiation of endothelial cells derived from mouse embryoid bodies: a possible in vitro vas-
culogenesis model. Toxicology Letters, 180(3):166–173, August 2008. ISSN 0378-4274. doi:
10.1016/j.toxlet.2008.05.023.
[108] Xabier L Aranguren, Aernout Luttun, Carlos Clavel, Cristina Moreno, Gloria Abizanda, Miguel A
Barajas, Beatriz Pelacho, Maialen Uriz, Miriam Arana, Ana Echavarri, Mario Soriano, Enrique J
Andreu, Juana Merino, Jose Manuel Garcia-Verdugo, Catherine M Verfaillie, and Felipe Prosper.
79
In vitro and in vivo arterial differentiation of human multipotent adult progenitor cells. Blood, 109
(6):2634–2642, March 2007. ISSN 0006-4971. doi: 10.1182/blood-2006-06-030411.
[109] A Kaupisch, L Kennedy, V Stelmanis, B Tye, N M Kane, J C Mountford, A Courtney, and A H Baker.
Derivation of vascular endothelial cells from human embryonic stem cells under GMP-compliant
conditions: towards clinical studies in ischaemic disease. Journal of cardiovascular translational
research, 5(5):605–617, October 2012. ISSN 1937-5395. doi: 10.1007/s12265-012-9379-2.
[110] Alicia A Blancas, Albert J Shih, Nicholas E Lauer, and Kara E McCloskey. Endothelial cells from
embryonic stem cells in a chemically defined medium. Stem cells and development, 20(12):2153–
2161, December 2011. ISSN 1557-8534. doi: 10.1089/scd.2010.0432.
[111] Daylon James, Hyung-song Nam, Marco Seandel, Daniel Nolan, Tyler Janovitz, Mark Tomishima,
Lorenz Studer, Gabsang Lee, David Lyden, Robert Benezra, Nikica Zaninovic, Zev Rosenwaks,
Sina Y Rabbany, and Shahin Rafii. Expansion and maintenance of human embryonic stem cell-
derived endothelial cells by TGFbeta inhibition is id1 dependent. Nature biotechnology, 28(2):
161–166, February 2010. ISSN 1546-1696. doi: 10.1038/nbt.1605.
[112] Zack Z Wang, Patrick Au, Tong Chen, Ying Shao, Laurence M Daheron, Hao Bai, Melanie Arzigian,
Dai Fukumura, Rakesh K Jain, and David T Scadden. Endothelial cells derived from human
embryonic stem cells form durable blood vessels in vivo. Nature biotechnology, 25(3):317–318,
March 2007. ISSN 1087-0156. doi: 10.1038/nbt1287.
[113] Maxim A. Vodyanik and Igor I. Slukvin. Hematoendothelial differentiation of human embryonic
stem cells. Current Protocols in Cell Biology / Editorial Board, Juan S. Bonifacino ... [et Al.],
Chapter 23:Unit 23.6, September 2007. ISSN 1934-2616. doi: 10.1002/0471143030.cb2306s36.
[114] M Hirashima, H Kataoka, S Nishikawa, N Matsuyoshi, and S Nishikawa. Maturation of embryonic
stem cells into endothelial cells in an in vitro model of vasculogenesis. Blood, 93(4):1253–1263,
February 1999. ISSN 0006-4971.
[115] Nicole M Kane, Marco Meloni, Helen L Spencer, Margaret A Craig, Raimund Strehl, Graeme Milli-
gan, Miles D Houslay, Joanne C Mountford, Costanza Emanueli, and Andrew H Baker. Derivation
of endothelial cells from human embryonic stem cells by directed differentiation: analysis of mi-
croRNA and angiogenesis in vitro and in vivo. Arteriosclerosis, thrombosis, and vascular biology,
30(7):1389–1397, July 2010. ISSN 1524-4636. doi: 10.1161/ATVBAHA.110.204800.
[116] Orit Goldman, Olivier Feraud, Julie Boyer-Di Ponio, Catherine Driancourt, Denis Clay, Marie-
Caroline Le Bousse-Kerdiles, Annelise Bennaceur-Griscelli, and Georges Uzan. A boost of BMP4
accelerates the commitment of human embryonic stem cells to the endothelial lineage. Stem cells
(Dayton, Ohio), 27(8):1750–1759, August 2009. ISSN 1549-4918. doi: 10.1002/stem.100.
[117] Alex Le Bras, Preethi Vijayaraj, and Peter Oettgen. Molecular mechanisms of endothelial differ-
entiation. Vascular medicine (London, England), 15(4):321–331, August 2010. ISSN 1477-0377.
doi: 10.1177/1358863X10371685.
80

[118] Anne Richter, Lena Valdimarsdottir, Helga Eyja Hrafnkelsdottir, Johann Frimann Runarsson,
Arna Run Omarsdottir, Dorien Ward-van Oostwaard, Christine Mummery, and Gudrun Valdimars-
dottir. BMP4 promotes EMT and mesodermal commitment in human embryonic stem cells via
SLUG and MSX2. Stem Cells (Dayton, Ohio), 32(3):636–648, March 2014. ISSN 1549-4918. doi:
10.1002/stem.1592.
[119] Stefan Irion, Raedun L Clarke, Herve Luche, Injune Kim, Sean J Morrison, Hans-Joerg Fehling,
and Gordon M Keller. Temporal specification of blood progenitors from mouse embryonic stem
cells and induced pluripotent stem cells. Development (Cambridge, England), 137(17):2829–
2839, September 2010. ISSN 1477-9129. doi: 10.1242/dev.042119.
[120] Teng Fei, Shanshan Zhu, Kai Xia, Jianping Zhang, Zhongwei Li, Jing-Dong J Han, and Ye-Guang
Chen. Smad2 mediates activin/nodal signaling in mesendoderm differentiation of mouse embry-
onic stem cells. Cell Research, 20(12):1306–1318, December 2010. ISSN 1001-0602, 1748-7838.
doi: 10.1038/cr.2010.158. URL http://www.nature.com/doifinder/10.1038/cr.2010.158.
[121] Marilyn B Nourse, Daniel E Halpin, Marta Scatena, Derek J Mortisen, Nathaniel L Tulloch, Kip D
Hauch, Beverly Torok-Storb, Buddy D Ratner, Lil Pabon, and Charles E Murry. VEGF induces
differentiation of functional endothelium from human embryonic stem cells: implications for tissue
engineering. Arteriosclerosis, thrombosis, and vascular biology, 30(1):80–89, January 2010. ISSN
1524-4636. doi: 10.1161/ATVBAHA.109.194233.
[122] Masayuki Yoshida, Yuji Nishikawa, Yasufumi Omori, Toshiaki Yoshioka, Takuo Tokairin, Peter Mc-
Court, and Katsuhiko Enomoto. Involvement of signaling of VEGF and TGF-beta in differentiation
of sinusoidal endothelial cells during culture of fetal rat liver cells. Cell and tissue research, 329
(2):273–282, August 2007. ISSN 0302-766X. doi: 10.1007/s00441-007-0387-5.
[123] Leigh Coultas, Kallayanee Chawengsaksophak, and Janet Rossant. Endothelial cells and VEGF
in vascular development. Nature, 438(7070):937–945, December 2005. ISSN 1476-4687. doi:
10.1038/nature04479.
[124] F J Giles. The vascular endothelial growth factor (VEGF) signaling pathway: a therapeutic target in
patients with hematologic malignancies. The oncologist, 6 Suppl 5:32–39, 2001. ISSN 1083-7159.
[125] Ann Hoeben, Bart Landuyt, Martin S Highley, Hans Wildiers, Allan T Van Oosterom, and Ernst A
De Bruijn. Vascular endothelial growth factor and angiogenesis. Pharmacological reviews, 56(4):
549–580, December 2004. ISSN 0031-6997. doi: 10.1124/pr.56.4.3.
[126] M. J. Goumans and C. Mummery. Functional analysis of the TGFbeta receptor/smad pathway
through gene ablation in mice. The International Journal of Developmental Biology, 44(3):253–
265, April 2000. ISSN 0214-6282.
[127] Ondine Cleaver and Douglas A Melton. Endothelial signaling during development. Nature
medicine, 9(6):661–668, June 2003. ISSN 1078-8956. doi: 10.1038/nm0603-661.
[128] Franck Lebrin, Martine Deckers, Philippe Bertolino, and Peter Ten Dijke. TGF-beta receptor func-
tion in the endothelium. Cardiovascular research, 65(3):599–608, February 2005. ISSN 0008-
6363. doi: 10.1016/j.cardiores.2004.10.036.
81

[129] R. Derynck and X. H. Feng. TGF-beta receptor signaling. Biochimica Et Biophysica Acta, 1333
(2):F105–150, October 1997. ISSN 0006-3002.
[130] Laurens A van Meeteren and Peter ten Dijke. Regulation of endothelial cell plasticity by TGF-
b. Cell and tissue research, 347(1):177–186, January 2012. ISSN 1432-0878. doi: 10.1007/
s00441-011-1222-6.
[131] Peter ten Dijke and Caroline S Hill. New insights into TGF-beta-Smad signalling. Trends in bio-
chemical sciences, 29(5):265–273, May 2004. ISSN 0968-0004. doi: 10.1016/j.tibs.2004.03.008.
[132] Xiaofang Xu, Victoria L. Browning, and Jon S. Odorico. Activin, BMP and FGF pathways cooperate
to promote endoderm and pancreatic lineage cell differentiation from human embryonic stem cells.
Mechanisms of Development, 128(7-10):412–427, December 2011. ISSN 1872-6356. doi: 10.
1016/j.mod.2011.08.001.
[133] Kevin A. D’Amour, Alan D. Agulnick, Susan Eliazer, Olivia G. Kelly, Evert Kroon, and Emmanuel E.
Baetge. Efficient differentiation of human embryonic stem cells to definitive endoderm. Nature
Biotechnology, 23(12):1534–1541, December 2005. ISSN 1087-0156. doi: 10.1038/nbt1163.
[134] P. Zhang, J. Li, Z. Tan, C. Wang, T. Liu, L. Chen, J. Yong, W. Jiang, X. Sun, L. Du, M. Ding,
and H. Deng. Short-term BMP-4 treatment initiates mesoderm induction in human embry-
onic stem cells. Blood, 111(4):1933–1941, February 2008. ISSN 0006-4971, 1528-0020.
doi: 10.1182/blood-2007-02-074120. URL http://www.bloodjournal.org/cgi/doi/10.1182/
blood-2007-02-074120.
[135] Russell B. Fletcher and Richard M. Harland. The role of FGF signaling in the establishment and
maintenance of mesodermal gene expression in xenopus. Developmental Dynamics: An Official
Publication of the American Association of Anatomists, 237(5):1243–1254, May 2008. ISSN 1058-
8388. doi: 10.1002/dvdy.21517.
[136] E. Amaya, P. A. Stein, T. J. Musci, and M. W. Kirschner. FGF signalling in the early specification of
mesoderm in xenopus. Development (Cambridge, England), 118(2):477–487, June 1993. ISSN
0950-1991.
[137] M J Karkkainen and T V Petrova. Vascular endothelial growth factor receptors in the regulation
of angiogenesis and lymphangiogenesis. Oncogene, 19(49):5598–5605, November 2000. ISSN
0950-9232. doi: 10.1038/sj.onc.1203855.
[138] Takuma Arai, Takayuki Sakurai, Akiko Kamiyoshi, Yuka Ichikawa-Shindo, Nobuyoshi Iinuma, Ya-
suhiro Iesato, Teruhide Koyama, Takahiro Yoshizawa, Ryuichi Uetake, Akihiro Yamauchi, Lei Yang,
Hisaka Kawate, Shinichiro Ogawa, Akira Kobayashi, Shinichi Miyagawa, and Takayuki Shindo. In-
duction of LYVE-1/stabilin-2-positive liver sinusoidal endothelial-like cells from embryoid bodies by
modulation of adrenomedullin-RAMP2 signaling. Peptides, 32(9):1855–1865, September 2011.
ISSN 1873-5169. doi: 10.1016/j.peptides.2011.07.005.
[139] Nobuyoshi Iinuma, Takayuki Sakurai, Akiko Kamiyoshi, Yuka Ichikawa-Shindo, Takuma Arai,
Takahiro Yoshizawa, Teruhide Koyama, Ryuichi Uetake, Hisaka Kawate, Shin-Ichi Muto, Yoh-Ichi
82
Tagawa, Shinichi Miyagawa, and Takayuki Shindo. Adrenomedullin in sinusoidal endothelial cells
play protective roles against cold injury of liver. Peptides, 31(5):865–871, May 2010. ISSN 1873-
5169. doi: 10.1016/j.peptides.2010.01.011.
[140] Samantha Fernandez-Sauze, Christine Delfino, Kamel Mabrouk, Christophe Dussert, Olivier
Chinot, Pierre-Marie Martin, Francois Grisoli, L’Houcine Ouafik, and Francoise Boudouresque.
Effects of adrenomedullin on endothelial cells in the multistep process of angiogenesis: involve-
ment of CRLR/RAMP2 and CRLR/RAMP3 receptors. International journal of cancer. Journal
international du cancer, 108(6):797–804, March 2004. ISSN 0020-7136. doi: 10.1002/ijc.11663.
[141] Samara M. Ali and Sarmad MH Mohammed. Adrenomedullin as a novel promising
therapeutic approach. International Journal of Science and Technology, 2(10), 2013.
URL http://www.journalofsciences-technology.org/archive/2013/october_vol_2_no_10/
75227137874439.pdf.
[142] S. Masui. An efficient system to establish multiple embryonic stem cell lines carrying an inducible
expression unit. Nucleic Acids Research, 33(4):e43–e43, February 2005. ISSN 1362-4962. doi:
10.1093/nar/gni043. URL http://nar.oxfordjournals.org/lookup/doi/10.1093/nar/gni043.
[143] M. Gossen and H. Bujard. Tight control of gene expression in mammalian cells by tetracycline-
responsive promoters. Proceedings of the National Academy of Sciences of the United States of
America, 89(12):5547–5551, June 1992. ISSN 0027-8424.
[144] I Barde, M Zantaboussif, S Paisant, M Leboeuf, P Rameau, C Delenda, and O Danos. Efficient
control of gene expression in the hematopoietic system using a single tet-on inducible lentiviral
vector. Molecular Therapy, 13(2):382–390, February 2006. ISSN 15250016. doi: 10.1016/j.ymthe.
2005.09.012. URL http://www.nature.com/doifinder/10.1016/j.ymthe.2005.09.012.
[145] Y G Kim, J Cha, and S Chandrasegaran. Hybrid restriction enzymes: zinc finger fusions to fok
i cleavage domain. Proceedings of the National Academy of Sciences of the United States of
America, 93(3):1156–1160, February 1996. ISSN 0027-8424.
[146] Jeffry D Sander, Elizabeth J Dahlborg, Mathew J Goodwin, Lindsay Cade, Feng Zhang, Daniel
Cifuentes, Shaun J Curtin, Jessica S Blackburn, Stacey Thibodeau-Beganny, Yiping Qi, Christo-
pher J Pierick, Ellen Hoffman, Morgan L Maeder, Cyd Khayter, Deepak Reyon, Drena Dobbs,
David M Langenau, Robert M Stupar, Antonio J Giraldez, Daniel F Voytas, Randall T Peter-
son, Jing-Ruey J Yeh, and J Keith Joung. Selection-free zinc-finger-nuclease engineering by
context-dependent assembly (CoDA). Nature Methods, 8(1):67–69, January 2011. ISSN 1548-
7091, 1548-7105. doi: 10.1038/nmeth.1542. URL http://www.nature.com/doifinder/10.
1038/nmeth.1542.
[147] Fyodor D. Urnov, Jeffrey C. Miller, Ya-Li Lee, Christian M. Beausejour, Jeremy M. Rock, Sheldon
Augustus, Andrew C. Jamieson, Matthew H. Porteus, Philip D. Gregory, and Michael C. Holmes.
Highly efficient endogenous human gene correction using designed zinc-finger nucleases. Nature,
435(7042):646–651, June 2005. ISSN 0028-0836, 1476-4679. doi: 10.1038/nature03556. URL
http://www.nature.com/doifinder/10.1038/nature03556.
83

[148] Jeffrey C Miller, Michael C Holmes, Jianbin Wang, Dmitry Y Guschin, Ya-Li Lee, Igor Rupniewski,
Christian M Beausejour, Adam J Waite, Nathaniel S Wang, Kenneth A Kim, Philip D Gregory,
Carl O Pabo, and Edward J Rebar. An improved zinc-finger nuclease architecture for highly spe-
cific genome editing. Nature Biotechnology, 25(7):778–785, July 2007. ISSN 1087-0156. doi:
10.1038/nbt1319. URL http://www.nature.com/doifinder/10.1038/nbt1319.
[149] Toni Cathomen and J Keith Joung. Zinc-finger nucleases: the next generation emerges. Molecular
therapy: the journal of the American Society of Gene Therapy, 16(7):1200–1207, July 2008. ISSN
1525-0024. doi: 10.1038/mt.2008.114.
[150] J Bitinaite, D A Wah, A K Aggarwal, and I Schildkraut. FokI dimerization is required for DNA
cleavage. Proceedings of the National Academy of Sciences of the United States of America, 95
(18):10570–10575, September 1998. ISSN 0027-8424.
[151] Genome-TALERTM human AAVS1 safe harbor knock-in kits and clones | genecopoeia. URL http:
//www.genecopoeia.com/product/aavs1-safe-harbor/.
[152] R M Hall and C M Collis. Mobile gene cassettes and integrons: capture and spread of genes
by site-specific recombination. Molecular microbiology, 15(4):593–600, February 1995. ISSN
0950-382X.
[153] Carol J.E. Schwartz and Paul D. Sadowski. FLP recombinase of the 2 um circle plasmid of
saccharomyces cerevisiae bends its DNA target. Journal of Molecular Biology, 205(4):647–
658, February 1989. ISSN 00222836. doi: 10.1016/0022-2836(89)90310-0. URL http:
//linkinghub.elsevier.com/retrieve/pii/0022283689903100.
[154] U Baron and H Bujard. Tet repressor-based system for regulated gene expression in eukaryotic
cells: principles and advances. Methods in enzymology, 327:401–421, 2000. ISSN 0076-6879.
[155] Zhou Zhu, Tao Zheng, Chun G Lee, Robert J Homer, and Jack A Elias. Tetracycline-controlled
transcriptional regulation systems: advances and application in transgenic animal modeling. Sem-
inars in cell & developmental biology, 13(2):121–128, April 2002. ISSN 1084-9521.
[156] X. Lian, C. Hsiao, G. Wilson, K. Zhu, L. B. Hazeltine, S. M. Azarin, K. K. Raval, J. Zhang, T. J.
Kamp, and S. P. Palecek. Cozzarelli prize winner: Robust cardiomyocyte differentiation from hu-
man pluripotent stem cells via temporal modulation of canonical wnt signaling. Proceedings of
the National Academy of Sciences, 109(27):E1848–E1857, July 2012. ISSN 0027-8424, 1091-
6490. doi: 10.1073/pnas.1200250109. URL http://www.pnas.org/cgi/doi/10.1073/pnas.
1200250109.
[157] Masami Harimoto, Masayuki Yamato, Motohiro Hirose, Chie Takahashi, Yuki Isoi, Akihiko Kikuchi,
and Teruo Okano. Novel approach for achieving double-layered cell sheets co-culture: overlay-
ing endothelial cell sheets onto monolayer hepatocytes utilizing temperature-responsive culture
dishes. Journal of Biomedical Materials Research, 62(3):464–470, December 2002. ISSN 0021-
9304. doi: 10.1002/jbm.10228.
84

[158] Global status report on noncommunicable diseases 2010 description of the global burden
of NCDs, their risk factors and determinants, April 2011. URL http://www.who.int/nmh/
publications/ncd_report2010/en/.
[159] J. A. Fishman, G. B. Ryan, and M. J. Karnovsky. Endothelial regeneration in the rat carotid
artery and the significance of endothelial denudation in the pathogenesis of myointimal thickening.
Laboratory Investigation; a Journal of Technical Methods and Pathology, 32(3):339–351, March
1975. ISSN 0023-6837.
[160] H. Cai and D. G. Harrison. Endothelial dysfunction in cardiovascular diseases: The role of ox-
idant stress. Circulation Research, 87(10):840–844, November 2000. ISSN 0009-7330, 1524-
4571. doi: 10.1161/01.RES.87.10.840. URL http://circres.ahajournals.org/cgi/doi/10.
1161/01.RES.87.10.840.
[161] Nadine A. Dalrymple and Erich R. Mackow. Roles for endothelial cells in dengue virus infection.
Advances in Virology, 2012:1–8, 2012. ISSN 1687-8639, 1687-8647. doi: 10.1155/2012/840654.
URL http://www.hindawi.com/journals/av/2012/840654/.
[162] Allen S. Bulick, Dany J. Munoz-Pinto, Xin Qu, Mousami Mani, Deissy Cristancho, Matthew Urban,
and Mariah S. Hahn. Impact of endothelial cells and mechanical conditioning on smooth muscle
cell extracellular matrix production and differentiation. Tissue Engineering. Part A, 15(4):815–825,
April 2009. ISSN 1937-3341. doi: 10.1089/ten.tea.2008.0179.
[163] Z. Liu, K. Kobayashi, M. van Dinther, S. H. van Heiningen, G. Valdimarsdottir, T. van Laar,
M. Scharpfenecker, C. W. G. M. Lowik, M.-J. Goumans, P. t. Dijke, and E. Pardali. VEGF and
inhibitors of TGF type-i receptor kinase synergistically promote blood-vessel formation by induc-
ing 5-integrin expression. Journal of Cell Science, 122(18):3294–3302, September 2009. ISSN
0021-9533, 1477-9137. doi: 10.1242/jcs.048942. URL http://jcs.biologists.org/cgi/doi/
10.1242/jcs.048942.
85

86
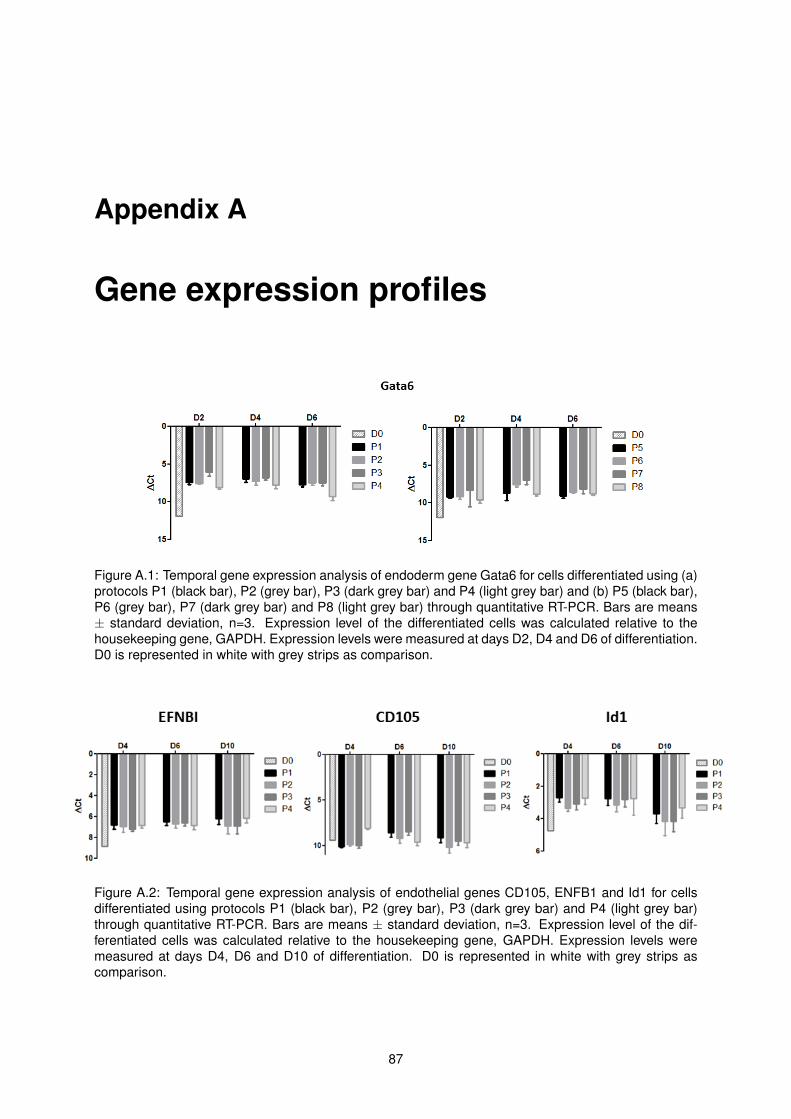
Appendix A
Gene expression profiles
Figure A.1: Temporal gene expression analysis of endoderm gene Gata6 for cells differentiated using (a)protocols P1 (black bar), P2 (grey bar), P3 (dark grey bar) and P4 (light grey bar) and (b) P5 (black bar),P6 (grey bar), P7 (dark grey bar) and P8 (light grey bar) through quantitative RT-PCR. Bars are means± standard deviation, n=3. Expression level of the differentiated cells was calculated relative to thehousekeeping gene, GAPDH. Expression levels were measured at days D2, D4 and D6 of differentiation.D0 is represented in white with grey strips as comparison.
Figure A.2: Temporal gene expression analysis of endothelial genes CD105, ENFB1 and Id1 for cellsdifferentiated using protocols P1 (black bar), P2 (grey bar), P3 (dark grey bar) and P4 (light grey bar)through quantitative RT-PCR. Bars are means ± standard deviation, n=3. Expression level of the dif-ferentiated cells was calculated relative to the housekeeping gene, GAPDH. Expression levels weremeasured at days D4, D6 and D10 of differentiation. D0 is represented in white with grey strips ascomparison.
87

Figure A.3: Temporal gene expression analysis of endothelial genes CD105, ENFB1 and Id1 for cellsdifferentiated using protocols P5 (black bar), P6 (grey bar), P7 (dark grey bar) and P8 (light grey bar)through quantitative RT-PCR. Bars are means ± standard deviation, n=3. Expression level of the dif-ferentiated cells was calculated relative to the housekeeping gene, GAPDH. Expression levels weremeasured at days D4, D6 and D10 of differentiation. D0 is represented in white with grey strips ascomparison.
Figure A.4: Temporal gene expression analysis of pluripotency genes Oct4 and Nanog for cells differen-tiated using protocols P9 (black bar), P10 (grey bar), P11 (dark grey bar) and P12 (light grey bar) throughquantitative RT-PCR. Bars are means ± standard deviation, n=3. Expression level of the differentiatedcells was calculated relative to the housekeeping gene, GAPDH. Expression levels were measured atdays D2, D4, D6 and D10 of differentiation. D0 is represented in white with grey strips as comparison.
Figure A.5: Temporal gene expression analysis of endothelial genes CD105, ENFB1 and Id1 for cellsdifferentiated using protocols P9 (black bar), P10 (grey bar), P11 (dark grey bar) and P12 (light greybar) through quantitative RT-PCR. Bars are means ± standard deviation, n=3. Expression level of thedifferentiated cells was calculated relative to the housekeeping gene, GAPDH. Expression levels weremeasured at days D4, D6 and D10 of differentiation. D0 is represented in white with grey strips ascomparison.
88
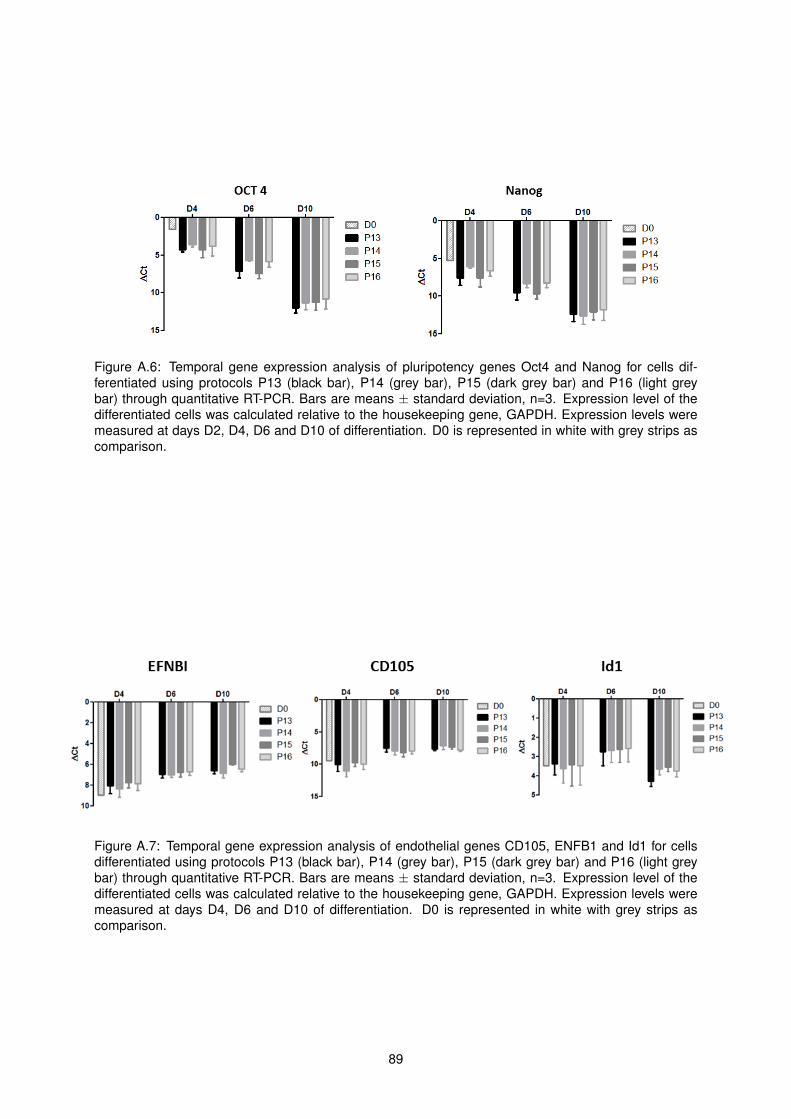
Figure A.6: Temporal gene expression analysis of pluripotency genes Oct4 and Nanog for cells dif-ferentiated using protocols P13 (black bar), P14 (grey bar), P15 (dark grey bar) and P16 (light greybar) through quantitative RT-PCR. Bars are means ± standard deviation, n=3. Expression level of thedifferentiated cells was calculated relative to the housekeeping gene, GAPDH. Expression levels weremeasured at days D2, D4, D6 and D10 of differentiation. D0 is represented in white with grey strips ascomparison.
Figure A.7: Temporal gene expression analysis of endothelial genes CD105, ENFB1 and Id1 for cellsdifferentiated using protocols P13 (black bar), P14 (grey bar), P15 (dark grey bar) and P16 (light greybar) through quantitative RT-PCR. Bars are means ± standard deviation, n=3. Expression level of thedifferentiated cells was calculated relative to the housekeeping gene, GAPDH. Expression levels weremeasured at days D4, D6 and D10 of differentiation. D0 is represented in white with grey strips ascomparison.
89

Appendix B
Flow cytometry plots
Figure B.1: Flow cytometry plots of the of the (a) bare population and (b) KDR, (c) PDGFR-α and (d)PDGRF-β controls and isotypes ((e) KDR and (f) PDGFR), at day 4. Bare cell population is used asnegative control for compensating and gating when setting up the flow cytometer alignment, eliminatingcell autofluorescence. Specific controls were used as positive control to outline the positive population.Isotype controls are negative control that allow the elimination of the signal caused by unspecific an-tibody binding. These help differentiating non-specific background signal from specific antibody signalbecause they have no relevant specificity to a target antigen.
90

91

Figure B.2: Flow cytometric isolation of KDR, PDGFR-α and PDGFR-β expressing cells differentiatedwith P13, P14, P15 and P16 at day 4. KDR-expressing cells: (a) P13, (b) P14, (c) P15 and (d) P16.PDGFR-α-expressing cells: (e) P13, (f) P14, (g) P15 and (h) P16. PDGFR-β-expressing cells: (i) P13,(j) P14, (k) P15 and (l) P16. In the flow cytometry information positive populations are named P2. Cellswere digested with trypsin. N=1. P2 is defined based on specific controls and isotype samples (seeFigure B.1).
92

Figure B.3: Flow cytometry plots of the of the (a) bare population, (b) KDR, (c) PDGFR-α (d) andPDGRF-β controls and isotypes ((e) KDR and (f)PDGFR), at day 6. Bare cell population is used asnegative control for compensating and gating when setting up the flow cytometer alignment, eliminatingcell autofluorescence. Specific controls were used as positive control to outline the positive population.Isotype controls are negative control that allow the elimination of the signal caused by unspecific an-tibody binding. These help differentiating non-specific background signal from specific antibody signalbecause they have no relevant specificity to a target antigen.
93

94

Figure B.4: Flow cytometric isolation of KDR, PDGFR-α and PDGFR-β expressing cells differentiatedwith P13, P14, P15 and P16 at day 6. KDR-expressing cells: (a) P13, (b) P14, (c) P15 and (d) P16.PDGFR-α-expressing cells: (e) P13, (f) P14, (g) P15 and (h) P16. PDGFR-β-expressing cells: (i) P13,(j) P14, (k) P15 and (l) P16. In the flow cytometry information positive populations are named P2. Cellswere digested with trypsin. N=1. P2 is defined based specific controls and isotype samples (see FigureB.3).
95

Appendix C
Significancy tests for P14 and P15
P1 P14 P15
PDGFR-α7.677 4.248 4.4207.787 6.555 5.6706.256 6.591 5.113
KDR5.626 2.969 3.6886.806 4.794 4.2564.326 4.638 4.131
CD316.699 3.724 5.2487.745 5.827 5.7825.563 4.027 3.164
VE Cadh6.558 4.255 5.2397.757 6.008 5.7135.181 5.122 4.957
Table C.1: Values of ∆CT for protocols P1, P14 and P15 for PDGFR-α, KDR, CD31 and VE Cadheringenes, n=3.
96

Figure C.1: Significancy T-test for PDGFR-α gene between protocols P1 and P14, and P1 and P15.T-test assuming unequal variances, for n=3. P(T¡=t) one-tail is significant if the value is lower than 0.5.Testes were done using Microsoft Officer Excelr. Original ∆CT values presented in Table C.1.
Figure C.2: Significancy T-test for KDR gene between protocols P1 and P14, and P1 and P15. T-testassuming unequal variances, for n=3. P(T¡=t) one-tail is significant if the value is lower than 0.5. Testeswere done using Microsoft Officer Excelr. Original ∆CT values presented in Table C.1.
97

Figure C.3: Significancy T-test for CD31 gene between protocols P1 and P14, and P1 and P15. T-testassuming unequal variances, for n=3. P(T¡=t) one-tail is significant if the value is lower than 0.5. Testeswere done using Microsoft Officer Excelr. Original ∆CT values presented in Table C.1.
98

Figure C.4: Significancy T-test for VE Cadherin gene between protocols P1 and P14, and P1 and P15.T-test assuming unequal variances, for n=3. P(T¡=t) one-tail is significant if the value is lower than 0.5.Testes were done using Microsoft Officer Excelr. Original ∆CT values presented in Table C.1.
99

Appendix D
Vector selection from agarose gel
electrophoresis
Figure D.1: Agarose gel electrophoresis of the digested Vector containig (a) the P2A1 and P2A2, (b)theP2As and TF3 genes and (c) the P2As, TF3 and TF1 genes. In (a), the Vector was digested with HpaIand Mlu I to take in TF3. In (b), the Vector was digested with Afl II and Eco RV to take in TF1. In (c), theVector was digested in two steps with Age I and Cla I to take in TF2. After digestion, the product was ranin a agarose gel for selection of the Vector band and elimination of the digested piece from the mixture.The correct band was extracted and gel purified. 1kb ladder was used. Gels are 1% of Agarose.
100