generations in the workplace - human resourcesgenerations in the workplace fy2012 page 4 the four...
TRANSCRIPT
Staff Workforce Analytics and Trends Report Series
GENERATIONS IN
THE WORKPLACE
Fiscal Year 2012
Produced by Texas A&M University, Human Resources, November 2012
Staff Workforce Analytics and Trends November 1, 2012 Generations in the Workplace FY2012 Page 2
Contents
Executive Summary .......................................................................................................................................... 3 University Staff Workforce............................................................................................................................... 5 Generations Analytics and Analyses Overview of Generations in the Workplace ..............................................................................................6
Generations by EEO Job Category ............................................................................................................ 7
Generations by MSO Code ....................................................................................................................... 8
Generations by Minority/Non-Minority ..................................................................................................9 Generations by Gender ............................................................................................................................ 10 Generations by Education Level ............................................................................................................. 11 Generations by Years of Service .............................................................................................................. 12
Appendix 1: Overview, Scope and Methodology ........................................................................................... 13 Appendix 2: Headcount by EEO Job Category and Executive Level FY2010 – FY2012 ........................... 14 Appendix 3: Detailed Data for Analytics and Analyses by Executive Level:
Item 1: Number of Employees in Generational Groups by Executive Level FY2010 – FY2012 ......... 15 Item 2: Number of Employees in Generational Groups by EEO Job Category – FY2012 .................. 16 Item 3: Number of Employees in Generational Groups by MSO Code – FY2012 ............................... 17 Item 4 A: Number of Employees in Generational Groups by Minority/Non-Minority – FY2012 ...... 18 Item 5 B: Number of Employees in Generational Groups by Gender – FY2012 ................................. 19 Item 6: Number of Employees in Generational Groups by Educational Level – FY2012 .................. 20 Item 7: Number of Employees in Generational Groups by Years of Service – FY2012 ....................... 21
Staff Workforce Analytics and Trends November 1, 2012 Generations in the Workplace FY2012 Page 3
Executive Summary
Introduction The health of an organization depends in large part on the recruitment, retention and leadership of its single most-valuable resource: its employees. To that effort, the Staff Workforce and Analytics Trends report series is designed to put informative data and analyses into the hands of Texas A&M University management. Eight periodic reports provide human resource-related information on budgeted staff employees and include relevant metrics, trends and commentary. Information in this Generations in the Workplace report focuses on the multigenerational workforce at Texas A&M University and the recent trends that impact them. Texas A&M University is one of the largest state employers in the Brazos and surrounding counties, particularly so when considering the totality of employees within its structure. The focus of this report is on those employees considered to be budgeted staff employees; however, the university also employs thousands of faculty, student workers, graduate assistants and even seasonal employees, which are not included in this report. Generations in the Workplace Report 2012 The workforce at Texas A&M University now encompasses four generations. While once largely segregated in the workplace by age and position, employees of all generations are now working more closely together. It is important to keep in mind that each generation tends to see the world through a unique lens that developed from major events that took place during the formative years when the individuals matured from children into adults. Therefore, when each generation joins the workforce, the organizational dynamics change as the generational values and opinions affect the way employees function and interact. A study of the generational trends in the United States suggests that organizations can no longer assume that traditional job features such as competitive pay, benefits and a retirement plan will suffice in attracting, recruiting and retaining top talent. Thus, Texas A&M University will need to adopt new or modified approaches and structures to manage the evolving workforce. A “generation” is defined as a group of people segmented by age boundaries – those who were born during a certain era. Their values and attitudes, particularly about work-related topics, tend to be similar based on their shared experiences during their formative years. Following are the four generations defined in this report.
Mature/Silent Generation - born before 01/1946 Baby Boomers - born from 01/1946 through 12/1964 Generation X - born from 01/1965 through 12/1980 Generation Y/Millenials - born from 01/1981 through 12/1999
A detailed look at the distinctive attributes that generally define and demarcate the generations is available on the HR Employee & Organizational Development website: http://EODinfo.tamu.edu/Generations. It bears noting that this study of generational characteristics applies primarily to individuals who were raised in the United States. While certainly not meant to be all encompassing, the information is provided to give a general understanding of the values and traits that are commonly associated with a large portion of the workforce.
Texas A&M University has 170
departments and units with 5,900
budgeted staff employees, and
2,700 faculty supporting the core
teaching, research and service
mission of the university.
Staff Workforce Analytics and Trends November 1, 2012 Generations in the Workplace FY2012 Page 4
The four generations in the U.S. workforce today differ in their expectations, assumptions, priorities, and approaches to work and communication, as each generation brings distinct sets of values, attitudes and behaviors to the workplace. Ignoring these differences can create a source of misunderstanding and conflict. However, when appropriately managed, the generational distinctions can create opportunities for collaboration and synergy, giving Texas A&M University a competitive edge. A comprehensive understanding of the four generations that comprise the Texas A&M workforce would increase employee and workgroup effectiveness, thus enhancing the overall performance of Texas A&M University as an organization. Additionally, organizations that invest in understanding the needs and desires of their employees enjoy a more motivated and engaged workforce that fosters increased retention, higher job satisfaction and morale, and greater productivity. This report discusses the significant demographic shift as Baby Boomers begin to retire and the subsequent impact this will have on the Texas A&M University workforce. The two successive younger generations, X and Y, are integrating into the workforce at a fast pace. With Generation X being proportionately smaller, the Baby Boomers, which have long been a dominant part of the workforce, will cede the majority of the workforce in the coming years to Generation Y. Overall Observations The generational data reflect the socioeconomic realities locally and nationally over the past several years and the natural reduction due to retirement, with an overall decline in Mature/Silent and Baby Boomer generational employee headcount. Between FY2010 to FY2012, there was a net reduction of 309 budgeted staff employees from the Mature/Silent and Baby Boomer generation, and a decline of 136 employees from Generation X. (This takes into account the reduction-in-force of 244 budgeted staff employees, or roughly 4% of the staff workforce, the majority of which occurred between FY2010 and FY2011.) On the other hand, during this same period, Generation Y showed an increase of 201 employees. While the oldest members of the Baby Boomer generation are just now reaching traditional retirement age, Generation Y is the fastest growing generational cohort. For Texas A&M University to continue to secure its competitive edge, it will need to understand and appeal to the perspectives, communication styles, and work ethics of the younger generations in order to recruit and retain them. Report Content This report’s primary emphasis is to display the trends regarding the multigenerational budgeted staff employees at Texas A&M University. Information is first presented about the university’s staff workforce from FY2010 through FY2012, which is provided as a referent point from which to view data specific to this report. There are six sets of data included in the Analytics and Analyses portion of the report as follows: Overview of Generations in the Workplace; Generations by EEO Job Category; Generations by MSO Code; Generations by Minority/Non-Minority; Generations by Gender; Generations by Education Level; and Generations by Years of Service. Following the Analytics and Analyses are appendices: Appendix 1 describes the data sources and scope; Appendix 2 provides a snapshot for the university staff workforce at FY2012; and Appendix 3 provides detailed data of generations by executive level.
Staff Workforce Analytics and Trends November 1, 2012 Generations in the Workplace FY2012 Page 5
6104
5949
5860
5700
5750
5800
5850
5900
5950
6000
6050
6100
6150
2010 2011 2012
# Em
plo
yee
s
Fiscal Year
Headcount Trend
Exec9.4%
Prof48.4%
Sec Cler13.6%
Tech Para6.1%
Skilled6.3%
Service16.2%
Employee EEO Job Category - FY2012
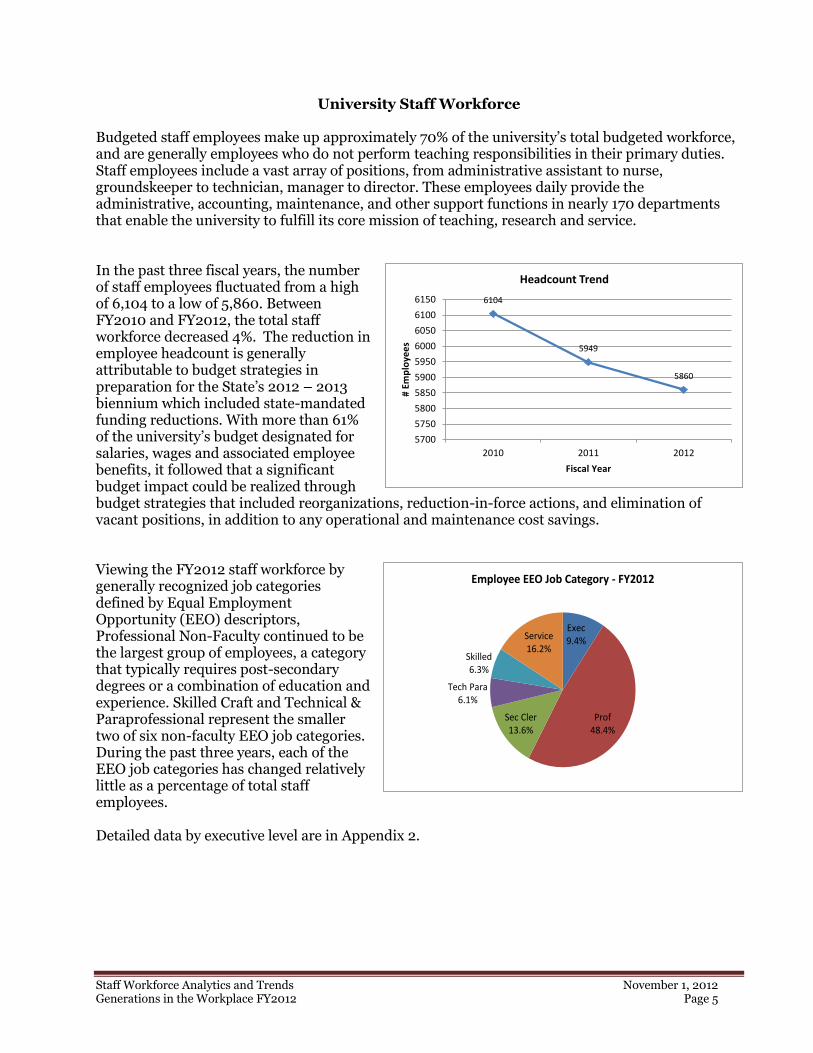
University Staff Workforce Budgeted staff employees make up approximately 70% of the university’s total budgeted workforce, and are generally employees who do not perform teaching responsibilities in their primary duties. Staff employees include a vast array of positions, from administrative assistant to nurse, groundskeeper to technician, manager to director. These employees daily provide the administrative, accounting, maintenance, and other support functions in nearly 170 departments that enable the university to fulfill its core mission of teaching, research and service. In the past three fiscal years, the number of staff employees fluctuated from a high of 6,104 to a low of 5,860. Between FY2010 and FY2012, the total staff workforce decreased 4%. The reduction in employee headcount is generally attributable to budget strategies in preparation for the State’s 2012 – 2013 biennium which included state-mandated funding reductions. With more than 61% of the university’s budget designated for salaries, wages and associated employee benefits, it followed that a significant budget impact could be realized through budget strategies that included reorganizations, reduction-in-force actions, and elimination of vacant positions, in addition to any operational and maintenance cost savings. Viewing the FY2012 staff workforce by generally recognized job categories defined by Equal Employment Opportunity (EEO) descriptors, Professional Non-Faculty continued to be the largest group of employees, a category that typically requires post-secondary degrees or a combination of education and experience. Skilled Craft and Technical & Paraprofessional represent the smaller two of six non-faculty EEO job categories. During the past three years, each of the EEO job categories has changed relatively little as a percentage of total staff employees. Detailed data by executive level are in Appendix 2.
Staff Workforce Analytics and Trends November 1, 2012 Generations in the Workplace FY2012 Page 6
204 154 126
26962572
24652390 2342 2254
814 8811015
0
500
1000
1500
2000
2500
3000
2010 2011 2012
# Em
plo
yee
s
Fiscal Year
Employees by Generations
Mature / Silent Baby Boomer Gen X Gen Y
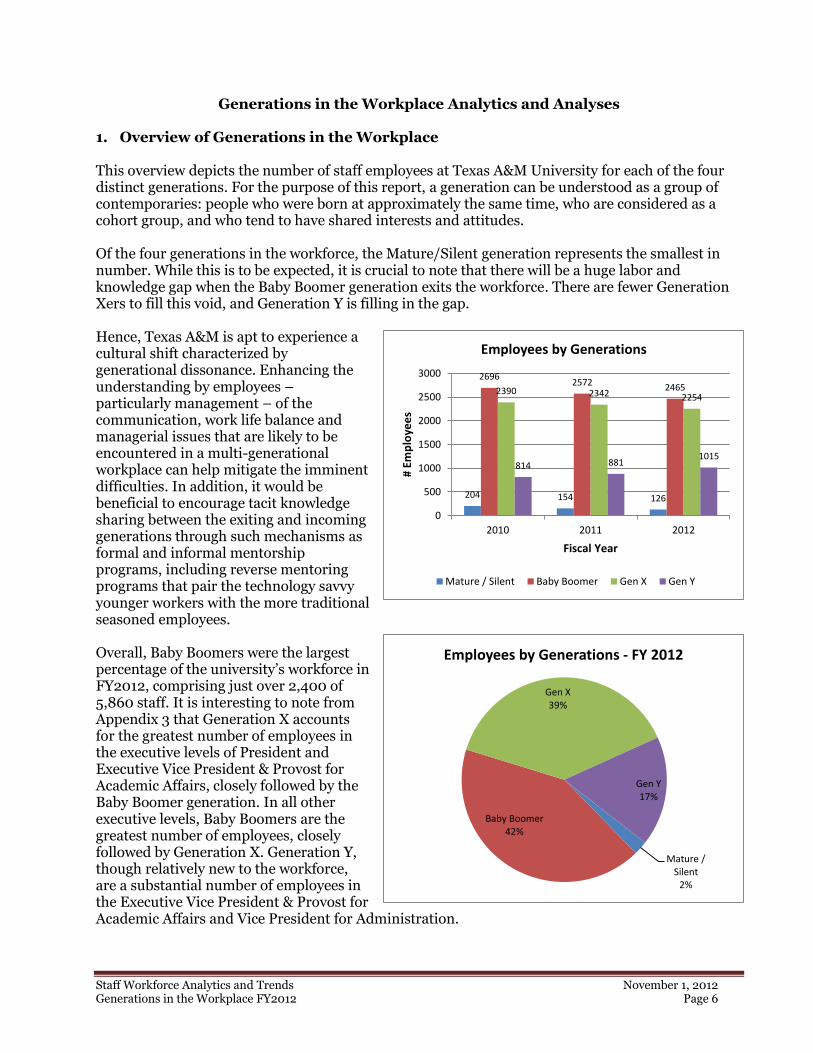
Generations in the Workplace Analytics and Analyses 1. Overview of Generations in the Workplace This overview depicts the number of staff employees at Texas A&M University for each of the four distinct generations. For the purpose of this report, a generation can be understood as a group of contemporaries: people who were born at approximately the same time, who are considered as a cohort group, and who tend to have shared interests and attitudes. Of the four generations in the workforce, the Mature/Silent generation represents the smallest in number. While this is to be expected, it is crucial to note that there will be a huge labor and knowledge gap when the Baby Boomer generation exits the workforce. There are fewer Generation Xers to fill this void, and Generation Y is filling in the gap. Hence, Texas A&M is apt to experience a cultural shift characterized by generational dissonance. Enhancing the understanding by employees – particularly management – of the communication, work life balance and managerial issues that are likely to be encountered in a multi-generational workplace can help mitigate the imminent difficulties. In addition, it would be beneficial to encourage tacit knowledge sharing between the exiting and incoming generations through such mechanisms as formal and informal mentorship programs, including reverse mentoring programs that pair the technology savvy younger workers with the more traditional seasoned employees. Overall, Baby Boomers were the largest percentage of the university’s workforce in FY2012, comprising just over 2,400 of 5,860 staff. It is interesting to note from Appendix 3 that Generation X accounts for the greatest number of employees in the executive levels of President and Executive Vice President & Provost for Academic Affairs, closely followed by the Baby Boomer generation. In all other executive levels, Baby Boomers are the greatest number of employees, closely followed by Generation X. Generation Y, though relatively new to the workforce, are a substantial number of employees in the Executive Vice President & Provost for Academic Affairs and Vice President for Administration.
Mature / Silent
2%
Baby Boomer42%
Gen X39%
Gen Y17%
Employees by Generations - FY 2012
Staff Workforce Analytics and Trends November 1, 2012 Generations in the Workplace FY2012 Page 7
Exec/
Admin/ Mgr
Prof Non-
Faculty
Secretary/
Clerical
Technical/
Paraprof
Skilled
Craft
Service/
Maint
Mature / Silent 3.27% 2.89% 2.89% 1.63% 1.46% 2.59%
Baby Boomer 43.13% 42.91% 45.48% 45.08% 39.27% 42.79%
Generation X 40.11% 38.91% 36.82% 38.75% 42.36% 39.27%
Generation Y 13.49% 15.29% 14.81% 14.54% 16.91% 15.35%
*Average over three years, FY2010 - FY2012
Percentage of Generations within EEO Job Categories*
15
219 208
9068
1198
1087
462
14
372307
151
3
159 134
605142 167 8021
375 351
172
0
200
400
600
800
1000
1200
1400
Mature / Silent Baby Boomer Gen X Gen Y
# Em
plo
yee
s
Generations by EEO Job Category FY2012
Exec Prof Secr Cler Tech Para Skilled Service
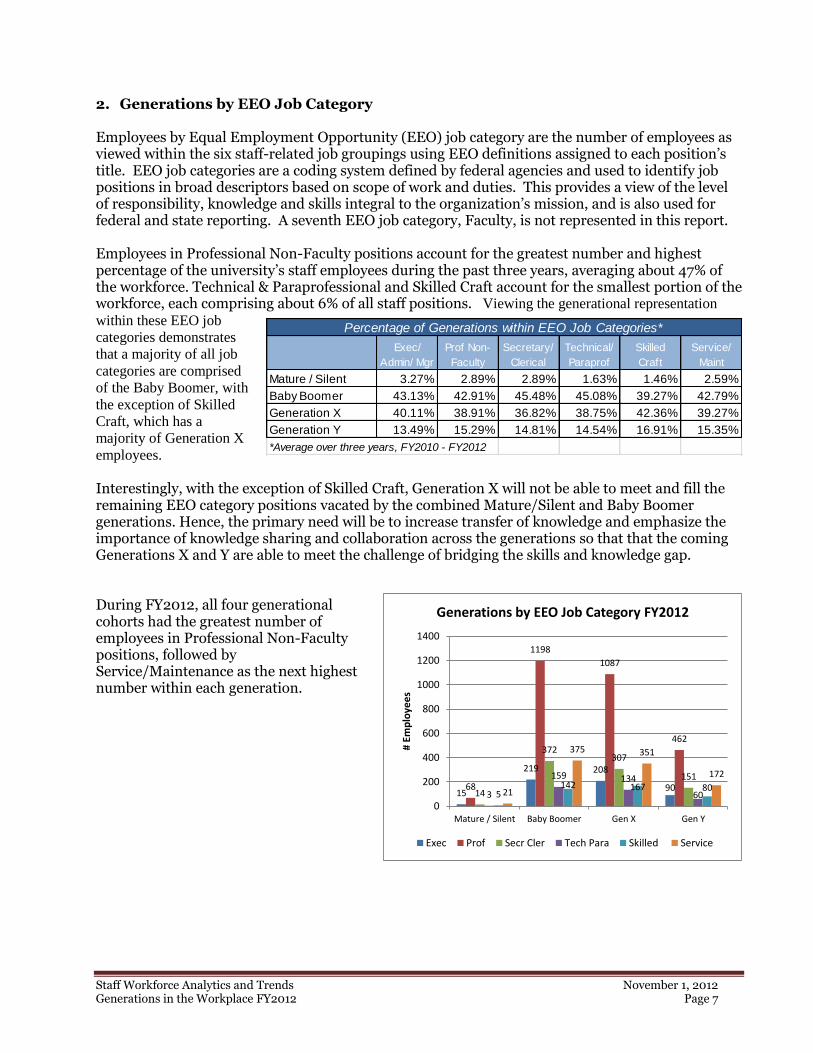
2. Generations by EEO Job Category Employees by Equal Employment Opportunity (EEO) job category are the number of employees as viewed within the six staff-related job groupings using EEO definitions assigned to each position’s title. EEO job categories are a coding system defined by federal agencies and used to identify job positions in broad descriptors based on scope of work and duties. This provides a view of the level of responsibility, knowledge and skills integral to the organization’s mission, and is also used for federal and state reporting. A seventh EEO job category, Faculty, is not represented in this report. Employees in Professional Non-Faculty positions account for the greatest number and highest percentage of the university’s staff employees during the past three years, averaging about 47% of the workforce. Technical & Paraprofessional and Skilled Craft account for the smallest portion of the workforce, each comprising about 6% of all staff positions. Viewing the generational representation
within these EEO job
categories demonstrates
that a majority of all job
categories are comprised
of the Baby Boomer, with
the exception of Skilled
Craft, which has a
majority of Generation X
employees.
Interestingly, with the exception of Skilled Craft, Generation X will not be able to meet and fill the remaining EEO category positions vacated by the combined Mature/Silent and Baby Boomer generations. Hence, the primary need will be to increase transfer of knowledge and emphasize the importance of knowledge sharing and collaboration across the generations so that that the coming Generations X and Y are able to meet the challenge of bridging the skills and knowledge gap. During FY2012, all four generational cohorts had the greatest number of employees in Professional Non-Faculty positions, followed by Service/Maintenance as the next highest number within each generation.
Staff Workforce Analytics and Trends November 1, 2012 Generations in the Workplace FY2012 Page 8
Manager Supervisor Other
Mature / Silent 3.70% 3.89% 2.57%
Baby Boomer 42.90% 41.67% 43.30%
Generation X 39.04% 39.21% 38.98%
Generation Y 14.35% 15.24% 15.15%
*Average over three years, FY2010 - FY2012
Percentage of Generations within Manager/Supervisor/Other*
490 87 3917
157 15267105
2218
2015
909
0
500
1000
1500
2000
2500
Mature / Silent Baby Boomer Gen X Gen Y
# Em
plo
yee
s
Generations by MSO FY2012
Management Supervisor Other
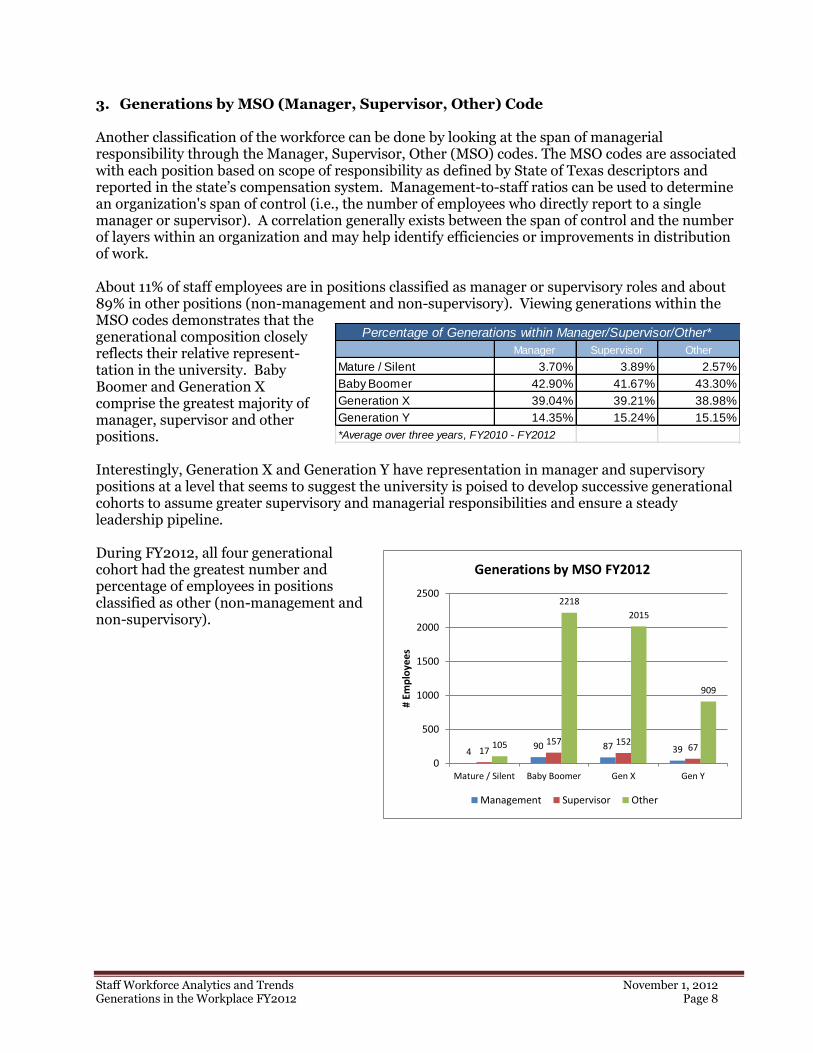
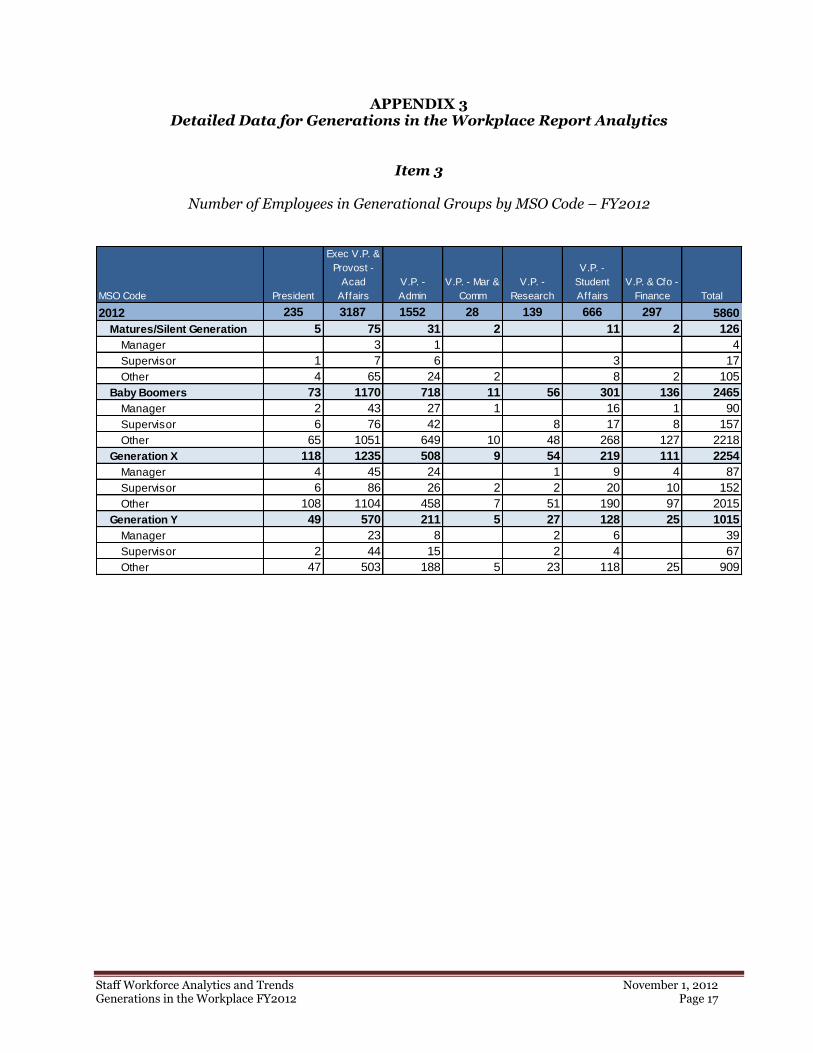
3. Generations by MSO (Manager, Supervisor, Other) Code Another classification of the workforce can be done by looking at the span of managerial responsibility through the Manager, Supervisor, Other (MSO) codes. The MSO codes are associated with each position based on scope of responsibility as defined by State of Texas descriptors and reported in the state’s compensation system. Management-to-staff ratios can be used to determine an organization's span of control (i.e., the number of employees who directly report to a single manager or supervisor). A correlation generally exists between the span of control and the number of layers within an organization and may help identify efficiencies or improvements in distribution of work. About 11% of staff employees are in positions classified as manager or supervisory roles and about 89% in other positions (non-management and non-supervisory). Viewing generations within the MSO codes demonstrates that the generational composition closely reflects their relative represent-tation in the university. Baby Boomer and Generation X comprise the greatest majority of manager, supervisor and other positions. Interestingly, Generation X and Generation Y have representation in manager and supervisory positions at a level that seems to suggest the university is poised to develop successive generational cohorts to assume greater supervisory and managerial responsibilities and ensure a steady leadership pipeline. During FY2012, all four generational cohort had the greatest number and percentage of employees in positions classified as other (non-management and non-supervisory).
Staff Workforce Analytics and Trends November 1, 2012 Generations in the Workplace FY2012 Page 9
2010 2011 2012
Mature / Silent 32.8% 29.2% 33.3%
Baby Boomer 30.7% 31.7% 30.3%
Generation X 31.1% 30.2% 30.5%
Generation Y 31.2% 29.5% 32.7%
Percentage Minority Trend Within Generations
83
16901549
674
42
746 687
332
1 29 18 90
200
400
600
800
1000
1200
1400
1600
1800
Mature / Silent Baby Boomer Gen X Gen Y
# Em
plo
yee
s
Minority/Non-Minority by Generations FY2012
Non-Minority Minority Unknown
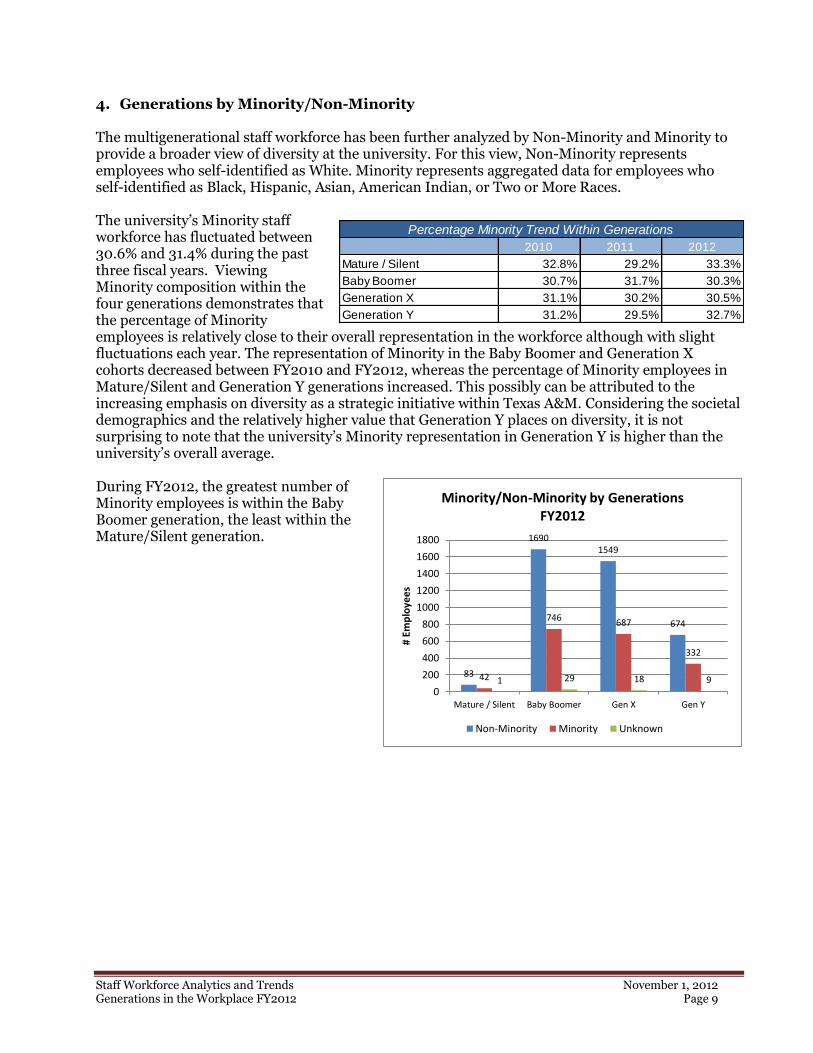
4. Generations by Minority/Non-Minority The multigenerational staff workforce has been further analyzed by Non-Minority and Minority to provide a broader view of diversity at the university. For this view, Non-Minority represents employees who self-identified as White. Minority represents aggregated data for employees who self-identified as Black, Hispanic, Asian, American Indian, or Two or More Races. The university’s Minority staff workforce has fluctuated between 30.6% and 31.4% during the past three fiscal years. Viewing Minority composition within the four generations demonstrates that the percentage of Minority employees is relatively close to their overall representation in the workforce although with slight fluctuations each year. The representation of Minority in the Baby Boomer and Generation X cohorts decreased between FY2010 and FY2012, whereas the percentage of Minority employees in Mature/Silent and Generation Y generations increased. This possibly can be attributed to the increasing emphasis on diversity as a strategic initiative within Texas A&M. Considering the societal demographics and the relatively higher value that Generation Y places on diversity, it is not surprising to note that the university’s Minority representation in Generation Y is higher than the university’s overall average. During FY2012, the greatest number of Minority employees is within the Baby Boomer generation, the least within the Mature/Silent generation.
Staff Workforce Analytics and Trends November 1, 2012 Generations in the Workplace FY2012 Page 10
2010 2011 2012
Mature / Silent 40.2% 39.0% 34.9%
Baby Boomer 57.8% 57.8% 57.1%
Generation X 55.3% 55.6% 55.3%
Generation Y 60.6% 61.5% 61.2%
Percentage Female Trend Within Generations
44
1408
1247
621
82
1057 1007
394
0
200
400
600
800
1000
1200
1400
1600
Mature / Silent Baby Boomer Gen X Gen Y
# Em
plo
yee
s
Gender by Generations FY2012
Female Male
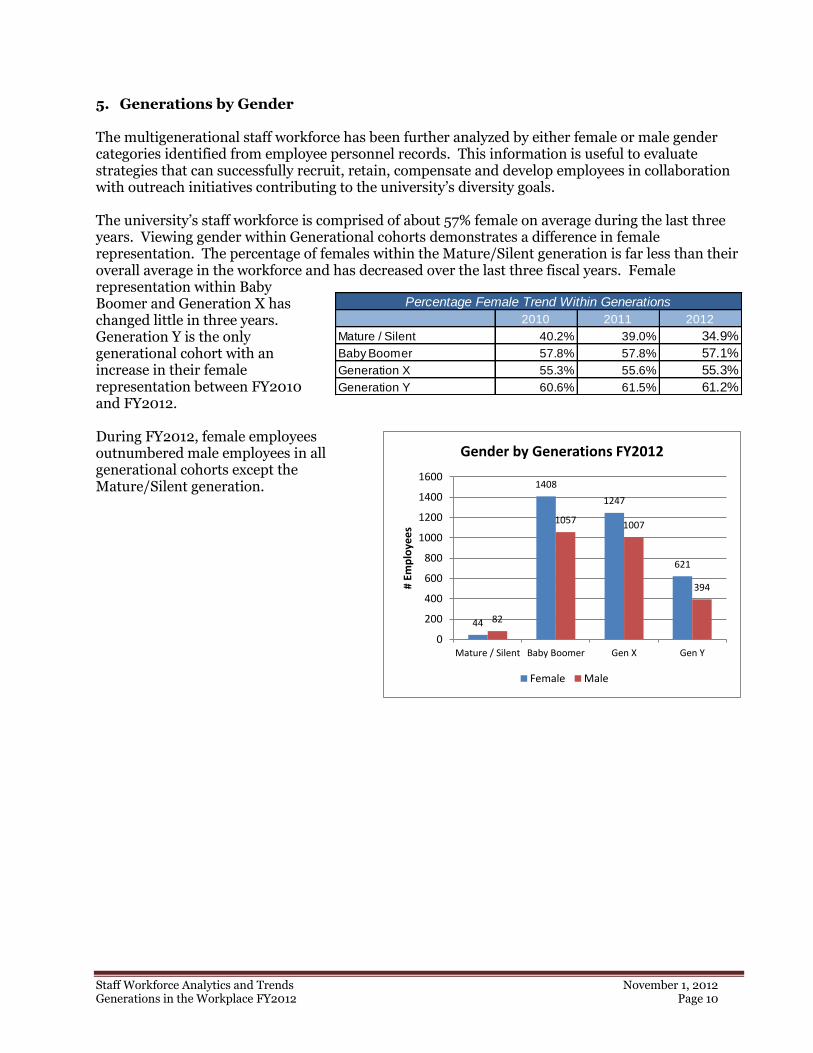
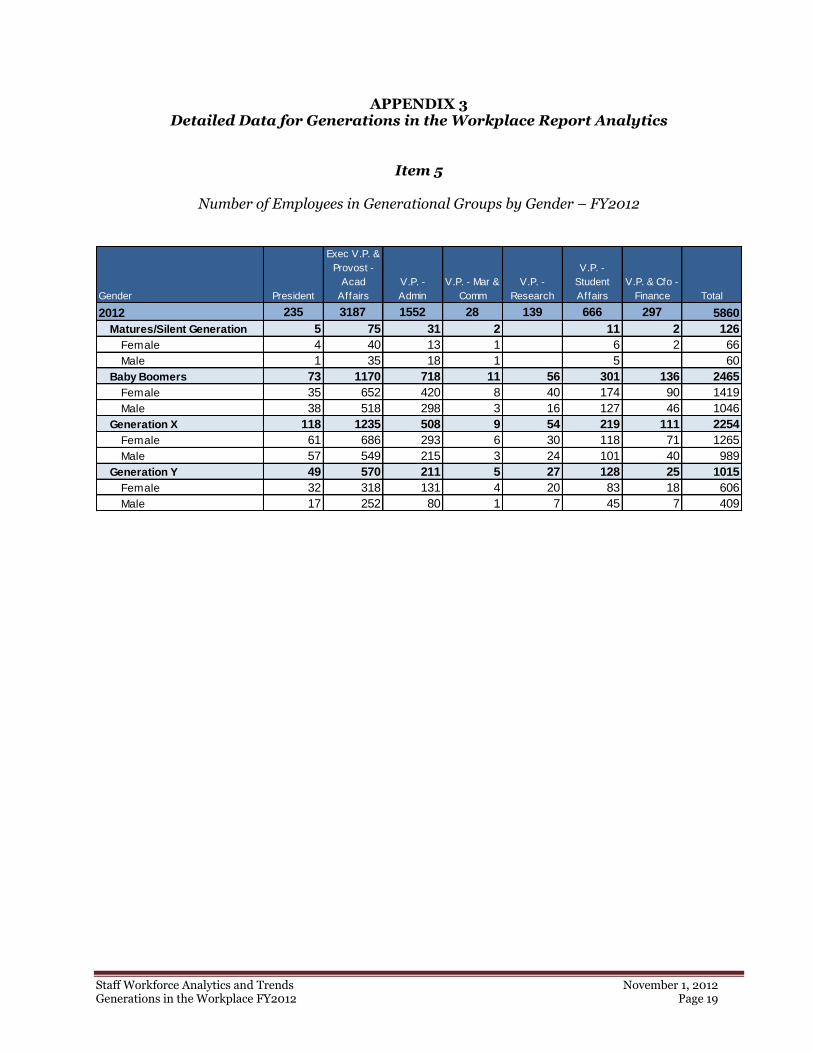
5. Generations by Gender The multigenerational staff workforce has been further analyzed by either female or male gender categories identified from employee personnel records. This information is useful to evaluate strategies that can successfully recruit, retain, compensate and develop employees in collaboration with outreach initiatives contributing to the university’s diversity goals. The university’s staff workforce is comprised of about 57% female on average during the last three years. Viewing gender within Generational cohorts demonstrates a difference in female representation. The percentage of females within the Mature/Silent generation is far less than their overall average in the workforce and has decreased over the last three fiscal years. Female representation within Baby Boomer and Generation X has changed little in three years. Generation Y is the only generational cohort with an increase in their female representation between FY2010 and FY2012. During FY2012, female employees outnumbered male employees in all generational cohorts except the Mature/Silent generation.
Staff Workforce Analytics and Trends November 1, 2012 Generations in the Workplace FY2012 Page 11
43
1007935
449
16
162 15063
36
661619
254
18
371305
151
13
264 245
98
0
200
400
600
800
1000
1200
Mature / Silent Baby Boomer Gen X Gen Y
# Em
plo
yee
s
Generations by Education Level FY2012
HS or less Assoc Bach Master Phd / Prof
2010 2011 2012
Mature / Silent 65.2% 68.2% 65.9%
Baby Boomer 58.3% 59.5% 59.1%
Generation X 60.1% 60.0% 58.5%
Generation Y 59.5% 58.6% 55.8%
*Employees earning a minimum of an Associate degree
Percentage Degree Earners Trend Within Generations*
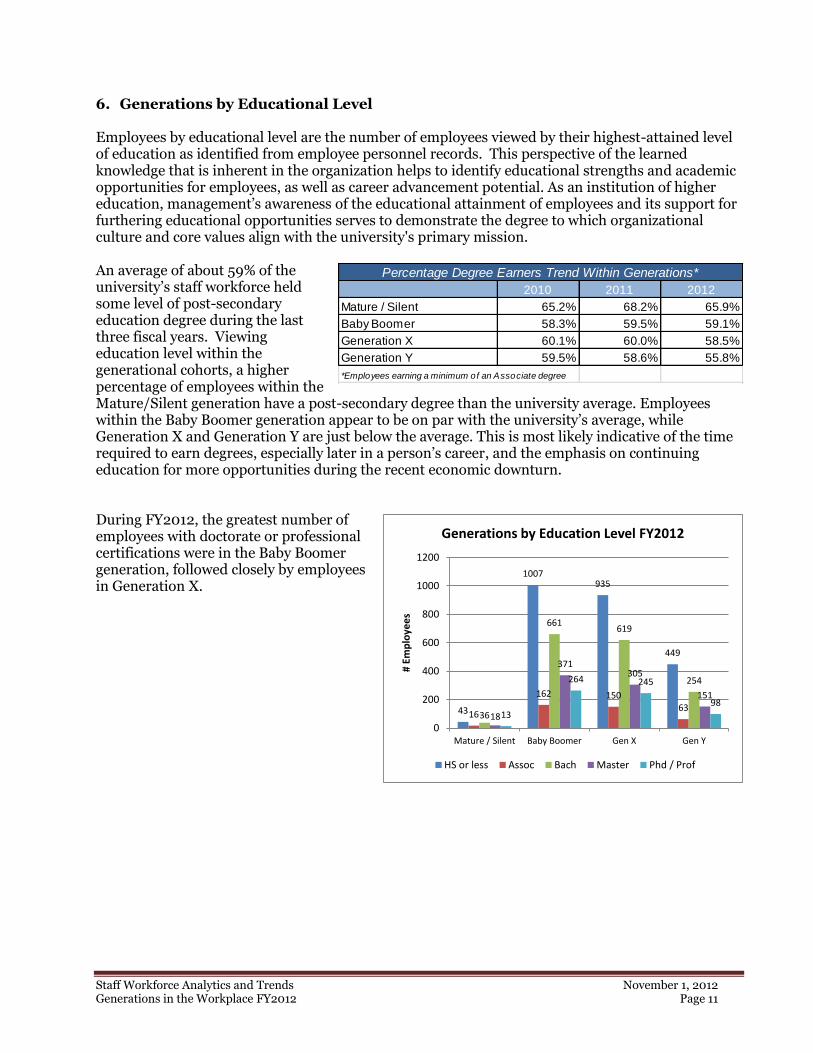
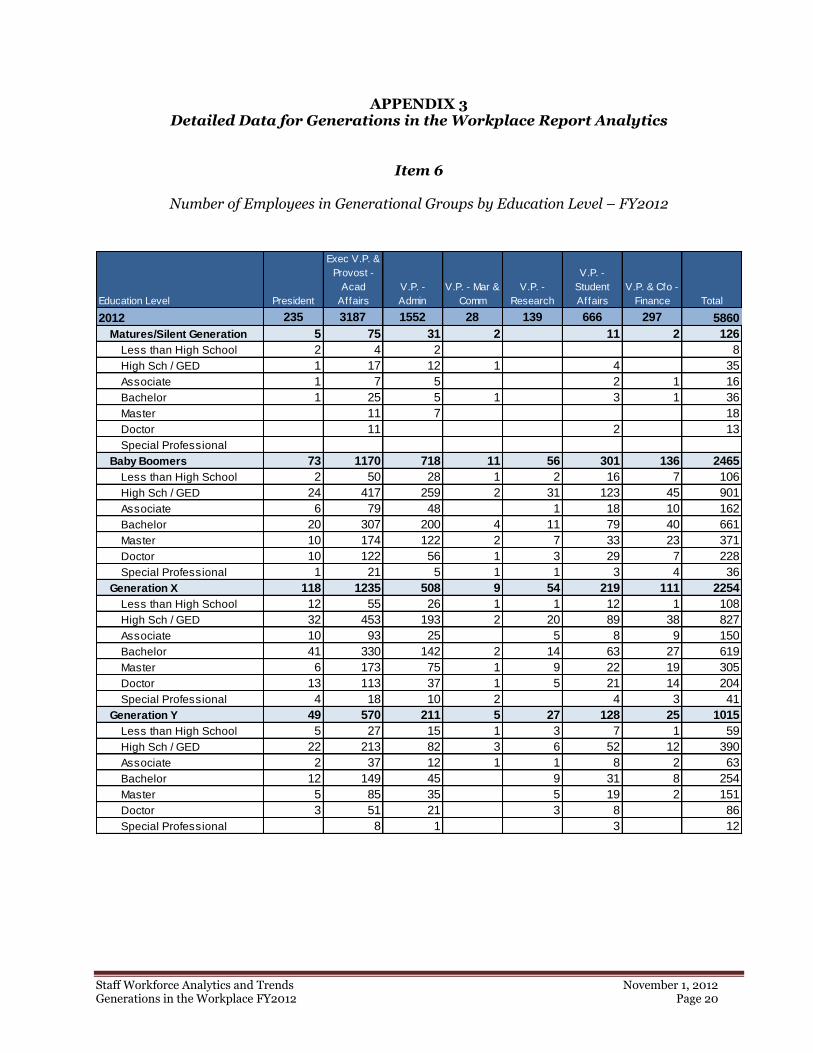
6. Generations by Educational Level Employees by educational level are the number of employees viewed by their highest-attained level of education as identified from employee personnel records. This perspective of the learned knowledge that is inherent in the organization helps to identify educational strengths and academic opportunities for employees, as well as career advancement potential. As an institution of higher education, management’s awareness of the educational attainment of employees and its support for furthering educational opportunities serves to demonstrate the degree to which organizational culture and core values align with the university's primary mission. An average of about 59% of the university’s staff workforce held some level of post-secondary education degree during the last three fiscal years. Viewing education level within the generational cohorts, a higher percentage of employees within the Mature/Silent generation have a post-secondary degree than the university average. Employees within the Baby Boomer generation appear to be on par with the university’s average, while Generation X and Generation Y are just below the average. This is most likely indicative of the time required to earn degrees, especially later in a person’s career, and the emphasis on continuing education for more opportunities during the recent economic downturn. During FY2012, the greatest number of employees with doctorate or professional certifications were in the Baby Boomer generation, followed closely by employees in Generation X.
Staff Workforce Analytics and Trends November 1, 2012 Generations in the Workplace FY2012 Page 12
6
135
251
351
42
684
1130
652
22
828
735
1226
636
138
30
182
0
200
400
600
800
1000
1200
Mature / Silent Baby Boomer Gen X Gen Y
# Em
plo
yee
s
Generations by Years of Service FY2012
Less than 2 2 to 10 11 to 20 20 to 30 More than 30
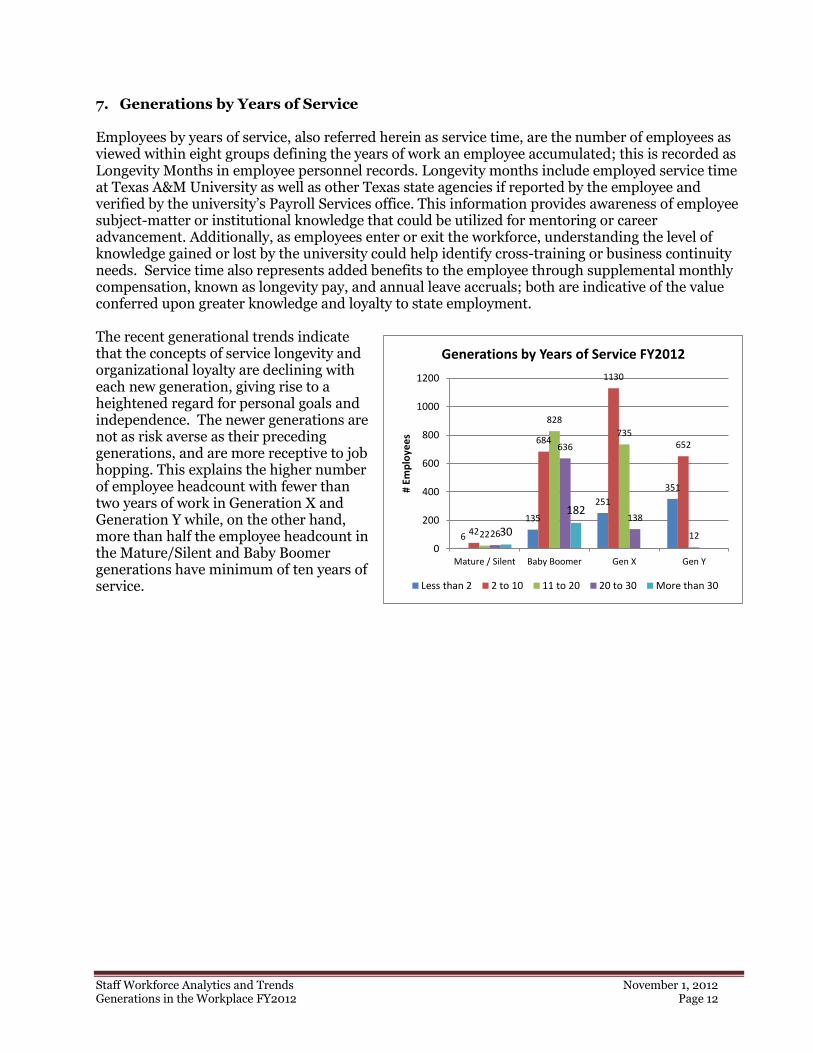
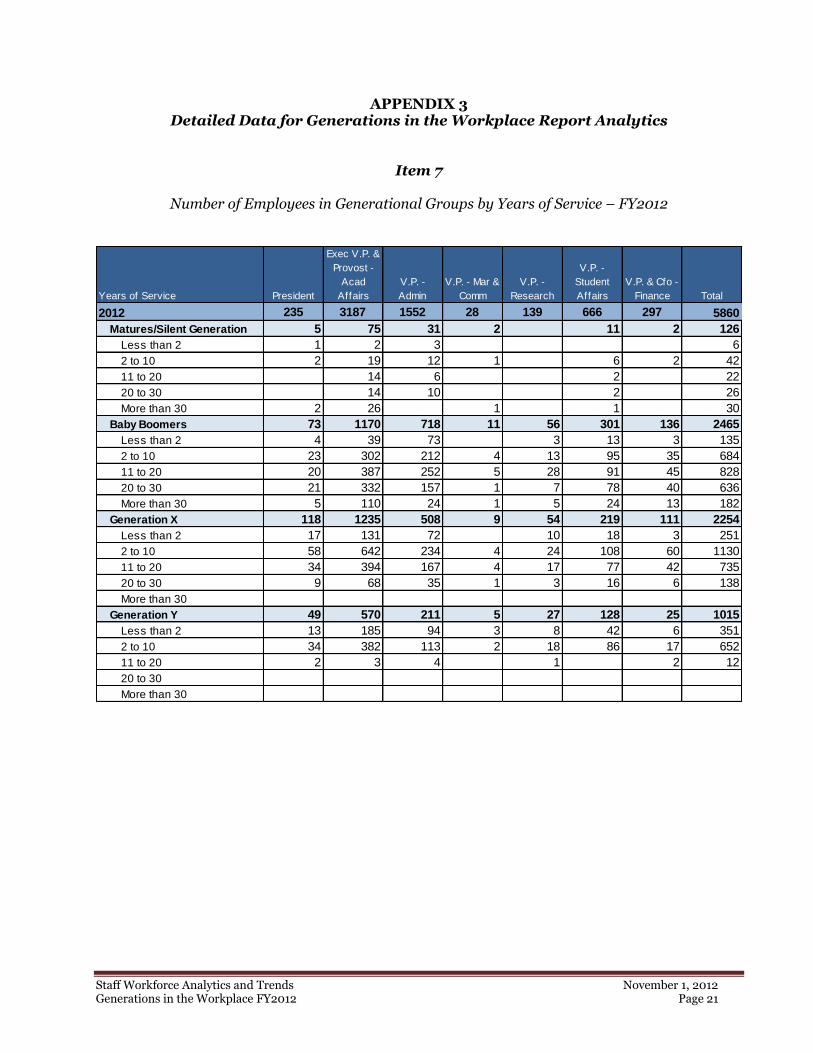
7. Generations by Years of Service Employees by years of service, also referred herein as service time, are the number of employees as viewed within eight groups defining the years of work an employee accumulated; this is recorded as Longevity Months in employee personnel records. Longevity months include employed service time at Texas A&M University as well as other Texas state agencies if reported by the employee and verified by the university’s Payroll Services office. This information provides awareness of employee subject-matter or institutional knowledge that could be utilized for mentoring or career advancement. Additionally, as employees enter or exit the workforce, understanding the level of knowledge gained or lost by the university could help identify cross-training or business continuity needs. Service time also represents added benefits to the employee through supplemental monthly compensation, known as longevity pay, and annual leave accruals; both are indicative of the value conferred upon greater knowledge and loyalty to state employment. The recent generational trends indicate that the concepts of service longevity and organizational loyalty are declining with each new generation, giving rise to a heightened regard for personal goals and independence. The newer generations are not as risk averse as their preceding generations, and are more receptive to job hopping. This explains the higher number of employee headcount with fewer than two years of work in Generation X and Generation Y while, on the other hand, more than half the employee headcount in the Mature/Silent and Baby Boomer generations have minimum of ten years of service.
Staff Workforce Analytics and Trends November 1, 2012 Generations in the Workplace FY2012 Page 13
APPENDIX 1 Overview Texas A&M University is the flagship institution of The Texas A&M University System, with $1 billion budget and an endowment that typically ranks in the top five nationally among public universities. Playing a key role in the day-to-day operations of the university are about 5,900 staff providing administrative services and support to future, current and former students, as well as faculty, researchers and campus visitors. The Staff Workforce Analytics and Trends is a series of reports developed by the Texas A&M University Human Resources organization to provide human resource-related information on budgeted staff employees at Texas A&M University–College Station and Qatar. The reports include metrics on a variety of demographic and position-related data and commentary and are provided to university management to increase awareness of the make-up of their organization, recognize efficiencies and take advantage of opportunities to build a productive and successful organization. The report series will include: Demographics; Generations in the Workplace; Leave Benefits: Recruitment; Retirement Trends; Compensation; Training and Development; and, Turnover. Scope of Generations in the Workplace Report
Data are a snapshot of employee information at November 30 for the fiscal years 2010, 2011 and 2012 as indicated by each chart or table.
Data are for Part 02 ADLOC’d active budgeted positions and employees.
Data for employee and position-related data are from The Texas A&M University System DataWarehouse.
Data presented in this report are for the university as a total and further displayed for numerical counts by Executive level reporting units. The executive level reporting units include all the colleges, divisions, departments and center that report within that unit and displayed as follows: 1) President 2) Executive Vice President and Provost – Academic Affairs 3) Vice President – Administration 4) Vice President – Marketing & Communications 5) Vice President – Research 6) Vice President – Student Affairs 7) Vice President & CFO - Finance
Methodology for Generations in the Workplace Report
Generational groups are defined by month and year of birth as follows: Mature/Silent Generation – born before 01/1946; Baby Boomers –born from 01/1946 through 12/1964; Generation X –born from 01/1965 through 12/1980; Generation Y/Millenials – born from 01/1981 through 12/1999
Averages were calculated from the total headcount of each FY2010, FY2011 and FY2012, divided by three.
Staff Workforce Analytics and Trends November 1, 2012 Generations in the Workplace FY2012 Page 14
EEO Job President
Exec V.P. &
Provost -
Acad Affairs V.P. - Admin
V.P. - Mar &
Comm
V.P. -
Research
V.P. -
Student
Affairs
V.P. & Cfo -
Finance Total
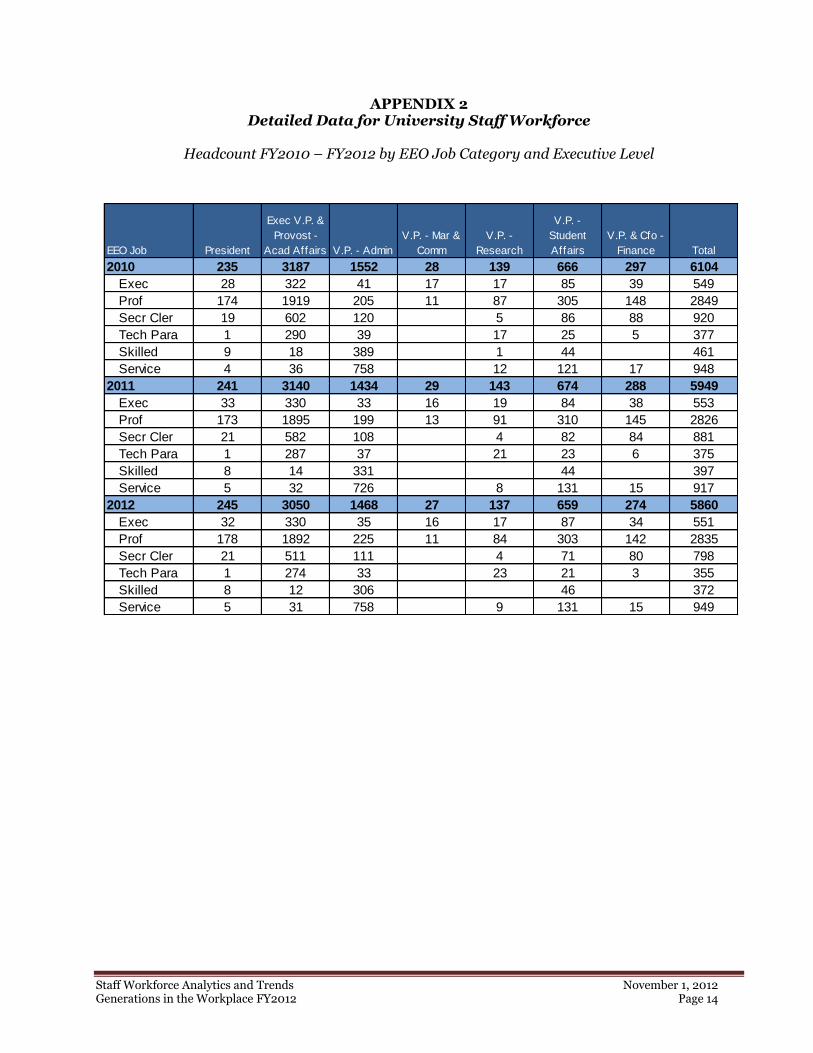
2010 235 3187 1552 28 139 666 297 6104
Exec 28 322 41 17 17 85 39 549
Prof 174 1919 205 11 87 305 148 2849
Secr Cler 19 602 120 5 86 88 920
Tech Para 1 290 39 17 25 5 377
Skilled 9 18 389 1 44 461
Service 4 36 758 12 121 17 948
2011 241 3140 1434 29 143 674 288 5949
Exec 33 330 33 16 19 84 38 553
Prof 173 1895 199 13 91 310 145 2826
Secr Cler 21 582 108 4 82 84 881
Tech Para 1 287 37 21 23 6 375
Skilled 8 14 331 44 397
Service 5 32 726 8 131 15 917
2012 245 3050 1468 27 137 659 274 5860
Exec 32 330 35 16 17 87 34 551
Prof 178 1892 225 11 84 303 142 2835
Secr Cler 21 511 111 4 71 80 798
Tech Para 1 274 33 23 21 3 355
Skilled 8 12 306 46 372
Service 5 31 758 9 131 15 949
APPENDIX 2 Detailed Data for University Staff Workforce
Headcount FY2010 – FY2012 by EEO Job Category and Executive Level
Staff Workforce Analytics and Trends November 1, 2012 Generations in the Workplace FY2012 Page 15
President
Exec V.P. &
Provost -
Acad
Affairs
V.P. -
Admin
V.P. - Mar &
Comm
V.P. -
Research
V.P. -
Student
Affairs
V.P. & Cfo -
Finance Total
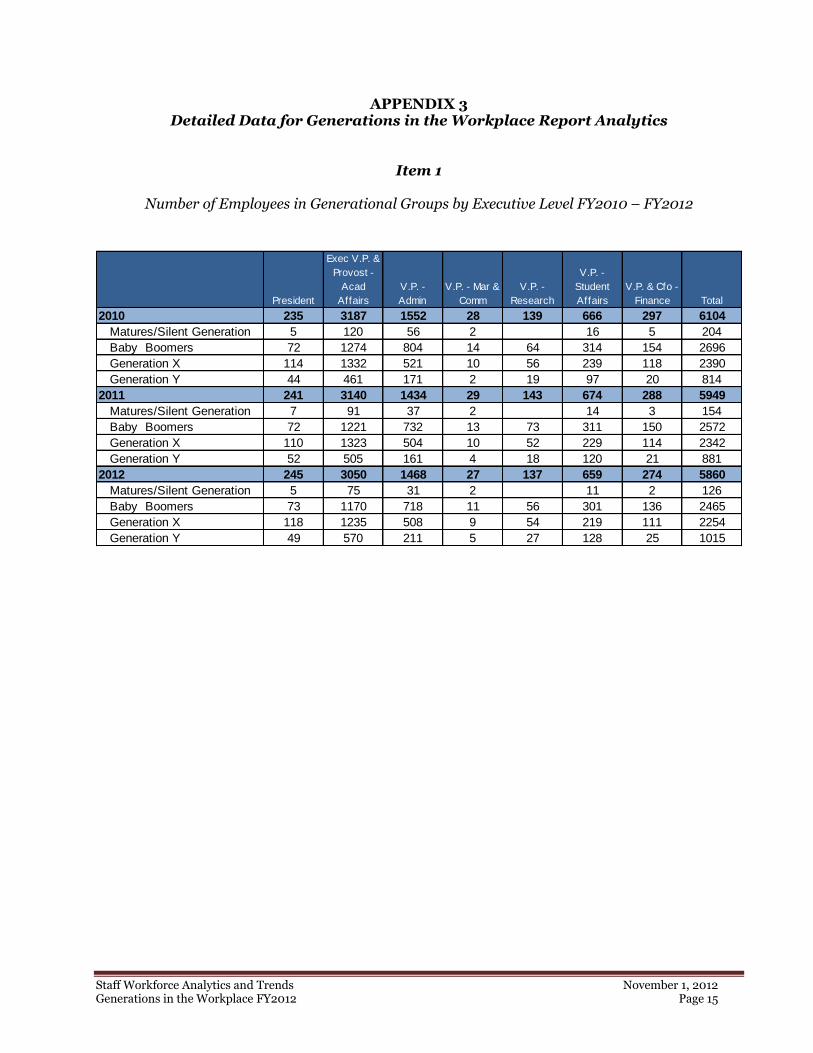
2010 235 3187 1552 28 139 666 297 6104
Matures/Silent Generation 5 120 56 2 16 5 204
Baby Boomers 72 1274 804 14 64 314 154 2696
Generation X 114 1332 521 10 56 239 118 2390
Generation Y 44 461 171 2 19 97 20 814
2011 241 3140 1434 29 143 674 288 5949
Matures/Silent Generation 7 91 37 2 14 3 154
Baby Boomers 72 1221 732 13 73 311 150 2572
Generation X 110 1323 504 10 52 229 114 2342
Generation Y 52 505 161 4 18 120 21 881
2012 245 3050 1468 27 137 659 274 5860
Matures/Silent Generation 5 75 31 2 11 2 126
Baby Boomers 73 1170 718 11 56 301 136 2465
Generation X 118 1235 508 9 54 219 111 2254
Generation Y 49 570 211 5 27 128 25 1015
APPENDIX 3 Detailed Data for Generations in the Workplace Report Analytics
Item 1
Number of Employees in Generational Groups by Executive Level FY2010 – FY2012
Staff Workforce Analytics and Trends November 1, 2012 Generations in the Workplace FY2012 Page 16
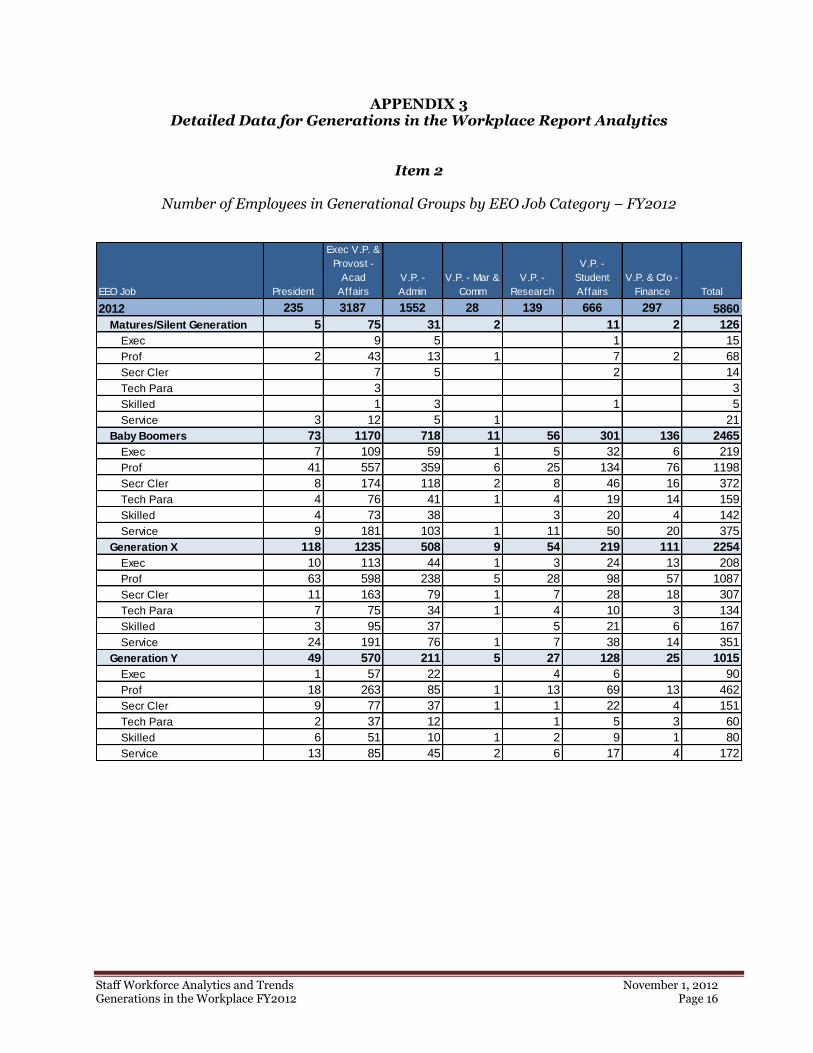
APPENDIX 3 Detailed Data for Generations in the Workplace Report Analytics
Item 2
Number of Employees in Generational Groups by EEO Job Category – FY2012
EEO Job President
Exec V.P. &
Provost -
Acad
Affairs
V.P. -
Admin
V.P. - Mar &
Comm
V.P. -
Research
V.P. -
Student
Affairs
V.P. & Cfo -
Finance Total
2012 235 3187 1552 28 139 666 297 5860
Matures/Silent Generation 5 75 31 2 11 2 126
Exec 9 5 1 15
Prof 2 43 13 1 7 2 68
Secr Cler 7 5 2 14
Tech Para 3 3
Skilled 1 3 1 5
Service 3 12 5 1 21
Baby Boomers 73 1170 718 11 56 301 136 2465
Exec 7 109 59 1 5 32 6 219
Prof 41 557 359 6 25 134 76 1198
Secr Cler 8 174 118 2 8 46 16 372
Tech Para 4 76 41 1 4 19 14 159
Skilled 4 73 38 3 20 4 142
Service 9 181 103 1 11 50 20 375
Generation X 118 1235 508 9 54 219 111 2254
Exec 10 113 44 1 3 24 13 208
Prof 63 598 238 5 28 98 57 1087
Secr Cler 11 163 79 1 7 28 18 307
Tech Para 7 75 34 1 4 10 3 134
Skilled 3 95 37 5 21 6 167
Service 24 191 76 1 7 38 14 351
Generation Y 49 570 211 5 27 128 25 1015
Exec 1 57 22 4 6 90
Prof 18 263 85 1 13 69 13 462
Secr Cler 9 77 37 1 1 22 4 151
Tech Para 2 37 12 1 5 3 60
Skilled 6 51 10 1 2 9 1 80
Service 13 85 45 2 6 17 4 172
Staff Workforce Analytics and Trends November 1, 2012 Generations in the Workplace FY2012 Page 17
MSO Code President
Exec V.P. &
Provost -
Acad
Affairs
V.P. -
Admin
V.P. - Mar &
Comm
V.P. -
Research
V.P. -
Student
Affairs
V.P. & Cfo -
Finance Total
2012 235 3187 1552 28 139 666 297 5860
Matures/Silent Generation 5 75 31 2 11 2 126
Manager 3 1 4
Supervisor 1 7 6 3 17
Other 4 65 24 2 8 2 105
Baby Boomers 73 1170 718 11 56 301 136 2465
Manager 2 43 27 1 16 1 90
Supervisor 6 76 42 8 17 8 157
Other 65 1051 649 10 48 268 127 2218
Generation X 118 1235 508 9 54 219 111 2254
Manager 4 45 24 1 9 4 87
Supervisor 6 86 26 2 2 20 10 152
Other 108 1104 458 7 51 190 97 2015
Generation Y 49 570 211 5 27 128 25 1015
Manager 23 8 2 6 39
Supervisor 2 44 15 2 4 67
Other 47 503 188 5 23 118 25 909
APPENDIX 3 Detailed Data for Generations in the Workplace Report Analytics
Item 3
Number of Employees in Generational Groups by MSO Code – FY2012

Staff Workforce Analytics and Trends November 1, 2012 Generations in the Workplace FY2012 Page 18
Minority/Non-Minority President
Exec V.P. &
Provost -
Acad
Affairs
V.P. -
Admin
V.P. - Mar &
Comm
V.P. -
Research
V.P. -
Student
Affairs
V.P. & Cfo -
Finance Total
2012 235 3187 1552 28 139 666 297 5860
Matures/Silent Generation 5 75 31 2 11 2 126
Minority 2 25 9 1 4 1 42
Non-Minority 3 50 21 1 7 1 83
Unknown 1 1
Baby Boomers 73 1170 718 11 56 301 136 2465
Minority 18 365 206 3 18 102 34 746
Non-Minority 52 790 503 8 38 197 102 1690
Unknown 3 15 9 2 29
Generation X 118 1235 508 9 54 219 111 2254
Minority 31 395 148 2 10 66 35 687
Non-Minority 85 830 355 7 44 152 76 1549
Unknown 2 10 5 1 18
Generation Y 49 570 211 5 27 128 25 1015
Minority 22 174 83 2 11 34 6 332
Non-Minority 27 391 127 3 16 91 19 674
Unknown 5 1 3 9
APPENDIX 3 Detailed Data for Generations in the Workplace Report Analytics
Item 4
Number of Employees in Generational Groups by Minority/Non-Minority – FY2012
Staff Workforce Analytics and Trends November 1, 2012 Generations in the Workplace FY2012 Page 19
Gender President
Exec V.P. &
Provost -
Acad
Affairs
V.P. -
Admin
V.P. - Mar &
Comm
V.P. -
Research
V.P. -
Student
Affairs
V.P. & Cfo -
Finance Total
2012 235 3187 1552 28 139 666 297 5860
Matures/Silent Generation 5 75 31 2 11 2 126
Female 4 40 13 1 6 2 66
Male 1 35 18 1 5 60
Baby Boomers 73 1170 718 11 56 301 136 2465
Female 35 652 420 8 40 174 90 1419
Male 38 518 298 3 16 127 46 1046
Generation X 118 1235 508 9 54 219 111 2254
Female 61 686 293 6 30 118 71 1265
Male 57 549 215 3 24 101 40 989
Generation Y 49 570 211 5 27 128 25 1015
Female 32 318 131 4 20 83 18 606
Male 17 252 80 1 7 45 7 409
APPENDIX 3 Detailed Data for Generations in the Workplace Report Analytics
Item 5
Number of Employees in Generational Groups by Gender – FY2012
Staff Workforce Analytics and Trends November 1, 2012 Generations in the Workplace FY2012 Page 20
Education Level President
Exec V.P. &
Provost -
Acad
Affairs
V.P. -
Admin
V.P. - Mar &
Comm
V.P. -
Research
V.P. -
Student
Affairs
V.P. & Cfo -
Finance Total
2012 235 3187 1552 28 139 666 297 5860
Matures/Silent Generation 5 75 31 2 11 2 126
Less than High School 2 4 2 8
High Sch / GED 1 17 12 1 4 35
Associate 1 7 5 2 1 16
Bachelor 1 25 5 1 3 1 36
Master 11 7 18
Doctor 11 2 13
Special Professional
Baby Boomers 73 1170 718 11 56 301 136 2465
Less than High School 2 50 28 1 2 16 7 106
High Sch / GED 24 417 259 2 31 123 45 901
Associate 6 79 48 1 18 10 162
Bachelor 20 307 200 4 11 79 40 661
Master 10 174 122 2 7 33 23 371
Doctor 10 122 56 1 3 29 7 228
Special Professional 1 21 5 1 1 3 4 36
Generation X 118 1235 508 9 54 219 111 2254
Less than High School 12 55 26 1 1 12 1 108
High Sch / GED 32 453 193 2 20 89 38 827
Associate 10 93 25 5 8 9 150
Bachelor 41 330 142 2 14 63 27 619
Master 6 173 75 1 9 22 19 305
Doctor 13 113 37 1 5 21 14 204
Special Professional 4 18 10 2 4 3 41
Generation Y 49 570 211 5 27 128 25 1015
Less than High School 5 27 15 1 3 7 1 59
High Sch / GED 22 213 82 3 6 52 12 390
Associate 2 37 12 1 1 8 2 63
Bachelor 12 149 45 9 31 8 254
Master 5 85 35 5 19 2 151
Doctor 3 51 21 3 8 86
Special Professional 8 1 3 12
APPENDIX 3 Detailed Data for Generations in the Workplace Report Analytics
Item 6
Number of Employees in Generational Groups by Education Level – FY2012
Staff Workforce Analytics and Trends November 1, 2012 Generations in the Workplace FY2012 Page 21
Years of Service President
Exec V.P. &
Provost -
Acad
Affairs
V.P. -
Admin
V.P. - Mar &
Comm
V.P. -
Research
V.P. -
Student
Affairs
V.P. & Cfo -
Finance Total
2012 235 3187 1552 28 139 666 297 5860
Matures/Silent Generation 5 75 31 2 11 2 126
Less than 2 1 2 3 6
2 to 10 2 19 12 1 6 2 42
11 to 20 14 6 2 22
20 to 30 14 10 2 26
More than 30 2 26 1 1 30
Baby Boomers 73 1170 718 11 56 301 136 2465
Less than 2 4 39 73 3 13 3 135
2 to 10 23 302 212 4 13 95 35 684
11 to 20 20 387 252 5 28 91 45 828
20 to 30 21 332 157 1 7 78 40 636
More than 30 5 110 24 1 5 24 13 182
Generation X 118 1235 508 9 54 219 111 2254
Less than 2 17 131 72 10 18 3 251
2 to 10 58 642 234 4 24 108 60 1130
11 to 20 34 394 167 4 17 77 42 735
20 to 30 9 68 35 1 3 16 6 138
More than 30
Generation Y 49 570 211 5 27 128 25 1015
Less than 2 13 185 94 3 8 42 6 351
2 to 10 34 382 113 2 18 86 17 652
11 to 20 2 3 4 1 2 12
20 to 30
More than 30
APPENDIX 3 Detailed Data for Generations in the Workplace Report Analytics
Item 7
Number of Employees in Generational Groups by Years of Service – FY2012