generic life cycle assessment of the jatropha biodiesel system · universidade nova de lisboa...
TRANSCRIPT

Universidade Nova de Lisboa Faculdade de Ciências e Tecnologia
Katholieke Universiteit Leuven Faculty of Bioscience Engineering
Generic life cycle assessment of the Jatropha biodiesel system
Por Joana Teresa Gomes Dias Almeida
Dissertação apresentada na Faculdade de Ciências e Tecnologia da Universidade Nova de Lisboa para obtenção do Grau de Mestre em Energia e Bioenergia.
Orientador: prof. Bart Muys Co-orientador: prof. Paula Duarte
Lisboa 2009

i
ACKNOWLEDGEMENTS
During the first year of my Master in Energy and Bioenergy held in Faculdade de Ciências e
Tecnologia of the Universidade Nova de Lisboa, I became aware that bioenergy as we know
it now, is as in need of technological optimization as of rightfully assessed sustainability.
When deciding on my thesis’ theme, I aimed at combining that awareness with a trendy
subject and an abroad academic experience. I fulfilled my will by becoming part of the
Division of Forest, Nature and Landscape Research of K.U. Leuven as an exchange student
on their work on putting together the puzzle of Jatropha sustainability. The small piece that
I hope to have contributed with does not measure up to what I received in return. I was
enthusiastic on putting myself into the assignment. Most of all, living in Leuven was an
enriching and character defining experience.
Coming from a rather different background, this task would have never been possible for me
without inexhaustible guidance and precious input. It helped me to excel my own
limitations, set order in my reasoning and overcome the many adversities. For this, I have to
thank several academic staff members.
Firs of all, I express my gratitude to Prof. Dr. Ir. Bart Muys for giving me the chance to
perform this work and never hesitating with pushing me forward and clarifying my doubts.
Antonio Trabucco, Carolin Spirinckx of VITO and Dr. Paula Duarte of FCT-UNL were
most helpful with their availability to help and important inputs.
Dr. Raf Aerts, although not being involved in my work, has been a cheering presence. I
thank him for being most welcoming and for taking my mind of Jatropha quite often,
introducing me to other projects and insights on subjects we share a common interest for.
Finally, an enormous thank to Ir. Wouter Achten for being a terrific teammate. Your input in
the work was crucial, as well has the uplifting and soothing support in the tricky moments.
Working with you has been a great motivation and pleasure for me.
I am grateful to my parents to whom I owe my staying in Leuven (and, after all, my entire
academic path). My aunts São and Cacilda, who watched over my home during my absence,
played not less important roles.
Alkis, Christian, Luna, Marianna and Marisa: thank you for taking me in your friendship.
All the moments, the fun and the caring we built together during the past six months were
crucial to my joy and balance. Moreover, they contribute to my will to return and join at
least some of you for a while longer!
However, this dissertation’s effort started eleven months ago in Portugal. For the first five
months, it progressed with daily work at the FCT campus simultaneously with the

ii
conclusion of the curricular phase of the Master course. During that time Manuel, Maria,
Rita and Rui were a constant presence and turned the campus into a better place.
At last, I thank in particular to my mother for always being there although being far and to
Francisco and Luísa for their friendship, constancy and love.

iii
RESUMO
A espécie Jatropha curcas L. é uma planta selvagem pantropical que recentemente
conquistou a atenção de investidores e cientistas enquanto matéria-prima para biodiesel.
As opiniões positivas quanto a esta opção são abundantes, mas a falta de input científico
extenso e intensivo impede uma avaliação clara de limitações e vantagens e, afinal, da
sustentabilidade do sistema de biodiesel da Jatropha. A produção sustentável de energia
corresponde a vários critérios e a sua ponderação deve incluir a análise ambiental de
ciclo de vida.
Este estudo pretende discernir, de modo genérico, o balanço ambiental, as fases de
produção com maior impacto e as opções de produção com menor impacto do sistema de
produção de biodiesel a partir de Jatropha. O estudo foi feito com base nas normas
ISO14040 a 43. Os dados foram reunidos a partir de literatura e questionários enviados a
investidores relevantes. A análise de impacte ambiental recorreu à ferramenta informática
SimaPro®, com os métodos IMPACT2002+ e Ecoindicator99.
A base de comparação é o sistema fóssil equivalente. Ambos os métodos apontaram para
poupanças nas emissões de gases com efeito-estufa e de clorofluorocarbonetos e
eficiência energética melhorada.
Os potenciais de eutrofização e acidificação sofrem um agravamento. Os fertilizantes
utilizados no cultivo constituem os principais responsáveis pelos impactes negativos. Os
créditos provenientes do uso dos subprodutos dependem da categoria ambiental e do
próprio uso. Porém, usar o bagaço das sementes como vector energético confere
vantagem ao sistema. Pelo contrário, incluir passos adicionais de transporte na cadeia do
biodiesel é desvantajoso.
As conclusões são, todavia, restringidas pelas limitações inerentes à metodologia de
análise de ciclo de vida. Além disso, o estado incipiente do desenvolvimento do sistema
do biodiesel de Jatropha e do conhecimento envolvido dificultam a fiabilidade e
aumentam a incerteza.

iv
ABSTRACT
Wild pantropical plant Jatropha curcas L. has conquered the attention of investors and
scientists as a biodiesel feedstock. Positive claims towards this option are abundant, but
extensive scientific input is lacking for a clear evaluation of shortcomings and advantages
and, in all, sustainability of a Jatropha based biodiesel system. Sustainable energy
generation answers to several criteria and its pondering ought to include environmental life
cycle assessment.
This study aimed at discerning, in a generic way, the environmental balance, most impactful
production phases and least impactful production chain options of the Jatropha based
biodiesel production system. The task was performed by the ISO14040 to 43 standard
guidelines’ framework. Data was gathered from literature and questionnaires submitted to
major investors. The impact assessment resourced to the code SimaPro®, adopting
IMPACT2002+ and Ecoindicator99 as assessment methods.
The results’ comparison base is the equivalent fossil system. Both indicators point to savings
in GHG emissions, better energetic efficiency and less harm to the ozone layer.
Eutrophication and acidification potential are aggravated. Main environmental stressor are
fertilizers in all cases. Revenues from by product use depend on the environmental category
and the use itself. Replacing fossil energy sources with processed seed cake revealed to be of
clear advantage. On the contrary, involving more transportation in the biodiesel chain is
disadvantageous.
Conclusions are, however, constrained by inherent limitations of LCA methodology. In
addition, the incipient state of development and knowledge of the Jatropha biodiesel system
enhances difficulty to attain reliability and little uncertainty.

v
LIST OF ABREVIATIONS
CFC-11 – Trichlorofluoromethane
CV – Coefficient of variation
DALY - Disability ajusted life years
FU – Functional unit
GHG – Green house gas
GWP – Global warming potential
HC – Hydrocarbons
JME – Jatropha methyl-ester
LCA – Life cycle assessment
LCI – Life cycle inventory
LDPE – Low-density polyethylene
LHV – Low heating value
NEG – Net energy gain
NER – Net energy ratio
ODP – Ozone depletion potential
PDF – Potentially disappeared fraction
PM – Particulate matter
POME – Palm oil methyl-ester
RME – Rape methyl-ester
SD – Standard deviation

vi
TABLE OF CONTENTS
1. Introduction .............................................................................................................. 1 1.1. Energy and biodiesel ........................................................................................ 1 1.2. Jatropha curcas L. cultivation and biodiesel production ................................. 3 1.3. Problem statement ............................................................................................ 7 1.4. Life cycle assessment: state of the art .............................................................. 8
1.4.1. Goal and scope definition ......................................................................... 9 1.4.2. Inventory analysis................................................................................... 10 1.4.3. Impact assessment and impact categories .............................................. 10 1.4.4. Uncertainty analysis ............................................................................... 13 1.4.5. Result interpretation ............................................................................... 13
2. Methodology........................................................................................................... 14 2.1. Goal and Scope............................................................................................... 14
2.1.1. Goal definition........................................................................................ 14 2.1.2. System function and functional unit ....................................................... 14 2.1.3. System Boundaries and allocation.......................................................... 14 2.1.4. Plantation model and scenarios .............................................................. 18 2.1.5. Data quality requirements, assumptions and limitations ........................ 19 2.1.6. Environmental impact categories and impact assessment methods ....... 19
2.2. Inventory analysis........................................................................................... 22 2.2.1. Data collection........................................................................................ 22 2.2.2. Data treatment......................................................................................... 22 2.2.3. Scenarios................................................................................................. 32
3. Results .................................................................................................................... 37 3.1. Goal and Scope............................................................................................... 37 3.2. System funcion and functional unit ................................................................ 37 3.3. System boundaries.......................................................................................... 37 3.4. Life cycle inventory........................................................................................ 37
3.4.1. Base scenario .......................................................................................... 38 3.4.2. Scenarios................................................................................................. 41
3.5. Impact assessment .......................................................................................... 42 3.5.1. IMPACT2002+....................................................................................... 43 3.5.2. Ecoindicator 99....................................................................................... 52 3.5.3. Energy efficiency.................................................................................... 56 3.5.4. Uncertainty analysis ............................................................................... 58
4. Discussion............................................................................................................... 61 4.1. Methodology................................................................................................... 61 4.2. Life cycle impact assessment results .............................................................. 63
5. Conclusions ............................................................................................................ 68 6. References .............................................................................................................. 70
6.1. Web Resources ............................................................................................... 74

vii
TABLE OF FIGURES
Figure 1 – General equation of the transesterification of tryglicerides (source: Meher et al., 2006)....................................................................................................................... 2 Figure 2 – Average impact of the vegetable oil based biodiesel in exhaust emissions for NOx, particulate matter (PM), CO and hydrocarbons (HC) (source: Dermibas, 2007). ................................................................................................................................ 2 Figure 3 – Left: J. curcas tree (source: worldisgreen.com). Right: details of Jatropha plant – branch, leaf and fruits (source: carboncapture.us) ................................ 4 Figure 4 – Aspects of J. curcas L. cultivation: plantation field on the left (source: www.biofuelsdigest.com) and nursery on the right.......................................................... 5 Figure 5 – LCA methology (source: ISO, 1997) .............................................................. 9 Figure 6 – Basic Jatropha biodiesel production system model (adapted from Achten et al., 2008)..................................................................................................................... 15 Figure 7 – Classic full production system model for Jatropha based biodiesel production....................................................................................................................... 16 Figure 8 – Side-by-side comparison of the production system model (Jatropha biodiesel based) and the reference system model (fossil diesel based) (adapted from: Reinhardt et al., 2007). ................................................................................................... 17 Figure 9 – System boundary expansion to avoid allocation procedures. ....................... 17 Figure 10 – Plantation system model. ............................................................................ 18 Figure 11 – The IMPACT2002+ method framework (source: Jolliet et al., 2003)........ 20 Figure 12 – Base production system model as defined in the SimaPro® project. ......... 23 Figure 13 – Input transport distance estimation protocol. .............................................. 30 Figure 14 – System boundaries for scenario A production model. ................................ 32 Figure 15 – Seed cake to biogas and slurry process scheme. ......................................... 33 Figure 16 – Scenario C system boundaries. The pelletizing of seed cake for electricity generation purposes brings up a different reference system equivalent: electricity from coal........................................................................................................ 34 Figure 17 – Seed cake to pellets to electricity process scheme. ..................................... 35 Figure 18 – Unit process pattern identification belonging to impact assessment charts legend. .................................................................................................................. 43 Figure 19 – Global warming potential according to characterization step of IMPACT2002+ of scenarios compared to reference system per 1FU (total in full and contribution of different processes in stacked patterns). ................................................ 43 Figure 20 - Global warming potential according to damage assessment step of IMPACT2002+ of scenarios compared to reference system per 1FU (total in full and contribution of different processes in stacked patterns). ................................................ 44 Figure 21 – Non-renewable energy consumption according to characterization step of IMPACT2002+ of scenarios compared to reference system per 1FU (total in full and contribution of different processes in stacked patterns). ......................................... 45 Figure 22 - Non-renewable energy consumption according to damage assessment step of IMPACT2002+ of scenarios compared to reference system per 1FU (total in full and contribution of different processes in stacked patterns).................................... 46 Figure 23 – Ozone layer depletion potential according to characterization step of IMPACT2002+ of scenarios compared to reference system per 1FU (total in full and contribution of different processes in stacked patterns). ................................................ 47

viii
Figure 24 - Ozone layer depletion potential according to damage assessment step of IMPACT2002+ of scenarios compared to reference system per 1FU (total in full and contribution of different processes in stacked patterns). ................................................ 48 Figure 25 – Terrestrial acidification and nutrification potential according to characterization step of IMPACT2002+ of scenarios compared to reference system per 1FU (total in full and contribution of different processes in stacked patterns). ....... 49 Figure 26 - Terrestrial acidification and nutrification potential according to damage assessment step of IMPACT2002+ of scenarios compared to reference system per 1FU (total in full and contribution of different processes in stacked patterns). ............. 49 Figure 27 – Land occupation performance according to characterization step of IMPACT2002+ of scenarios compared to reference system per 1FU (total in full and contribution of different processes in stacked patterns). ................................................ 50 Figure 28 - Land occupation performance according to the damage assessment step of IMPACT2002+ of scenarios compared to reference system per 1FU (total in full and contribution of different processes in stacked patterns). ......................................... 51 Figure 29 – Damage potential of climate change according to Ecoindicator99 of scenarios compared to reference system per 1FU (total in full and contribution of different processes in stacked patterns). ......................................................................... 52 Figure 30 – Fossil fuel consumption according to Ecoindicator99 of scenarios compared to reference system per 1FU (total in full and contribution of different processes in stacked patterns)......................................................................................... 53 Figure 31 - Damage potential of on ozone layer according to Ecoindicator99 of scenarios compared to reference system per 1FU (total in full and contribution of different processes in stacked patterns). ......................................................................... 54 Figure 32 – Damage potential of acidification and eutrophication according to Ecoindicator99 of scenarios compared to reference system per 1FU (total in full and contribution of different processes in stacked patterns). ................................................ 55 Figure 33 - Damage potential of land use according to Ecoindicator99 of scenarios compared to reference system per 1FU (total in full and contribution of different processes in stacked patterns)......................................................................................... 56 Figure 34 – Comparison of net energy gain (NEG) of scenarios and reference system. ............................................................................................................................ 57 Figure 35 - Comparison of net energy ratio (NER) of scenarios and reference system. ............................................................................................................................ 57 Figure 36 – High/low interval result chart of uncertainty analysis on IMPACT2002+ LCI assessment. .............................................................................................................. 58

ix
TABLE OF TABLES
Table 1 – Jatropha curcas L. seed oil and methyl-ester (JME) properties comparing to American (ASTM D 6751) and European (EN 14214) standards (adapted from: Oliveira et al., 2009; www.biodiesel.org). ....................................................................... 7 Table 2 – IMPACT2002+ based analysed environmental impact categories at midpoint and damage assessment levels (source: Humbert et al., 2005). ...................... 21 Table 3 – EcoIndicator99 analysed impact categories (source: Goedkoop and Spriensma, 2001). ........................................................................................................... 21 Table 4 – Reported productivities and correspondent land use needed to yield 1ton of seeds. .......................................................................................................................... 25 Table 5 – Nutrient content ratios of different fertilizers with documented use.............. 26 Table 6 – Nitrate leaching and ammonia volatilisation and emission factors (kg/ton seed) from artificial fertilizer application. ...................................................................... 26 Table 7 – Average fertilizer input per age sector (kg/t of seed) (Prueksakorn and Gheewala, 2008; Prueksakorn and Gheewala, 2006; Reinhardt et al., 2008; questionnaires)................................................................................................................ 27 Table 8 - Average fertilizer input for plantation establishment (kg/ha) (Prueksakorn and Gheewala, 2008; Prueksakorn and Gheewala, 2006; Reinhardt et al., 2008) ......... 27 Table 9 – Data for calculating exhaust emissions of driving a Toyota Hilux® for 100Km with biodiesel..................................................................................................... 29 Table 10 – Emission factors of GHG in fossil diesel combustion (source: IPCC, 2006)............................................................................................................................... 29 Table 11 – Emission factors for pellets combustion in power plant. ............................. 35 Table 12 – Fertilizer input during plantation establishment (kg/ha) and cultivation (kg/t seed). ...................................................................................................................... 38 Table 13 – Nitrate and ammonia emissions to water and air, respectively, during cultivation and plantation establishment resulting for NPK application. ....................... 39 Table 14 – Fossil diesel (left) and biodiesel (right) exhaust emissions.......................... 40 Table 15 – Average input transport distances (in tkm) per freight transport mode (1t basis) (Road, Rail and Sea) and per input and standard deviation. ................................ 40 Table 16 – Distances travelled by the biodiesel on its way to Europe (to the ports of Antwerp and Lisbon) through the three transport modes (road, railway and sea) in total km and tkm/FU....................................................................................................... 41 Table 17 – Haulage of seeds a needed to produce 1t of oil in centralized production scenario. .......................................................................................................................... 41 Table 18 – Accounted emissions for pellets combustion in power plant per tne of extracted oil. ................................................................................................................... 42 Table 19 - Haulage of 1 tonne of oil in centralized production scenario. ...................... 42 Table 20 – Uncertainty analysis of 1FU results with 95% confidence interval displaying statistical data: mean, standard deviation (SD) and coefficient of variation (CV)................................................................................................................. 59 Table 21 – Comparison of coefficient of variation (CV) of distribution of 1FU with own uncertainty data defined and without own uncertainty data (undefined). .............. 59

1
1. INTRODUCTION
1.1. ENERGY AND BIODIESEL
Assuring progress and welfare in a growing population and increasingly technological society
has a cost. In an ever-growing demand context, energy production has been facing the challenge
to restructure itself without compromising economic, social and environmental sustainability.
Energy consumption worldwide, in the developed world but also in the emerging economies, is
pushing the limits of supply. Further pressures mount when taking geopolitical matters in
account and as well as environmental issues such as growing greenhouse gas emissions and
natural resource depletion. Statistics predict a 50% increase in worldwide energy consumption
until 2030 with emphasis on non-OECD (Organization for Economic Co-operation and
Development) economies. The most demanded type of fuel would continue to be liquid fuel and
the transportation sector would take up a large part (EIA, 2008). As such associated CO2 would
continue rising.
Fossil fuels account for over 80% of the consumed primary energy worldwide, of which more
than 50% is absorbed by the transport sector (EIA, 2008). The intensive and low-efficient use
of fossil fuels by humans and the yet limited share of renewable energies in the world’s energy
mix has drawn the Oil-Peak closer (Almeida and Silva, 2009). Biofuels present themselves as a
direct and immediate replacement for the liquid fuels used in transport, displaying easy
integration to the logistic systems currently operating (Escobar et al., 2009).
Unlike petroleum, biofuels are a renewable energy source and its feedstock is inexhaustible if
produced sustainably. Domestic production of biofuels helps reducing countries’ dependence
on foreign oil supply and protects their economies from the fluctuating oil prices (Sims, 2002).
In that sense, the European Commission adopted the Biofuels Directive (2003/30/EC) setting
the targets at a substitution share of 2% in 2005 and of 5.75% in 2010. However, biofuels tend
to be more costly than fossil fuels due to additional production costs and its industry has been
possible only in countries where they enjoy governmental support to subsidize those.
Otherwise, most EC countries should miss the Directive’s objectives (Neuwahl et al., 2008).
The current low competitive price per litre of biodiesel relates to factors such as production but
can be attenuated with the right choice of feedstock and optimized technologies (Sims, 2002;
Agarwal, 2007). Even so, many countries seem to attain benefits from biofuel production,
which, therefore, is showing a tendency to rise hand in hand with a growing market demand
(Escobar et al., 2009)

2
Liquid biofuels are chemically different from fossil fuels as they contain oxygen besides carbon
and hydrogen. Therefore, they are considered oxygenates instead of hydrocarbons (Sims, 2002).
Biodiesel is defined as the monoalkyl esters of vegetable oils or animal fats (Dermibas, 2008).
Raw vegetable oil is usually transesterified: its triglycerides are combined with an alcohol and a
catalyst to yield (m)ethyl esters and glycerol. Product recovery involves phase separation and
successful removal of by-products (such as the commercially valued glycerol) and excess
reagents (figure 1). The resulting (m)ethyl esters (depending on the alcohol used) show similar
viscosity and energy values as conventional diesel (Sims, 2002; Dermibas, 2007).
Figure 1 – General equation of the transesterification of tryglicerides (source: Meher et al., 2006)
Biodiesel has been used in the market in different volumetric proportions, namely in blends
between 5% and 20%. It is usually blended with fossil fuels to avoid the need for expensive
engine modification and its chemical composition seams to influence combustion efficiency
and exhaust emissions (Sims, 2002). Lapuerta et al. (2008) reviewed the published work on this
aspect. They concluded that, notwithstanding the disparity of results, most studies point out an
increase of NOx emissions and a remarkable decrease in particulates, CO and hydrocarbons
(aromatic and polyaromatic compounds) (figure 2) (Lapuerta et al., 2008).
Figure 2 – Average impact of the vegetable oil based biodiesel in exhaust emissions for NOx, particulate matter (PM), CO and hydrocarbons (HC) (source: Dermibas, 2007).
Governments, companies, the scientific community and the common citizen are aware of the
need to take action in the liquid biofuels matter. Oil no longer seems a trustworthy path and

3
alternatives are being studied in order to enlighten and sustain the solid future decisions that
need to be made (Dermibas, 2008). It is in this context that options such as biodiesel from
Jatropha curcas L. are being analysed. This system’s viability consideration depends greatly on
its life cycle environmental performance in comparison to fossil fuels.
1.2. JATROPHA CURCAS L. CULTIVATION AND BIODIESEL PRODUCTION
Biofuels relate to growing energy crops subject to intensive agriculture practices. This implies
high inputs of energy, water and fertilizers and large land extension. Therefore, choice of
feedstock for biodiesel is most important in biodiesel’s sustainability because of its impacts on
food prices and environment. So far, edible and non-edible vegetable oils have been the most
attractive feedstock. There are more than 350 oil-bearing crops identified and a wide number of
them and common plants have been studied around the world for the past years (Dermibas,
2007). Recently, Jatropha curcas L. (J. curcas) has drawn attention.
J. curcas, also known as Physic nut (or purgueira in Portuguese), belongs to the Euphorbiaceae
family. This plant seems to be native from Central America, although its phenology is yet to be
completely uncovered. It is commonly grown in the tropics as a living fence. Nowadays it is
distributed pantropically, which gives rise to identification of different accessions. Although
worldwide seed production is yet negligible, it was once produced in considerable amounts in
Cape Verde and exported to Lisbon and Marseille to be used in soap production (Heller, 1996).
Jatropha is adapted to arid and semi-arid conditions and higher temperatures, occurring mostly
in seasonally dry areas. Its introduction has been successful in drier regions of the tropics with
an average annual rainfall of between 300 and 1000 mm, although it also considerable yield can
only be expected with rainfall ≥ 500mm (Achten et al., 2008). Jatropha prefers lower altitudes,
well drained soils with good aeration (heavy and clayish soils prevent best root formation) and
is adapted to marginal lands with low nutrient content (Heller, 1996; Achten et al., 2008).
However, Physic nut is able to grow in areas with unsuitable soil and climate conditions, but
has not proven to have commercially subsistent seed production in these cases. Reasonable
productivity can be attained when an initial boost is given (Jongschaap et al., 2007).
This plant presents itself as a large shrub or small tree, growing up to 5m (figure 3). It has
unisexual flowers and is deciduous, shedding its big leafs in the rainy season. Flowering time
takes places during the hotter seasons. The flowers’ pollination is entomophilic and the
resulting fruit is trilocular and ellipsoidal and usually develops during the winter period. The
exocarp maintains moisture content until the three black ovoid oily seeds mature. At this point

4
(usually 50 to 60 days after anthesis) the fruit color changes from green to yellow. The seeds
retain viability for long periods (Sunder, 2006).
Seeds contain several toxic substances, such as a lectin named curcin, phorbol esters and
trypsin inhibitor. Secondary metabolites variety seems to depend on genetics or the
environment (Makkar et al., 1997). Seed cake and oil are, therefore, non-edible, although there
has been research focused on its detoxification (jatropha.uni-hohenheim.de)
Figure 3 – Left: J. curcas tree (source: worldisgreen.com). Right: details of Jatropha plant – branch, leaf and fruits (source: carboncapture.us)
Jatropha cultivation is considered the first production step of the biodiesel system and is not
well documented (Gour, 2006). Optimum input parameters in given conditions are yet to be
quantified as well as optimum crop and nursery strategies. Since J. curcas is, after all, a wild
plant with wide phenotypic variation, reliable field data is needed to set input levels (Achten et
al.., 2008).
J. curcas reproduces both through seeding and vegetative propagation of branch cuttings. Some
suggest the use of seedlings from nurseries seems to enhance cultivation’s success as nurseries
provide necessary control of environmental factors and allow production of healthy seedlings
(figure 4). Nursery raised seedlings appear to ensue higher survival and better growth then the
direct seed sowing (Kaushik and Kumar, 2008). The caretaker should monitor the seedling’s
quality to keep uniformity at best available quality amid the plantation (Gour, 2006).
Although biotechnological improvement of the Physic nut has not received enough attention,
the use of the available superior genotypes is preferable (Gour, 2006; Mishra, 2009). The matter
of plus phenotypes breeding programs and genetic modification has received increasing
attention. Moreover, phenotypes translate in increased seed yield, oil content and branchiness -
which may be the most important traits in the case of Jatropha as an energy crop (Mishra,
2009).

5
Figure 4 – Aspects of J. curcas L. cultivation: plantation field on the left (source: www.biofuelsdigest.com) and nursery on the right.
Pruning can be carried out from the first year on in order to shape the bush and enhance branch
formation. Setting the plant’s architecture motivates healthy inflorescence and facilitates
canopy management and fruit picking (Gour, 2006; Dias et al., 2007). Additional operations
include weeding and hoeing of the plant’s basin, especially during the establishment period
(Kaushik and Kumar, 2008).
The belief that the plant’s toxicity should be enough to deter parasitism has proved wrong since
there are indeed species that find nutrients in the J. curcas. Different authors have observed
pests and diseases of several types associated with the Physic nut, such as powdery mildew, flea
beetles and millipedes, among others. So far, this has only happened in a regional fashion, but
no wide spread diseases have yet been registered (Dias et al., 2007; Shanker and Dhyani, 2006).
This is expected to change if large commercial plantations emerge (Kaushik and Kumar, 2008;
Gour, 2006).
A Jatropha plantation takes approximately two years to start yielding. However, some authors
state that plants risen from seeds take up to 4 years to yield seeds, in contrast to stem cuttings
that start yielding in less than a year (Sunder, 2006). It is generally assumed that considerable
and stable yields start at 4th-5th year of cultivation (Kaushik and Kumar, 2008). The yield
depends on the soil, rainfall and the plant’s origin (Sunder, 2006). So far, a generic plantation
yield is unknown for lack of systematic reporting (Achten et al., 2008). Data on this matter
ranges from 1.5 to 7.8 tonnes of dry seed ha-1 yr-1 (Jongschaap et al., 2007). Achten et al.
(2008) agreed that reasonable yield should vary from 4 to 5 tonnes of dry seed ha-1 yr-1.
Mycorrhyzal associations in Jatropha’s roots are common and mycorrhiza inoculation proved
to improve biomass production (Tewari, 2007). In general, plants also respond well to small
amounts of calcium and magnesium on acidic soils (Achten et al., 2008).

6
Large scale cultivation requires irrigation. Nursery seedbeds demand water right after sowing
and seedlings require irrigation during their first couple of years of plantation. Afterwards,
hydric demand is contingent to agroclimatic conditions. Jatropha has low moisture requirement
but water can be a limiting factor. Claims suggest that in high precipitation equatorial regions
Jatropha can bloom and yield fruit all year. Drier climates enhance the seeds’ oil content and
extreme draught will cause the trees to leaf shedding (Sunder, 2006; Gour, 2006; Tewari, 2007).
Adrabbo and Atta (2008) have recently studied Jatropha’s response to hydric stress and drew
conclusions that are somewhat more specific. They verify that there are no significant
differences among the values of oil yield and its fatty acid and mineral composition due to
different water stress ratios. However, slightly higher oil yields were attained with irrigation
providing 100% of evapotranspiration potential (considered to be optimal) (Adrabbo and Atta,
2008).
Harvesting should focus on brown and yellow fruits that bear mature seeds. Collection is
manual and is followed by fruit drying, which can be performed naturally or mechanically.
Seed removal is manual or mechanical through a seed decortication. The seeds should be dried
both for sowing (in the shed) or oil (in the sun) purposes (Gour, 2006). Some companies claim
to apply mechanical harvesting similar to that used in olive and coffee plantations
(plantabio.com.br/wp).
Post harvest management is crucial to yield quality and includes aspects such as seed grading
and storage and pruning (Gour, 2006).
The two main methods for extracting the oil from the seeds is pressing or solvent extraction
(commonly with hexane). The yields differ, being much higher with solvent extraction.
Likewise, such is the most energy and input expenditure process and only large amounts of
seeds seem to justify its use (Adriaans, 2006). Adriaans (2006) points out that press attained
Jatropha oil has satisfactory quality so that there is no need in using underdeveloped and
environmental hazardous solvent extraction methods.
Meanwhile, other oil extraction procedures are being developed including as enzyme or
supercritical fluids-supported (Achten el al., 2008). Winkler et al. (2003) obtained satisfactory
results using aqueous proteases in alkaline medium. Shah et al. (2005) added ultrasonication to
the process and increased yields up to 74% in half the time.
Crude Jatropha oil requires refining prior to transesterification, depending on seed quality. The
first pre-treatment step is degumming which consists of heating the oil and adding water and
phosphoric acid (Rietzler and Brandt, 2007; Tobin, 2005). Degumming depletes phosphorus
content through removing phospholipids (Roy et al., 2002). Fuel is selected from the distillate,
dried and again heated with sodium hydroxide for free fatty acid neutralisation. Chemical
requirements depend on gum and free fatty acid content of the oil (Tobin, 2005).
7
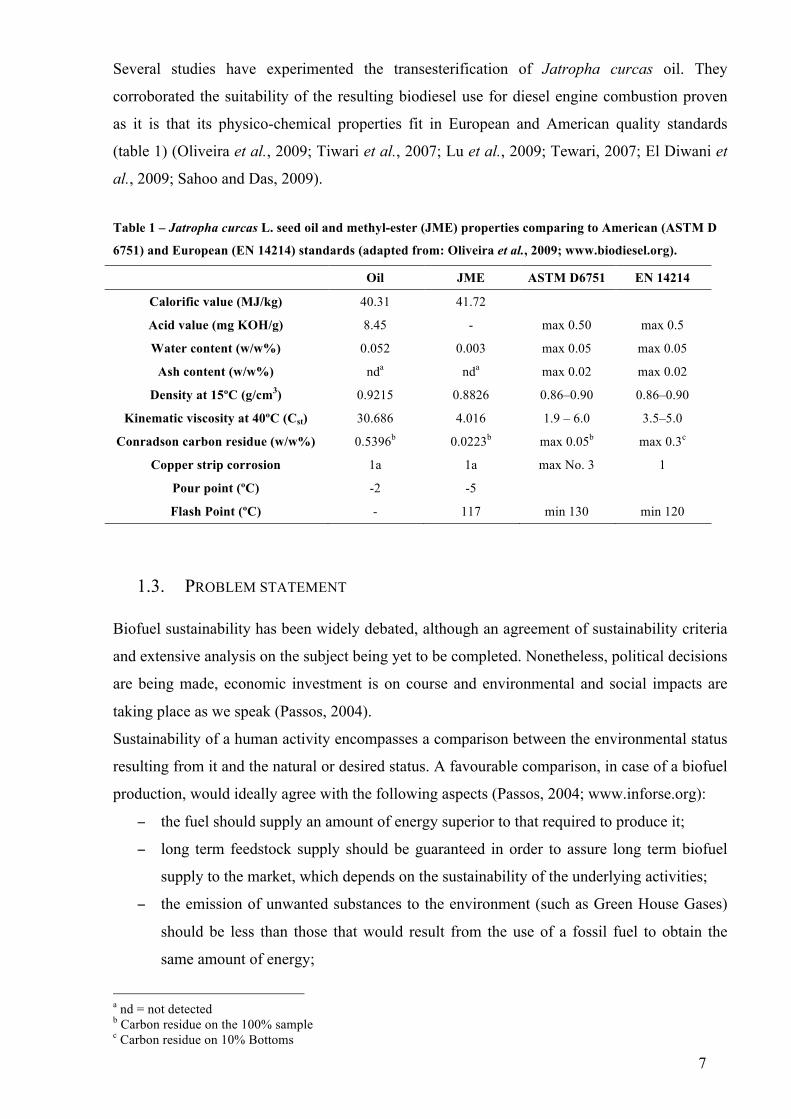
Several studies have experimented the transesterification of Jatropha curcas oil. They
corroborated the suitability of the resulting biodiesel use for diesel engine combustion proven
as it is that its physico-chemical properties fit in European and American quality standards
(table 1) (Oliveira et al., 2009; Tiwari et al., 2007; Lu et al., 2009; Tewari, 2007; El Diwani et
al., 2009; Sahoo and Das, 2009).
Table 1 – Jatropha curcas L. seed oil and methyl-ester (JME) properties comparing to American (ASTM D
6751) and European (EN 14214) standards (adapted from: Oliveira et al., 2009; www.biodiesel.org).
Oil JME ASTM D6751 EN 14214
Calorific value (MJ/kg) 40.31 41.72
Acid value (mg KOH/g) 8.45 - max 0.50 max 0.5
Water content (w/w%) 0.052 0.003 max 0.05 max 0.05
Ash content (w/w%) nda nda max 0.02 max 0.02
Density at 15ºC (g/cm3) 0.9215 0.8826 0.86–0.90 0.86–0.90
Kinematic viscosity at 40ºC (Cst) 30.686 4.016 1.9 – 6.0 3.5–5.0
Conradson carbon residue (w/w%) 0.5396b 0.0223b max 0.05b max 0.3c
Copper strip corrosion 1a 1a max No. 3 1
Pour point (ºC) -2 -5
Flash Point (ºC) - 117 min 130 min 120
1.3. PROBLEM STATEMENT
Biofuel sustainability has been widely debated, although an agreement of sustainability criteria
and extensive analysis on the subject being yet to be completed. Nonetheless, political decisions
are being made, economic investment is on course and environmental and social impacts are
taking place as we speak (Passos, 2004).
Sustainability of a human activity encompasses a comparison between the environmental status
resulting from it and the natural or desired status. A favourable comparison, in case of a biofuel
production, would ideally agree with the following aspects (Passos, 2004; www.inforse.org):
− the fuel should supply an amount of energy superior to that required to produce it;
− long term feedstock supply should be guaranteed in order to assure long term biofuel
supply to the market, which depends on the sustainability of the underlying activities;
− the emission of unwanted substances to the environment (such as Green House Gases)
should be less than those that would result from the use of a fossil fuel to obtain the
same amount of energy;
a nd = not detected b Carbon residue on the 100% sample c Carbon residue on 10% Bottoms

8
− land use should not compromise food production nor the respect for the ecosystem
balance.
Biodiesel life cycle environmental balance has linear dependence on the efficiency of the
agricultural and processing technologies applied (Janulis, 2003) and on the choice of an
effective energy crop as feedstock (Ponton, 2009). To enjoy effectiveness, a crop should be fast
growing, perennial, able to grow on marginal soil and require minimal fertilizer and irrigation
input (Ponton, 2009).
Jatropha curcas L. seems to meet these criteria but solid and intensive scientific information is
still scarce and insufficient to substance valuable strategies. Its potential for socio-economic
development and favourable preliminary results on life cycle urge for better data and far more
extensive studies in order to guide future decisions on this matter (Achten et al., 2007).
1.4. LIFE CYCLE ASSESSMENT: STATE OF THE ART
Life cycle thinking sprung from the need to embrace the wider perspective of a product’s whole
system and evaluate it throughout all stages of its life cycle. Life cycle assessment (LCA)
comprises either a conceptual framework of a set of practical tools (or both) to analyse all the
activities that go into making, transporting, using and disposing of a product. The main
advantage of LCA is in supporting decision making with scientific data and competence
(Jensen et al., 1997). The application of the process and associated waste minimization
practices by management, design and manufacturing can also lead to environmentally better
products as well as less expensive and marketing competitive ones (Ciambrone, 1997).
Modern LCA methodology stands on ISO 14040 to 14043 standards (ISO, 1997). These state
that LCA comprises three main steps:
- inventorying relevant inputs and outputs of a product system;
- evaluating the environmental impacts of those inputs and outputs;
- interpreting results of the previous phases in relation to the study’s objectives.
In a more detailed manner, it is considered that LCA has the following phases: (i) definition of
goal and scope, (ii) inventory analysis, (iii) impact assessment and (iv) result interpretation
(figure 5). There is an iterative relation between these tasks, meaning that during or by the end
of one of them one might need to revise and update the previous. This aspect is transversal to
the entire LCA process (Jensen et al., 1997). These four phases correspond to an LCA’s four
main steps: defining the goal and scope, making a model of the product life cycle with all
inflows and outflows, understanding those inflows and outflows’ relevance and interpreting
results (Goedkoop et al., 2008).

9
Figure 5 – LCA methology (source: ISO, 1997)
1.4.1. Goal and scope definition
Modelling implies simplification, which leads to distortion. Defining goal and scope diminishes
the impact of the distortion in the results (Goedkoop et al., 2008). According to ISO 14040
(1997) standard, the goal of an LCA shall unambiguously state the intended application, the
reasons for carrying out the study and the intended audience. In other words, the goal should
determine the study’s purpose and level of sophistication.
Scope definition assures the setting of borders of the assessment in a manner to ensure the study
is wide and detailed enough to address the stated goal. In defining scope, one must clearly
describe the following items:
- the product system itself and it’s boundaries;
- the system’s function and the functional unit;
- allocation procedures;
- the types of impacts and their assessment techniques to be used;
- data and data quality requirements;
- assumptions and limitations;
- type of critical review, if any;
- required type of report.
The system boundaries set the interface between a product system and the environment or other
systems (Jensen et al., 1997). It will depend on the system’s characteristics and function. So

10
does the functional unit, which represents a quantified performance of the product system for
use as a reference unit in a LCA study (Goedkoop et al., 2008; Jensen et al., 1997).
Allocation means partitioning the input or output flows of a process to the product system
(Jensen et al., 1997). It is to be avoided and can be so through splitting processes in order to
split outputs or extending system boundaries (Goedkoop et al., 2008).
The main limitations of an LCA relate to scale, data quality and the type of conducted analysis
and its final use. Data quality, availability and inaccuracy resulting from assumptions and
modelling, absence of social are forefront problems. The focus on the environmental and the
methodology of LCA imply lack of economical, social and political analysis and also the lack
of temporal dimensions and inability to address localised impacts (ISO, 1997; Guinée et al.,
2001).
Since LCA is an iterative technique, the scope might be subject to modification along the
study’s development as additional information is collected.
1.4.2. Inventory analysis
This phase’s objective is to quantify all relevant inputs and outputs of the product system
through data collection and calculation procedures. Data shall be collected for each unit process
included in the system boundaries. As data are collected constraints to previously stated data
collection requirements and procedures might occur, which implies revisions to the goal or
scope (Jensen et al., 1997).
The framework of LCA relies mostly on system boundary and life cycle inventory and its
interaction with the established goals. These aspects define nature of the study and the spatial,
temporal and production chain limits of the process and list all its components, clarifying inputs
and outputs (Davis et al., 2009). Having settled this, the impact assessment phase can be carried
out.
1.4.3. Impact assessment and impact categories
Impact assessment in LCA is aimed at evaluating the significance of potential environmental
impacts using the results of the inventory analysis. Such is accomplished by associating
inventory data with specific environmental impact categories defined in the scope and
attempting to understand those impacts (ISO, 1997). This phase may include the following
elements:
- environmental impact category definition;

11
- classification – assigning of inventory data to categories;
- characterization – modelling of the data within the impact categories;
- normalization – showing relative contribution from the material production to
each already existing effect;
- weighting – aggregating the results in very specific cases when meaningful (ISO,
1997; www.pre.nl).
Classification all substances are sorted into classes according to the effect they have on the
environment. The aggregation within each class enables the production of an effect score. It is
not sufficient just to add up the quantities of substances involved without applying weightings.
Some substances may have a more intense effect than others may. This problem is dealt with by
applying weighting factors to the different substances (www.pre.nl).
Damage oriented impact assessment methods add a step of damage to human health and
ecosystem quality assessment. The principle consists of using damage functions to establish the
relation between an impact and the damage to human or Ecosystem Quality (Goedkoop and
Spriensma, 2001).
One should note that generally accepted methodologies for consistently and accurately
associated inventory data with potential environmental impacts are still being developed
(Jensen et al., 1997).
1.4.3.1. Global warming
Global warming is in the agenda of the scientific and political community worldwide. This
phenomenon’s main responsible are greenhouse gases (GHG), whose resilient permanence in
the atmosphere leads to the entrapment of heat otherwise dissipated to farther distances from
the earth’s surface. The most significant examples of GHG are carbon and nitrogen oxides,
methane, water vapour and fluorinated compounds (www.epa.gov). The Global Warming
Potential (GWP) measures how much a mass of GHG (in t CO2 eq) can contribute to global
warming (www.grida.no). It is expected that biodiesel should contribute to the reduction of
GHG emissions.
1.4.3.2. Acidification
Acidification results from the atmospheric reaction of emitted NOx and SOx radicals with water,
being the acid products deposited back on the earth’s surface (www.apis.ac.uk). It results either
from the supply of proton (H+) to the environment or from leaching of the corresponding anions
from the concerned system. The potential effects are strongly dependent on the nature of the
receiving ecosystem (Jensen et al., 1997). The acidification potential is measured in SO2 eq.

12
1.4.3.3. Eutrophication
The use of fertilizers in agricultural systems to increase productivity and sustain the soil’s
nutrients may lead to the accumulation of phosphorous or nitrogen in the soil, air and water.
This nutrient enrichment of the ecosystem is an unbalancement and causes biodiversity loss
(toxics.usgs.gov). Its potential can be measured in PO4 eq.
Eutrophication has different effects depending on the ecosystem being aquatic or terrestrial.
Aquatic eutrophication leads to the excessive growth of algae, which decompose and lead to a
general deregulation. In the soil, eutrophication is caused by the deposition of atmospheric
nitrogen compounds and leads to changes in functions and diversity of species (Jensen et al.,
1997).
1.4.3.4. Ozone depletion potential
Ozone depletion is caused by the emission and thropospheric accumulation of halogenate gases,
namely chlorofluorocarbons (CFC). Permanence in the atmosphere renders those gases into
ozone reactive substances which, when transported to the stratosphere, cause the reduction of
the ozone layer (www.esrl.noaa.gov).
Analogously to GWP, the Ozone Depletion Potential (ODP) defines the capacity of a substance
to induce stratospheric ozone layer depletion. The impact of the analysed substance is compared
to the one of trichlorofluoromethane (CFC-11). Therefore, this environmental category is
measured in CFC-11 eq (www.epa.gov).
1.4.3.5. Non-renewable energy and energy analysis
This parameter refers to the energy content of all fossil fuels consumed in the system. It is
expressed in MJ primary non-renewable energy (Humbert et al., 2005).
The fossil energy requirement will be accompanied by a full chain energy analyses in which the
Net Energy Gain (NEG) and the Net Energy Ratio (NER), two indicators of energy efficiency
in biofuels production, will be calculated. NEG measures the difference between the total
energy outputs and the total energy inputs. NER is a ratio of total energy outputs to total energy
inputs (Prueksakorn and Gheewala, 2008).
1.4.3.6. Land Occupation
All economical activities that require land occupation have a potential to cause land degradation
through intensive use. Human usage of land has an environmental impact on soil degradation,
hydrodeficiencies and surplus of artificial and ecotoxic compounds (Koellner and Scholz,

13
2007). Therefore, it is important to take land occupation and use into account when evaluating
environmental impacts.
Land occupation midpoint unit is m2 eq of organic arable land year. Land occupation damage
potential (impact on ecosystem) is measured in Potentially Disappeared Fraction times area
times year (PDFm2yr). This translates into an increased damage with an increase on area size,
occupation time and increase in restoration time for formerly occupied area (Goedkoop and
Spriensma, 2001).
1.4.4. Uncertainty analysis
In statistical terms, uncertainty is a parameter associated with the result of measurement that
characterizes the dispersion of the values of a measured quantity. In an inventory it refers to the
lack of certainty of the inventory components resulting from the data or the way it was dealt
with (IPCC, 2000). It represents, therefore, the lack of knowledge about the true value of a
quantity, appropriateness of a model or methodological decision, etc. (Reap et al., 2008).
Uncertainty analysis ascertains and quantifies the fitness of an LCI result through a systematic
procedure that measures the cumulative effects of input uncertainty and data variability. It
models uncertainties in the inputs to an LCA and propagates them to results. The methodology
can use either ranges or probability distributions do determine uncertainty (Jensen et al., 1997;
Reap et al., 2008). IPCC (2000) recommends that uncertainty information shall not be intended
to dispute the validity of the inventory estimates, but to help prioritise efforts to improve the
accuracy of inventories in the future and guide decisions on methodological choice.
1.4.5. Result interpretation
In accordance with the defined goal and scope, the findings from the previous phases should be
combined and interpreted in order to reach conclusions. These may take the form of
recommendations. Yet again, this process may lead to a revision of goal, scope and inventory
analysis characteristics (Jensen et al., 1997; ISO, 1997).

14
2. METHODOLOGY
2.1. GOAL AND SCOPE
2.1.1. Goal definition
The goal of this study is to evaluate environmental advantages and disadvantages of Jatropha
methyl ester through the identification and quantification of the major environmental impacts. It
aims at contributing to the effort to clarify the Physic nut’s potential as an eligible biodiesel
crop and supporting decision making, thus contributing to environmental optimization of the
agricultural and conversion processes.
The intended audience is scientists and policy makers.
2.1.2. System function and functional unit
This study intends the estimation and quantification of energy balance and environmental
impact of the Jatropha based biodiesel production system, being transportation its end use.
Which means the basic function of the system is transportation.
The adopted functional unit (FU) corresponds to 100 km driven by a Toyota Hilux pickup truck
with diesel engine on local dust roads fuelled by Jatropha biodiesel. According to Fobelets
(2009), one FU corresponds to 18.65 L JME (calorific value of 39.096 MJ/kg and a density of
0.875 kg/L). The equivalent in fossil diesel is 18 L (calorific value of 42.66 MJ/kg and a density
of 0.832 kg/L) (Vandenbempt, 2008).
2.1.3. System Boundaries and allocation
System boundaries are to be defined iteratively throughout production system definition and
inventory elaboration. Since the object of this study is the production of a biofuel, the system’s
axis comprises the agricultural and technological processes that ensure the energy flow from its
photochemical form to the fuel’s end use (figure 6). This means, system boundaries include
crop’s cultivation phase, its preparation and conversion into the fuel and the fuel’s consumption
and necessary transportation and infrastructure of all production stages.

15
Figure 6 – Basic Jatropha biodiesel production system model (adapted from Achten et al., 2008)
A broader production system model includes all inputs and outputs of the process and allows
the mapping of the real boundaries (figure 7). The model was elaborated considering the
following main aspects:
- axial processes from growing Jatropha plants to methyl ester production end use;
- use of by-products;
- production and use of all inputs: materials, machinery and energy;
- intermediate transportation steps.

16
Figure 7 – Classic full production system model for Jatropha based biodiesel production.
This study will comprise the environmental impact comparison of this system with the
analogous fossil based system. This means advantages and disadvantages of Jatropha based
biodiesel will be compared to a reference system based on conventional fossil diesel (figure 8).

17
Figure 8 – Side-by-side comparison of the production system model (Jatropha biodiesel based) and the reference system model (fossil diesel based) (adapted from: Reinhardt et al., 2007).
Utilization of by products, either as energy carriers or not, displace other materials, having
environmental impact implications. In the same way the reference system encloses the fossil
fuel life cycle, it should include the reference substituted products. (Cherubini et al., 2009).
Allocation was avoided by expanding system boundaries. Hence, by-products were kept in the
system and the environmental burdens were compared with their equivalents. Thus, the
production of seed cake as fertilizer subtracted the correspondent amount of artificial NPK
(production and transport) and the production of glycerol discounts for the production of fossil
based glycerine (figure 9).
Figure 9 – System boundary expansion to avoid allocation procedures.

18
2.1.4. Plantation model and scenarios
The base scenario corresponds to a small plantation and a decentralized production unit. The
plantation lifetime mounts up to 20 years on continuous rotation. This means that the plantation
is divided in parcels, each corresponding to an age block, i.e. each parcel bears trees of the
same age and the tree’s ages decrease consecutively (figure 10).
0-1yr 1-2 yr 2-3 yr 3-4 yr 4-5 yr
6-7 yr 7-8 yr … … …
Figure 10 – Plantation system model.
The evolution of a Jatropha based biodiesel economy suggests an increased scale production
and the widening of the market from local use to final product delivery and consumption.
Increasing the complexity of the Jatropha biodiesel system adds up to the environmental
importance of its by-products, namely the seed cake. These relevant aspects of the sustainability
of Jatropha based biodiesel production suggested the following scenarios:
A. use of seed cake for biogas production and slurry to be used as fertilizer
(decentralized perspective);
B. exporting biodiesel to Europe for final use (Antwerp and Lisbon);
C. transport of seeds from small farmers to centralized extraction and
transesterification unit with pelletizing and combustion of seed cake for electricity
production;
D. transport of seeds from small farmers to centralized extraction and
transesterification unit with seed cake being for use as fertilizer;
E. transport of oil from farmers to centralized transesterification unit.
Detailed description of each scenario, as well as their inventory analysis, is described in section
2.2.3.

19
2.1.5. Data quality requirements, assumptions and limitations
Data sources vary from scientific literature, to on-field collected data and questionnaires
proposed to companies and scientists working with Jatropha plantations and Jatropha biodiesel
production units in several points of the world.
The main limitation appears to be data scarcity and geographical and temporal scale constraints.
Gaps induce generalization and assumptions that lead to uncertainty. In addition, data from
libraries (Ecoinvent, etc.) available from the LCA performing software have geography
contingency not always coincident with the geographic span of this LCA. This leads to
incongruence in technological level, energy mixes, etc..
Reap et al. (2008) suggest that site-generic LCA’s, such as this, admit inaccuracy for its lack of
spatial information and the intrinsic assumption of globally homogeneous effects. Except for
global warming and ozone layer depletion, the other analysed environmental stressors are
influence by spatially variable phenomena. Regional scales require spatial information to
accurately associate inputs with the variable sensitivity of environments.
Some basic assumptions were made, funded with on-field experience and literature:
- weeding and harvesting are done manually;
- irrigation is merely life-saving;
- power sources follow the regional energy mix – liquid fossil fuels for transportation and
industrial practices and coal for electricity generation (IEA, 2008);
- in the nursery stage seedlings are grown in polybags;
- collected data defined by an interval have a normal (Gaussian) distribution.
2.1.6. Environmental impact categories and impact assessment methods
This LCA focuses on five main environmental impact categories related to the two basic
environmental fluxes in the production system – energy and emissions – and land occupation.
Two methods were chosen to assess those categories, having each one of them different
approaches to the inputs to the ecosystem and, therefore, different final categories. Choosing
two distinct indicators allows knowing whether they influence the conclusions or not.
The life cycle’s environmental impact assessment was carried out with SimaPro® (PRé
Consultants, The Netherlands). Two impact assessment methods were used: IMPACT2002+
and Ecoindicator99. Their approach to the named generic impact categories is distinct, both at
characterization and at damage assessment steps.

20
2.1.6.1. IMPACT2002+ Method
This methodology combines a midpoint/damage approach. Its framework groups life cycle
inventory (LCI) results with similar impact pathways into midpoint categories. A midpoint
indicator characterizes the elementary flows and other environmental interventions that
contribute to the same impact. These are further ahead allocated to one or more damage
categories, which represent quality changes of the environment. A damage indicator result is
the quantified and simplified representation of this quality change (figure 11) (Jolliet et al.,
2003).
Figure 11 – The IMPACT2002+ method framework (source: Jolliet et al., 2003)
Midpoint characterization scores are represented in kg-equivalents of a substance compared to
the reference system. While damage characterization factors of any substance are obtained by
applying a characterization factor to the midpoint characterization potentials. The yield is a
damage score with a greater uncertainty than that of midpoint indicators (table 2). Its units vary
according to the type of damage category: DALY’s (Disability Ajusted Life Years) regarding
human health, PDFm2yr (Potentially Disappeared Fraction of species per m2 per year) to
measure the impacts on ecosystems and MJ for resources. Interpretation can be made either at
the midpoint or damage stage (Humbert et al., 2005).
Table 2 depicts the categories analysed through this method in characterization and damage
assessment.

21
Table 2 – IMPACT2002+ based analysed environmental impact categories at midpoint and damage assessment levels (source: Humbert et al., 2005).
Impact Category Midpoint (characterization) unit
Damage assessment unit
Global Warming kg CO2eq kg CO2eq
Terrestrial Acidification/Nitrification kg SO2eq
Land Occupation m2 eq org arable year PDF.m2.yr
Ozone Layer Depletion kg CFC-11eq DALY
Non-Renewable Energy MJ primary fossil energy MJ
Global warming, terrestrial acidification/nitrification and ozone layer depletion are based on
emissions to air only.
2.1.6.2. EcoIndicator99
This method also allocates impacts into damage categories (Human Health, Ecosystem Quality
and Resources). They result from the addition of impact category indicator results are
calculated in the characterisation step and added into damage categories (table 3). This damage
assessment step precedes normalisation on a European level. The core of the EcoIndicator99 is,
nevertheless, the weighting step (Goedkoop and Spriensma, 2001; www.pre.nl).
Table 3 – EcoIndicator99 analysed impact categories (source: Goedkoop and Spriensma, 2001).
Impact Category Damage assessment unit
Acidification/Eutrophication
Land Use PDF.m2.yr
Ozone Layer
Climate Change DALY
Fossil fuels MJ surplus
2.1.6.3. Monte Carlo Uncertainty Analysis
In SimaPro®, the Monte Carlo code is used to calculate the uncertainty range of an inventory
result based on the uncertainty information contained in the data set. The statistical principle
relies on repeating the calculation many times and each time a random value is chosen for each
flow, for example an emission or raw material input. The resulting range of all calculation
results form a distribution from which uncertainty information can be derived with basic
statistical methods (www.pre.nl).
The Monte Carlo procedure has some limitations, namely disregarding the correlation influence
on uncertainty. For instance, it is frequent that the input and output of a process (and thus the

22
correlated uncertainty) are dependent upon each other. However, being treated as independent
in uncertainty analysis tends to overestimate the uncertainty level of the real process (Scipioni
et al., 2009). In addition, raw data from libraries such as ecoinvent include cumulative
uncertainty ranges which add up uncertainty of the practitioner inventory (Frischknecht and
Rebitzer, 2005).
2.2. INVENTORY ANALYSIS
2.2.1. Data collection
Gathered data proceeds from:
- literature, mainly from previously done Jatropha based biodiesel life cycle analysis;
- questionnaires submitted to institutions currently planting Jatropha in several global
locations.
Data obtained from published scientific literature ended up being the main source for input and
output modelling, since the few retrieved questionnaires were incomplete. For this reason, the
information provided by the institutions served mainly to corroborate literature data and to give
an insight on plantation practices taking place.
Transport, energy sources, land and infrastructures processes were inputted from libraries
available in SimaPro®. The library inventoried data to which this analysis most frequently
recurred are included in Ecoinvent (Swiss Centre for Life Cycle Inventories, Switzerland),
BUWAL 250 (Swiss Department of the Environment, Transport, Energy and Communications,
Switzerland) and ETH-ESU 96 (Swiss Federal Institute of Technology Zurich, Switzerland).
2.2.2. Data treatment
Conducting a generic LCA entailed generic data. Hence, collected data was statistically treated
so as to obtain means and standard deviations.
Translating the production model in a SimaPro® project implicated the building of blocks
meaning unitary processes. Defining each unitary process required defining inputs of materials
and/or energy and/or other processes, either obtained from collected data or contained in the
libraries. Thus, data treatment was performed grouped into those interfeeding building blocks,
(figure 12).
Data calculation and input in the SimaPro® software was done as a function of the main output
of each main process (e.g. field preparation and plantation establishment inputs were calculated

23
per hectare, nursery inputs were calculated per seedling, cultivation inputs were calculated per
tonne of seed, etc.). The interconnection of the processes is chain-like and therefore relied on a
process output being the input of the following process. In this way, calculations were
simplified and the narrowing of the demanded amounts is only done when retrieving the final
process (biodiesel use in the truck) that sums up the functional unit.
Figure 12 – Base production system model as defined in the SimaPro® project.
For calculation procedures, it was assumed a spacing of 2x2m corresponding to 2500 plants/ha
(Tewari, 2007).

24
All infrastructure and machinery inputs, both at production and transport level, were retrieved
from the available libraries in SimaPro®. Inputs defined by quantity (p) were inventoried
according to their usage, i.e. their functional unit (either lifespan, capacity, etc.) was reduced to
the product system’s aim.
For instance, the inventoried tractor has a 7000 h lifespan. The questionnaires indicated 6 h/ha
of tractor usage for field preparation. Therefore, the inventory accounts for 8.6x10⁻⁴ p tractor/ha
of prepared field. Analogous reasoning was made for every infrastructural and transportation
equipment.
2.2.2.1. Polybags
Polybags are made of low density polyethylene (LDPE) and generally produced by blow
extrusion (www.iqsnewsroom.com). This process (all inputs included) is depicted in the
libraries.
Calculating the mass of one polybag:
− LDPE density = 0.93 g/cm3 (Klyosof, 2007);
− Assumed thickness of 0,05 cm;
− 10 x 20 cm dimensions (Tewari, 2007).
2.2.2.2. Field
Field preparation practices were qualitatively well described in the questionnaires. Based on
their information, operations such as levelling and ploughing taking 6 h/ha using a tractor were
taken in account.
The amount of land needed to produce 1 tonne of seeds was calculated based on literature data
(table 4).

25
Table 4 – Reported productivities and correspondent land use needed to yield 1t of seeds.
Reference Yield (t seed/ha) ha/t seed
Prueksakorn and Gheewala, 2006 6,000 0,167
Prueksakorn and Gheewala, 2008 5,466 0,183
Shukla, 2006 4,940 0,202
Tobin, 2005 6,900 0,145
Reinhardt et al., 2008 2,382 0,420
1,418 0,705
Fobelets, 2009 1,695 0,590
5,484 0,182
Mean 0,324
SD 0,219
Land is inventoried in the databases.
2.2.2.3. Irrigation
As depicted in the stated assumptions, irrigation is merely life saving, however needed in the
nursery. From literature and questionnaires, is possible to conclude that irrigation during the
plantation life is not frequent and of difficult determination and is provided either by
precipitation or, most commonly, by pumping. Therefore, one library entry that covers the
irrigating process comprising equipment, energy expenditure and water quantities was used as
an input on nursery stage.
2.2.2.4. Fertilizers
Fertilizer use was calculated from literature and retrieved questionnaires and on a per tonne of
seed basis. The different types of fertilizer reported and its amounts were converted into the
fundamental elements: nitrogen (N), phosphorous (P) and potassium (K). The specific yield
associated with that fertilizer use was taken into account. Hence, the specific N, P and K
amounts of each fertilizer were taken into account (table 5).

26
Table 5 – Nutrient content ratios of different fertilizers with documented use.
Fertilizer N P and K content factors Reference
NPK (x:y:z) %N = x %P2O5 = y P = 0.44xy %K2O = z K = 0.83xz
DAP N/DAP = 0.18 P/DAP = 0.2
Jenssen, 2003; Wood and Cowie, 2004
Urea N/Urea = 0.46 Jenssen, 2003; Wood and Cowie, 2004
Rock phosphate P/Rock phosphate = 0.15 Pierzynkski et al., 2005
KCl K/KCl = 0.61 Alley and Wyser, 2005
Whenever mentioned, seed cake was equated as NKP, being 1 kg of seed cake equivalent to
0.15 kg of NPK (Prueksakorn and Gheewala, 2008).
Emissions resulting from N fertilizer application both in the plantation establishment and the
cultivation phases were attained and included in the product system designed in SimaPro® as
emissions to air and to water (table 6). Thus, nitrate leaching and ammonia volatilization were
accounted as emissions to water and air, respectively (IPCC, 2006).
Table 6 – Nitrate leaching and ammonia volatilisation and emission factors (kg/t seed) from artificial fertilizer application.
Emission factor Reference
Water NO3 0.3 IPCC, 2006
Air NH3 0.1 IPCC, 2006
Table 7 summarizes calculation of average N, P and K amounts per tree age sector and for the
entire cultivation lifetime.

27
Table 7 – Average fertilizer input per age sector (kg/t of seed) (Prueksakorn and Gheewala, 2008; Prueksakorn and Gheewala, 2006; Reinhardt et al., 2008; questionnaires).
Tree age N P K
0 1 - - -
1 2 64.33 12.03 43.71
2 3 119.92 19.75 105.82
3 4 77.78 58.05 77.59
4 5 75.94 20.81 31.44
5 6 31.51 5.67 18.11
6 7 36.26 6.09 18.54
7 8 29.69 10.32 21.22
8 9 29.41 10.29 21.20
9 10 29.41 10.29 21.20
10 11 29.41 10.29 21.20
11 12 29.41 10.29 21.20
12 13 29.41 10.29 21.20
13 14 29.41 10.29 21.20
14 15 29.41 10.29 21.20
15 16 29.41 10.29 21.20
16 17 29.41 10.29 21.20
17 18 29.41 10.29 21.20
18 19 29.41 10.29 21.20
19 20 29.41 10.29 21.20
Mean 39.65 13.39 28.86
SD 24.44 11.39 22.79
First year fertilizer application was included in the establishment phase and calculated based on
documented NPK inputs for first year (table 8).
Table 8 - Average fertilizer input for plantation establishment (kg/ha) (Prueksakorn and Gheewala, 2008; Prueksakorn and Gheewala, 2006; Reinhardt et al., 2008)
N P K
112.05 49.30 93
64 14.08 13.28
48 8.36 43.99
Mean 74.68 23.91 50.09
SD 33.33 22.17 40.21

28
2.2.2.5. Pesticides
Pesticide use was not documented in the collected literature, but thoroughly mentioned in the
questionnaires. Different commercial products were mentioned such as Kung Fu, Karate and λ-
cyhalothrin. All of these compounds are pyrethrins (WHO, 2003) and were, therefore, defined
in the production model as pyrethroid compounds.
2.2.2.6. Extraction
The extraction phase takes place in an oil mill listed in the databases. Its use was gauged
adapting its capacity to the intended size, as previously described. The mills functioning
uptakes 0.614 kWh/kg JME of electrical power (Reinhardt et al., 2008). Cold pressing was
assumed, which avoids the need for steam generation.
Documented oil extraction efficiency is 16.32% (Achten et al., 2008).
2.2.2.7. Transesterification
It was consider that this part of the product system took place in a facility represented by a
vegetable oil transesterification plant from the ecoinvent database. Its use was gauged adapting
its capacity.
Establishing inputs of reagents and energy at the transesterification was funded on the
following data:
− methanol/oil ratio = 0.2 (Achten et al., 2008);
− methanol recovery ratio = 0.739 (Fobelets, 2009);
− NaOH/oil ratio = 0.0084 (Fobelets, 2009);
− transesterification efficiency = 97% (Achten et al., 2008);
− glycerol output = 180.247 kg (SD=56.52) (Fobelets, 2009);
− electricity expenditure in transesterification process = 0.42 kWh/kg JME (Reinhardt et
al., 2008).
2.2.2.8. End use
End use includes exhaust emissions and the life cycle of the vehicle. Vehicle and emissions data
were use both in the end use phase of the product system and the reference system.
The most approximate vehicle to a Toyota Hilux® listed in the libraries was a passenger car. Its
inventory was affected to the lifespan of 1FU (100 km), considering:
− average vehicle lifespan of 13 yr (www.dot.gov/new/index.htm);
− average mileage of a displaced car of 18000 km/yr (Hans et al., 1992).

29
2.2.2.9. Exhaust emissions
Exhaust emissions are the main contributors for GHG emission during a vehicles life cycle
(Chapman, 2007). Hence, generic biodiesel exhaust emissions where calculated for CO, CO2,
CH4, N2O, hydrocarbons (HC), NOx and particulates (PM). CO, HC, NOx and PM emissions
were admitted as the standards for the considered vehicle (tables 9). In addition, IPCC (2006)
supplies emission factors for use of fossil diesel in diesel engine for CO2, CH4 and N2O (table
10).
Carbon derived emissions were excluded from the production system analysis, seeing that
biomass development uptake in the cultivation phase should neutralize them, i.e., the carbon
neutral perception of the biomass lifecycles.
Table 9 – Data for calculating exhaust emissions of driving a Toyota Hilux® for 100Km with biodiesel.
Fossil diesel standard emission for Toyota Hilux® (g/km)
Change to biodiesel
CO 0.013
HC 0.001
NOx 0.312 +10%
PM 0.039 -45%
Reference www.toyota-europe.com Dermibas, 2007
Table 10 – Emission factors of GHG in fossil diesel combustion (source: IPCC, 2006).
Emission factor (kg/TJ)
CO2 74100
CH4 3.9
N2O 3.9
2.2.2.10. Transport
Freight transport occurs between nearly every two steps of a product system and is often of
major importance in a LCA. Environmental intervention of transportation steps occurs by
vehicle manufacture, operation and disposal and by transport infrastructure (roads, railways,
ports, etc.) (Spielmann and Scholtz, 2005). Either road, rail or water freight transport entries
listed in Ecoinvent include manufacture, maintenance and disposal of vehicles plus
infrastructure.

30
Being a generic life cycle assessment, referring not to any sole specific cultivation and biodiesel
production location but to a general model, the transportation distances taken into account in
this study deserved special attention. In this sense, a protocol was elaborated in order to
establish generic transport data to include in the LCI (figure 13).
Figure 13 – Input transport distance estimation protocol.
This study focused transport issues mainly on input transportation from production/distribution
points to plantation sites. The considered inputs were: fertilizers, pesticides, cultivation
machinery, methanol and sodium hydroxide.
The protocol ran as follows:
1. Several known significant Jatropha plantation were located and visualized through
geographic information systems software and grouped by countries.
2. For each country, the local availability of each input was verified through FAO (2006)
statistical services and extensive Internet search (see annex for tables).
a. If local production of the input is assured, the main city/commercial centre of the
country (or state, in the case of large nations such as India or Brazil) was
assumed as the provenance of the input;

31
b. If not produced locally, the nearest main international seaport was considered the
first order provenance of the input and localized (www.worldportsource.com).
3. For inputs not produced locally, an extensive Internet search was made in order to
determine the world’s main producer/supplier and where its main production facility is
located. Its nearest seaport (often coincident with the production facility location) served
as the second order provenance of the input (see appendices for tables).
4. Distances were calculated between plantation sites and the provenance sites for each
output or the nearest main city/sea port.
a. Road distances were calculated through web mapping services. The Google
Earth© (Google Inc., California, USA) and the Microsoft Visual Earth©
(Microsoft Corporation, Washington, USA) frameworks were both used,
although Microsoft’s tool was preferred due to worldwide availability of
information, which Google Earth© did not provide (maps.live.com;
maps.google.com).
b. Sea distances were calculated by World Shipping RegisterTM online distance
calculator tool (e-ships.net/dist.htm).
5. The Physic nut is the main feedstock for biodiesel production in India (Gonsalves, 2006)
and many of the known plantations are located there. In that nation, rail transport is the
most representative of the modal split (www.indianrail.gov.in). Hence, the distances
measured within its borders were attributed to rail freight transport and each input was
considered to travel both by rail and road in the same percentage as the sum of Indian
distances take in the sum of the total measured distances:
2.2.2.11. Fossil diesel
Defining in SimaPro® the fossil diesel consumption required to fulfil 1FU was served by the
available libraries. The selected processes for fossil diesel chain modelling were:
− crude oil production and transport;
− diesel production in refinery;
− diesel distribution and local storage.
Mass of crude oil needed to yield the sufficient amount of diesel to 1FU was determined
considering a conversion efficiency from crude oil to diesel of 88% (Svensson et al., 2007).

32
2.2.3. Scenarios
2.2.3.1. Scenario A
This scenario modelled the production of biogas from J. curcas seed cake by anaerobic
digestion and the return of the resulting slurry to the field to serve as fertilizer. This motivates
redefinition of system and reference systems’ boundaries in order to embrace the added process.
Hence, the by-products, biogas and slurry, and their functionally equivalent products were
included to the systems’ expanded boundaries (figure 14).
Figure 14 – System boundaries for scenario A production model.
It was estimated that the anaerobic digestion of 1kg seed cake yields an average of 0.394 m3 of
biogas (SD = 0.14) (Chandra et al., 2006; Achten et al., 2008) and 0.25 kg of slurry (Fobelets,
2009). The yielding biogas should be expected to exhibit circa 55% methane (Visser and
Adriaans, 2007), fitting the admittedly normal characteristics of biogas with density = 1.2
kg/m3 and low heating value (LHV) = 5-7 kWh/m3 (Speight, 2008).
It was, therefore, determined that the biogas production of seed cake yields:
− 1038.9 m3 biogas/t oil;
− 659.7 kg slurry/t oil.
The process of biogas production (figure 15) included an anaerobic digestion plant for
agricultural feedstock from the libraries.

33
Figure 15 – Seed cake to biogas and slurry process scheme.
Biogas production from seed cake implies avoiding the production of biogas and slurry
functionally equivalent products: natural gas and artificial fertilizer (NPK), respectively. It is
assumed that the slurry has approximately the same nutrient content as the seed cake (Fobelets,
2009), which means that 1 kg of slurry equals 0.15 kg of NPK. Moreover, the natural gas
should be energetically equivalent to the produced biogas and it is know that its LHV is 34.6
MJ/m3 (bioenergy.ornl.gov). Hence, the amounts of avoided NPK and natural gas were
calculated as follows:
2.2.3.2. Scenario B
This scenario replaced local consumption of J. curcas biodiesel for a situation of biodiesel
exporting and consumption in Europe. Two end-use European locations were chosen: Belgium
and Portugal.
Hence, the transport steps protocol previously described (see section 2.2.2.10) was resumed
with the subsequently described steps.
6. Main international seaports were identified for every country with known Jatropha
plantation (see step 2b, section 2.2.2.10) (www.worldportsource.com) (see appendices
for complete list). The road distances between the ports and the plantations they serve
where calculated and the same partition logic between rail and road transport was
considered.
7. Sea distances between Antwerp (Belgium) and Lisbon (Portugal) and every seaport
identified so far were measured and an average distance for each of those two locations
was determined (e-ships.net/dist.html).

34
The biodiesel should take the three forms of transportation to reach its destination. The
environmental burdens of transporting the biodiesel to Europe were attributed to the end-use
phase.
2.2.3.3. Scenario C
Centralized production, assessed in this scenario, implied the transport of seeds to a main city
for oil extraction and refining and JME production. The energy content is used through
pelletizing and combustion for electricity generation (figure 16).
Figure 16 – Scenario C system boundaries. The pelletizing of seed cake for electricity generation purposes brings up a different reference system equivalent: electricity from coal.
Once again, the same judgment and tools described in the transport steps protocol were used in
order to calculate road and rail distances between the plantations and the main cities in their
countries/states. Oil extraction is, in this manner, burdened with the seed’s haulage from the
field to the mill.
Further, the production of seed cake pellets and its energetic potential was modelled per tonne
oil. The process consists of treat the seed cake in an electrical pelletizing machine and using
them as biomass feedstock in a power plant (figure 17). Pelletizing and burning of J. curcas
seed cake is not well document, thus generic biomass treatment and combustion inputs
available in literature were used.

35
Figure 17 – Seed cake to pellets to electricity process scheme.
Per tonne of extracted oil, 2.639 t of seed cake is produced, which would yield the same mass
of pellets. Besides pelletizing machinery and its power requirements, the essential input in this
scenario is how much fossil-generated electrical power is avoided. This was calculated knowing
the energy content of the pellets and constraining it with combustion efficiency:
In which:
− pellet LHV = 16.15 MJ (Achten et al., 2008; Openshaw, 2000; Gunaseelan, 2009);
− combustion efficiency = 30% (van den Broek et al., 1996).
Seed cake combustion emissions are unknown (Reinhardt et al., 2007). Nonetheless, generic
biomass combustion emissions in power plants documented in several sources were considered
in the inventory (table 11).
Table 11 – Emission factors for pellets combustion in power plant.
Substance Emission factor Reference
SO2 0.48 g/kg Reddy and Venkataraman, 2002
PM 30 mg/MJ Nussbaumer et al., 2008
NOx 47 g/GJ Tariq and Purvis, 1996
2.2.3.4. Scenario D
This scenario is coincident with C, except for the seed cake’s fate: as an alternative to an energy
carrier, it is used as fertilizer as in the base scenario. The credits for avoiding the use of

36
artificial NPK are accounted for, but not the carrying to the fields, for it is application site(s) is
unknown and falls out the borders of the system. Such as in scenario C, a transportation of
artificial fertilizer to the Jatropha fields is added.
2.2.3.5. Scenario E
The last scenario stays in the centralized biodiesel production perspective. However, in this
case, oil extraction is done locally, the oil is directed to the production centre to be
transesterified and seed cake is used locally as a fertilizer. Hence, the only alteration regarding
the base scenario is adding an extra transportation step between the Jatropha farms and a main
city. The distances were calculated in the exact same manner as in scenario C.

37
3. RESULTS
3.1. GOAL AND SCOPE
Goal and scope definition results are as present in section 2.1.1.
3.2. SYSTEM FUNCION AND FUNCTIONAL UNIT
System function and functional unit results are as present in section 2.1.2.
3.3. SYSTEM BOUNDARIES
System boundaries have been previously define in section 2.1.3.
However, the approach to seed cake use as fertilizer was revised after questionnaire replies’
examination. Leading investors in Jatropha cultivation for biodiesel production pointed out that
returning of seed cake to the plantation is not a common practice, not even in small out-growers
systems. It was, therefore, considered that seed cake is available for vicinity field fertilization
but not the studied plantation. Hence, seed cake production does displace artificial fertilizer
fabrication and transport. The seed cake is credited in the overall balance for replacing artificial
fertilizer availability (production and transport) but its application falls out the system. System
boundaries are not altered but the extent to which seed cake production grants credits in
environmental balance is.
3.4. LIFE CYCLE INVENTORY
Life cycle inventoried results are displayed as introduced in SimaPro® and in the same logic as
carried out in section 2.1.4.

38
3.4.1. Base scenario
3.4.1.1. Polybags
One polybag weighs 32.85 g.
3.4.1.2. Field preparation
The tractor would work for 6 h/ha, which means 60 km of working distance.
It was also added a shed with 20 m2 from the databases, with the purpose of material storage.
Based on the yields documented in literature and questionnaires, it was estimated an average
0.324 ha of land to produce 1 t of seed (SD=0.22) (table 4, section 2.2.2.2). Occupied land area
is inventoried in databases.
3.4.1.3. Irrigation
Irrigation in the nursery consisted of 5 L per seedling (Maes et al., 2009).
3.4.1.4. Fertilizers
Known first year (plantation establishment) fertilizer inputs were treated separately from the
following years of cultivation and included in field preparation. Table 12 shows total of
fertilizer input in elemental forms (N, P and K) both in establishment and cultivation phases.
Table 12 – Fertilizer input during plantation establishment (kg/ha) and cultivation (kg/t seed).
N P K
Mean 74.68 23.91 5.09 Establishment
SD 33.33 22.17 40.21
Mean 39.65 13.39 28.86 Cultivation
SD 24.44 11.39 22.79
Cultivation figures are approximate to Achten et al. (2008) theoretical uptake needs of 14.3-
34.3 kg N and 14.3-31.6 kg K per ha for a 1t/ha productivity. Phosphorus inputs exceed that
deliberation which sets the maximum at 7 kg/ha.
Each step of fertilizer application had a correspondent set of water and airborne emissions
(table 13).

39
Table 13 – Nitrate and ammonia emissions to water and air, respectively, during cultivation and plantation establishment resulting for NPK application.
kg emmited
Emission factor Cultivation (/t seed) Establishment (/ha)
Reference
Water NO3 0.3 11.9 22.4 IPCC, 2006
Air NH3 0.1 3.97 7.47 IPCC, 2006
3.4.1.5. Pesticides
The questionnaires’ participants practice suggested an application of 0.63 g of pesticide per
tonne of seed.
3.4.1.6. Extraction
In this step, besides the infrastructural component previously mentioned, it was defined an
electricity expenditure of 596.86 kWh/t oil and an output waste sludge of 80 kg/t oil (Reinhardt
et al., 2008). The feedstock is 3.64 t of seeds.
The resulting seed cake was represented as 395.85 kg of avoided NPK production and transport.
3.4.1.7. Transesterification
All depicted inputs and outputs are shown in a per t JME basis:
− methanol input = 5.38x10⁻² kg;
− NaOH input = 8.63x10⁻³ kg;
− electricity expenditure = 420 kWh;
− 1.03 t oil.
The glycerine output was represented as 180.47 kg of avoided glycerine (Fobelets, 2009).
3.4.1.8. End use
The vehicle unit (p) was partially included in the end use process in form of a fraction
calculated as .
3.4.1.9. Exhaust emissions
Exhaust emissions from biodiesel and fossil diesel combustion were accounted for in both
analysed systems and burdened the end-use phase (table 14).

40
Table 14 – Fossil diesel (left) and biodiesel (right) exhaust emissions.
Fossil diesel Biodiesel
g/km g/km
CO 1.3 NOx 0.3432
HC 0.1 PM 0.02145
NOx 0.312
PM 3.9
CO2 0.463
CH4 2.5x10⁻⁵
N2O 2.5x10⁻⁵
As previously mentioned, C-derived emissions were left out of biodiesel system assuming the
neutrality of the carbon cycle.
3.4.1.10. Transport
The execution of distance calculation protocol generated a data set with high variability (table
15). Sea travelled routes are naturally longer, while rail distances are shorter. The distinct
courses each input takes are due solely on its local availability and the location of the main
international supplier.
Table 15 – Average input transport distances (in tkm) per freight transport mode (1t basis) (Road, Rail and Sea) and per input and standard deviation.
Road (tkm) Rail (tkm) Sea (tkm)
Mean SD Mean SD Mean SD
Methanol 259.25 551.01 1004.15 716.05 8138.96 5293.04
Fertilizers 251.04 539.02 986.37 986.37 10423.23 6098.37
Pesticides 504.98 551.01 52.42 191.82 12717.99 3478.99
Tractor 471.52 532.49 54.92 191.82 13780.65 7593.18
NaOH 624.54 541.61 45.12 191.82 13049.12 6635.86
3.4.1.11. Fossil diesel
Defining the process chain of the reference system implied the extraction and refining of 17.018
kg of crude oil and the transportation and storage of 14.814 kg of diesel.

41
3.4.2. Scenarios
3.4.2.1. Scenario A
This scenario’s inventory is distinguished from the base scenario by the addition of an
anaerobic digestion plant and by its avoided products, which are:
− 99 kg NPK
− 675.59 m3 natural gas.
3.4.2.2. Scenario B
The export of JME to Europe ads up to end use the freight transport steps displayed in table 16.
Table 16 – Distances travelled by the biodiesel on its way to Europe (to the ports of Antwerp and Lisbon) through the three transport modes (road, railway and sea) in total km and tkm/FU.
Sea
Road Rail
Antwerp Lisbon
km 288.90 975.11 11672.05 9927.63
SD 266.15 404.60 2866.18 2543.27
tkm/FU 4.71 15.91 190.49 162.02
The geographical proximity of the two chosen destinations results in a small difference in the
maritime distance and, consequently, in the overall distance.
3.4.2.3. Scenario C
Additional inputs of scenario C are:
− transport of seeds from plantations to centralized production unit (table 17);
− wood pelletizing machine (in library);
− electricity to power pelletizing = 336.05 kWh/kg pellets;
− emissions from pellet combustion in power plant (table 18).
Table 17 – Haulage of seeds a needed to produce 1t of oil in centralized production scenario.
Transportation mode Distance (tkm) SD
Road freight 1269.61 1181.22
Rail freight 254.07 146.82

42
Table 18 – Accounted emissions for pellets combustion in power plant per tonne of extracted oil.
Substance Emissions (g/t oil)
SO2 1267
PM 572.91
NOx 897
The other crucial parameter is the avoided electricity from coal generation being 3.55 MWh.
3.4.2.4. Scenario D
The only distinctive feature of this scenario was the seed haulage distances, which are the same
as in scenario C (see table 17, section 3.3.2.3).
3.4.2.5. Scenario E
This scenario is equivalent to the base one, except for the oil transport from plantation sites to a
centralized transesterification unit (table 19).
Table 19 - Haulage of 1 tonne of oil in centralized production scenario.
Transportation mode Distance (tkm) SD
Road freight 348.79 324.61
Rail freight 69.8 45.31
3.5. IMPACT ASSESSMENT
Impact assessment results split between the two adopted methods. This section contains charts
per environmental category, each one allowing the comparison of scenarios discernment of
most impactful processes, and the comparison with the reference system. For each scenario, the
total score of 1FU is displayed side by side with the contribution of each constituting process. A
legend to distinguish the processes was used (figure 18) and is excused from the charts for
better visualization.
Details on the contribution of each production step for the score of each environmental impact
category per impact assessment method and per scenario can be seen in tables included in the
appendices.

43
Figure 18 – Unit process pattern identification belonging to impact assessment charts legend.
3.5.1. IMPACT2002+
3.5.1.1. Global warming
Figure 19 – Global warming potential according to characterization step of IMPACT2002+ of scenarios compared to reference system per 1FU (total in full and contribution of different processes in stacked patterns).

44
Figure 20 - Global warming potential according to damage assessment step of IMPACT2002+ of scenarios compared to reference system per 1FU (total in full and contribution of different processes in stacked patterns).
Characterization and damage assessment codes show the same profile for this category (figures
19 and 20). The largest emitter of greenhouse gases is the reference scenario (67.07 kg CO2 eq)
followed my scenario D (59.38 kg CO2 eq). The best performing case is the scenario C,
favoured by credits from electricity production from seed cake pellets: only 3.15 kg CO2 eq
emitted. The other energy generation alternative from seed cake through biogas production (A)
follows with 29.35 kg CO2 eq, which is roughly the same performance as the base scenario
(30.65 kg CO2 eq). Scenarios B and E differ at around 4 to 5 kg CO2 eq from the base scenario.
Relatively to the reference system, the base model shows a 54.3% reduction in GHG emissions,
while the best and worst scenarios (C and D) show a 95.3% and a 11.5% decrease.
When comparing the base scenario with its alternatives, one discerns that the most significant
improvement in terms of global warming is using seed cake pellets for electricity generation.
According to the results, this would imply approximately 90% decrease in GHG emission.
Using the seed cake for biogas production in a decentralized manner (A) results a 3.5%
improvement. On the other hand, transporting the seeds from small scattered plantations to a
centralized processing unit without seed cake to energy revenues ends in a 93.7% increase in
GHG emissions. The remaining scenarios also show an increase in GHG emission: exporting

45
the fuel to West European markets (B) adds 15.5% while inland centralization (E) adds nearly
20%.
In every scenario, the most burdening processes are plantation related: establishment and
cultivation. Exception made to D, where extraction (burdened by the transport of seeds) also
carries significant impact. Biodiesel haulage to Europe loads the end-use stage with GHG
emissions. Common to all scenarios is the fact that transesterification yields credits, mainly
because of the glycerine output and subsequently avoided artificial glycerine production.
Extraction shows similar behaviour for seed cake replacement of artificial fertilizer, only not
granting credits in scenarios where the seed cake is used for something else. Either way, the
seed cake’s fate always seems to have a preponderant influence on the environmental
performance outcome of the production system. Scenarios B and E have coincident production
systems with the base model, but its higher score is due to the existence of extra transport steps.
3.5.1.2. Non-renewable energy
Figure 21 – Non-renewable energy consumption according to characterization step of IMPACT2002+ of scenarios compared to reference system per 1FU (total in full and contribution of different processes in stacked patterns).

46
Figure 22 - Non-renewable energy consumption according to damage assessment step of IMPACT2002+ of scenarios compared to reference system per 1FU (total in full and contribution of different processes in stacked patterns).
All scenarios show significantly lower non-renewable energy consumption than the reference
system (figures 21 and 22). Biogas production in A grants this option the lowest primary energy
expenditure profile: 98.05 MJ credit, which corresponds to a 130% improvement regarding the
base scenario. The use of seed cake for electricity production follows with circa 45 MJ
consumption, bearing the weight of seed transport included in the extraction phase. However,
the combustion of pellets generating electricity counterbalances this and allows an 98%
decrease in comparison with the fossil system and 86% with the base. The base scenario alone
demands 87% less fossil energy than the reference, demanding 321.56 MJ from non-renewable
sources.
Exporting JME to European markets bears a small difference in non-renewable energy
consumption depending on the final destination: 0.64% less energy is spent if the entrance in
Europe is Lisbon rather than Antwerp. This option implies, however, circa 19% more fossil
energy invested. Scenario D is the most fossil energy intensive of the modelled cases (752.04
MJ) with additional energy consumption for seed transport to the centralized processing unit. It
is a roughly 134% increase facing the base, but circa 70% reduction towards the fossil
alternative. If instead of hauling the seeds to a central processing unit, one hauls the oil, the
increase facing the base scenario lowers to 18.6%,

47
Non-renewable energy consumption in the systems (except reference) is mainly due to
plantation related activities and mainly thwarted by glycerine and seed cake credits. The last are
more significant in the case the seed cake is used as an energy carrier.
3.5.1.3. Ozone layer depletion
Figure 23 – Ozone layer depletion potential according to characterization step of IMPACT2002+ of scenarios compared to reference system per 1FU (total in full and contribution of different processes in stacked patterns).

48
Figure 24 - Ozone layer depletion potential according to damage assessment step of IMPACT2002+ of scenarios compared to reference system per 1FU (total in full and contribution of different processes in stacked patterns).
All scenarios exhibit negative ozone layer depletion potential, in contrast with the reference
system (1.56×10⁻⁵ kg CFC-11 eq and 1.63×10⁻⁸ DALY) (figures 23 and 24). Besides general
system performance, JME production seems to benefit from the avoided fossil based glycerine
credits attributed to transesterification. The higher impact scenarios are C and D, due to the
transport of seeds burdened to the extraction phase. D is the most impactful of the modelled
options representing a 50% increase in ozone layer depletion potential comparing to the base
scenario, yet showing a 117.65% reduction contrasting with the reference. The base case seems
to have best performance (-5.75×10⁻⁹ kg DALY – circa 137% less than the reference), although
approximate to A, B and E (-5.45×10⁻⁹, -5.07×10⁻⁹ and -5.13×10⁻⁹ DALY respectively).
The least accomplishing of the modelled situations is centralized processing and
transesterification of oil using the seed cake as fertilizer (D): -2.88×10⁻⁹ or 38% more than the
base. Still, it is a 122% improvement regarding the fossil alternative.
Main contributor to ozone layer depletion is the nursery stage, due to polybag manufacture in
all scenarios, except C and D were it is toped by seed transportation.

49
3.5.1.4. Terrestrial acidification/nutrification
Figure 25 – Terrestrial acidification and nutrification potential according to characterization step of IMPACT2002+ of scenarios compared to reference system per 1FU (total in full and contribution of different processes in stacked patterns).
Figure 26 - Terrestrial acidification and nutrification potential according to damage assessment step of IMPACT2002+ of scenarios compared to reference system per 1FU (total in full and contribution of different processes in stacked patterns).

50
Both characterization (figure 25) and damage assessment (figure 26) demonstrate that the
reference system has significantly lower impact on acidification and nutrification of terrestrial
ecosystem (0.84 kg SO2 eq and 0.88 PDF.m2.yr) than the biodiesel systems. The difference to
the basic biodiesel setting is of -714% (in characterization, being the base score 7.1 kg SO2 eq).
This means that biodiesel fuelled Toyota Hilux driven 100 km have 8 times higher
eutrophication and acidification impact than if fossil fuelled.
Both evaluation stages indicate scenarios A and the base system as the least impactful. As for
the most disadvantageous strategy, characterization defines exporting biodiesel to Europe
(2.29% additional burdening to the base) and damage assessment indicates scenario D (8%).
Shifting of acidification and eutrophication trends between different options is minimal.
Negative impact is most due to plantation establishment and cultivation, being fertilizer
application the main stressor. The few credits arise from seed cake production (either to use as
energy carrier or to displace artificial fertilizer availability).
3.5.1.5. Land occupation
Figure 27 – Land occupation performance according to characterization step of IMPACT2002+ of scenarios compared to reference system per 1FU (total in full and contribution of different processes in stacked patterns).

51
Figure 28 - Land occupation performance according to the damage assessment step of IMPACT2002+ of scenarios compared to reference system per 1FU (total in full and contribution of different processes in stacked patterns).
Characterization and damage assessment of land occupation convey the same results (figures 27
and 28): reference system is much less land requiring that the production system (4.3 times less
land requiring than the base scenario in characterization).
The base scenario is, of all the modelled systems, the less demanding and, therefore, less
ecosystem damaging in terms of land use, since all the other scenarios require additional
facilities and infrastructural components (e.g. the anaerobic digestion plant in A or transport
infrastructure in B) that adds up to land requirement. The scenarios that occupy largest land
areas are the centralized extraction and transesterification settings (C and D): 0.76 m2.org.arable
and 0.74 m2.org.arable. Comparing with the fossil system, the base model is a 346% increase in
land use, while C represents 505.7% more up taken land. Between the base and scenario C there
is a 35.7% increase to take into account.
Cultivation is the process, in every case, that demands more area per FU and has bigger
ecosystem damage potential through land occupation. Credits arise from displacing glycerine in
every scenario.
There appears to be a straightforward relation between the land occupied and its damage to the
ecosystem, an idea conveyed by the overlapping profiles of the different processes. An
exception seems to be the process of seed cake pelletizing for electricity generation that,
although not taking up a significant amount of land, causes significant damage.

52
3.5.2. Ecoindicator 99
3.5.2.1. Climate change
Figure 29 – Damage potential of climate change according to Ecoindicator99 of scenarios compared to reference system per 1FU (total in full and contribution of different processes in stacked patterns).
The above chart (figure 29) shows that JME production and use -induced climate change is
smaller than the one caused by the fossil equivalent system. The reference system holds a
1.43×10⁻⁵ DALY score while the base scenario exhibits 8.35×10⁻⁶ DALY (circa 42% decrease).
The only remarkably lower impact scenario is C (3.14×10⁻⁶), profiting from coal generated
electricity avoidance by seed cake pellet based electricity production. This consists of a circa -
78% and -62% shift from the reference and base systems respectively. Centralized extraction
and processing (D) has the worst performance (1.13×10⁻⁵ DALY), displaying 35.8% increase
facing the basic option and a mere 5% advantage regarding the fossil system. Scenarios B and E
show slight augment regarding the base scenario (11.8% and 10%), while biogas from seed
cake offers a near 4% cut.
Once again, seed cake (as fertilizer displacer or energy carrier) and glycerine credits have
beneficial effect on the intervening processes. Seed cake used as energy carrier grants scenarios
A and C the lowest impact on climate change. Is it noticeable, nonetheless, that avoiding coal
electricity buy generating it from seed cake pellet combustion contributes to the overall system
GHG balance more than replacing natural gas with biogas from seed cake. It is actually 60%

53
less impactful on climate change to convert seed cake into pellets for electricity making. On the
other hand, plantation establishment and cultivation push up climate change impact of the
systems.
3.5.2.2. Fossil fuel
Figure 30 – Fossil fuel consumption according to Ecoindicator99 of scenarios compared to reference system per 1FU (total in full and contribution of different processes in stacked patterns).
Figure 30 depicts that the reference system is naturally the most demanding primary energy
(192.76 MJ surplus), in contrast with scenario A (-8.87 MJ surplus or a 104.6% cut in fossil
fuel demand). In fact, the performance regarding fossil fuel consumption is disparate according
to Ecoindicator99. The base model takes up 28.66 MJ, which is circa 85% less than the
reference, centralized processing of seeds for biodiesel and pellets (C) reduces that value to
11.83 MJ (circa 94% less) and D consumes 45.35 MJ (approximately 76% cut). Exporting to
Europe (B) and centralized transesterification (E) have approximate fossil fuel consumption
(circa 34 MJ and 33.28 MJ).
Comparatively to the base scenario, the most advantageous shifting is towards biogas
production from seedcake (A): circa 131% decrease in fossil fuel claim. Using the seed cake for
pellet based electricity (C) follows with a circa 59% decrease. Scenarios B and E display worse
performances (19.4% and circa 16% increase) and choosing D would lead one to a raise of 58%
in demand.
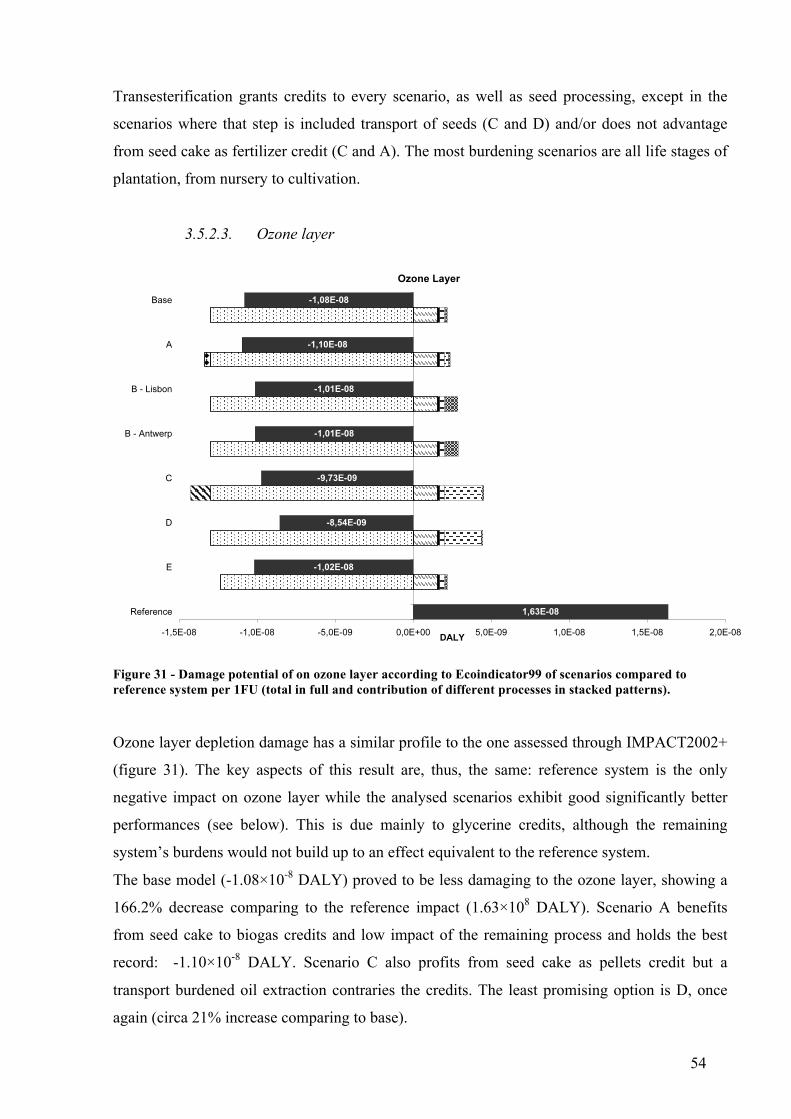
54
Transesterification grants credits to every scenario, as well as seed processing, except in the
scenarios where that step is included transport of seeds (C and D) and/or does not advantage
from seed cake as fertilizer credit (C and A). The most burdening scenarios are all life stages of
plantation, from nursery to cultivation.
3.5.2.3. Ozone layer
Figure 31 - Damage potential of on ozone layer according to Ecoindicator99 of scenarios compared to reference system per 1FU (total in full and contribution of different processes in stacked patterns).
Ozone layer depletion damage has a similar profile to the one assessed through IMPACT2002+
(figure 31). The key aspects of this result are, thus, the same: reference system is the only
negative impact on ozone layer while the analysed scenarios exhibit good significantly better
performances (see below). This is due mainly to glycerine credits, although the remaining
system’s burdens would not build up to an effect equivalent to the reference system.
The base model (-1.08×10⁻⁸ DALY) proved to be less damaging to the ozone layer, showing a
166.2% decrease comparing to the reference impact (1.63×10⁸ DALY). Scenario A benefits
from seed cake to biogas credits and low impact of the remaining process and holds the best
record: -1.10×10⁻⁸ DALY. Scenario C also profits from seed cake as pellets credit but a
transport burdened oil extraction contraries the credits. The least promising option is D, once
again (circa 21% increase comparing to base).

55
As in IMPACT2002+ assessment results, nursery and seed transport, where it happens, are the
most impactful categories, while glycerine credits push the ozone layer impact to below zero
terrain.
3.5.2.4. Acidification/eutrophication
Figure 32 – Damage potential of acidification and eutrophication according to Ecoindicator99 of scenarios compared to reference system per 1FU (total in full and contribution of different processes in stacked patterns).
Ecoindicator99 points the reference system as the least impactful in terms of acidification and
eutrophication (0.88 PDF.m2.yr) as well (figure 32). The base JME system carries 741% more
damage (7.39 PDF.m2.yr) than the reference. However, the worst performing scenario (D)
shows circa 806.7% more impact (7.97 PDF.m2.yr).
When restricting the interpretation to the studied systems, one discerns the base model as
having the best outcome, although with slight differences to most of the remnant scenarios:
(0.04% to A and approximately -2% than the remaining).
Fertilizer use in plantation contributes the most to acidification and eutrophication, especially
due to field emissions. Transport of oil and seeds to centralized facilities (C, D and E) and of
biodiesel to western European markets (B) ads up to the eutrophication and acidification effect
of the systems in a smaller extent.

56
3.5.2.5. Land use
Figure 33 - Damage potential of land use according to Ecoindicator99 of scenarios compared to reference system per 1FU (total in full and contribution of different processes in stacked patterns).
Land use (figure 33) shows the same outline as land occupation by IMPACT2002+ and for the
same reasons. The reference system is most impactful (0.99 PDFm2yr). The least impactful is
the base scenario (reduces 41% from the reference to 0.58 PDFm2yr). Scenarios E and B show,
once more, similar total outcomes with a 15.9% and 13.5% growth regarding the base model.
Anaerobic digestion facilities push scenario A to 0.77 PDFm2yr (with a 27% growth). It is,
however, transportation infrastructure of centralized seed processing that aggravates land use
damage in scenarios C and D (53% and 48.7% augment).
Ecoindicator99, still, does not impute relevant land use impacts on the seed cake pellets for
electricity strategy (see bar C), however doing so on biogas production.
3.5.3. Energy efficiency
The calculations of energy efficiency ware based on IMPACT2002+ characterization data
(figures 34 and 35).
The base production model holds a 316.49 MJ net gain facing a 1848.67 MJ loss of the
reference system, which stands for a 1.42 ratio. The best performing scenario is A with a 736.1
MJ net gain and a 1.97 ratio. Scenario C follows with 593.06 MJ NEG and a 1.47 ratio.
Naturally, energy efficiency improves if the production system takes advantage of most of the

57
energy content of the plant as possible. And this is attained by complementing biodiesel
production from oil with biogas (A) or pellets for electricity (C) production from seed cake.
On the other end stands scenario D with 85.39 MJ earned. Scenarios B and E have short gains,
disfavoured by the transport energy requirements involved. Exporting the biodiesel to Antwerp
allows a 238.3 MJ gain, while exporting it to Lisbon yields a 241.27 MJ income. The difference
is easily explained with the fact that Jatropha plantations have a semitropical span and Lisbon
is more meridional than Antwerp. The ratio is 1.33 for both locations though. Hauling oil to a
centralized production unit (E) also compromises the energy efficiency: 256.71 MJ gain or 1.32
NER.
Figure 34 – Comparison of net energy gain (NEG) of scenarios and reference system.
Figure 35 - Comparison of net energy ratio (NER) of scenarios and reference system.

58
These results reinforce the notion that by-product fate is essential for the system’s
environmental effect. They show using the seed cake as energy carrier entails energy gain and
favours energetic efficiency of the production system. Glycerine credits are inherent to all
scenarios and proved to pay a small contribution to energy efficiency.
Also transport energy expenditure is relevant for the outcome. Energetic performance is worse
in scenarios where there are added up distances covered (relatively to the base scenario) either
for seeds, oil or biodiesel relocation.
3.5.4. Uncertainty analysis
SimaPro® ran Monte Carlo uncertainty analysis on 1FU with 95% confidence interval for
IMPACT2002+ characterization. The results are displayed as graph with high/low intervals
and through statistical data tables.
Figure 36 – High/low interval result chart of uncertainty analysis on IMPACT2002+ LCI assessment.
The error bars in the chart (figure 36) represent uncertainty ranges in 95% confidence interval,
i.e., 95% of the results lay within these ranges. The wide ranges indicate have considerable
uncertainty level. Ozone layer depletion manifests higher uncertainty range than the remnant
categories. Global warming, non-renewable energy and terrestrial acidification/nitrification
denote less but nonetheless high variation. Land occupation is the least statistically uncertain of
the categories although also suffering from high variability.

59
The analysed data set has diverse units and widely different averages. Hence, the coefficient of
variation (CV) is a preferable interpretation basis in detriment of the standard deviation (Ostle
and Malone, 2000). The CV is a useful unitless comparison of the relative magnitude of the
uncertainty of the different impact categories.
Table 20 – Uncertainty analysis of 1FU results with 95% confidence interval displaying statistical data: mean, standard deviation (SD) and coefficient of variation (CV).
Impact category Mean SD CV
Global warming 41.1 18.7 45.4%
Land occupation 0.578 0.123 21.3%
Non-renewable energy 449 216 48.1%
Ozone layer depletion -5.61 10-6 3.26 10-6 -58%
Terrestrial acid/nutrification 6.25 2.57 41.2%
Table 20 confirms that all categories have wide variation in results. Land occupation is the least
variable (CV = 21.3%), while ozone layer depletion is the most (CV = 48.1%). Global
warming, non-rewewable energy and terrestrial acidification/nitrification bear CV of 45.4%,
48.1% and 41.2%
However, before drawing conclusions on the uncertainty level of performed LCA, it is
important to recall that data inventoried in databases has its own level of variability that adds up
to the uncertainty of the LCI. Therefore, a Monte Carlo trial was ran on the production system
model without any own uncertainty data, i.e. without uncertainty data determined in the LCI
and defined by the practitioner. A comparison between the CV of the two performed Monte
Carlo trials is shown in table 21.
Table 21 – Comparison of coefficient of variation (CV) of distribution of 1FU with own uncertainty data defined and without own uncertainty data (undefined).
Impact category CV (%) with defined uncertainty data
CV (%) with undefined uncertainty data
Global warming 45.4% 3.53%
Non-renewable energy 48.1% 7.95%
Ozone layer depletion -58% -33.6%
Terrestrial acidification/nutrification 41.2% 0.384%
Land occupation 21.3% 20.7%

60
It is possible to see that database derived data does not accumulate significant variation in
global warming, non-renewable energy and terrestrial acidification/nitrification, but does so
significantly in ozone layer depletion and land occupation. One might refrain oneself to assign
lesser fitness to these categories results proceeding from methodology or LCI.

61
4. DISCUSSION
4.1. METHODOLOGY
Methodological preferences had great influence on the outcome of this study in the sense that
they add subjectiveness to data reliability and treatment. Though, being a generic life cycle
assessment, error prone outcomes are expected.
Facing a screening approach to the Jatropha based biodiesel life cycle, the authors faced to
main difficulties regarding data acquirement: scarcity of information and its provenance. While
the limitations imposed by scarcity are clear, the origin of the data holds more complex
consequences.
Data proceeding from literature is patent mainly in other LCA or energy efficiency studies
previously done. Therefore, it already carries manipulation inherent to the studies’
methodologies. This accumulates subjectivity that is not always fully disclosed.
Questionnaires retrieved information on Jatropha cultivation turned out little and quite variable.
This resulted in a delicate balance between more data and more variability and, consequently,
more uncertainty. However, questionnaires worked as glance over on field practice, reflecting
real situations from various locations, plantation ages and knowledge and sophistication
statuses. Indeed, variability is quite high among the replies, but it granted this study with a link
to the current Jatropha cultivation for biodiesel production situation. Hence, the drawback on
outcome fitness resulting from questionnaire data wide variation is qualitatively redeemed by
the provided insight on up to date and common practices.
Uncertainty analysis corroborated that variability in data does of a negative bearing on result
fitness. A critical view on the LCI results and methodology is required.
However, ascertaining the fitness of the overall environmental balance of the JME system is
less straightforward due to the Monte Carlo analysis limitations. Besides the disadvantages
discussed in section 1.4.4, a probabilistic distribution of the data is unknown and was assumed
as being normal. This has an influence of the uncertainty analysis outcome, of which extent this
study does not perceive.
Uncertainty analysis was only performed in the base case and with IMPACT2002+ code, but it
is deducible that, seeing that the remaining scenarios have more inputs with the same
uncertainty level, uncertainty would be similar or higher. Seeing that Ecoindicator99 results are
at the damage assessment level, more uncertainty would be expected from subjecting that
method to a Monte Carlo trial (Jolliet et al., 2003). Before such high uncertainty levels of the

62
least uncertain scenario and assessment method the authors excused from taking the whole set
of Monte Carlo calculations.
Cherubini et al. (2009) claim that inexact quantification of environmental impacts of bioenergy
systems is, so far, unavoidable owing to the outnumber of variables involved. They suggest that
the presentation of LCA results if preferable by displaying probable ranges. However, the
Monte Carlo analysis results were kept apart to prevent more noise in the visualization of the
charts.
The indicated assumptions restrain the absolute reliability outcomes. For instance, assuming
that the main source of electricity is coal has a strong effect on pondering the environmental
impact of using seed cake for electricity generation. Final credits would be different if coal
based electricity had been replaced with other source, either totally or partially, according to the
regional energy mixes.
This study is further limited by the left-out analysis parameters. On assessing the JME system’s
sustainability, it would have been of outmost importance to include social-economic
deliberation. Without this aspect, the performed assessment cannot be considered a complete
evaluation.
The environmental assessment, itself, was restricted to few categories, which the authors
considered the most representative of environmental performance. However, some variables
that would work as stressors were left out of care, namely land-use change and carbon debt.
Land occupation and land use are contemplated, but the effects of land use transformation and
the correlated carbon stock were not part of SimaPro®’s computation.
In addition, IMPACT2002+ and Ecoindicator99 aggregate eutrophication and acidification in
one single category each. The codes achieve that by computing the effect of waterborne
emissions in target species through the two distinct biochemical damage processes and
returning a damage/impact score of the FU. These species are strictly terrestrial and therefore
one must bear in mind that the eutrophication and acidification impact assessment of this study
is restricted to terrestrial ecosystems.
Overall, the results are dependent also on the impact assessment methods chosen. These two
methods have qualitative differences and yield qualitatively different results. IMPACT2002+
was chosen for allowing assessment and interpretation in successive phases of the cause-effect
chain: midpoint and damage assessment. Ecoindicator99 offers an established view on damage
assessment calculation. Using both permitted an insight on the influence of the method in the
general resulting balance. A comparison between Ecoindicator99 results and IMPACT2002+
damage assessment categories with the same units, shows that the outcomes are fairly similar.

63
Theoretical cause-effect relations between inputs, their emissions and environmental impact
are, of course, the driver to carry on this type of study with its determined guidelines. However,
when using an automatically computing method to relate the inputs with their impact score, the
practitioner looses some insight on the nature of the influential flow of each process or material
with the outcome. Nonetheless, the use of specific LCA software recurring to generally well-
accepted assessment codes assures more calculation precision and reduces subjectivity.
The use of databases to define infrastructural, energetic and transportation inputs and the whole
reference system contributed in the opposite way. Notwithstanding the geographic and
technological constraint of the data, not always coincident with the geographic and
technological span of the JME system, the data allowed access to inputs of greater order, more
detail and solid reliability.
Sensitivity analysis has not been performed in this study. Still, it would have been an interesting
tool to access the overall effect of changes in key variables in JME production. These could be
variations in seed yield (induced by environmental variables or by breeding and
biotechnological improvement), by product yield and energy demand (due to distinct
technological levels).
4.2. LIFE CYCLE IMPACT ASSESSMENT RESULTS
This LCA’s results indicate that the Jatropha biodiesel system has roughly half of the global
warming potential of the equivalent fossil system. If seed cake is used for electricity generation
through pelletizing and combustion, an even most favourable reduction is achieved. Converting
that by product to biogas is not, however, a significant improvement in the GHG emission
performance. It depends, naturally, on the polluting intensity of the displaced reference product.
Cherubini et al. (2009) support the idea that higher degree of GHG emission savings is
achieved when coal-generated power is displaced, while displacing natural gas leads to lower
savings.
Centralized seed processing is without seed cake energetic revenues seems to be the worst
option. Also discouraging from this point of view is inland centralized transesterification and
exporting to Western Europe.
These values accompany results of previous studies of the same sort. Fobelets (2009) concluded
a nearly twice increase in GWP when opting for fossil diesel instead of JME. Optimized
scenarios of JME production, according to the same study, would allow up to 90.6% savings in
GHG emissions. Prueksakorn and Gheewala (2006) calculated a 77% decrease. Reinhardt et al.

64
(2007) also document a positive GHG balance, especially in case of using by products as
energy carriers.
Global warming potential assessed by Persson (2008) points to 11.3 kg CO2 eq/100 km.
According to the same source, rape biodiesel has the same GWP while palm exhibits lower
values.
Both Ecoindicator99 and IMPACT2002+ show that the fossil alternative is circa seven times
more non-renewable energy demanding. The energy demand decreases notably when seed cake
is used as an energy carrier, displacing fossil sources. This goes in accordance with Reinhardt et
al. (2007) concluded trends in Jatropha LCA.
When comparing the two assessed options to profit from the seed cake’s energy content, biogas
production holds clear advantage. Although biogas does save more fossil energy than pellets for
electricity, one must also notice that the second bears the weight of centralization. This variable
must be considered in order not to overestimate the energetic advantage of biogas production
from seed cake over its pelletizing and power plant based combustion. This study should have
evened out the comparison of these two alternatives either both in a centralized or decentralized
perspective.
Jatropha seed production is the key fossil energy claimer. Nursery, establishment and
cultivation share nearly equal parts of that claim. Within these phases and transversally to all
scenarios, the largest contributor to overall energy demand is fertilizer production and transport.
The different demand level of each scenario depends on additional material transfer (exporting,
seed or oil hauling) and on by product credits.
Tobin (2005) estimated that cultivation has only a small slice of the total value and the main
consumer is processing (namely transesterification). Prueksakorn and Gheewala (2008) set the
agricultural phase as the main energy demander, although transesterification follows closely.
Fobelets (2009) indicates direct electricity use and methanol production as the biggest
consumers. Persson (2008) identifies that all steps to oil production are main energy uptaker in
the process. This study also plots JME total energy use against rape seed methyl-ester (RME)
and palm oil methyl ester (POME). According to its methodology, JME takes up 271 MJ /100
km which is lower than the 321.56 MJ indicated by IMPACT2002+. Both RME and POME
have higher energy demands.
Energy efficiency (EE) ascertains the real energetic impact of the production system. EE
calculations included the energetic weight of all products (or, their fossil equivalents).
Moreover, due to the nature of the database information used, it includes energy consumption
of several orders, depending on the process.
The net energy ratio (NER) reiterates the idea that using the energy content of the seed cake
improves the system’s energetic efficiency. Scenarios where it is done in the form of biogas (A)

65
and pellet combustion for electrical generation (C) convert each energy unit invested in 1.97
and 1.47 units produced, respectively. The base scenario has a 1.42 energy ratio while the
reference ratio is of sheer inefficiency (0.26).
The overall balance, therefore, of low efficiency, although being more advantageous than the
fossil alternative. Fobelets (2009) has obtained results of the same magnitude. Sahapatsombut
and Suppapitnarm (2006) estimated that JME system has a NER of 3.74 if it includes its by
products, but that value lowers to 0.68 if only the methyl-ester is considered. Prueksakorn and
Gheewala (2006) reckoning on energy consumption and gains point to a 6.14 NER when
considering biodiesel, seed cake and glycerine as by-products. These authors updated this value
to an average of 6.96 between two extreme production scenarios (Prueksakorn and Gheewala,
2008). Tobin (2005) also equates two scenarios with an average 2.61 NER. Reinhardt et al.
(2007) determined a 2.14 ratio (output only biodiesel and inputs of first order).
Benchmarking of JME system energy efficiency towards other feedstock systems puts these
figures into context. Sahapatsombut and Suppapitnarm (2006) put JME in disadvantage with
POME and Camelina sativa methyl ester regarding their NRE: 3.74 against 3.92 and 5.22
respectively. Vandenbempt (2008) modelled two POME production scenarios with an
input/output of 3.7 and 3.8, while Yee et al. (2009) fixed it at 3.53. Janulis’ (2004) study on
RME estimated a 2.6 ratio.
Acidification and eutrophication results are over eight times higher in the base scenario than in
the reference system. Being bound through undisclosed manner by the impact assessment
methods developers, it is difficult to cross check specific figures with other studies. But a
general trend of great increase in both indexes is transversal to LCA’s of Jatropha and other
biodiesel feedstocks already performed (Fobelets, 2009; Reinhardt et al., 2007; Vandenbempt,
2008). Reinhardt et al. (2007) denote combined acidification and eutrophication results
showing similar increase/FU relatively to the reference system. These documents charge N-
compound emissions from fertilizer application as the principal stressors. It is a deduction
corroborated by this analysis: high acidification and eutrophication impact caused by NH3 and
NO3 emissions from fertilizer use. Another noteworthy contribution is transport, although with
much less intensity.
According to IMPACT2002+ assessment, land occupation can be four to six times higher in the
JME system than in the fossil, depending on the production alternatives. Ecoindicator99’s
damage assessment, though, sets s different trend: the fossil diesel life cycle is twice more
damaging to land than the Jatropha biodiesel life cycle.
Damage towards ozone layer is greatly diminished thanks to glycerine credits. Apparently,
displacing artificial glycerine production supplants kg CFC-11 emissions from cultivation,

66
processing and transport. Either way, even if by product credits had not been accounted for, the
JME systems that were modelled would still have lower impact that the fossil system.
There is not known information regarding land use and land occupation and ozone layer
depletion effects of JME. Benchmarking of the results of these two categories towards other
studies is, thus, not feasible.
Global warming and fossil energy consumption results are not overlaid. The relative stressing
of each scenario is similar except when it comes to using seed cake as energetic feedstock. As
described above, biogas production is less energy demanding but more polluting than
pelletizing and combustion in power plant. This means that these processes and the impact of
their displaced products are not energetic and environmentally correlated. However, in systems
where additional material displacing is implicated, the GHG emission is linked to energetic
demand.
Reinhardt et al. (2007) have suggested that increase in GHG and energy expenditure is
correlated with higher acidification and eutrophication effect. However, replacing polluting
energy carriers with by products leads to greater decreases in acidification balances than in
GHG emissions. These trade-off remarks are not present in this study’s results. In fact,
acidification and eutrophication/nitrification values have the slightest variation rates between
scenarios (for both calculation methods) of all analysed environmental categories.
Land occupation and use and ozone layer depletion also seem to have low correlation with the
remaining environmental scores.
The growing of Jatropha, rather than in processing or end use of the biodiesel, is the most
evident environmental stressor. In GWP, non-renewable energy requirements and
eutrophication and acidification score plantation establishment and cultivation bear the most
weight. This is due to NPK production, transport and application. Lack of knowledge on the
optimal application levels of fertilizer leads to high variable fertilizer use across Jatropha
growers. For the same reason it is not easily assessable whether the considered application is
excessive or not. Neither it is to suggest the replacement of artificial fertilizer with organic one
or with seed cake: higher emission factors impact is not likely to compensate for production and
transport of mineral NPK. It would be relevant to analyse the environmental performance of
using organic fertilizers, namely the seed cake.
In land use and occupation, cultivation is the most impactful process.
Cultivation is, though, of minor importance to ozone layer depletion. The nursery phase
(especially through polybag input) pays its negative contribution to the overall balance in this
category.
Processing impact (extraction and transesterification) is always diminished by by product
generation. However, the relative contribution of glycerine credits depends on the

67
environmental category and on the fate of the seed cake. Seed cake as feedstock for energy
generation is a transversal advantage to all impact categories. Cherubini et al. (2009) imply that
bioenergy chains that incorporate their residues have better LCA results since they avoid the
high impacts of dedicated crop production and emissions from waste management. In addition,
electricity and heat generation from biomass achieves greater savings in GHG emissions and
fossil fuel consumptions than production of transportation liquid fuels.
Reinhardt et al. (2007) had previously concluded that life cycle stages have different
contributions depending on the environmental category. Still, that study infers a general trend
of cultivation and processing being strong determinants in the overall balance, in contrast with
transport. This LCA’s results imply, however, that transport is also a determinant for the
implications of both its infrastructure and fossil fuel direct consumption. Its inclusion in
particular inputs ads up to their effect. Further, in scenarios where more transport is needed
(centralization and exporting) the negative effects suffer an aggravation.
A qualitative overview of these results conveys accordance to the overall pattern of similar
studies carried out on other biodiesel from other feedstocks (Sahapatsombut and Suppapitnarm,
2006; Parsson, 2008; Vandenbempt, 2008; Janulis, 2004; Zah et al., 2007).
Exporting the biodiesel to Western European markets (as to Northern American) is an
hypothesis than investors might be tempted to consider. It would not be expected that to transfer
the biodiesel from its production point to a distant consumer would be exempt from additional
unfavourable impact. However, this additional impact turned out to be, in general, as
aggravating as opting for centralized inland transesterification (scenario E) and slightly bigger
than the base scenario. In other words, the overall environmental drawbacks fall within the
ranges of the least extreme scenarios. Should this be a satisfactory argument, the decision to
export JME to farther markets ought to rely on other sustainability criteria such as socio-
economic analysis.

68
5. CONCLUSIONS
Grasping the overall environmental performance evaluation of a production system is not of
linear reasoning. It depends on a more or less subjective pondering between the relative
importance of each environmental category and their trade offs. This is implied either for
electing the JME as an alternative to fossil fuel or when choosing between production
strategies.
This study points out better performance of the JME system in detriment of its fossil alternative
in terms of GHG and non-renewable energy savings, energy efficiency and ozone layer
depletion reduction. The main contribution to this positive balance arises from by product
credits. Displaced artificial glycerine is the key for less ozone layer directed damage. On the
other hand, seed cake improves global warming and energetic performance of the system. The
extent to which it does so depends on its fate: energy generation is much more favourable than
artificial fertilizer displacement. It also depends on the environmental category in issue: biogas
generation saves more energy, while electricity generation from pellet combustion saves GHG
emissions. However, by product credit is only realistic if it has a place on the market for either
its availability or its demand.
Eutrophication and acidification potentials of JME life cycle are higher than in the fossil
reference. This results mainly from waterborne nitrate and airborne ammonia emissions
resulting from fertilizer application. Fertilizers are, in fact, the main stressors in the
environmental performance of the entire system. Their production, transfer to field and use
ought to be optimized and, wherever environmental conditions allow it, reduced.
An obvious recommendation to production system improvement is investing in superior seed
lines and in plant breeding programmes. Increased yield reduces environmental impact per FU.
Land occupation and subsequent damage have not been unanimously assessed in this LCA,
since IMPACT2002+ and Ecoindicator99 return disparate results. Impact on land occupation
and use should, however, be more elaborate and include land use change.
For new bioenergy players/markets or for established players/markets considering a feedstock
shifting or splitting, an educated option for Jatropha requires more information on
sustainability.
Improved assessment ought to embrace more elaborate views on the production system. The
biofuel hype and, in particular, the Jatropha hype, suggest great investments in technological
sophistication and plant improvement. Therefore, one can foresee scenarios of increased
productivity, superior processing and intensification of production namely in a centralized
logic. Overall, information should be geographically specific, for there are many variables that

69
are location dependent. Moreover, it should be more exhaustive, relying on data with better
quality and include socio-economic criteria.
The ignorance on optimal inputs in the Jatropha cultivation scene combined with the effort to
generalize and screen render data quality a main limitation in a study of this nature. Uncertainty
is inherent as much to methodology as to the analysed situation itself. Result fitness has,
nonetheless, hopefully been enhanced by the use of consistent reliable methods of LCA, such as
SimaPro®. It proved to be a valuable tool in impact quantification in the ISO14040 framework.
As stated before, this study aimed at discerning, in a generic way, the environmental balance,
most impactful production phases and least impactful production chain options of the Jatropha
based biodiesel production system. It proved to be a somewhat inconclusive task, but a
contribution has been given to the further gauge of this bioenergy pathway.

70
6. REFERENCES
Achten, W., Verchot, L., Franken, Y., Mathijs, E., Singh, V., Aerts, R. and Muys, B. (2007) Jatropha biodiesel fuelling sustainability? Biofuels, Bioproducts and Biorefining. 1, pp. 283-291.
Achten, W., Verchot, L.,. Franken, Y., Mathijs, E., Singh, V., Aerts, R. and Muys, B. (2008) Jatropha bio-diesel production and use. Biomass and Bioenergy 32, pp. 1063-1084
Adrabbo, A. and Atta, N. (2008) Response of Jatropha curcas L. to water deficit: yield, water use efficiency and oilseed characteristics. Biomass and Bioenergy doi:10.1016/j.biombioe.2008.05.015
Adriaans, T. (2006) Suitability of solvent extraction for Jatropha curcas. FACT Foundation, 9 pp. www.fact-foundation.com (accessed: November, 2008)
Agarwal, A. (2007) Biofuels (alcohols and biodiesel) applications as fuels for internal combustion engines. Progress in Energy and Combustion Science, 33, pp. 233–271.
Alley, M. and Wyser, W. (2005) Fertilizer in 2005. Crop and Soil Environmental News – Virginia Tech. www.ext.vt.edu/news/periodicals (accessed: May 2009)
Almeida, P. and Silva, P. (2009). The peak of oil production- timings and market prediction. Energy Policy, 37, pp. 1267-1276.
Chandra, R., Vijay, V. and Subbarao, P. (2006) A study on biogas generation from non-edible oil seed cakes: potential and prospects in India. 2nd Joint International Conference on Sustainable Energy and Environment, Thailand.
Chapman, L. (2007) Transport and climate change: a review. Journal of Transport Geography, 15, pp. 354-367.
Cherubini, F., Bird, N., Cowie, A., Jungmeier, G., Schlamadinger, B. and Woess-Gallasch, S. (2009) Energy- and greenhouse gas-based LCA of biofuel and bioenergy systems: key issues, ranges and recommendations. Resources, Conservation and Recycling, 53, pp. 434-447.
Ciambrone, D. F. (1997) Environmental Life Cycle Analysis. CRC Press, USA. Davis, S., Anderson-Teixeira, K. and DeLucia, E. (2009) Life-cycle analysis and the ecology of
biofuels. Trends in Plant Science, 14, pp. 1380-1385. Dermibas, A. (2007) Importance of biodiesel as transportation fuel. Energy Policy, 35, 4661-
4670. Dermibas, A. (2008) Biodiesel – A realistic fuel alternative for diesel engines. Springer-Verlag,
London. 204 pp. Dias, L., Leme, L., Laviola, B., Pallini, A., Perera, O., Dias, D., Carvalho, M., Manfio, C.,
Santos, A., Sousa, L., Oliveira, T. and Pretti, L. (2006) O Cultivo de pinhão manso para a produção de óleo combustível. Editora UFV, Minas Gerais. 30 pp.
EIA (2008) International Energy Outlook 2008. Energy Information Administration, U.S. Department of Energy, WashingtionWashington D.C.. 99 pp.
El Diwani, G., Attia, N. and Hawash, S. (2009) Development and evaluation of biodiesel fuel and by-products from Jatropha oil. International Journal of Environmental Science and Technology, 6, pp. 219-224.
Escobar, J. Lora, E., Venturini, O., Yanez, E., Castillo, E. and Almazan, O. (2009) Biofuels: environment, technology and food security. Renewable and Sustainable Energy Reviews, 13, pp. 1275-1287.
FAO (2006) FAO Statistical Yearbook 2005-2006 vol.2. Food and Agriculture Organization of United Nations, Rome: www.fao.org/statistics (accessed: May, 2009)

71
Fobelets, V. (2009) Life cycle analysis of biodiesel production from Jatropha curcas L. in the semi-arid tropics. Master thesis, K.U. Leuven. pp. 147
Foidl, N., Foidl, G., Sanchez, M., Mittelbach, M. and Hackel (1996) Jatropha curcas L as a source for the production of biofuel in Nicaragua. Bioresource Technology, 58, pp. 77-82.
Frischknecht, R. and Rebitzer, G. (2005) The ecoinvent database system: a comprehensive web-based LCA database. Journal of Cleaner Production, 13, 1337-1343.
Goedkoop, M. and Spriensma, R. (2001) The Ecoindicator 99 – Methodology report. PRé Consultants, Netherlands. 132 pp. www.pre.nl (accessed: April, 2009)
Goedkoop, M., De Schryver, A. and Oele, M. (2008) Introduction to LCA with SimaPro 7. PRé Consultants, Netherlands. 81 pp. www.pre.nl (accessed: April, 2009)
Gonsalves, J. (2006) An assessment of the biofuels industry in India. United Nations Conference on Trade and Development. 42 pp. www.unctad.org (accessed: May 2009)
Gour, V. (2006) Production practices including post harvest management of Jatropha curcas. In Singh, B., Gen, M., Swaminathan, R. and Ponraj, V. (Editors). Proceedings of Biodiesel Conference towards Energy Independence – Focus on Jatropha. Rashtrapati Bhawan, New Delhi, India. 374 pp.
Guinée, J. (2002) Handbook on Life Cycle Assessment. Springer-Verlag, London. 704 pp. Guinée, J., Gorrée, M., Heijungs, R., Huppes, G., Kleijn, R., Koning, A., van Oers, L.,
Sleeswijk, A., Suh, S., Udo de Haes, H., Bruijn, H., van Duin, R. and Huijbregts, M.. (2001) Life cycle assessment: an operational guide to the ISO standards. Ministry of Housing, Spatial Planning and the Environment and University of Leiden, The Netherlands. 712 pp. media.leidenuniv.nl (accessed: April, 2009)
Gunaseelan, V. (2009) Biomass estimates, characteristics, biochemical methane potential, kinetics and energy flow from Jatropha curcus on dry lands. Biomass and Bioenergy, 33, 589-596.
Hans, K., Magetto, G. and Van den Bossche, P. (1992) “EDS” (Advanced electric drive systems for buses, vans and passenger cars to reduce pollution): an important step towards new European developments. 13 pp.
Heller, J. (1996) Physic nut - Jatropha curcas L. Promoting the conservation and use of underutilized and neglected crops. 1. Institute of Plant Genetics and Crop Plant Research, Gatersleben / International Plant Genetic Resources Institute, Rome. 66 pp.
Humbert, S., Margni, M. and Jolliet, O. (2005) A user guide for the New Life Cycle Impact Assessment Methodology IMPACT 2002+. École Polythecnique Fédérale de Lausanne, Switzerland. 36 pp.
IPCC (2000) IPCC Good Practice Guidance and Uncertainty Management in National Greenhouse Gas Inventories. Intergovernmental Panel on Climate Change and Institute for Global Environmental Strategies, Japan.
IPCC (2006) edited by Eggleston, S., Buendia, L., Miwa, K., Ngara, T. and Tanabe, K. Guidelines for National Greenhouse Gas Inventories. Intergovernmental Panel on Climate Change and Institute for Global Environmental Strategies, Japan.
ISO (1997). ISO 14040: Environmental Management – Life Cycle assessment – Principles and Framework. International Organization for Standardization, Switzerland.
Janulis, P. (2004) Reduction of energy consumption in biodiesel fuel life cycle. Renewable Energy, 29, pp. 861-871.
Jensen, A., Hoffman, L., Møller, B., Schmidt, A., Christiansen, K. and Elkington, J. (1997) Life Cycle Assessment - A guide to approaches, experiences and information sources. European Environment Agency. 119 pp.
Jenssen, T. K. (2003) Energy consumption and greenhouse gas emissions in fertilizer production. International Fertilizer Society Meeting, London, 2003.

72
Jolliet, O., Margni, M., Charles, R., Humbert, S., Payet, J., Rebitzer, G. And Rosenbaum, R. (2003) IMPACT2002+: A New Life Cycle Impact Assessment Methology. International Journal of Life Cycle Assessment, 8, pp. 324-330.
Jongschaap, R., Corré, W., Bindraban, P. and Brandenburg, W. (2007) Claims and facts on Jatropha curcas L. Plant Research International B.V., Wageningen, 42 pp.
Kaushik, N. and Kumar, S. (2008) Jatropha curcas L. silviculture and uses – second revised edition. Agrobios, India. 89 pp.
Klyosof, A. (2007) Wood-plastic composites. Wiley, USA. 698 pp. Koellner, T. and Scholz, R. (2007) Assessment of Land Use Impacts on the Natural
Environment – Part 1: an analytical framework for pure land occupation and land use change. International Journal of Life Cycle Assessment, 12, pp.16-23.
Lapuerta, M., Armas, O. and Rodríguez-Fernández, J. (2008) Effect of biodiesel fuels on diesel engine emissions. Progress in Energy and Combustion Science, 34, pp. 198-223.
Lu, H., Liu, Y., Zhou, H., Yand, Y., Chen, M. And Liang, B. (2009) Production of biodiesel from Jatropha curcas L. oil. Computers and Chemical Engineering, 33, pp. 1091-1096
Maes, W., Achten, W., Reubens, B., Raes, D., Samson, R. And Muys, B. (2009) Plant-water relationships and growth strategies of Jatropha curcas L. seedlings under different levels of drought stress. Journal of Arid Environments. doi:10.1016/j.jaridenv.2009.04.013
Makkar, H., Becker, K., Sporer, F. and Wink, M. (1997) Studies on nutritive potential and toxic constituents of different provenances of Jatropha curcas. Journal of Agriculture and Food Chemistry, 45, pp. 3152-3157.
Meher, L., Sagar, D. and Naik, S. (2006) Technical aspects of biodiesel production by transesterification – a review. Renewable and Sustainable Energy Reviews, 10, pp. 248-268.
Mishra, D. K. (2009) Selection of candidate plus phenotypes of Jatropha curcas L. using method of paired comparisons. Biomass and Bioenergy, 33, pp. 542-545.
Neuwahl, F., Löschel, A., Mongelli, I. and Delgado, L. (2008) Employment impacts of EU biofuels policy: combining bottom-up technology information and sectoral market simulations in an input-output framework. Ecological Economics. 68, pp. 447-460.
Nussbaumer, T., Czasch, C., Klippel, N., Johansson, L. and Tullin, C. (2008) Particulate emissions from biomass combustion in IEA countries. International Energy Agency Bioenergy Task 32 and Swiss Federal Office of Energy, Zürich. 40 pp. www.verenum.ch (acessed: June 2009)
Oliveira, J., Leite, P., Souza, L., Mello, V., Silva, E., Rubim, J., Meneghetti, S. and Suarez, P. (2009) Characteristics and composition of Jatropha gossypiifolia and Jatropha curcas L. oils and application for biodiesel production. Biomass and Bioenergy, 33, pp. 449-453.
Openshaw, K. (2000) A review of Jatropha curcus: an oil plant of unfulfilled promise. Biomass and Bioenergy, 19, pp. 1-15.
Ostle, B. and Malone, L. (2000) Statistics in research: basic concepts and techniques for research workers. WileyBlackwell, USA, 682 pp.
Passos, M. (2004) Avaliação da sustentabilidade aplicada ao biodiesel. Tese de Mestrado, Pontífica Universidade Católica do Paraná. 125 pp.
Persson, S. (2008) Life cycle assessment of NExBTL from rape, oil palm and Jatropha. Master Thesis, Chalmers University of Technology, Göteborg. 98 pp.
Pierzynkski, G., Sims, J. and Vance, G. (2005) Soils and environmental quality – 3rd edition. CRC Press, USA. pp. 584.
Ponton, J. (2009) Biofuels: Thermodynamic sense and nonsense. Journal of Cleaner Production, 17, pp. 896-899.

73
Prueksakorn, K. and Gheewala, S. (2006) Energy and Greenhouse gas implications of biodiesel production from Jatropha curcas L. 2nd Joint International Conference on Sustainable Energy and Environment, Thailand.
Prueksakorn, K. and Gheewala, S. (2008) Full chain energy analysis of biodiesel from Jatropha curcas L. in Thailand. Environmental Science Technology, 42, pp. 3388-3393.
Rabé, E. (2006) Jatropha oil in compression ignition engines: effects on the engine, environment and Tanzania as supplying country. Graduation thesis, Eindhoven University of Technology. 97 pp. www.senternovem.nl (accessed: Fabruary 2009)
Reap, J., Roman, F., Duncan, S. and Bras, B. (2008) A survey of unresolved problems in life cycle assessment. International Journal of Life Cycle Assessment, 13, pp. 290-300;374-388.
Reddy, M. and Venkataraman, C. (2002) Inventory of aerosol and sulphur dioxide emissions from India. Part II – biomass combustion. Atmospheric Environment, 36, pp. 699-712.
Reinhardt, G., Becker, K., Chaudhary, D., Chikara, J., Falkenstein, E., Francis, G, Gärtner, S., Gandhi, M., Ghosh, A., Ghosh, P., Makkar, H., Münch, J., Patolia, J., Reddy, J., Rettenmaier, N. and Upadhyay, S. (2008) Basic data for Jatropha production and use. Institute for Energy and Environmental Research, Heidelberg. 56 pp.
Reinhardt, G., Gärtner, S., Rettenmaier, N., Münch, J. and Falkenstein, E. (2007) Screening life cycle assessment of Jatropha biodiesel. Institute for Energy and Environmental Research, Heidelberg / Central Salt & Marine Chemicals Research Institute, Bhavnagar. / University of Hohenheim – Institute of Animal Production in the Tropics and Subtropics, Hohenheim. 11 pp.
Rietzler, J. and Brandt, H. (2007) Using Jatropha curcas for generating energy – a study of the properties during processing. 13th International Conference for Renewable Resources and Plant Biotechnology, June 2007, Poznan, Poland.
Roy, S., Rao. B. and Prasad R. (2002) Enzymatic Degumming of Rice Bran Oil. Journal of the American Oil Chemists’ Society, 79, pp. 845-846.
Sahapatsombut, U. and Suppapitnarm, A. (2006) Assessment of new potential crops – Jatropha curcas and Camelina sativa for sustainable energy resources in Thailand. International Conference on Green and Sustainable Innovation, Thailand.
Sahoo, P. and Das, M. (2009) Process optimization for biodiesel production from Jatropha, Karanja and Polanga oils. Fuels, 88, pp. 1588-1594.
Scipioni, A., Mazzi, A., Niero, M. and Boatto, T. (2009) LCA to choose among alternative design solutions: the case study of a new Italian incineration line. Waste Management. doi:10.1016/j.wasman.2009.04.007
Shah, S., Sharma, A. and Gupta, M.N. (2005) Extraction of oil from Jatropha curcas L. seed kernels by combination of ultrasonication and aqueous enzymatic oil extraction. Bioresource Technology, 96, pp. 121-123.
Shanker, C. and Dhyani, S. (2006) Insect pests of Jatropha curcas L. and the potential for their management. Current Science, 91, pp. 162-163.
Shukla, A. (2006) Jatropha (Physic nut) in research frame at Pantnagar. In Singh, B., Gen, M., Swaminathan, R. and Ponraj, V. (Editors). Proceedings of Biodiesel Conference towards Energy Independence – Focus on Jatropha. Rashtrapati Bhawan, New Delhi, India. 374 pp.
Sims, R. (2002) Biofuels for transport from the biochemical conversion of biomass in The Brilliance of Bioenergy – in business and in practice. James & James, London. 328 pp.
Speight, J. (2008) Synthetic fuels handbook. McGraw-Hill, USA. 422 pp. Spielmann, M. and Scholz, R. (2005) Life cycle inventories of transport services – background
data for freight transport. International Journal of Life Cycle Assessment, 10, pp. 85-94.

74
Sunder, S. (2006) Jatropha curcas for biodiesel, organic farming and health. J.V. Publishing House, India. 110 pp.
Svensson, A., Møller-Holst, S., Glöckner, R. and Maurstad, O. (2007) Well-to-wheel study of passenger vehicles in the Norwegian energy system. Energy, 32, pp. 437-445.
Tarik, A. and Purvis, M. (1996) NOx emissions and thermal efficiencies of small scale biomass-fuelled combustion plant with reference to process industries in a developing country. International Journal of Energy Research, 20, pp. 41-55.
Tewari, D. (2007) Jatropha & Biodiesel. Ocean Books, India. 228 pp. Thek, G. and Obernberger, I. (2004) Wood pellet production costs under Austrian and in
comparison to Swedish framework conditions. Biomass and Bioenergy, 27, pp. 671-693. Tiwari, A., Kumar, A. and Raheman, H. (2007) Biodiesel production from Jatropha oil
(Jatropha curcas) with high free fatty acids: An optimized process. Biomass and Bioenergy. 31, pp. 569-575
Tobin, J. (2005) Life cycle assessment of the production of biodiesel from Jatropha. Master thesis, University of Reading. 46 pp.
Van den Broek, R., Faaij, A. and van Wijk, A. (1996) Biomass combustion for power generation. Biomass and Bioenergy, 11, pp. 271-281.
Vandenbempt, P. (2008) Biodiesel production from palm oil: life cycle and relevant impact categories. Master thesis, Katholieke Universiteit Leuven. 128 pp.
Visser, J. and Adriaans, T. (2007) Anaerobic digestion of Jatropha curcas press cake. Ingenia Consultants and Engineers, Netherlands. 21 pp. www.fact-foundation.com (accessed: June 2009)
WHO (2003) WHO specifications and evaluations for public health pesticides – lambda-cyhalothrin. World Health Organization, Geneva. 35 pp. www.who.int (acessed: May, 2009)
Winkler, E., Foild, N., Gübitz, G.M., Staubmann, R. and Steiner, W. (1997) Enzyme-supported oil extraction from Jatropha curcas seeds. Applied Biochemistry and Biotechnology, 63-65, pp. 449-456.
Wood, S. and Cowie, A. (2004) A review of greenhouse gas emission factors for fertilizer production. International Environmental Agency: Task 38. www.ieabioenergy-task38.org (accessed: May 2009).
Yee, K. Tan, K., Abdullah, A. and Lee, K. (2009) Life cycle assessment of palm biodiesel: revealing facts and benefits for sustainability. Applied Energy, doi:10.1016/j.apenergy.2009.04.014.
Zah, R., Böni, H., Gauch, M., Hischier, R., Lehmann, M. and Wägner, P. (2007) Life cycle assessment of energy products: environmental assessment of biofuels. Empa, Switzerland. 14 pp.
6.1. WEB RESOURCES
− Air Polution Information System: www.apis.ac.uk (accessed: March 2009) − Bioenergy Stock Information Network: bioenergy.ornl.gov (accessed: June 2009) − Google Maps: maps.google.com (accessed: May 2009) − Indian Railways: www.indianrailways.gov.in (accessed: May 2009) − Industrial Quick Search Inc©: www.iqsnewsroom.com (accessed: May 2009) − International Network for Sustainable Energy: www.inforse.org (accessed: March 2009) − Live Search Maps: maps.live.com (accessed: May 2009)

75
− PlantaBio: plantabio.com.br/wp (accessed: November 2008) − PRé Consultants: www.pre.nl (accessed: April 2009) − The National Biodiesel Board: www.biodiesel.org (accessed: February 2009). − United Nations Environmental Program – GRID-Arendal: www.grida.no (accessed: March
2009) − United States Department of Commerce – National Oceanic and Atmospheric
Administration: www.esrl.noaa.gov (accessed: May 2009) − United States Department of Transportation: www.dot.gov/new/index.htm (acessed: June
2009) − United States Environmental Protection Agency: www.epa.gov (accessed: May, 2009) − United States Geological Survey – Toxic Substances Hydrology Program:
http://toxics.usgs.gov (accessed: March 2009) − University of Hohenheim: jatropha.uni-hohenheim.de (accessed: October 2008) − World Port Source: www.worldportsource.com (accessed: May 2009) − World Shipping Register: e-ships.com (accessed: May 2009)

A
I’APPENDICES Table 1 – Local availability and local suppliers assessment of main process inputs of all countries with known plantations.
MeOH Fertilizers Pesticides Machinery NaOH Country
Nearest supply centre Nearest supply centre Nearest supply centre Nearest supply centre Nearest supply centre
Brazil Belo Horizonte / Curitiba Belo Horizonte / Curitiba Belo Horizonte /
Curitiba Belo Horizonte / Curitiba
China Kunming Kunming Kunming Kunming Kunming
Ethiopia Addis Ababa
Honduras
India Mumbai Vijaipur Main city in the state Main city in the state Main city in the state
Indonesia Jakarta Jakarta Jakarta
Kenya
Mali
Mexico Ciudad de Mexico Ciudad de Mexico
Mozambique
Philipinnes Davao
Swaziland
Tanzania
Zambia

B
Table 2 – Main international suppliers and nearest international ports of each input. Input Supplier Port
MeOH Methanex Point Lisas, Trinidad y Tobago
Fertilizers Potashcorp Point Lisas, Trinidad y Tobago
Pesticides Zeneca Felixtowe, United Kindgom
Machinery CAT Chicago, Illinois, USA
NaOH DowChem Freeport, Texas, USA
Table 3 – Main nearest internation seaports to the known Jatropha plantations per country. Country Seaport
Brazil Rio de Janeiro (serving Minas Gerais) / Santos (serving Paraná)
China Hong Kong
Ethiopia Djibouti
Honduras La Tela
India Mumbai
Indonesia Jakarta (serving Java) / Belawan (serving Sumatra)
Kenya Mombasa
Mali Dakar
Mexico Veracruz
Mozambique Maputo
Philipinnes Davao
Swaziland Maputo
Tanzania Dar es Salaam
Zambia Dar es Salaam

C
Table 4 – Environmental category scores per scenario and production phase – IMPACT2002+ characterization.
Nursery Establishment Cultivation Extraction Transesterification End Use Biogas
production Pellet electricity Total
Base 1,491E-06 1,109E-07 3,195E-07 6,519E-08 -7,789E-06 1,044E-07 -5,698E-06 A 1,491E-06 1,109E-07 3,195E-07 2,413E-07 -7,789E-06 1,044E-07 -3,284E-07 -5,850E-06 B Lisbon 1,491E-06 1,109E-07 3,195E-07 6,519E-08 -7,789E-06 7,554E-07 -5,047E-06 B Antwerp 1,491E-06 1,109E-07 3,195E-07 6,519E-08 -7,789E-06 7,736E-07 -5,029E-06 C 1,491E-06 1,109E-07 3,195E-07 2,407E-06 -7,790E-06 1,044E-07 -1,309E-06 -4,666E-06 D 1,491E-06 1,109E-07 3,195E-07 2,231E-06 -7,791E-06 1,044E-07 -2,747E-06 E 1,491E-06 1,109E-07 3,195E-07 6,519E-08 -7,300E-06 1,044E-07 -4,883E-06
Ozo
ne L
ayer
Dep
letio
n (k
g C
FC-1
1 eq
)
Reference 1,557E-05 Base 0,114 2,718 4,374 -0,296 -0,029 0,218 7,099 A 0,114 2,718 4,374 0,162 -0,029 0,218 -0,461 7,096 B Lisbon 0,114 2,718 4,374 -0,296 -0,029 0,380 7,261 B Antwerp 0,114 2,718 4,374 -0,296 -0,029 0,389 7,270 C 0,114 2,718 4,374 0,714 -0,029 0,218 -0,865 7,244 D 0,114 2,718 4,374 0,278 -0,027 0,218 7,057 E 0,114 2,718 4,374 -0,296 0,165 0,218 6,441
Ter
rest
rial
ac
idifi
catio
n/nu
trifi
cati
on (k
g SO
2 eq)
Reference 0,844 Base 0,002 0,010 0,602 -0,006 -0,063 0,015 0,560 A 0,002 0,010 0,602 0,008 -0,063 0,015 0,123 0,697 B Lisbon 0,002 0,010 0,602 -0,006 -0,063 0,073 0,618 B Antwerp 0,002 0,010 0,602 -0,006 -0,063 0,074 0,618 C 0,002 0,010 0,602 0,193 -0,064 0,015 0,002 0,761 D 0,002 0,010 0,602 0,179 -0,064 0,015 0,745 E 0,002 0,010 0,602 -0,006 -0,015 0,015 0,631
Lan
d U
se
(m2 or
qyr)
Reference 0,126 Base 3,637 13,298 21,188 -3,090 -6,147 1,766 30,652 A 3,637 13,298 21,188 10,096 -6,146 1,766 -14,263 29,576 B Lisbon 3,637 13,298 21,188 -3,090 -6,147 6,358 35,244 B Antwerp 3,637 13,298 21,188 -3,090 -6,147 6,515 35,401 C 3,637 13,298 21,188 23,981 -6,122 1,766 -54,602 3,146 D 3,637 13,298 21,188 10,799 -6,159 1,766 59,376
Glo
bal W
arm
ing
(kg
CO
2 eq)
E 3,637 13,298 21,188 -3,090 -0,119 1,766 36,679

D
Reference 67,073 Base 126,939 133,889 215,694 -15,066 -175,442 35,550 321,564 A 126,939 133,889 215,694 118,754 -175,057 35,550 -553,822 -98,054 B Lisbon 126,939 133,889 215,694 -15,066 -175,442 110,762 396,776 B Antwerp 126,939 133,889 215,694 -15,066 -175,442 113,301 399,315 C 126,939 133,889 215,694 350,027 -175,188 35,550 -641,921 44,989 D 126,939 133,889 215,694 216,240 -175,653 35,550 752,043 E 126,939 133,889 215,694 -15,066 -115,663 35,550 381,343
Non
-ren
ewab
le e
nerg
y (M
J)
Reference 2487,547

E
Table 5 - Environmental category scores per scenario and production phase – IMPACT2002+ damage assessment.
Nursery Establishment Cultivation Extraction Transesterification End Use Biogas
production Pellet electricity Total
Base 1,566E-09 1,164E-10 3,352E-10 3,980E-08 -4,791E-08 1,096E-10 -5,983E-09 A 1,566E-09 1,164E-10 3,352E-10 2,533E-10 -8,179E-09 1,096E-10 -3,448E-10 -5,798E-09 B Lisbon 1,566E-09 1,164E-10 3,352E-10 6,845E-11 -8,179E-09 7,932E-10 -5,299E-09 B Antwerp 1,566E-09 1,164E-10 3,352E-10 6,845E-11 -8,179E-09 7,932E-10 -5,299E-09 C 1,566E-09 1,164E-10 3,352E-10 2,416E-09 -8,180E-09 1,096E-10 -1,263E-09 -4,899E-09 D 1,566E-09 1,164E-10 3,352E-10 2,343E-09 -8,181E-09 1,096E-10 -3,710E-09 E 1,566E-09 1,164E-10 3,352E-10 3,980E-08 -4,729E-08 1,096E-10 -5,358E-09
Ozo
ne la
yer
depl
etio
n (k
g C
FC-1
1 eq
)
Reference 1,635E-08 Base 0,119 2,827 4,549 -0,308 -0,030 0,227 7,383 A 0,119 2,827 4,549 0,168 -0,030 0,227 -0,479 7,380 B Lisbon 0,119 2,827 4,549 -0,308 -0,030 0,388 7,544 B Antwerp 0,119 2,827 4,549 -0,308 -0,030 0,388 7,544 C 0,119 2,827 4,549 0,785 -0,030 0,227 -0,942 7,534 D 0,119 2,827 4,549 0,289 -0,028 0,227 7,981 E 0,119 2,827 4,549 -0,308 0,128 0,227 7,541
Ter
rest
rial
ac
idifi
catio
n/nu
trifi
catio
n (k
g SO
2 eq)
Reference 0,878 Base 0,002 0,011 0,656 -0,006 -0,069 0,017 0,611 A 0,002 0,011 0,656 0,009 -0,069 0,017 0,134 0,760 B Lisbon 0,002 0,011 0,656 -0,006 -0,069 0,080 0,674 B Antwerp 0,002 0,011 0,656 -0,006 -0,069 0,080 0,674 C 0,002 0,011 0,656 0,023 -0,069 0,017 0,189 0,829 D 0,002 0,011 0,656 0,195 -0,069 0,017 0,812 E 0,002 0,011 0,656 -0,006 -0,014 0,017 0,666
Lan
d oc
cupa
tion
(m2 or
qyr)
Reference 0,137 Base 3,637 13,298 21,187 -3,090 -6,147 1,766 30,652 A 3,637 13,298 21,187 10,096 -6,146 1,766 -14,263 29,576 B Lisbon 3,637 13,298 21,187 -3,090 -6,147 6,358 35,244 B Antwerp 3,637 13,298 21,187 -3,090 -6,147 6,358 35,244 C 3,637 13,298 21,187 19,549 -6,122 1,766 -50,170 3,146 D 3,637 13,298 21,187 10,799 -6,159 1,766 44,528 E 3,637 13,298 21,187 -3,090 -2,332 1,766 34,466
Glo
bal w
arm
ing
(kg
CO
2 eq)
Reference 67,073

F
Base 126,956 133,889 215,677 -15,066 -175,442 35,550 321,564 A 126,956 133,889 215,677 118,754 -175,057 35,550 -553,822 -98,054 B Lisbon 126,956 133,889 215,677 -15,066 -175,442 110,762 396,776 B Antwerp 126,956 133,889 215,677 -15,066 -175,442 110,762 396,776 C 126,956 133,889 215,677 297,918 -175,188 35,550 -589,812 44,989 D 126,956 133,889 215,677 216,240 -175,653 35,550 552,659 E 126,956 133,889 215,677 -15,066 -111,906 35,550 385,100
Non
-ren
ewab
le e
nerg
y (M
J)
Reference 2487,547

G
Table 6 - Environmental category scores per scenario and production phase – Ecoindicator99.
Nursery Establishment Cultivation Extraction Transesterification End Use Biogas
production Pellet electricity Total
Base 7,832E-07 3,912E-06 6,243E-06 -1,678E-06 -1,297E-06 3,826E-07 8,346E-06 A 7,832E-07 3,912E-06 6,243E-06 2,273E-06 -1,297E-06 3,826E-07 -4,294E-06 8,003E-06 B Lisbon 7,832E-07 3,912E-06 6,243E-06 -1,678E-06 -1,297E-06 1,367E-06 9,330E-06 B Antwerp 7,832E-07 3,912E-06 6,243E-06 -1,678E-06 -1,297E-06 1,401E-06 9,364E-06 C 7,832E-07 3,912E-06 6,243E-06 4,276E-06 -1,292E-06 3,826E-07 -1,117E-05 3,139E-06 D 7,832E-07 3,912E-06 6,243E-06 1,313E-06 -1,300E-06 3,826E-07 1,133E-05 E 7,832E-07 3,912E-06 6,243E-06 -1,678E-06 -4,673E-07 3,826E-07 9,175E-06
Clim
ate
Cha
nge
(DA
LY
)
Reference 1,435E-05 Base 1,566E-09 1,155E-10 3,279E-10 7,518E-11 -1,299E-08 1,025E-10 -1,081E-08 A 1,566E-09 1,155E-10 3,279E-10 2,592E-10 -1,299E-08 1,025E-10 -3,443E-10 -1,097E-08 B Lisbon 1,566E-09 1,155E-10 3,279E-10 7,518E-11 -1,299E-08 7,833E-10 -1,013E-08 B Antwerp 1,566E-09 1,155E-10 3,279E-10 7,518E-11 -1,299E-08 8,022E-10 -1,013E-08 C 1,566E-09 1,155E-10 3,279E-10 2,415E-09 -1,300E-08 1,025E-10 -1,263E-09 -9,732E-09 D 1,566E-09 1,155E-10 3,279E-10 2,343E-09 -1,300E-08 1,025E-10 -8,542E-09 E 1,566E-09 1,155E-10 3,279E-10 7,518E-11 -1,237E-08 1,025E-10 -1,018E-08
Ozo
ne la
yer
(DA
LY
)
Reference 1,633E-08 Base 0,119 2,821 4,539 -0,286 -0,030 0,227 7,390 A 0,119 2,821 4,539 0,190 -0,030 0,227 -0,479 7,387 B Lisbon 0,119 2,821 4,539 -0,286 -0,030 0,396 7,558 B Antwerp 0,119 2,821 4,539 -0,286 -0,030 0,405 7,558 C 0,119 2,821 4,539 0,684 -0,030 0,227 -0,818 7,541 D 0,119 2,821 4,539 0,289 -0,029 0,227 7,966 E 0,119 2,821 4,539 -0,286 0,134 0,227 7,554
Aci
dific
atio
n/eu
trop
hic
atio
n (P
DFm
2 yr)
Reference 0,879 Base 0,004 0,017 0,662 -0,010 -0,118 0,029 0,584 A 0,004 0,017 0,662 0,014 -0,118 0,029 0,134 0,742 B Lisbon 0,004 0,017 0,662 -0,010 -0,118 0,122 0,677 B Antwerp 0,004 0,017 0,662 -0,010 -0,118 0,124 0,679 C 0,004 0,017 0,662 0,299 -0,118 0,029 0,002 0,895 D 0,004 0,017 0,662 0,274 -0,118 0,029 0,869 E 0,004 0,017 0,662 -0,010 -0,039 0,029 0,663
Lan
d us
e PD
Fm2 yr
)
Reference 0,991

H
Base 10,204 10,936 17,289 -2,555 -9,304 2,093 28,662 A 10,204 10,936 17,289 8,308 -9,269 2,093 -48,429 -8,870 B Lisbon 10,204 10,936 17,289 -2,555 -9,304 7,482 34,228 B Antwerp 10,204 10,936 17,289 -2,555 -9,304 7,659 34,052 C 10,204 10,936 17,289 21,424 -9,288 2,093 -40,823 11,834 D 10,204 10,936 17,289 14,147 -9,319 2,093 45,348 E 10,204 10,936 17,289 -2,555 -4,684 2,093 33,283
Foss
il fu
els
MJ
surp
lus)
Reference 192,762

I
Table 7 – Impact assessment scores for base scenario per unit process – IMPACT2002+ characterization.
Polybags Irrigation Establishment NPK Tractor Shed Cultivation
NPK Pesticides Extraction unit
Electricity to extraction
Seed cake credit
OLD kg CFC-11 eq 1,487E-06 4,772E-09 1,077E-07 3,120E-09 4,005E-08 2,747E-07 6,893E-06 3,473E-09 2,434E-07 -1,761E-07 TAN kg SO2 eq 0,113 0,001 2,635 0,083 0,013 4,361 0,002 0,180 -0,457 LO m2orgarable 0,002 0,009 0,002 0,580 0,022 0,010 -0,014 GW kg CO2 eq 3,583 0,054 12,023 1,275 0,622 20,554 0,031 0,054 10,142 -13,175 NER kg SO2 eq 124,651 2,288 118,675 15,213 6,652 208,633 0,807 119,251 -133,728 MeOH NaOH Transesterification
plant Transesterification electricity Glycerine credits Car Use
OLD kg CFC-11 eq 1,760E-07 1,079E-08 2,095E-09 1,662E-07 -8,142E-06 1,044E-07 TAN kg SO2 eq 0,016 0,006 0,001 0,123 -0,169 0,030 0,188 LO m2orgarable 0,004 0,001 0,008 -0,075 0,015 GW kg CO2 eq 0,815 0,244 0,033 6,923 -14,130 1,766 NER kg SO2 eq 38,222 4,127 0,494 81,396 -299,258 35,550 Table 8 – Impact assessment scores for scenario A per unit process – IMPACT2002+ characterization.
Polybags Irrigation Establishment NPK Tractor Shed Cultivation
NPK Pesticides Extraction unit
Electricity to extraction
OLD kg CFC-11 eq 1,487E-06 4,772E-09 1,077E-07 3,120E-09 4,005E-08 2,747E-07 6,893E-06 3,473E-09 2,434E-07 TAN kg SO2 eq 0,113 0,001 2,635 0,083 0,013 4,361 0,002 0,180 LO m2orgarable 0,002 0,009 0,002 0,580 0,022 0,010 GW kg CO2 eq 3,583 0,054 12,023 1,275 0,622 20,554 0,031 0,054 10,142 NER kg SO2 eq 124,651 2,288 118,675 15,213 6,652 208,633 0,807 119,251
MeOH NaOH Transesterification plant
Transesterification electricity
Glycerine credits Car Use
Anaerobis digestion plant
Slurry credit Biogas credit
OLD kg CFC-11 eq 1,760E-07 1,079E-08 2,095E-09 1,662E-07 -8,142E-06 1,044E-07 2,854E-08 -1,603E-07 -1,966E-07 TAN kg SO2 eq 0,016 0,006 0,001 0,123 -0,169 0,030 0,188 0,009 -0,416 -0,053 LO m2orgarable 0,004 0,001 0,008 -0,075 0,015 0,152 -0,013 -0,016 GW kg CO2 eq 0,815 0,244 0,033 6,923 -14,130 1,766 0,434 -11,999 -2,698 NER kg SO2 eq 38,222 4,127 0,494 81,396 -299,258 35,550 5,850 -121,780 -437,892

J
Table 9 - Impact assessment scores for scenario B per unit process – IMPACT2002+ characterization.
Polybags Irrigation Establishment NPK Tractor Shed Cultivation
NPK Pesticides Extraction unit
Electricity to extraction
Seed cake credit
OLD kg CFC-11 eq 1,487E-06 4,772E-09 1,077E-07 3,120E-09 4,005E-08 2,747E-07 6,893E-06 3,473E-09 2,434E-07 -1,761E-07 TAN kg SO2 eq 0,113 0,001 2,635 0,083 0,013 4,361 0,002 0,180 -0,457 LO m2orgarable 0,002 0,009 0,002 0,580 0,022 0,010 -0,014 GW kg CO2 eq 3,583 0,054 12,023 1,275 0,622 20,554 0,031 0,054 10,142 -13,175 NER kg SO2 eq 124,651 2,288 118,675 15,213 6,652 208,633 0,807 119,251 -133,728 MeOH NaOH Transesterificati
on plant Transesterification electricity
Glycerine credits
Transport to Lisbon
Transport to Antwerp Car Use
OLD kg CFC-11 eq 1,760E-07 1,079E-08 2,095E-09 1,662E-07 -8,142E-06 6,511E-07 6,692E-07 1,044E-07 TAN kg SO2 eq 0,016 0,006 0,001 0,123 -0,169 0,162 0,171 0,030 0,188 LO m2orgarable 0,004 0,001 0,008 -0,075 0,058 0,058 0,015 GW kg CO2 eq 0,815 0,244 0,033 6,923 -14,130 4,592 4,750 1,766 NER kg SO2 eq 38,222 4,127 0,494 81,396 -299,258 75,212 77,751 35,550 Table 10 - Impact assessment scores for scenario C per unit process – IMPACT2002+ characterization.
Polybags Irrigation Establishment NPK Tractor Shed Cultivation
NPK Pesticides Extraction unit
Transport of seeds
Electricity to extraction
OLD kg CFC-11 eq 1,487E-06 4,772E-09 1,077E-07 3,120E-09 4,005E-08 2,747E-07 6,893E-06 3,473E-09 2,14E-06 2,434E-07 TAN kg SO2 eq 0,113 0,001 2,635 0,083 0,013 4,361 0,002 0,538 0,180 LO m2orgarable 0,002 0,009 0,002 0,580 0,022 0,010 0,181 GW kg CO2 eq 3,583 0,054 12,023 1,275 0,622 20,554 0,031 0,054 13,675 10,142 NER kg SO2 eq 124,651 2,288 118,675 15,213 6,652 208,633 0,807 228,053 119,251
MeOH NaOH Transesterification plant
Transesterification electricity
Glycerine credits Car Use
Pelletizing Credit pellets
OLD kg CFC-11 eq 1,760E-07 1,079E-08 2,095E-09 1,662E-07 -8,142E-06 1,044E-07 1,39E-07 -1,448E-06 TAN kg SO2 eq 0,016 0,006 0,001 0,123 -0,169 0,030 0,188 0,103 -1,072 LO m2orgarable 0,004 0,001 0,008 -0,075 0,015 0,002 0,000 GW kg CO2 eq 0,815 0,244 0,033 6,923 -14,130 1,766 5,738 -60,340 NER kg SO2 eq 38,222 4,127 0,494 81,396 -299,258 35,550 67,545 -709,466

K
Table 11 - Impact assessment scores for scenario D per unit process – IMPACT2002+ characterization.
Polybags Irrigation Establishment NPK Tractor Shed Cultivation
NPK Pesticides Transport of seeds
Seed cake credit
OLD kg CFC-11 eq 1,487E-06 4,772E-09 1,077E-07 3,120E-09 4,005E-08 2,747E-07 6,893E-06 2,166E-06 -1,761E-07 TAN kg SO2 eq 0,113 0,001 2,635 0,083 0,013 4,361 0,553 -0,457 LO m2orgarable 0,002 0,009 0,002 0,580 0,022 0,185 -0,014 GW kg CO2 eq 3,583 0,054 12,023 1,275 0,622 20,554 0,031 13,885 -13,175 NER kg SO2 eq 124,651 2,288 118,675 15,213 6,652 208,633 231,274 -133,728
Extraction unit
Electricity to extraction MeOH NaOH Transesterific
ation plant
Transesterification electricity
Glycerine credits Car Use
OLD kg CFC-11 eq 3,473E-09 2,434E-07 1,760E-07 1,079E-08 2,095E-09 1,662E-07 -8,142E-06 1,044E-07 TAN kg SO2 eq 0,002 0,180 0,016 0,006 0,001 0,123 -0,169 0,030 0,188 LO m2orgarable 0,010 0,004 0,001 0,008 -0,075 0,015 GW kg CO2 eq 0,054 10,142 0,815 0,244 0,033 6,923 -14,130 1,766 NER kg SO2 eq 0,807 119,251 38,222 4,127 0,494 81,396 -299,258 35,550 Table 12 - Impact assessment scores for scenario E per unit process – IMPACT2002+ characterization.
Polybags Irrigation Establishment NPK Tractor Shed Cultivation
NPK Pesticides Transport of oil
Seed cake credit
OLD kg CFC-11 eq 1,487E-06 4,772E-09 1,077E-07 3,120E-09 4,005E-08 2,747E-07 6,893E-06 5,951E-07 -1,761E-07 TAN kg SO2 eq 0,113 0,001 2,635 0,083 0,013 4,361 0,152 -0,457 LO m2orgarable 0,002 0,009 0,002 0,580 0,022 0,051 -0,014 GW kg CO2 eq 3,583 0,054 12,023 1,275 0,622 20,554 0,031 3,814 -13,175 NER kg SO2 eq 124,651 2,288 118,675 15,213 6,652 208,633 63,536 -133,728 Extraction
unit Electricity to extraction MeOH NaOH Transesterifi
cation plant Transesterification electricity
Glycerine credits Car Use
OLD kg CFC-11 eq 3,473E-09 2,434E-07 1,760E-07 1,079E-08 2,095E-09 1,662E-07 -8,142E-06 1,044E-07 TAN kg SO2 eq 0,002 0,180 0,016 0,006 0,001 0,123 -0,169 0,030 0,188 LO m2orgarable 0,010 0,004 0,001 0,008 -0,075 0,015 GW kg CO2 eq 0,054 10,142 0,815 0,244 0,033 6,923 -14,130 1,766 NER kg SO2 eq 0,807 119,251 38,222 4,127 0,494 81,396 -299,258 35,550

L
Table 13 - Impact assessment scores for base scenario per unit process – Ecoindicator99.
Polybags Irrigation Establishment NPK Tractor Shed Cultivation
NPK Pesticides Extraction unit
Electricity to extraction
Seed cake credit
CG DALY 7,716E-07 1,158E-08 3,635E-06 2,764E-07 1,028E-07 6,140E-06 1,645E-10 1,205E-08 2,257E-06 -3,947E-06 OL DALY 1,561E-09 4,661E-12 1,123E-10 3,262E-12 4,134E-11 2,862E-10 1,356E-13 3,596E-12 2,556E-10 -1,840E-10 AE PDFm2yr 0,118 0,001 2,735 0,086 0,013 4,526 0,002 0,188 -0,476 LU PDFm2yr 0,004 0,015 0,002 0,625 0,038 0,014 -0,024 FF MJ 10,134 0,069 9,675 1,260 0,401 16,885 0,001 0,051 8,249 -10,855
MeOH NaOH Transesterification
plant Transesterification electricity Glycerine credits Car Use
CG DALY 1,833E-07 5,638E-08 7,336E-09 1,541E-06 -3,076E-06 3,826E-07 OL DALY 1,627E-10 1,129E-11 2,165E-12 1,745E-10 -1,334E-08 1,025E-10 AE PDFm2yr 0,017 0,006 0,001 0,128 -0,176 0,031 0,196 LU PDFm2yr 0,011 0,001 0,012 -0,141 0,029 FF MJ 2,849 0,265 0,031 5,630 -18,046 2,093 Table 14 - Impact assessment scores for scenario A per unit process – Ecoindicator99.
Polybags Irrigation Establishment NPK Tractor Shed Cultivation
NPK Pesticides Extraction unit
Electricity to extraction
CG DALY 7,716E-07 1,158E-08 3,635E-06 2,764E-07 1,028E-07 6,140E-06 1,645E-10 1,205E-08 2,257E-06 OL DALY 1,561E-09 4,661E-12 1,123E-10 3,262E-12 4,134E-11 2,862E-10 1,356E-13 3,596E-12 2,556E-10 AE PDFm2yr 0,118 0,001 2,735 0,086 0,013 4,526 0,002 0,188 LU PDFm2yr 0,004 0,015 0,002 0,625 0,038 0,014 FF MJ 10,134 0,069 9,675 1,260 0,401 16,885 0,001 0,051 8,249
MeOH NaOH Transesterification plant
Transesterification electricity
Glycerine credits Car Use
Anaerobis digestion plant
Slurry credit Biogas credit
CG DALY 1,833E-07 5,638E-08 7,336E-09 1,541E-06 -3,076E-06 3,826E-07 3,712E-08 -3,595E-06 -7,357E-07 OL DALY 1,627E-10 1,129E-11 2,165E-12 1,745E-10 -1,334E-08 1,025E-10 2,893E-11 -1,675E-10 -2,057E-10 AE PDFm2yr 0,017 0,006 0,001 0,128 -0,176 0,031 0,196 0,009 -0,434 -0,055 LU PDFm2yr 0,011 0,001 0,012 -0,141 0,029 0,174 -0,022 -0,018 FF MJ 2,849 0,265 0,031 5,630 -18,046 2,093 0,369 -9,885 -38,913

M
Table 15 - Impact assessment scores for scenario B per unit process – Ecoindicator99.
Polybags Irrigation Establishment NPK Tractor Shed Cultivation
NPK Pesticides Extraction unit
Electricity to extraction
Seed cake credit
CG DALY 7,716E-07 1,158E-08 3,635E-06 2,764E-07 1,028E-07 6,140E-06 1,645E-10 1,205E-08 2,257E-06 -3,947E-06 OL DALY 1,561E-09 4,661E-12 1,123E-10 3,262E-12 4,134E-11 2,862E-10 1,356E-13 3,596E-12 2,556E-10 -1,840E-10 AE PDFm2yr 0,118 0,001 2,735 0,086 0,013 4,526 0,002 0,188 -0,476 LU PDFm2yr 0,004 0,015 0,002 0,625 0,038 0,014 -0,024 FF MJ 10,134 0,069 9,675 1,260 0,401 16,885 0,001 0,051 8,249 -10,855 MeOH NaOH Transesterificati
on plant Transesterification electricity
Glycerine credits
Transport to Lisbon
Transport to Antwerp Car Use
CG DALY 1,833E-07 5,638E-08 7,336E-09 1,541E-06 -3,076E-06 9,848E-07 2,491E-07 3,826E-07 OL DALY 1,627E-10 1,129E-11 2,165E-12 1,745E-10 -1,334E-08 6,808E-10 4,751E-10 1,025E-10 AE PDFm2yr 0,017 0,006 0,001 0,128 -0,176 0,169 0,114 0,031 0,196 LU PDFm2yr 0,011 0,001 0,012 -0,141 0,093 0,075 0,029 FF MJ 2,849 0,265 0,031 5,630 -18,046 5,389 -33,524 2,093 Table 16 - Impact assessment scores for scenario C per unit process – Ecoindicator99.
Polybags Irrigation Establishment NPK Tractor Shed Cultivation
NPK Pesticides Extraction unit
Transport of seeds
Electricity to extraction
CG DALY 7,716E-07 1,158E-08 3,635E-06 2,764E-07 1,028E-07 6,140E-06 1,645E-10 1,205E-08 2,989E-06 2,434E-07 OL DALY 1,561E-09 4,661E-12 1,123E-10 3,262E-12 4,134E-11 2,862E-10 1,356E-13 3,596E-12 2,268E-09 0,180 AE PDFm2yr 0,118 0,001 2,735 0,086 0,013 4,526 0,002 0,575 LU PDFm2yr 0,004 0,015 0,002 0,625 0,038 0,014 0,285 10,142 FF MJ 10,134 0,069 9,675 1,260 0,401 16,885 0,001 0,051 16,698 119,251
MeOH NaOH Transesterification plant
Transesterification electricity
Glycerine credits Car Use
Pelletizing Credit pellets
CG DALY 1,833E-07 5,638E-08 7,336E-09 1,541E-06 -3,076E-06 3,826E-07 2,264E-06 -1,343E-05 OL DALY 1,627E-10 1,129E-11 2,165E-12 1,745E-10 -1,334E-08 1,025E-10 2,577E-10 -1,521E-09 AE PDFm2yr 0,017 0,006 0,001 0,128 -0,176 0,031 0,196 0,189 -1,116 LU PDFm2yr 0,011 0,001 0,012 -0,141 0,029 0,002 0,000 FF MJ 2,849 0,265 0,031 5,630 -18,046 2,093 8,252 -49,075

N
Table 17 - Impact assessment scores for scenario D per unit process – Ecoindicator99.
Polybags Irrigation Establishment NPK Tractor Shed Cultivation
NPK Pesticides Transport of seeds
Seed cake credit
CG DALY 7,716E-07 1,158E-08 3,635E-06 2,764E-07 1,028E-07 6,140E-06 1,645E-10 2,989E-06 -3,947E-06 OL DALY 1,561E-09 4,661E-12 1,123E-10 3,262E-12 4,134E-11 2,862E-10 1,356E-13 2,268E-09 -1,840E-10 AE PDFm2yr 0,118 0,001 2,735 0,086 0,013 4,526 0,575 -0,476 LU PDFm2yr 0,004 0,015 0,002 0,625 0,038 0,285 -0,024 FF MJ 10,134 0,069 9,675 1,260 0,401 16,885 0,001 16,698 -10,855
Extraction unit
Electricity to extraction MeOH NaOH Transesterific
ation plant
Transesterification electricity
Glycerine credits Car Use
CG DALY 1,205E-08 2,434E-07 1,833E-07 5,638E-08 7,336E-09 1,541E-06 -3,076E-06 3,826E-07 OL DALY 3,596E-12 0,180 1,627E-10 1,129E-11 2,165E-12 1,745E-10 -1,334E-08 1,025E-10 AE PDFm2yr 0,002 0,017 0,006 0,001 0,128 -0,176 0,031 0,196 LU PDFm2yr 0,014 10,142 0,011 0,001 0,012 -0,141 0,029 FF MJ 0,051 119,251 2,849 0,265 0,031 5,630 -18,046 2,093 Table 18 - Impact assessment scores for scenario E per unit process – Ecoindicator99.
Polybags Irrigation Establishment NPK Tractor Shed Cultivation
NPK Pesticides Transport of oil
Seed cake credit
CG DALY 7,716E-07 1,158E-08 3,635E-06 2,764E-07 1,028E-07 6,140E-06 1,645E-10 8,213E-07 -3,947E-06 OL DALY 1,561E-09 4,661E-12 1,123E-10 3,262E-12 4,134E-11 2,862E-10 1,356E-13 6,230E-10 -1,840E-10 AE PDFm2yr 0,118 0,001 2,735 0,086 0,013 4,526 0,158 -0,476 LU PDFm2yr 0,004 0,015 0,002 0,625 0,038 0,078 -0,024 FF MJ 10,134 0,069 9,675 1,260 0,401 16,885 0,001 4,587 -10,855
Extraction unit
Electricity to extraction MeOH NaOH Transesterific
ation plant
Transesterification electricity
Glycerine credits Car Use
CG DALY 1,205E-08 2,434E-07 1,833E-07 5,638E-08 7,336E-09 1,541E-06 -3,076E-06 3,826E-07 OL DALY 3,596E-12 0,180 1,627E-10 1,129E-11 2,165E-12 1,745E-10 -1,334E-08 1,025E-10 AE PDFm2yr 0,002 0,017 0,006 0,001 0,128 -0,176 0,031 0,196 LU PDFm2yr 0,014 10,142 0,011 0,001 0,012 -0,141 0,029 FF MJ 0,051 119,251 2,849 0,265 0,031 5,630 -18,046 2,093

O
Table 19 - Impact assessment scores for reference system per unit process – IMPACT2002+ characterization.
Crude oil extraction and transport
Refining Diesel distribution Car Use
OLD kg CFC-11 eq 6,915E-06 8,549E-06 1,044E-07 TAN kg SO2 eq 0,207 0,203 0,233 0,030 0,171 LO m2orgarable 0,047 0,063 0,015 GW kg CO2 eq 3,065 6,952 7,970 1,766 47,320 NER kg SO2 eq 813,780 813,376 824,840 35,550 Table 20 - Impact assessment scores for reference system per unit process – Ecoindicator99.
Crude oil extraction and transport
Refining Diesel distribution Car Use
CG DALY 6,437E-07 1,542E-06 1,835E-06 3,826E-07 9,944E-06 OL DALY 7,255E-09 8,971E-09 1,025E-10 AE PDFm2yr 0,215 0,211 0,243 0,031 0,178 LU PDFm2yr 0,001 0,530 0,431 0,029 FF MJ 64,304 62,808 63,559 2,093