generic verification protocol for baghouse … · 2.5 µm primary particulate matter (pm2.5). while...
TRANSCRIPT

Revision No.: 8 Date: October 8, 2001
Page i of vi
GENERIC VERIFICATION PROTOCOL FOR BAGHOUSE FILTRATION PRODUCTS
EPA Cooperative Agreement No. CR826152-01-3 RTI Project No. 93U-7012-25
Prepared by:
ETS, INC.
APPROVED BY:
APCTVC Director: J. R. Farmer _Original signed by J.R. Farmer_ Date: _10/9/01__
APCTVC Quality Manager: R. S. Wright _Original signed by R.S. Wright_ Date: _10/9/01__
APCTVC Task Leader: J. H. Turner _Original signed by J.H. Turner_ Date: _10/5/01__
APCTVC Quality Manager C. E. Tatsch _Original signed by C.E. Tatsch_ Date: _10/8/01__ for BFP Testing
BFP Task Leader: J. C. Mycock _Original signed by J.C. Mycock_ Date: _10/9/01__
EPA Project Manager: T. G. Brna _Original signed by T.G. Brna_ Date: _10/2/01__
EPA Quality Manager: P. W. Groff _Original signed by P.W. Groff_ Date: _9/27/01__
Revision No.: 8Date: October 8, 2001
Page ii of vi
TABLE OF CONTENTS
FIGURES AND TABLES . . . . . . . . . . . . . . . . . . . . . . . . . . . . . . . . . . . . . . . . . . . . . . . . . . . . . . iv
NOMENCLATURE . . . . . . . . . . . . . . . . . . . . . . . . . . . . . . . . . . . . . . . . . . . . . . . . . . . . . . . . . . . . v
1.0 Introduction . . . . . . . . . . . . . . . . . . . . . . . . . . . . . . . . . . . . . . . . . . . . . . . . . . . . . . . . . . . . . . 1 1.1 Environmental Technology Verification . . . . . . . . . . . . . . . . . . . . . . . . . . . . . . . . 1 1.2 Air Pollution Control Technology Program . . . . . . . . . . . . . . . . . . . . . . . . . . . . . . 1 1.3 Project Organization and Responsibilities . . . . . . . . . . . . . . . . . . . . . . . . . . . . . . . 2 1.4 Program Overview . . . . . . . . . . . . . . . . . . . . . . . . . . . . . . . . . . . . . . . . . . . . . . . . . 2 1.5 Quality Management Documents . . . . . . . . . . . . . . . . . . . . . . . . . . . . . . . . . . . . . . 5
2.0 Objective, Scope, and Verification Parameters . . . . . . . . . . . . . . . . . . . . . . . . . . . . . . . . . . 7 2.1 Objective . . . . . . . . . . . . . . . . . . . . . . . . . . . . . . . . . . . . . . . . . . . . . . . . . . . . . . . . 7 2.2 Scope . . . . . . . . . . . . . . . . . . . . . . . . . . . . . . . . . . . . . . . . . . . . . . . . . . . . . . . . . . . 7 2.3 Verification Parameters . . . . . . . . . . . . . . . . . . . . . . . . . . . . . . . . . . . . . . . . . . . . . 7 2.4 Data Quality Objectives (DQOs) . . . . . . . . . . . . . . . . . . . . . . . . . . . . . . . . . . . . . 10
3.0 Test Methods to be Used . . . . . . . . . . . . . . . . . . . . . . . . . . . . . . . . . . . . . . . . . . . . . . . . . . . 11 3.1 Reference Medium and Aluminum Oxide Dust Specifications . . . . . . . . . . . . . . 11 3.2 Testing of Cleanable Filter Media Under Operational Conditions . . . . . . . . . . . 12
4.0 Reporting Requirements and Formats . . . . . . . . . . . . . . . . . . . . . . . . . . . . . . . . . . . . . . . . . 15
5.0 Dissemination of Verification Reports and Verification Statements . . . . . . . . . . . . . . . . . 16
6.0 Manufacturer’s Options if a Product Performs Below Expectations . . . . . . . . . . . . . . . . . 16
7.0 Limitations on Testing and Reporting . . . . . . . . . . . . . . . . . . . . . . . . . . . . . . . . . . . . . . . . 17
8.0 Acquisition of Products for Testing . . . . . . . . . . . . . . . . . . . . . . . . . . . . . . . . . . . . . . . . . . 17
9.0 Requirements for Product Labeling . . . . . . . . . . . . . . . . . . . . . . . . . . . . . . . . . . . . . . . . . . 17
10.0 Product Change . . . . . . . . . . . . . . . . . . . . . . . . . . . . . . . . . . . . . . . . . . . . . . . . . . . . . . . . . . 17
11.0 Requirements for Participating Laboratories . . . . . . . . . . . . . . . . . . . . . . . . . . . . . . . . . . . 18 11.1 Test Apparatus . . . . . . . . . . . . . . . . . . . . . . . . . . . . . . . . . . . . . . . . . . . . . . . . . . . 18
Revision No.: 8Date: October 8, 2001
Page iii of vi
12.0 Arranging Testing . . . . . . . . . . . . . . . . . . . . . . . . . . . . . . . . . . . . . . . . . . . . . . . . . . . . . . . 19
13.0 Test Laboratory Submittal of Results to APCTVC and EPA . . . . . . . . . . . . . . . . . . . . . . . 19
14.0 Requirements for Test/QA Plan . . . . . . . . . . . . . . . . . . . . . . . . . . . . . . . . . . . . . . . . . . . . . 19 14.1 Quality Management . . . . . . . . . . . . . . . . . . . . . . . . . . . . . . . . . . . . . . . . . . . . . . 20 14.2 Test/QA Plan . . . . . . . . . . . . . . . . . . . . . . . . . . . . . . . . . . . . . . . . . . . . . . . . . . . . 20 14.3 Standard Operating Procedures . . . . . . . . . . . . . . . . . . . . . . . . . . . . . . . . . . . . . . 23
15.0 Assessment and Response . . . . . . . . . . . . . . . . . . . . . . . . . . . . . . . . . . . . . . . . . . . . . . . . . . 24 15.1 Assessment Types . . . . . . . . . . . . . . . . . . . . . . . . . . . . . . . . . . . . . . . . . . . . . . . . 24 15.2 Assessment Frequency . . . . . . . . . . . . . . . . . . . . . . . . . . . . . . . . . . . . . . . . . . . . . 25 15.3 Response to Assessment . . . . . . . . . . . . . . . . . . . . . . . . . . . . . . . . . . . . . . . . . . . 25
16.0 Bibliography and References . . . . . . . . . . . . . . . . . . . . . . . . . . . . . . . . . . . . . . . . . . . . . . . 26 16.1 Federal Documents . . . . . . . . . . . . . . . . . . . . . . . . . . . . . . . . . . . . . . . . . . . . . . . 26 16.2 Non-Federal Documents . . . . . . . . . . . . . . . . . . . . . . . . . . . . . . . . . . . . . . . . . . . 27 16.3 References . . . . . . . . . . . . . . . . . . . . . . . . . . . . . . . . . . . . . . . . . . . . . . . . . . . . . . 27
ATTACHMENTS
ATTACHMENT 1 - Attaining the Quality Objective for the Mean Outlet Particle Concentration (PM2.5 or Total) . . . . . . . . . . . . . . . . . . . . . . . . . . . . . . . . . . . . . . . . . . . . . . 28
ATTACHMENT 2 - Quality Control Check Procedures . . . . . . . . . . . . . . . . . . . . . . . . . . . . . . . 30
APPENDIX
APPENDIX A - Sample Verification Statement . . . . . . . . . . . . . . . . . . . . . . . . . . . . . . . . . . A-1
Revision No.: 8Date: October 8, 2001
Page iv of vi
FIGURES AND TABLES
FIGURE 1 - Verification Organization . . . . . . . . . . . . . . . . . . . . . . . . . . . . . . . . . . . . . . . . . . . . . 3 FIGURE 2 - Diagram of BFP Test Apparatus . . . . . . . . . . . . . . . . . . . . . . . . . . . . . . . . . . . . . .13
TABLE 1 - Baghouse Filtration Products Technical Panel . . . . . . . . . . . . . . . . . . . . . . . . . . . . . 4 TABLE 2 - Data Quality Objectives . . . . . . . . . . . . . . . . . . . . . . . . . . . . . . . . . . . . . . . . . . . . . . . 8 TABLE 3 - Test Specifications . . . . . . . . . . . . . . . . . . . . . . . . . . . . . . . . . . . . . . . . . . . . . . . . . . . 9 TABLE 4 - Standard BFP Test Matrix . . . . . . . . . . . . . . . . . . . . . . . . . . . . . . . . . . . . . . . . . . . . 14
Revision No.: 8 Date: October 8, 2001
Page v of vi
NOMENCLATURE
ADQ Audit of Data Quality ANSI American National Standards Institute APCTVC Air Pollution Control Technology Verification Center ASHRAE American Society of Heating, Refrigerating, and Air-Conditioning
Engineers ASQC American Society for Quality Control ASTM American Society for Testing and Materials BFP Baghouse Filtration Product CEO Chief Executive Officer DQI Data Quality Indicator DQO Data Quality Objective EPA Environmental Protection Agency ETV Environmental Technology Verification G/C Gas-to-Cloth Ratio (filtration velocity) ISO International Organization for Standardization MSR Management System Review NAAQS National Ambient Air Quality Standards NIST National Institute of Standards and Technology NJDEP New Jersey Department of Environmental Protection PEA Performance Evaluation Audit PM Particulate Matter PM2.5 Particulate Matter 2.5 Micrometers and Less in Diameter PO Program Office QA Quality Assurance QAO Quality Assurance Officer QC Quality Control QMP Quality and Management Plan RTI Research Triangle Institute SOP Standard Operating Procedure TP Technical Panel TSA Technical Systems Audit VADEQ Virginia Department of Environmental Quality VDI Verein Deutscher Ingenieure

Revision No.: 8 Date: October 8, 2001
Page vi of vi
Units cfm cubic feet per minute cm w.g. centimeters of water gauge fpm feet per minute g/dscm grams per dry standard cubic meter g/h g/m2
grams per hour grams per square meter
gr/dscf grains per dry standard cubic foot in. w.g inches of water gauge m meters m/h m3/h
meters per hour cubic meters per hour
mm millimeters MPa megapascals ms milliseconds oz/yd2 ounces per square yard Pa pascals psi pounds per square inch s seconds scfm standard cubic feet per minute µg micrograms µm micrometers EC degrees Celsius EF degrees Fahrenheit

Revision No.: 8 Date: October 8, 2001
Page 1 of 32
1.0 Introduction
1.1 Environmental Technology Verification
The U.S. Environmental Protection Agency (EPA) has instituted the Environmental Technology Verification (ETV) Program to verify the performance of innovative or improved technical solutions to problems that threaten human health or the environment. The EPA created the ETV Program to accelerate substantially the entrance of new or improved environmental technologies into the domestic and international marketplace. It is a voluntary, non-regulatory program.
ETV supplies technology buyers and developers, consulting engineers, states, and permitters with high-quality, objective data on the performance of new or improved technologies. Availability of these data encourages more rapid protection of the environment with better and less expensive approaches.
The ETV Program has established verification efforts in 12 pilot areas during its pilot period (1995-2000). In these pilot programs, EPA utilized the expertise of verification partners to design efficient processes for conducting performance tests of environmental control technologies. EPA selected its verification partners from both the public and private non-profit sectors, including laboratories, state agencies, and universities. In the ETV Program restructuring after its pilot period, six verification partners operate verification centers that oversee and report verification activities based on testing that follows protocols developed with input from all major stakeholder/customer groups associated with the technology area.
The goal of the ETV Program is to verify the environmental performance characteristics of commercially ready technologies through the evaluation of objective and quality-assured data so that potential purchasers and permitters are provided with an independent and credible assessment of what they are buying and permitting.
1.2 Air Pollution Control Technology Program
One of the ETV centers is the Air Pollution Control Technology Verification Center (APCTVC). EPA’s verification partner in the APCTVC is RTI, a nonprofit contract research organization with headquarters in Research Triangle Park, NC. The APCTVC verifies the performance of commercially ready technologies used to control air pollutant emissions. The emphasis of the APCTVC is on technologies for controlling particulate matter, volatile organic compounds (VOCs), nitrogen oxides (NOx), and hazardous air pollutants for both mobile and stationary sources. As the program matures, more technologies may be added.
RTI cooperatively organized and developed the APCTVC for verification testing of air pollution control technologies. The ETV program is not intended for research and development, but is

Revision No.: 8 Date: October 8, 2001
Page 2 of 32
intended for those technologies that are ready for the marketplace. The stakeholders Advisory Committee assist the APCTVC in identifying and prioritizing technologies for testing and disseminating the results of tests. The APCTVC decides if a product is ready for the marketplace on a case-by-case basis after reviewing information presented by the manufacturer. Because results are made available to the public, manufacturers are generally sure of the expected test results before submitting a technology for verification.
The APCTVC has selected baghouse filtration products (BFP) as an air pollution control technology that would benefit from verification testing and reporting.
1.3 Project Organization and Responsibilities
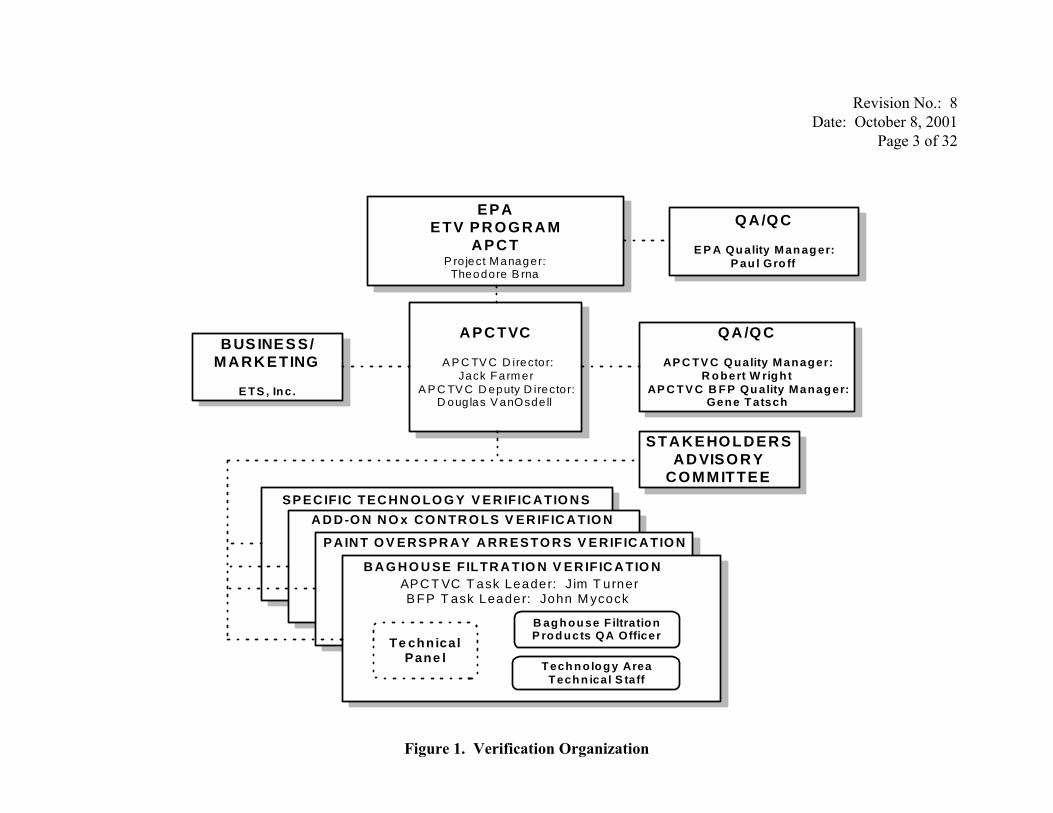
The APCTVC is headed by Mr. Jack Farmer of RTI as the APCTVC Director . Dr. Douglas VanOsdell is APCTVC’s Deputy Director . Dr. James Turner is the APCTVC Task Leader on this effort, while Mr. John Mycock of ETS, Inc., is the BFP Task Leader. Dr. Theodore Brna is the EPA Project Manager for the EPA’s cooperative agreement with RTI. The APCTVC Quality Manager is RTI’s Mr. Robert Wright. Dr. C. E. Tatsch of RTI will serve as the APCTVC Quality Manager on the BFP testing project. The technical panel (TP) is made up of ETV stakeholders, regulators/permitters, test laboratory representatives, end users, and filtration media developers/manufacturers. The final version of the Verification Statement will be approved by Mr. E. Timothy Oppelt, Director of the National Risk Management Research Laboratory. Figure 1 diagrams the project organization and responsibilities. Table 1 provides a listing of TP members.
1.4 Program Overview
The purpose of this document is to establish the procedures for verifying performance of BFP. A strong interest exists in verifying the performance of control systems for fine particulate matter (PM) because EPA has issued a new National Ambient Air Quality Standard (NAAQS) for 2.5 µm primary particulate matter (PM2.5). While emission limitations for fine PM are not expected to be imposed before the year 2002, existing stationary source emission limits will remain in place and coarse particulate matter will serve as a surrogate for fine PM.
Baghouses and their accompanying filter media have long been one of the leading particulate control techniques for industrial sources. Increasing emphasis on higher removal efficiencies has helped the baghouse to be continually more competitive when compared to the other generic PM control devices to the point where it is now the control option of choice for most industrial applications. The development of new and improved filter media has further enhanced baghouse capability to control fine PM over an expanded range of industrial applications.
Revision No.: 8Date: October 8, 2001
Page 3 of 32
APC TVC
A P C TV C D irector: Jack Fa rm er
A P C TV C D eputy D irector: D oug las V anOsde ll
BUS INES S/ MARK ETING
E TS , In c.
QA /Q C
AP C TV C Quality Manager: R o bert W rig ht
AP C T V C B F P Qu ality Manag er:Gene T atsch
SP EC IFIC TEC HN O LO G Y V E R IF IC ATIO N S A D D-O N N O x CO N TR O LS V ER IF IC A TIO N
P AIN T O V E RS PR AY A RR ES TO RS V E RIF IC ATIO N
B A G HO U SE F ILTR A TIO N V ER IF IC A TIO N APC T VC T ask Leader: J im T urner B FP T ask Leader: John M ycock
Te chnical Pane l
B ag h ou se F iltrationP rod ucts QA Officer
T ech n o log y Area T ech n ical S taff
STA KEHO LDERS AD VISO R Y
CO MMITTEE
EPA E TV PR OG RA M
APC T P ro ject M anager:
Theodore B rna
Q A/Q C
E P A Qu ality Man ag er: P au l Gro ff
Figure 1. Verification Organization

Revision No.: 8 Date: October 8, 2001
Page 4 of 32
Table 1. Baghouse Filtration Products Technical Panel
Regulators John Bosch, USEPA John Daniel, VADEQ Yogesh Doshi, VADEQ Mike Klein, NJDEP Tom Logan, USEPA
Test Laboratories John McKenna, ETS, Inc.
Vendors/Manufacturers Jim Griffin, Tetratec Alan Handermann, BASF Corp. Scott Hunter, BFG Industries Andrew Jeffery, Specific Surface Corp. Maryann Kenney, Albany Int’l Robbie Moss, Menardi-Criswell Wilson Poon, W. L. Gore. & Assoc. Greg Rice, Albarrie Canada, Ltd. Clint Scoble, BWF America Affiliate Alan Smithies, BHA Group Ken Spindola, Inspec Fibres Mike Swink, Air Purator Corp. Toby Wiik, Standard Filter Corp.
ETV Program Ted Brna, EPA Jack Farmer, RTI John Mycock, ETS, Inc. C. E. Tatsch, RTI Jim Turner, RTI
Users Bob Bessette, CIBO Roger Blevins, Fluor Daniel/Alcoa Karen Canody, Roanoke Electric Steel Andrew Haberl, Procedair Industries Eugene Kulesza, Portland Cement Assoc. Lee Morgan, Farr Company Jeff Muffat, National Assoc. of Manufacturers Dave Schutt, 3M Roger Williams, Pneumafil, Menardi, Mikropul

Revision No.: 8 Date: October 8, 2001
Page 5 of 32
While it is not clear what pollutants will be controlled to insure nationwide attainment of a new NAAQS for PM2.5, it is likely that a more stringent fine particle emission limit will be required. This action means that owners/operators of new or existing baghouses will have to consider fine particulate removal effectiveness when making decisions on purchasing filter media. Creditable information on the performance of filter media, at reasonable cost, will assist them in their selection process. Such information will also provide valuable guidance for consultants and state and local agencies reviewing baghouse permit applications.
Testing within the BFP project will be performed by laboratories that elect, and qualify, to participate in the BFP project. Upon completion of a verification test, the test laboratory will prepare a draft Verification Statement (see example shown in Appendix A) and a draft Verification Test Report, which will include test conditions, test results, and QA results. The test laboratory will submit the draft Verification Statement and draft Verification Test Report to the APCTVC Quality Leader for the BFP Testing Project. The submittal will be in electronic format (WordPerfect). Example statements and reports will be available in electronic form to participating laboratories to facilitate consistent formatting. Any necessary deviations from this generic verification protocol must be identified and explained in the individual laboratory’s test/QA plan and must be approved by the APCTVC before proceeding with the verification test. The verification test report will provide all the necessary information to support the verification test and the resulting verification statement. The APCTVC will review the draft statement and report, and interact with the testing laboratory and fabric manufacturer as needed to resolve any questions or comments. Once all issues are resolved, the APCTVC will forward the revised verification test report and verification statement to the EPA for review and signature. The approved verification test report and statement will be available publicly. A manufacturer may request that a verification statement not be issued in the event that a product fails to meet the manufacturer’s expectations. (Refer to Section 6.0 for further information. Laboratory participation is discussed further in Section 11.0.)
1.5 Quality Management Documents
Management and testing within the BFP project is performed in accordance with procedures and protocols defined by a series of quality management documents. These include EPA’s QMP for the overall ETV program, APCTVC’s QMP for the overall APCTVC, the Generic Verification Protocol for Verification Testing of BFPs (this document), and test/QA plans prepared by each participating test laboratory. The first two documents are referenced in Section 16.1.
EPA’s QMP lays out the definitions, procedures, processes, inter-organizational relationships, and outputs that will ensure the quality of both the data and the programmatic elements of ETV. Part A of the ETV QMP contains the specifications and guidelines that are applicable to common or routine quality management functions and activities necessary to support the ETV program. Part B of the ETV QMP contains the specifications and guidelines that apply to test-specific environmental activities involving the generation,
Revision No.: 8 Date: October 8, 2001
Page 6 of 32
collection, analysis, evaluation, and reporting of test data. (EPA’s Quality and Management Plan for the Pilot Period [1995-2000], May 1998.)
APCTVC’s QMP describes the quality systems in place for the overall APCTVC. The QMP was prepared by RTI and approved by EPA. Among other quality management items, it defines what must be covered in the generic verification protocols and test/QA plans for technologies undergoing verification testing.
Generic Verification Protocols are prepared for each technology to be verified. These documents describe the overall procedures to be used for testing a specific technology and define the data quality objectives (DQOs). This document, the Generic Verification Protocol for Baghouse Filtration Products, incorporates input from the BFP Technical Panel, and has been approved by EPA. While specific to BFP, this document is “generic” in that it applies to all participating test laboratories within the pilot program. This document’s function is to promote uniform testing within the BFP verification test program.
Test Laboratory QMP describes the quality management system for each individual test laboratory. The QMP identifies the organizational responsibilities and proper management, handling, and documentation procedures for the specific test laboratory. Each test laboratory must prepare a QMP in accordance with the EPA QMP and with EPA QA/R-2 to comply with ANSI/ASQC E4 Standard requirements. The test laboratory QMP must be approved by either the APCTVC or the EPA prior to the first verification test. Once the test laboratory QMP has been approved, it must remain on site at the laboratory for audit review.
Test/QA Plans are prepared by each participating test laboratory. The test/QA plan details how the testing laboratory will implement and meet the requirements of the Generic Verification Protocol and the Test Laboratory QMP. The test/QA plan combines both a test plan and a quality assurance project plan. The test/QA plan addresses issues such as the laboratory’s management organization, test schedule, documentation, analytical methods and data collection requirements, calibration procedures and references, and specifies the QA and quality control (QC) requirements for obtaining verification data of sufficient quantity and quality to satisfy the DQOs of the Generic Verification Protocol. The test/QA plan should comply with section B2.2.2 of the ETV Quality and Management Plan for the Pilot Period as well as the EPA requirements for preparing a Quality Assurance Project Plan, (EPA QA/R-5). If greater detail is needed to describe the analytical procedures, a standard operating procedure (SOP) should be prepared (see Section 14.3 for more information). The test/QA plan and any accompanying SOPs must be approved by the APCTVC and EPA prior to the commencement of the laboratory’s verification testing program.

Revision No.: 8 Date: October 8, 2001
Page 7 of 32
2.0 Objective, Scope, and Verification Parameters
2.1 Objective
The objective of the ETV BFP project is to produce for the public credible test reports and verification statements regarding the fine particulate (2.5 µm diameter or less) removal by tested baghouse filtration media based on a modified VDI Method 3926, Part 2, “Testing of Filter Media for Cleanable Filters Under Operational Conditions,” as described in section 2.3.
2.2 Scope
Participating test laboratories will initiate a conditioning period consisting of 10,000 rapid pulse cycles (every 3 seconds) to simulate long-term use followed by 30 normal filtration cycles (triggered by a pressure drop of 1,000 Pa [4.0 inches of water]) for filter media recovery (cycles 10,001 - 10,030). A 6-hour performance test, beginning at cycle 10,031, will be initiated at the completion of the media recovery period. The conditioning, media recovery, and performance test periods will be performed on each of the three samples of commercially ready, cleanable baghouse filter media, 150 mm (5.88 inches) in diameter [exposed diameter is 140 mm (5.51 inches)], in a controlled laboratory environment, at a 120 m/h (6.6 fpm) filtration velocity (G/C), and at 18.4 g/dscm (8.0 gr/dscf) inlet dust concentration, as noted in Table 2, Data Quality Objectives, and Table 3, Test Specifications.
All filter samples will be tested using the above mentioned test specifications and the conditions listed in Table 2. If a vendor is interested in having his or her fabric tested at alternate test conditions he or she can have a supplemental test performed under his or her defined test conditions at his or her own expense. The supplemental test cannot be substituted for the original protocol defined verification test.
Filter structure other than flat swatches (e.g., pleated bags, cartridges, and ceramic elements) are likely candidates for verification. In these cases, the vendor/manufacturer should work with the participating test laboratory to propose a modification for the test apparatus and a suitable test plan that will be acceptable to EPA/APCTVC and meet all aspects of the data quality objectives identified in Section 2.4 and listed in Tables 2 and 3.
2.3 Verification Parameters
BFP Verification parameters (see Verification Statement, Appendix A) will consist of:
C Outlet particle concentration, PM2.5 [g/dscm (gr/dscf)]; C Outlet particle concentration, total mass [g/dscm (gr/dscf)]; C Average residual pressure drop (3 seconds after cleaning pulse, as stated in VDI method
3926) during the 6-hour performance test period [cm w.g. (in. w.g.)]; • Initial residual pressure drop of 6-hour performance test period [cm w.g. (in. w.g.)];
Revision No.: 8 Date: October 8, 2001
Page 8 of 32
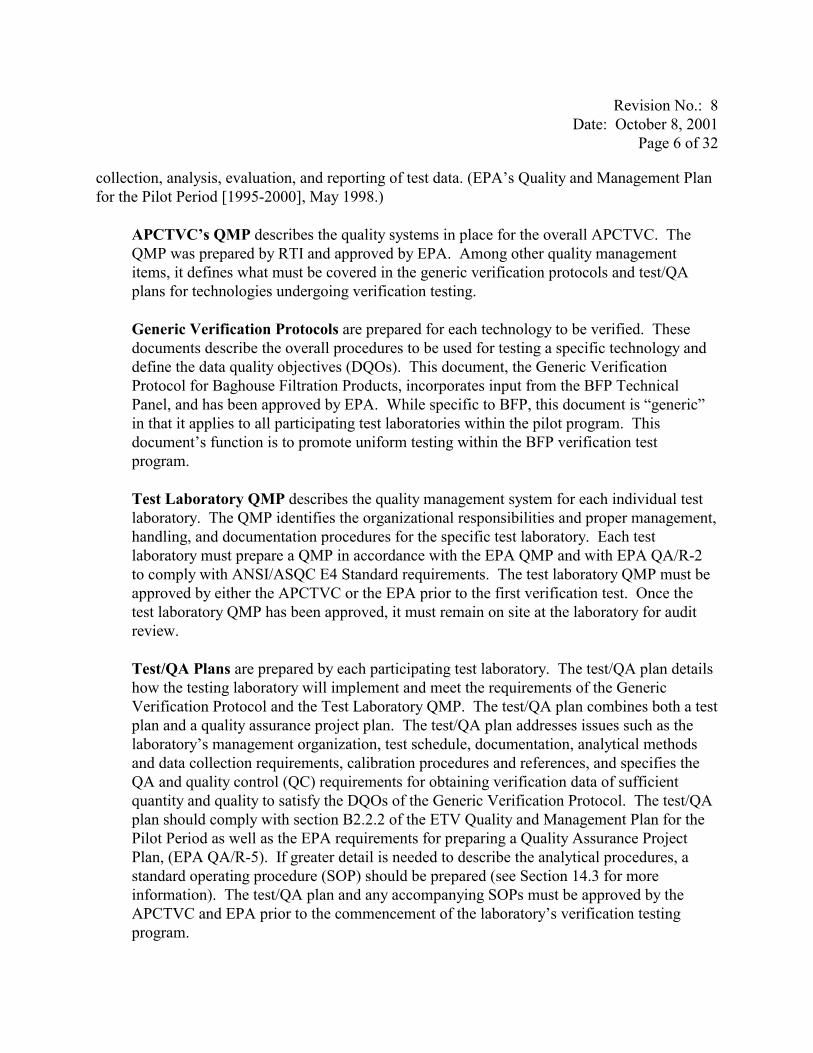
Table 2. Data Quality Objectives
Measurement Objectives for Associated Critical Measurements
Verification Parameter Qua
lity
Obj
ectiv
e [%
]
Resid
ual P
ress
ure
[cm w
.g.]
Flowr
ate -
Raw
Gas P
ump
[m 3 /h
]
Flow
rate
- Clea
n Gas
Pum
p[m
3 /h]
Mass
Gain
[g] Tim
e[s]
Weight Gain of Reference Fabric (g) with respect to APCTVC reference value ±10
Maximum Pressure Drop (cm w.g.) with respect to APCTVC reference value ±10
Mean Outlet Particle Concentration, PM2.5 (g/dscm) ±15* ± 0.23 ±0.06 ± 0.00005
Mean Outlet Particle Concentration, Total Mass (g/dscm) ±15* ± 0.23 ±0.06 ± 0.00005
Initial Residual Pressure Drop (cm w.g.) ± 5 ± 0.25
Residual Pressure Drop Increase (cm w.g.) ± 5 ± 0.25
Average Residual Pressure Drop (cm w.g.) ± 5 ± 0.25
Weight Gain of Filter Sample (g) ± 0.05
Number of Filtration Cycles Depends on cycle time
± 1
Average Filtration Cycle Time (s) ± 1 ± 1
*For highly efficient fabrics, the mass gains stated for these quality objectives may not be achieved in the specified test duration. For these tests it is acceptable for the indicated DQO not to be met.

Revision No.: 8 Date: October 8, 2001
Page 9 of 32
Table 3. Test Specifications
Constant Parameter Nominal Value
Acceptable Bias*
Acceptable Precision**
Instrument Frequency
Test Dust Particle Size 50% <2.5 µm +40-10% ± 0.0001 g filter Andersen Impactor, Model 50-900 Quarterly and each new batch (Pural NF) (Avg. 3 runs) mass gain per (as determined by analytical balance)
weighing
Test Dust Mass Mean Aerodynamic Diameter 1.5 µm ± 1 µm ± 0.0001 g filter Andersen Impactor, Model 50-900 Quarterly and each new batch (Pural NF ) (3-run avg.) (3-run avg.) mass gain per (as determined by analytical balance)
weighing
Filter Sample Diameter, mm (in.) 150 ± 1.6 ± 1.6 Filter cutter Each test specimen (exposed diameter is 140 mm, 5.51 in.) (5.88) (1/16) (1/16)
Inlet Raw Gas Flowrate, m3/hr (cfm) 5.8 (3.4) + 0.3 (0.2 ) + 0.01 (0.006) Mass flow controller Each test. Calibrate @ 6 months
Clean Gas Flowrate, m3/hr (cfm) 1.85 (1.10) +0.9 (0.06) + 0.01 (0.006) Mass flow controller Each test. Calibrate @ 6 months
Sample Gas Flowrate, m3/hr (cfm) 1.13 (0.67) + 0.06 (0.03) + 0.01 (0.006) Mass flow controller Each test. Calibrate @ 6 months
Filtration Velocity 120 (6.6) ± 6 ± 1.2 Mass flow controller and filter sample Each test. Calibrate every 6 (G/C Ratio)***, m/hr (fpm) (0.3) (0.07) area months
Pressure Drop Trigger for Cleaning 1,000 Pa ±0.127 cm w.g ± 0.127 cm w.g Pressure transducer Each test (4.0 in. w.g) (0.05 in. w.g) (0.05 in. w.g)
Rapid Pulse Cleaning Cycles (0 - 10,000), sec. 3 ± 1 ± 1 Datalogger clock Beginning of each test
Pulse Duration, ms 50.0 ± 5.0 ± 1.0 Pulse regulator Each test
Pulse Cleaning Pressure, MPa (psi) 0.52 ± 0.03 ± 0.007 Pulse regulator Each test (75.0) (5.0 ) (1.0)
Gas Temperature, EC (EF) 25 (77) ± 2 (4) ± 1 (1) Thermocouple Each test
Inlet Dust Concentration, g/dscm (gr/dscf) 18.4 (8.0) ± 3.6 (1.6)
± 0.22 (0.1 )
Dust load cell and mass flow controller Continuously
Minimum Aggregate Mass Gain for Impactor Substrate Filters, g
0.0001 ± 0.00005 Andersen Impactor, Model 50-900 (as determined by analytical balance)
Each test
Charge Neutralizer Polonium-210 alpha source Replace annually
Dust Feeder Operation, g/hr 100 ± 20 ± 20 Dust load cell Each dust loading operation * Acceptable bias = For the test to be valid, the instrument reading must record a value within listed range. For example, the ±4 degrees accuracy means that the temperature reading of the gas mustbe within the range of 73 to 81E Fahrenheit.** Precision = The precision of the instrument reading. For example, the thermometer or thermocouple that is used to measure temperature must record temperature within 1 degree of actual.*** Filtration velocity (G/C) = Clean gas stream volume / Exposed area of filter sample = 1.10 cfm / 0.166 ft2 = 6.6 fpm. 1.85 m3/hr / 0.01539 m2 = 120 m/hr.

Revision No.: 8 Date: October 8, 2001
Page 10 of 32
• Residual pressure drop increase during 6-hour performance test period [cm w.g. (in. w.g.)];
C Average filtration cycle time during the 6-hour performance test period (s);• Number of filtration cycles during performance period; and • Mass gain of verification sample filter at test completion (g), (measured from new fabric
filter mass, after 10-pulse cake removal, as stated in VDI method 3926).
Data quality objectives for each parameter can be found in Section 2.3, Table 2.
2.4 Data Quality Objectives (DQOs)
The data quality objectives (Table 2) combine those specified in VDI Method 3926 with added requirements on instrument precision and particulate measurement to ensure comparability between testing laboratories. The DQOs include precision of particulate measurement (mass and PM2.5) instruments, particulate concentrations used during testing, airflow accuracy, and precision of airflow measurements.
Electrostatically charged particles in the raw gas stream should be discharged in order to prevent particle agglomeration or loss of dust caused by adhesion of particles to the raw gas stream duct walls. VDI Method 3926 requires that a charge neutralizer be employed to neutralize particulate electrostatic charges; the charge neutralizer will be replaced annually to assure proper charge neutralization. The existing unit will be returned to the manufacturer each year and will be replaced with a new unit.
Prior to the first verification test, and once each calendar quarter, the participating test laboratory will measure the reference filter media using the same test apparatus, test dust, and test conditions as are used for the verification tests. Each of these quarterly tests will consist of three individual test runs, each of which will be conducted on a separate filter sample. Each test will consist of 30 normal filtration cycles and will follow the procedures described for the fabric recovery period of the verification test, described in Section 3.2 of this protocol. Three seconds after the conclusion of the thirtieth cleaning pulse, the differential pressure across the reference fabric will be recorded and the test apparatus will be shut off immediately thereafter. The reference fabric will then be removed from the test apparatus, weighed, and its weight gain recorded. As noted in the first two rows of Table 2, both the final differential pressure and the reference fabric weight gain must fall within ±10 percent of the corresponding values established by the APCTVC. The values obtained from these quarterly tests are to be accumulated in spreadsheet form to allow construction of trend lines with all accumulated data.
If these acceptance criteria cannot be attained, the participating test laboratory must notify the APCTVC and it must stop all verification tests. It should then take such corrective actions as will allow it to attain the acceptance criteria in a subsequent test on the reference filter medium. If there is an extended period of time where no filter samples are being verified, no calibrations or quality control checks need to be performed. However, before any subsequent verification test
Revision No.: 8 Date: October 8, 2001
Page 11 of 32
is started, all calibrations and checks will be conducted and recorded and all measurement and condition requirements must be met and satisfied.
At a minimum of once each calendar quarter, the participating laboratory will perform a quality control check to determine whether the test apparatus attains the measurement objectives given in Table 2. Example procedures for the quality control check are presented in Attachment 2. Participating test laboratories may propose alternative procedures in their test/QA plans. If the test apparatus cannot attain the measurement objectives, the participating laboratory must notify the APCTVC and the laboratory must stop all verification tests. It should then take such corrective actions as will allow the test apparatus to attain the measurement objectives in a subsequent quality control check that will precede resumption of verification tests.
If the participating test laboratory can demonstrate attainment of quality objectives for reference fabric measurements and if it can demonstrate that the test apparatus attains measurement objectives, then the quality objectives for measurement of the mean outlet particle concentrations (i.e., 15 percent) appear readily achievable. See Attachment 1 for the propagation of error calculations.
3.0 Test Methods to be Used
This section provides a description of the VDI 3926 test method for determining filtration media performance as well as the ETV approach for determining PM2.5 filtration efficiency.
In 1985, work was carried out at the University of Karlsruhe, Germany, to study filter cake characteristics during filtration in a baghouse. The system used a crossflow method where dust was fed downward into a vertical channel and the cake formed on a filter sample by drawing air in the crossflow (horizontal) direction. Originally, there was no cleaning mechanism installed in the test system. In 1990 the test system was updated to compare the textile properties of the media against the filtration properties. The test apparatus was modified to operate continuously with a pulse-jet-cleaning system comparable to the cleaning system in a pulse-jet-cleaned baghouse. Tests were carried out in 1992 to confirm the suitability of the apparatus to provide reliable information on the filtration properties of filter media. In late 1993 a draft proposal was submitted to the VDI (ASTM equivalent) standards committee on the system information as well as the operating conditions. In October of 1994, the final version was approved, creating the standard referred to as VDI method 3926.
3.1 Reference Medium and Aluminum Oxide Dust Specifications
The APCTVC will supply all participating verification laboratories with standard polyester felt reference medium. The reference polyester felt was chosen to comply with the manufacturers’ specifications of scrim supported, plain finish polyester felt with a 45.36 g (1.6 oz.) spun polyester scrim, with a weight of 508.6 - 576.4 g/m2 (15.0 - 17.0 ounces/square yard), 100 percent polyester fiber - 2.25 denier x 76.5 mm (3 in.), thickness of 0.165 - 0.216 cm (0.065
Revision No.: 8 Date: October 8, 2001
Page 12 of 32
0.085 in.), 34 - 59 m3/h (20 - 35 cfm) permeability, and a 2.8 MPa minimum (400 psi minimum) burst strength per ASTM standards.
It is the responsibility of each verification laboratory to obtain suitable and comparable verification test dust to be used in the test apparatus that complies with this protocol. The test dust required for verification testing is aluminum oxide (calcined alumina) dust (Pural NF or equivalent) having an Al2O3 content greater than 99.6 percent. Alcoa 1504 SG and Pural SB dusts were examined in the test apparatus, but Alcoa 1504 SG was found to give erratic feed, and Plural SB gave an insufficient challenge to the test fabric. The test dust must have a nominal mass mean aerodynamic diameter of 1.5 ± 1 µm and a particle size weight percentage from 40 to 90 percent less than 2.5 µm. The particle size weight percentage is determined by the average of three impactor (Andersen or equivalent) test runs performed in the test apparatus under test conditions, per Table 3. The impactor will utilize all five of the manufacturer-designed particle size separation stages. The stages that capture the larger than 2.5 µm particles are used as a filter to prevent larger particles from knocking off smaller particles in the succeeding stages. Refer to the impactor operating manual for proper use and handling techniques. The aluminum oxide <2.5 µm particle size percentage and mass mean diameter must be checked monthly and at the beginning of every new dust batch. The values obtained from these dust-size checks are to be accumulated in spreadsheet form to allow construction of trend lines with all accumulated data.
3.2 Testing of Cleanable Filter Media Under Operational Conditions
The BFP test apparatus, based on the German VDI method 3926, provides an appropriate baghouse filter media test apparatus. This equipment allows the user to measure filter performance under defined conditions with regard to the filtration velocity (G/C), particle size distribution, and cleaning requirements. Filtration and cleaning conditions can be varied to simulate conditions that prevail in actual baghouse operations.
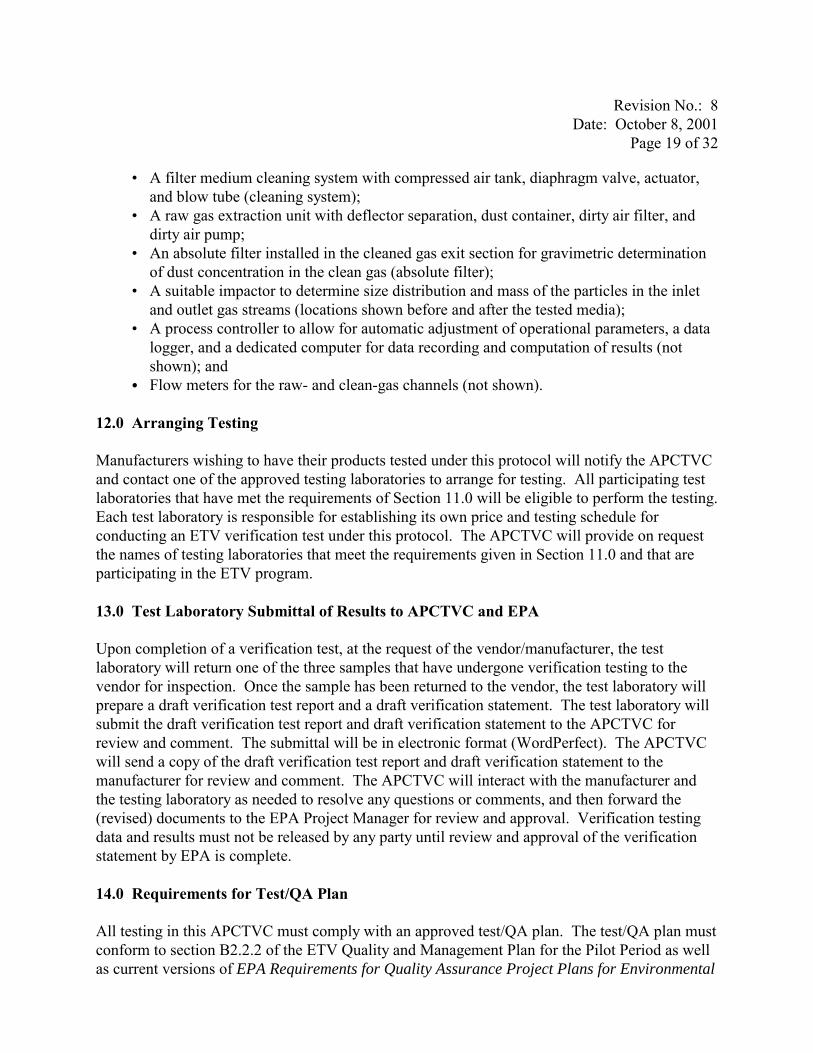
The test apparatus (see Figure 2) consists of a brush-type dust feeder that disperses test dust into a vertical rectangular duct (raw-gas channel). The dust feed rate is measured continuously and recorded via an electronic scale located beneath the dust feed mechanism. The scale has a continuous readout with a resolution of 10 grams. A radioactive Polonium-210 alpha source is used to neutralize the dust electrically before its entry into the raw-gas channel. An optical photo sensor monitors the concentration of dust and ensures that the flow is stable for the duration of the test. The optical photo sensor does not measure the dust concentration; its purpose is to monitor the consistency of the inlet dust flow. A portion of the gas flow is extracted from the raw-gas channel through the test filter, which is mounted vertically at the entrance to a horizontal duct (clean-gas channel). Two vacuum pumps maintain air flow through the raw-gas and cleangas channels. The flow rates, and thus the filtration velocity (G/C) through the test filter, are kept constant using mass flow controllers. High efficiency filters are installed upstream of the flow controllers and pumps to prevent contamination or damage caused by the dust. The cleaning system consists of a compressed-air tank set at 0.5 MPa (75 psig), a quick-action diaphragm

Revision No.: 8 Date: October 8, 2001
Page 13 of 32
DUST FEED FROM EXTERNAL HOPPER
DUST CHARGE NEUTRALIZER
RECTANGULAR CHANNEL 4 3/8" x 11 1/2" PHOTOMETER
FILTER FIXTURE AND TEST FILTER
CYLINDRICAL EXTRACTION TUBE
CLEANING SYSTEM
BLOW TUBE DIRTY AIR FILTER
DUST CONTAINER
ABSOLUTE FILTER AND ANDERSEN IMPACTOR
MASS FLOW CONTROLLER
BACK-UP FILTER
CLEAN AIR PUMP
MASS FLOW CONTROLLER
CLEAN GAS SAMPLE PORT
DIRTY AIR PUMP
ABSOLUTE
ANDERSEN
DUST FEEDER
SCALE
PLATFORM
RAW GAS SAMPLE PORT
ADJUSTABLE VALVES
CALIBRATED ORIFICE
Figure 2. Diagram of BFP Test Apparatus
Courtesy of Hosokawa Mikropul
Revision No.: 8 Date: October 8, 2001
Page 14 of 32
valve, and a blow tube [25.4 mm (in. dia.)] with a nozzle [3 mm (in. dia.)] facing the downstream side of the test filter.
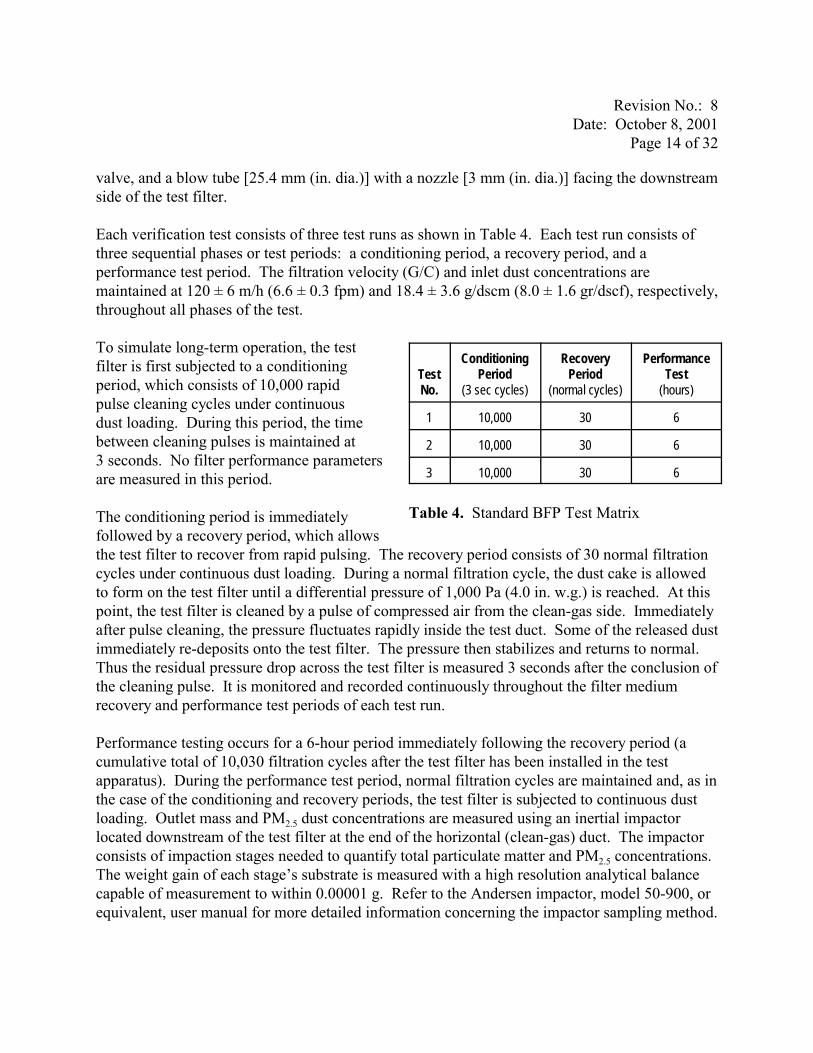
Each verification test consists of three test runs as shown in Table 4. Each test run consists of three sequential phases or test periods: a conditioning period, a recovery period, and a performance test period. The filtration velocity (G/C) and inlet dust concentrations are maintained at 120 ± 6 m/h (6.6 ± 0.3 fpm) and 18.4 ± 3.6 g/dscm (8.0 ± 1.6 gr/dscf), respectively, throughout all phases of the test.
To simulate long-term operation, the test filter is first subjected to a conditioning period, which consists of 10,000 rapid pulse cleaning cycles under continuous dust loading. During this period, the time between cleaning pulses is maintained at 3 seconds. No filter performance parameters are measured in this period.
The conditioning period is immediately Table 4. Standard BFP Test Matrix followed by a recovery period, which allows the test filter to recover from rapid pulsing. The recovery period consists of 30 normal filtration cycles under continuous dust loading. During a normal filtration cycle, the dust cake is allowed to form on the test filter until a differential pressure of 1,000 Pa (4.0 in. w.g.) is reached. At this point, the test filter is cleaned by a pulse of compressed air from the clean-gas side. Immediately after pulse cleaning, the pressure fluctuates rapidly inside the test duct. Some of the released dust immediately re-deposits onto the test filter. The pressure then stabilizes and returns to normal. Thus the residual pressure drop across the test filter is measured 3 seconds after the conclusion of the cleaning pulse. It is monitored and recorded continuously throughout the filter medium recovery and performance test periods of each test run.
Test No.
Conditioning Period
(3 sec cycles)
Recovery Period
(normal cycles)
Performance Test
(hours)
1 10,000 30 6
2 10,000 30 6
3 10,000 30 6
Performance testing occurs for a 6-hour period immediately following the recovery period (a cumulative total of 10,030 filtration cycles after the test filter has been installed in the test apparatus). During the performance test period, normal filtration cycles are maintained and, as in the case of the conditioning and recovery periods, the test filter is subjected to continuous dust loading. Outlet mass and PM2.5 dust concentrations are measured using an inertial impactor located downstream of the test filter at the end of the horizontal (clean-gas) duct. The impactor consists of impaction stages needed to quantify total particulate matter and PM2.5 concentrations. The weight gain of each stage’s substrate is measured with a high resolution analytical balance capable of measurement to within 0.00001 g. Refer to the Andersen impactor, model 50-900, or equivalent, user manual for more detailed information concerning the impactor sampling method.
Revision No.: 8 Date: October 8, 2001
Page 15 of 32
4.0 Reporting Requirements and Formats
Following the verification test, the testing laboratory will prepare a draft verification test report including a draft verification statement. The verification test report is a fully documented test report prepared by the performing laboratory and contains a complete description of the test method and equipment, verification test conditions, BFP test apparatus measurements, results of verification tests , and calibration data. The Verification Test Report will include:
C Test specimen information (as stated in Verification Statement), C Data from the reference fabric, C Results of control tests, C Verification test results, C Quality assurance section, C Equipment calibration data (flow device, standard test dust, etc.), C Deviation between DQOs and test results, and C Deviation from Generic Verification Protocol and the corresponding APCTVC’s
approval (if applicable).
In addition, the Verification Test Report will include all test conditions and operational data relevant to the test and an overview of the test methods, facilities, and equipment used. Data will be presented in a format that permits ready comparison with DQOs. A discussion of any problems encountered and an explanation of how these problems were resolved will also be included. The performing laboratory will maintain records of all tests for a period of 7 years.
The Verification Statement (See Appendix A) will be a summary report that will include the following information:
• Product manufacturer (name, address, and phone number), • All applicable model or style numbers, • Brief description of tested filter media, • Test date and location, • Testing firm,C Outlet particle concentration, PM2.5,C Outlet particle concentration, total mass,• Initial residual pressure drop of the 6-hour performance test period,• Residual pressure drop increase for the 6-hour performance test period,C Average residual pressure drop (See Section 3.2) during the 6-hour performance test
period,C Average filtration cycle time during the 6-hour performance test period,C Mass gain of verification sample filter at test completion (see Section 2.3),C Number of cleaning cycles,C Non-standard test conditions ( if applicable), andC Any deviation from the Generic Verification Protocol.

Revision No.: 8 Date: October 8, 2001
Page 16 of 32
The Verification Statement will remain valid for the BFP bearing the same model number for 3 years following EPA’s and the APCTVC’s approval. Once the 3-year verification period is completed, the baghouse filtration product must be re-verified to maintain EPA verification approval. Refer to Section 10.0 for further information pertaining to the 3-year valid verification period.
The test laboratory will submit the completed draft Verification Test Report and draft Verification Statement to both the manufacturer and the APCTVC for review. All draft Verification Test Reports and draft Verification Statements will be reviewed by the APCTVC Director and the APCTVC Quality Manager for the BFP Testing Project. They will resolve any issues concerning the testing procedures, the test results, the Verification Test Report, or the Verification Statement with the participating testing laboratory and the fabric manufacturer. After review of the test results and quality control data presented in the draft Verification Test Report, the APCTVC Quality Manager for the BFP Testing Project will prepare a section for inclusion in the Verification Statement and Verification Test Report regarding the attainment of data quality objectives. The APCTVC Director will send the Verification Test Report and the Verification Statement to the EPA Project Manager for review and approval. The final Verification Statement will be signed by the Director of the National Risk Management Research Laboratory and the APCTVC Director
5.0 Dissemination of Verification Test Reports and Verification Statements
After the Verification Statement has been approved, it will be posted to the ETV web site for public access without restriction. EPA, through its ETV Program Office, may make the report available to the public upon specific request. The manufacturer may also copy and distribute the report. The APCTVC will make the Verification Test Report and Verification Statement available to requesters.
6.0 Manufacturer’s Options if a Product Performs Below Expectations
ETV is not a technology research and development program; technologies submitted for verification are to be commercial-ready and with well-understood performance. Tests that meet the verification data quality requirements are considered valid and suitable for publishing. In the event that a technology fails to meet the manufacturer’s expectations, the manufacturer/vendor may request that a verification statement not be issued. However, verification tests are always in the public domain. Verification reports will be written and will be available from EPA for review by the public regardless of a request not to issue a verification statement.
The manufacturer may improve the product and re-submit it under a new model identification for verification testing. Verification statements for tests of the new product will be issued as they are processed by the APCTVC and EPA (except that the results for several identical tests performed in rapid succession will all be released at the same time).

Revision No.: 8 Date: October 8, 2001
Page 17 of 32
7.0 Limitations on Testing and Reporting
To avoid having multiple ETV reports for the same product and to maintain the verification testing as a cooperative effort with manufacturers/vendors, the following restrictions apply to verification testing under this protocol:
C A manufacturer or vendor may submit only its own product(s) for verification testing; it may not submit media from competitors; and
C For a given product (e.g., model or style number), only one ETV Verification Test Report and Statement (in sufficient copies to meet distribution needs determined by the APCTVC, including electronic media) will be issued during the period the Statement is valid.
8.0 Acquisition of Products for Testing
The filter media samples will be supplied directly from the manufacturer with a letter signed by the manufacturer’s chief executive officer (CEO), president, or other responsible corporate representative, attesting that the media samples were arbitrarily selected from a production run and roll location and are representative of what is supplied to the commercial market. Included in the signed letter will be a description of how the samples were selected. The manufacturer will supply the test laboratory with nine samples [46 × 91 cm (18 × 36 in.)]. From these, the laboratory will randomly select three samples for test specimen preparation.
9.0 Requirements for Product Labeling
For purposes of product identification (for example, by the test laboratory, auditors, end-users, and local inspectors), the manufacturer must label or tag the filter medium in a reasonably permanent manner to show the name of the manufacturer, all applicable model numbers, cake side, and date (year and month) of manufacture. If this information is not present, the test laboratory will reject the medium for testing. This labeling must be present on all products that the manufacturer claims to be covered by the ETV verification test report and statement. Products that are not labeled in this manner are not covered by the verification test report and statement.
10.0 Product Change
Anytime a manufacturer changes a product, the Verification Statement is no longer valid (for the new product); a new verification test is required if verification of the new product is desired. In the case of BFP, there is a reasonable probability of an unintentional product change occurring over a 3-year production cycle due to variations in assembly lines, materials, and/or components. To address this product variability, it is assumed that sufficient changes will occur over a 3-year period to warrant a new verification test. Therefore, a new verification test will be required at
17

Revision No.: 8 Date: October 8, 2001
Page 18 of 32
least every 3 years for BFP bearing the same model number as a previously verified manufacturer’s product. Laminates applied to different types of backings are considered product changes and will require verification testing on each backing. For example, if a supplier was changed, it would not constitute a product change, but if the new backing had different specifications, it would constitute a product change.
11.0 Requirements for Participating Laboratories
The APCTVC ETV Program is open to multiple test laboratories. All participating laboratories, domestic and international, must register their laboratories with the APCTVC, meet the ETV program’s QA requirements, and accept on-site audits by the APCTVC, EPA, and/or its representatives. The audits will include running a PM2.5 efficiency test on reference filtration media supplied by the APCTVC, technical system audits, performance evaluations, assessments of the test laboratory’s quality system, and audits of data quality. (Refer to Sections 15.0 - 15.3 for further information pertaining to audits.) In order to qualify, a test laboratory must take the following actions:
C Have ANSI/ASQC E4 or ISO 9000 quality management systems in place; C Possess the equipment and facilities required to perform the tests identified in Sections
3.0 and 11.1 of this protocol; C Be an independent organization (e.g., not be a manufacturer’s or end user’s in-house
laboratory or subsidiary); C Have an EPA compliant QMP; C Allow on-site audits by APCTVC staff, EPA, and/or their representatives; C Have an EPA and APCTVC approved test/QA plan as described in Section 14.0 of this
protocol;C Provide written health and safety procedures for ETV testing; andC Comply with APCTVC reporting requirements.
11.1 Test Apparatus
Figure 2 shows the functional diagram of the BFP test apparatus. The essential components of the test apparatus are listed below:
• A continuous dust feeding system (dust feeder); • A Polonium-210 alpha source for neutralizing the dusts that have been electrostatically
charged by dispersion (dust charge neutralizer); • A vertical raw gas channel with rectangular cross-section (rectangular channel); • A photometric concentration monitor or impactor (shown) directly above the filter
sample to monitor the concentration and dispersion of the test dusts in the raw gas; • A cylindrical, horizontally arranged extraction device with a filter holder (filter fixture
and test filter);
Revision No.: 8 Date: October 8, 2001
Page 19 of 32
• A filter medium cleaning system with compressed air tank, diaphragm valve, actuator, and blow tube (cleaning system);
• A raw gas extraction unit with deflector separation, dust container, dirty air filter, and dirty air pump;
• An absolute filter installed in the cleaned gas exit section for gravimetric determination of dust concentration in the clean gas (absolute filter);
• A suitable impactor to determine size distribution and mass of the particles in the inlet and outlet gas streams (locations shown before and after the tested media);
• A process controller to allow for automatic adjustment of operational parameters, a data logger, and a dedicated computer for data recording and computation of results (not shown); and
C Flow meters for the raw- and clean-gas channels (not shown).
12.0 Arranging Testing
Manufacturers wishing to have their products tested under this protocol will notify the APCTVC and contact one of the approved testing laboratories to arrange for testing. All participating test laboratories that have met the requirements of Section 11.0 will be eligible to perform the testing. Each test laboratory is responsible for establishing its own price and testing schedule for conducting an ETV verification test under this protocol. The APCTVC will provide on request the names of testing laboratories that meet the requirements given in Section 11.0 and that are participating in the ETV program.
13.0 Test Laboratory Submittal of Results to APCTVC and EPA
Upon completion of a verification test, at the request of the vendor/manufacturer, the test laboratory will return one of the three samples that have undergone verification testing to the vendor for inspection. Once the sample has been returned to the vendor, the test laboratory will prepare a draft verification test report and a draft verification statement. The test laboratory will submit the draft verification test report and draft verification statement to the APCTVC for review and comment. The submittal will be in electronic format (WordPerfect). The APCTVC will send a copy of the draft verification test report and draft verification statement to the manufacturer for review and comment. The APCTVC will interact with the manufacturer and the testing laboratory as needed to resolve any questions or comments, and then forward the (revised) documents to the EPA Project Manager for review and approval. Verification testing data and results must not be released by any party until review and approval of the verification statement by EPA is complete.
14.0 Requirements for Test/QA Plan
All testing in this APCTVC must comply with an approved test/QA plan. The test/QA plan must conform to section B2.2.2 of the ETV Quality and Management Plan for the Pilot Period as well as current versions of EPA Requirements for Quality Assurance Project Plans for Environmental

Revision No.: 8 Date: October 8, 2001
Page 20 of 32
Data Operations (EPA QA/R-5). Non-mandatory guidance is provided in EPA Guidance for Quality Assurance Project Plans (EPA QA/G-5). The test/QA plan will be submitted to the APCTVC, and subsequently to EPA by RTI, for approval by each participating testing laboratory. To ensure that procedures are carefully followed, an on-site audit by EPA or one of its representatives will be performed at each participating test laboratory.
A sample test/QA plan will be prepared and offered to each participating test laboratory to serve as a guideline for preparing its individual document. The test laboratories must tailor the plan to their specific facilities, equipment, instrumentation, and procedures. The test laboratories must also operate under conditions that meet the DQOs listed previously in Tables 2 and 3 for the equipment and test conditions, respectively, used in the verification testing.
14.1 Quality Management
As part of the ETV program, EPA has developed a quality and management plan (QMP) for EPA and its verification partners. This document follows the ANSI/ASQC E4 guidelines. The APCTVC has also developed a QMP, which has been approved by EPA and is ANSI/ASQC E4 compliant.
All laboratories participating in this program are required to meet the QA/QC requirements defined below and to have an appropriate quality system to manage the work performed. Documentation and records must be managed in accordance with the EPA ETV QMP. Laboratories must also perform assessments and allow audits by RTI and EPA corresponding to those specified in the EPA ETV QMP.
14.2 Test/QA Plan
For testing conducted as part of this ETV program, each participating test laboratory must prepare an EPA Quality Assurance Project Plan (test/QA plan). Elements of the plan are described in EPA Requirements for Quality Assurance Project Plans for Environmental Data Operations (EPA QA/R-5). The test/QA plan will address all aspects of the measurement program from selection and acquisition of filter media to final review and data reporting. The test/QA plan describes how the modified VDI Method 3926 will be implemented at an individual laboratory and the steps the laboratory will take to ensure acceptable data quality in the test results. If a more detailed explanation is required, a SOP should be prepared to accompany the test/QA plan. The test/QA plan, and corresponding SOPs, must be approved by the QA officials in the APCTVC and EPA before the test laboratory may begin verification testing. While the previously stated DQOs express the data user’s needs, they do not provide sufficient information about how these needs will be satisfied. One of the most important features of the test/QA plan is that it links the DQOs to verifiable measurement performance criteria. This linkage represents an important advancement in the implementation of QA. One reference document available for writing test/QA plans is EPA Guidance for Quality Assurance Project Plans (EPA/QA G-5).
Revision No.: 8 Date: October 8, 2001
Page 21 of 32
The required test/QA plan elements, taken from section B2.2.2 of the ETV Quality and Management Plan for the Pilot Period, are listed below, but not all requirements are appropriate to every test. Each test/QA plan will need to note and explain those elements that are not applicable.
C Title and approval sheet. C Table of contents, distribution list. C Test description, test objectives. C Identification of the critical measurements, data quality objectives, data quality
indicators, test schedule, and milestones. C Test (including QA) organization and responsibilities. C Documentation and records. C Experimental design. C Sampling procedures. C Sample handling and custody. C Analytical procedures. C Test-specific procedures for assessing data quality indicators. C Instrument calibration and its frequency. C Data acquisition and data management procedures. C Internal systems audits. C Internal performance audits (where applicable). C Corrective action procedures (response actions to audit findings). C Assessment reports to EPA. C Data reduction, data review, data validation, and data reporting. C Reporting of data quality indicators for critical measurements. C Limitations of the data. C Any deviations from VDI Method 3926 test apparatus or this Generic Verification
Protocol.
Specific Requirements that are important within the test/QA plan are discussed below:
Test Description: A brief description of the test program shall include objectives, identification of the filter media to be tested, and instructions on how the testing is to be conducted. The test conditions will be described, including, but not limited to, the test air temperature, filtration velocity (G/C), ambient conditions (pressure, humidity, and temperature) and dust loading; test procedures, equipment, and materials; and analytical system procedures and equipment.
Project Organization and Responsibilities: A project organizational chart shall be provided that designates a project leader, a sample custodian, a report manager, and a QA Officer. The QA Officer should be independent of the project to avoid real or perceived conflicts of interest. The responsibility of all individuals should be defined.
Revision No.: 8 Date: October 8, 2001
Page 22 of 32
Procedures for Sampling, Sample Handling, and Measurement: The test/QA plan shall include (or refer to) detailed operating procedures for the measurement of variables listed in Tables 1 and 2 in sufficient detail that these measurements are performed as intended.
Assessing and Reporting of Data Quality Indicators for Critical Measurements: The test/QA plan shall include data quality objectives, procedures for assessing, and criteria for accepting the critical measurements.
Calibration Procedures and Frequency: Procedures for ensuring that measurements listed in Tables 1 and 2 are correct within the specified limits must be specified.
Calibration Verification for Critical Measurements: Procedures for regularly and independently demonstrating proper traceability to standards provided by the National Institute of Standards and Technology (NIST) must be provided (for examples, see Attachment 2).
Data Acquisition and Data Management Procedures: Each step in the data handling, collection, and analysis process shall be described from the original data collection to its final report form. Procedures must be established for ensuring that measured variables are properly obtained and transformed to reported information of the stated accuracy and precision. These variables for filter media testing include flows, gas temperature, humidity, pressures or pressure drops, fabric properties, and particle size measurements.
Audits: All major components of the test shall be audited at least once by EPA, its representative, or the APCTVC. These audits may include, but not be limited to, technical systems audits, performance evaluations, and audits of data quality, laboratory systems, analytical measurement systems, data entry, and data processing. (Refer to Section 15.0 for further information.)
Corrective Action Procedures: The need for corrective action may be identified through reviews, internal QC checks, technical assessments, audits, or observations made during routine sampling and analysis activities by project staff. All corrective actions will be documented. The participating test laboratory’s Verification Test Leader is responsible for developing and implementing corrective action procedures. Corrective action must be implemented in a timely and effective manner and approved by the QA Officer for the corrective action(s) taken. Assessors can re-audit a facility to check for implementation of the corrective actions.
Data Reduction, Review, Validation, and Reporting: All data reported on this project shall be accompanied by the applicable QA/QC review, including the results of internal QC checks, audit results, and any necessary corrective actions. Upon

Revision No.: 8 Date: October 8, 2001
Page 23 of 32
completion of sample testing, a complete data package will be prepared and submitted to the QA Officer.
14.3 Standard Operating Procedures
If greater detail is needed to supplement the test/QA plan, the laboratory can prepare SOPs for all aspects of the verification test procedures. The SOPs should be specific and be readily available to those involved in the analysis and testing. A copy of the SOPs shall be retained in the laboratory. The following topics, from EPA QA/G-6, Guidance for the Preparation of Standard Operating Procedures (SOPs) for Quality-Related Documents, may be included (or a reference provided) in the SOPs for sample analysis:
C Scope and applicability; C Summary of procedures; C Definitions (acronyms, abbreviations, etc.); C Personnel qualifications; C Health and safety warnings (warnings of activities that could result in possible personal
injury); C Cautions (warnings of activities which could damage equipment, degrade samples, or
invalidate results); C Apparatus and materials; C Calibration; C Sample collection, sample labeling, sample tracking; C Handling and preservation of samples; C Interferences relative to the analysis of samples; C Sample preparation and analysis; C Data acquisition, calculations, and data reduction; C Requirements for computer hardware and software used in data reduction and reporting;
and C Data management and records management.
Some important considerations for preparing procedure summaries and calibration topics are detailed below:
Procedures/Summaries: C Operation of the test apparatus (pumps, valves, controllers, instruments, etc.); C Operation of particle sizing or PM2.5 instruments; C Operation of the dust feeding system (consistent concentration); C Operation of the dust sampling system; C Operation of data acquisition systems and reporting; and C Conditioning, preparation, and mounting of samples.

Revision No.: 8 Date: October 8, 2001
Page 24 of 32
Calibration: C Test apparatus; C Particle sizing or PM2.5 instruments; C Dust feeding systems; C Pressure transducers and manometers; C Dust sampling systems; and C Air flow instruments.
15.0 Assessment and Response
Before and during verification tests, EPA quality assurance staff, the APCTVC/RTI quality assurance staff, and/or the test-specific quality assurance officer for the verification tests will conduct technical assessments [e.g., technical systems audits (TSAs) and performance evaluations (PEs)] for all critical measurements to determine that verifications are being conducted in accordance with the test/QA plan. EPA will conduct at least two TSAs of the BFP project in accordance with the requirements of Part B, Section 4.2 of EPA’s quality and management plan for the environmental technology program. The number of PEs that will be performed during a verification will be specified in the test/QA plan.
Assessments will be conducted in accordance with the most recent version of EPA’s Guidance on Technical Assessments for Environmental Data Operations and Guidance on Assessing Quality Systems (EPA Quality Staff Publications EPA QA/G-7 and EPA QA/G-3, respectively). Assessors will have backgrounds in both QA and the measurement systems involved in the verification tests. The APCTVC Quality Manager will report the findings of the technical assessments to the APCTVC Director and will recommend corrective actions, if indicated by these findings. The APCTVC Quality Manager will determine if these measurements allow one to determine whether acceptance criteria for data quality objectives in this protocol have been attained.
If assessors identify a severe problem affecting verification data quality, the APCTVC Director, with the counsel of the APCTVC Quality Manager, will direct the testing laboratory to halt the verification testing until the problem is corrected. The laboratory should then take such corrective actions as will allow the measurement systems to attain the measurement objectives in a subsequent quality control check that will precede resumption of verification tests. If assessors identify a problem endangering the health and safety of personnel, they have the responsibility to bring the danger to the immediate attention of the APCTVC Director, the technology Verification Test Leader, and the on-site testing personnel.
15.1 Assessment Types
Technical Systems Audit: Qualitative onsite audit of the physical setup of the test. The auditors determine the compliance of the testing system, including personnel, with the test/QA plan.

Revision No.: 8 Date: October 8, 2001
Page 25 of 32
Performance Evaluations: Quantitative audit in which measurement data are independently obtained and compared with routinely obtained data to evaluate the accuracy (bias and precision) of a measurement system.
Audit of Data Quality: Qualitative and quantitative audit in which data and data handling are reviewed and data quality and data usability are assessed.
Assessment of Quality Systems: A process for assessing an organization’s practices as they relate to its quality system. This assessment seeks to determine if a quality system is implemented and is operating within an organization in the manner prescribed by the approved quality management plan and consistent with current requirements.
15.2 Assessment Frequency
Activities performed during technology verification performance operations that affect the quality of the data shall be assessed regularly, and the findings reported to management to ensure that the requirements stated in the generic verification protocols and the test/QA plans are being implemented as prescribed.
The types and minimum frequency of assessments for the ETV program are listed in Part A Section 9.0 of EPA’s Quality and Management Plan for the Pilot Period (1995-2000). The participating laboratories will have, at a minimum, the following types and numbers of assessments:
C Technical systems audits - self-assessments for each test as provided for in the test/QA plan and independent assessments, twice per pilot.
C Performance evaluations - self-assessments, as applicable, for each test as provided in the test/QA plan and independent assessments, as applicable for each pilot.
C Audits of data quality - self-assessments of at least 10 percent of all the verification data and independent assessments, as applicable, for each center.
The independent assessments of the participating laboratories will be performed by EPA or its representatives. Self-assessments will be consistent with the participating test laboratories’ test/QA plans. Technical assessments will be conducted according to the procedures contained in EPA QA/G-7. Assessments of a testing laboratory’s quality system will be conducted at a frequency that is determined to be necessary or appropriate by the EPA quality assurance staff.
15.3 Response to Assessment
After an assessment has been completed, a findings report will be prepared by the lead assessor. The Verification Test Leader will be supplied with a copy of the report. Responses to adverse findings are required within 10 working days of receiving the audit report. It is the responsibility of the participating laboratory’s Verification Test Leader to develop and implement all corrective

Revision No.: 8 Date: October 8, 2001
Page 26 of 32
action procedures. Appropriate corrective actions shall be taken and their adequacy verified and documented in response to the findings of the assessments. Data found to have been taken from nonconforming equipment shall be evaluated to determine its impact on the quality of the data and the action taken shall be documented. Follow-up by the auditors, reassessment, and/or documentation of response may be required to verify implementation of corrective actions. Once all comments have been addressed, the final findings report will be sent to the APCTVC Director with a copy sent to the EPA Quality Manager and the Verification Test Leader.
16.0 Bibliography and References
16.1 Federal Documents
U.S. EPA, Environmental Technology Verification Program: Quality and Management Plan for the Pilot Period (1995-2000). EPA-600/R-98-064. May 1998. This document is available on the EPA website at http://www.epa.gov/etv/qmp.htm.
U.S. EPA, Verification Testing of Air Pollution Control Technology, Quality Management Plan. EPA Cooperative Agreement CR826152-01-0, RTI Project 9307012, October 1998.
U.S. EPA, EPA Requirements for Quality Management Plans, EPA QA/R-2. EPA/240/B-01/002. March 2001. Available at http://www.epa.gov/quality1/qs-docs/r2-final.pdf.
U.S. EPA, EPA Requirements for Quality Assurance Project Plans for Environmental Data Operations, EPA QA/R-5. EPA/240/B-01/003. March 2001. Available at http://www.epa.gov/quality1/qs-docs/r5-final.pdf.
U.S. EPA, EPA Guidance on Quality Assurance Project Plans, EPA QA/G-5. EPA/600/R-98/018. February 1998. Available at http://www.epa.gov/quality1/qs-docs/g5-final.pdf.
U.S. EPA, Guidance for the Preparation of Standard Operating Procedures (SOPs) for Quality-Related Documents, EPA QA/G-6. EPA/240/B-01/004. March 2001.
U.S. EPA, Guidance on Technical Assessments for Environmental Data Operations, EPA QA/G-7. EPA/600/R-99/080. January 2000. Available at http://www.epa.gov/quality1/qs-docs/g7-final.pdf.
U.S. EPA, Guidance on Assessing Quality Systems, EPA Quality Staff Publication EPA QA/G-3, Peer Review Draft. September 2001. Available at http://www.epa.gov/quality1/qs-docs/.
Revision No.: 8 Date: October 8, 2001
Page 27 of 32
16.2 Non-Federal Documents
ANSI/ASQC. Specifications and Guidelines for Quality Systems for Environmental Data Collection and Environmental Technology Program; ANSI/ASQC E4. American Society for Quality Control, Milwaukee, WI, 1994.
ANSI/ASQC. Quality Systems—Model for Quality Assurance in Designing, Development, Protection, Installing and Servicing; ANSI/ASQC Q9001-1994, American Society for Quality Control, Milwaukee, WI, 1994. This is the most recent U.S. version of the International Organization for Standards ISO 9001 standard.
(Copies can be ordered from the American Society for Quality Control, 611 E. Wisconsin Ave. P.O. Box 3005, Milwaukee, WI 53201-3005, USA, Tel: 414-272-8575.)
16.3 References
1. “Standard Test Method for Characterizing the Air Flow Resistance (Drag) and Relative Filtration Efficiency of Cleanable Filter Media,” (Draft), American Society for Testing and Materials, Philadelphia, PA. April 20, 1998
2. Verein Deutscher Ingenieure (VDI 3926, Part 2), “Testing of Filter Media for Cleanable Filters under Operational Conditions,” December 1994. Available from Beuth Verlag GmbH, 10772 Berlin, Germany.
3. ASHRAE Proposed Standard 52.2P, “Method of Testing General Ventilation Air-Cleaning Devices for Removal Efficiency by Particle Size,” May 1998, ASHRAE, 1791 Tullie Circle, NE, Atlanta, GA 30329-2305.

Revision No.: 8 Date: October 8, 2001
Page 28 of 32
ATTACHMENT 1 (continued)
Attaining the Quality Objective for the Mean Outlet Particle Concentration (PM2.5 or total)
3
Let Mean Outlet Particle Concentration / MOPC = ∑ (Cpo)i i=1
whereCpo = a single measurement of the concentration of the ith run, for i = 1,2,3 (triplicate runs), and εMOPC / error in MOPC,
Quality objective is: εMOPC < ± 15% for triplicate runs.
1. Apportion Total MOPC error as: εMOPC
2 = εBias 2 + εRandom
2 < (15%)2
εBias < 10% (maximum allowable deviation from reference fabric results)
(0.1)2 + (εRandom/3)2 < (0.15)2 => εRandom 2 < 3[(0.15)2 - (0.1)2] = 0.0375
εRandom < ± 0.19 = ± 19% i.e., total random error in each measurement of the outlet particle concentration must be held to
± 19 percent or lower in order to attain the quality objective.
2. Each measurement of Outlet Particle Concentration (Cpo): Cpo = Dmass/VOutlet where:
5
Dmass = ∑ [(SubstrateMass )Final − (SubstrateMass ) Initial i ] for impactor stages, i=1
= [(Mass1Final + εMass) - (Mass1Initial + εMass)] +[(Mass2Final + εMass) - (Mass2Initial + εMass)] + ...[(Mass5Final + εMass) - (Mass5Initial + εMass)]
= [(Mass1Final-Mass1Initial) + ... (Mass5Final-Mass5Initial) + 3(εMass)] for impactor stages i = 1, 2, ...., 5 for the 5 stages of the impactor that will be used.
where εMass = measurement error in each handling and weighing of each substrate. Voutlet = Sampled Volume = (Flowrate)Outlet x (Sampling Time) Voutlet = Vimp since the entire sampled volume of the clean gas is drawn through
the impactor.
Then (sC/Cpo)2 = (sD/Dmass)2 + (sV/Vimp)2; = 2*5[0.000005/0.00013 ]2 + [0.42/7.0 ]2 = 0.0184
28

Revision No.: 8 Date: October 8, 2001
Page 29 of 32
ATTACHMENT 1 (concluded)
where sC, sD, and sV are the measurement errors in Cpo, Dmass, and Vimp, respectively, and it is assumed that the cumulative substrate mass gain is uniformly distributed over all 5 stages (Dmass / Nimp = Cpo x Vimp / Nimp = 0.000644 g/5 substrates, = 0.00013 g/substrates, where Nimp = number of impactor stages+filter), with 2 weighings per stage (pre- and postsampling weighing).
sC/Cpo . ± 14%, computed using the following assumed values:
Value Source sD 0.000005 g ½ balance resolution (weighing by difference effectively removes
systemmatic error) Nimp 5 Number of impactor stages + filter Dmass 0.000644 g =Cpo x Vimp (expected cumulative mass gain per 5 stages Cpo 0.000092 g/dscm Assumes 99.9995% removal efficiency at inlet concentration of
18.4 g/dscm sV 0.42 m3 Table 2, generic verification protocol (0.06 m3/dscm) Vimp 7 m3 Sampled volume - through impactor
Since it is estimated that sC/Cpo < εRandom (that is, 14% < 15%) for this plan, then it can be reasonably expected that the operating specifications will satisfy the DQOs of Table 2.
Since it is estimated that sC/Cpo < εRandom (that is, 14% < 15%) for this plan, then it can be reasonably expected that the operating specifications will satisfy the DQOs of Table 2.

Revision No.: 8 Date: October 8, 2001
Page 30 of 32
ATTACHMENT 2 (continued)
Quality Control Check Procedures
1.0 Microbalance
Conduct an internal performance evaluation of each microbalance used to weigh filters on a quarterly basis. Use an independent set of ASTM Class 1 or 2 mass reference standards for the quality control check. These weights must be traceable to NIST with a tolerance of no more than 0.025 mg. Individual weights approximating substrate weights are suggested. Do not use the same weights for the quality control check as are used for the day-to-day calibration verifications of the microbalance.
Because microbalances are extremely delicate and should not be operated by inexperienced personnel and affect the quality of measurement by the balance-operator system, it is recommended that the quality control check of the filter-weighing process be done in cooperation with the laboratory personnel. The analyst normally performing the weighings should prepare the microbalance as if a series of routine filter weighings were to be done.
Record all quality control check data in the Laboratory Information Measurement System (LIMS) or in the laboratory QC notebook. The balance display should agree with the certified value of the quality control check weight to within ± 50 µg (twice the individual tolerance for ASTM Class 1 or 2 standards).
2.0 Flow Measurement
Conduct a quality control check of the flow rates in the vertical raw-gas channel and in the cleangas channel at least quarterly. The quality control check should use a standard pitot tube that has been certified against NIST-traceable standards within the past year. The clean-gas flow rate should be set to a nominal value corresponding to a filtration velocity of 120 m/h (6.6 fpm) ± 5 percent. The raw-gas flow rate should be set to a nominal value of 5.8 m3/h (3.4 cfm) ± 5 percent. Calculate the actual volumetric flow rates through the raw- and clean-gas channels based on the pitot tube readings. Record all quality control data in the LIMS or in the laboratory QC notebook. The actual flow rate and the flow rate indicated by the raw-gas channel flowmeter should agree to within ± 0.23 m3/h (0.14 cfm). The corresponding flow rates in the clean-gas channel should agree to within ± 0.06 m3/h (0.04 cfm).
30

Revision No.: 8 Date: October 8, 2001
Page 31 of 32
ATTACHMENT 2 (continued)
3.0 Flowmeter Calibration and Pretest Check
Calibrate the raw- and clean-gas channel flowmeters at least annually according to 40 CFR 60, Appendix A, Method 5, Section 7.1.1. The flowmeters should be calibrated at three different flow rates that bracket their normal operating range. The reference standard for the calibration should be a spirometer/bell prover or a wet test meter that has been certified against NISTtraceable standards within the past year. Record all calibration data in the LIMS or in the laboratory QC notebook.
Prior to each verification test, check the raw- and clean-gas channel flowmeters according to 40 CFR 60, Appendix A, Method 5, Section 4.4.1. Record all quality control data in the LIMS or in the laboratory QC notebook. If the pretest check deviates by more than 3 percent, the flow meter must be recalibrated.
4.0 Thermocouple in Raw-Gas Channel
Calibrate the thermocouple quarterly. Remove the thermocouple from the raw-gas channel and calibrate it against an ASTM mercury-in-glass reference thermometer at 77 ± 4EF. Alternatively, calibrate the thermocouple at a thermometric fixed point above and below 77 ± 4EF (for example, use an ice bath and boiling deionized distilled water, correcting the reference temperatures for barometric pressure). The thermocouple must agree with the reference point to within ± 1EF. Record all quality control data in the LIMS or in the laboratory QC notebook.
5.0 Barometer
If an aneroid barometer is used, check it against a Fortin-type mercury barometer or a NISTtraceable absolute pressure sensor at least quarterly. Record all quality control data in the LIMS or the laboratory QC notebook. The aneroid barometer should agree with the reference standard to within ± 2 mm (0.1 in.) Hg.
6.0 Pressure Drop Measurement
Conduct a quality control check of the instrument used to measure the pressure drop across the fabric specimen. This quality control check should be done at least quarterly, and the pressure drop instrument should be checked against a reference pressure standard that has been certified against NIST-traceable standards within the past year. Record all quality control data in the LIMS or in the laboratory QC notebook. The pressure drop instrument and the reference pressure standard should agree to within ± 0.25 cm (0.1 in.) w.g.
Revision No.: 8 Date: October 8, 2001
Page 32 of 32
ATTACHMENT 2 (concluded)
7.0 Timer Clock
Calibrate the timer clock quarterly to NIST time, which is obtained from the WWV radio reference signal or from the NIST World Wide Web site. If the timer clock is not within 1 second agreement with the WWV or website signal over a 1-hour period, replace the timer with a unit that meets calibration requirements.
If there is an extended period of time where no filter samples are being verified, no calibrations or quality control checks need to be performed. However, before any verification test is started, all calibrations and checks will be conducted and recorded and all measurement and condition requirements must be met and satisfied.
Appendix A
SAMPLE VERIFICATION STATEMENT
A-1

THE ENVIRONMENTAL TECHNOLOGY VERIFICATIONPROGRAM
U.S. Environmental Protection Agency
ETV Joint Verification Statement
TECHNOLOGY TYPE: BAGHOUSE FILTRATION PRODUCTS
APPLICATION: CONTROL OF PM2.5 EMISSIONS BY BAGHOUSE FILTRATION PRODUCTS
TECHNOLOGY NAME: Enter model number
COMPANY: Enter manufacturer’s name
ADDRESS: Enter address PHONE: (xxx) xxx-xxxx Enter address FAX: (xxx) xxx-xxxx
WEB SITE: http://www.xxxxxxxx.com E-MAIL: [email protected]
The U.S. Environmental Protection Agency (EPA) has created the Environmental Technology Verification (ETV) Program to facilitate the deployment of innovative or improved environmental technologies through performance verification and dissemination of information. The goal of the ETV Program is to further environmental protection by substantially accelerating the acceptance and use of improved and costeffective technologies. ETV seeks to achieve this goal by providing high-quality, peer-reviewed data on technology performance to those involved in the design, distribution, financing, permitting, purchase, and use of environmental technologies.
ETV works in partnership with recognized standards and testing organizations; stakeholder groups that consist of buyers, vendor organizations, permitters, and other interested parties; and with the full participation of individual technology developers. The program evaluates the performance of innovative technologies by developing test plans that are responsive to the needs of stakeholders, conducting field or laboratory tests (as appropriate), collecting and analyzing data, and preparing peer-reviewed reports. All evaluations are conducted in accordance with rigorous quality assurance protocols to ensure that data of known and adequate quality are generated and that the results are defensible.
The Air Pollution Control Technology Verification Center (APCTVC) is operated by RTI, in cooperation with EPA’s National Risk Management Research Laboratory. The APCTVC has recently evaluated the performance of baghouse filtration products (BFPs) used primarily to control PM2.5 emissions (particles 2.5 µm and smaller in aerodynamic diameter). This verification statement summarizes the test results for the (enter manufacturer’s name and model number of filter medium).
A-2

____________
Manufacturer’s Model Number
VERIFICATION TEST DESCRIPTION All tests were performed in accordance with the APCTVC draft “Generic Verification Protocol for Baghouse Filtration Products,” available at http://etv.rti.org/apct/pdf/baghouseprotocol.pdf. The protocol is based on and describes modifications to the equipment and procedures described in Verein Deutscher Ingenieure (VDI 3926, Part 2), “Testing of Filter Media for Cleanable Filters under Operational Conditions,” December 1994. The VDI document is available from Beuth Verlag GmbH, 10772 Berlin, Germany. The protocol also includes requirements for quality management, quality assurance, procedures for product selection, auditing of the test laboratories, and test reporting format.
Outlet particle concentrations from a test fabric are measured with an impactor equipped with appropriate substrates to filter and measure PM2.5 within the dust flow. Outlet particle concentrations are determined by weighing the mass increase rate of dust collected in each impactor filter stage and dividing by the gas volumetric flow through the impactor.
Particle size is measured while injecting the test dust into the air upstream of the baghouse filter sample. The test dust is dispersed into the flow using a brush-type dust feeder. The particle size distributions in the air are determined both upstream and downstream of the test filter fabric to provide accurate results for penetration through the test filter of PM2.5. All tests are performed using a constant 18.4 ± 3.6 g/dscm (8.0 ± 1.6 gr/dscf) loading rate, a 120 ± 6.6 m/h (6.0 ± 0.3 fpm) filtration velocity (identical to gas-to-cloth ratio [G/C]*), and aluminum oxide test dust with a measured mass mean aerodynamic diameter maximum of 1.5 µm (average of three impactor runs). All baghouse filtration products are tested in their initial (i.e., clean) condition.
Each of three or more test runs consisted of the following segments:
C Conditioning period - 10,000 rapid-pulse cleaning cycles,C Recovery period - 30 normal-pulse cleaning cycles, andC Performance test period - 6-hour filter fabric test period with impactor.
TECHNOLOGY DESCRIPTION The following text is an example of a filtration product description. The (enter manufacturer’s name and filter medium model number) is a 16 oz polyester, scrim-supported needlefelt. A photograph of the fabric is shown in Figure 1. Sample material was received as nine 46 × 91 cm (18 × 36 in.) swatches marked with the manufacturer’s model number, year and month of manufacture, and cake side. Three of the swatches were selected at random for preparing three test specimens 150 mm (5.9 in.) in diameter.
VERIFICATION OF PERFORMANCE Verification testing of the (enter manufacturer’s name and model number of filter medium) was performed during (enter dates of test), at the test facility of (enter name and address of testing laboratory). Test conditions are listed in Table 1. The overall test results summarized in Table 2 are the averages of three individual tests.
*Filtration velocity and gas-to-cloth ratio are used interchangeably and are defined as the gas flow rate divided by the surface area of the cloth.
A-3

Manufacturer’s Model Number
Figure 1. Photograph of (manufacturer’s name and model number).
Table 1. Test Conditions for Baghouse Filtration Product Brand/Model: (enter manufacturer’s name and model number of filter medium)
Test parameter Value
Dust concentration 18.4 ± 3.6 g/dscm (8.0 ± 1.6 gr/dscf)
Filtration velocity (G/C) 120 ± 66 m/h (6.0 ± 0.3 fpm)
Pressure loss before cleaning 1,000 ± 12 Pa (4 ± 0.05 in. w.g.)
Tank pressure 0.5 ± 0.03 MPa (75 + 5 psi)
Valve opening time 50 ± 5 ms
Air temperature 25 + 2 oC (77 + 4 oF)
Relative humidity 50 ± 10%
Raw gas stream flow rate 5.8 ± 0.3 m3/h (3.4 ± 0.2 cfm)
Sample gas stream flow rate 1.13 ± 0.06 m3/h (0.67 ± 0.03 cfm)
Number of filtration cycles
• During conditioning period 10,000 cycles
• During recovery period 30 cycles
Performance test duration 6 h ± 1 s
A-4
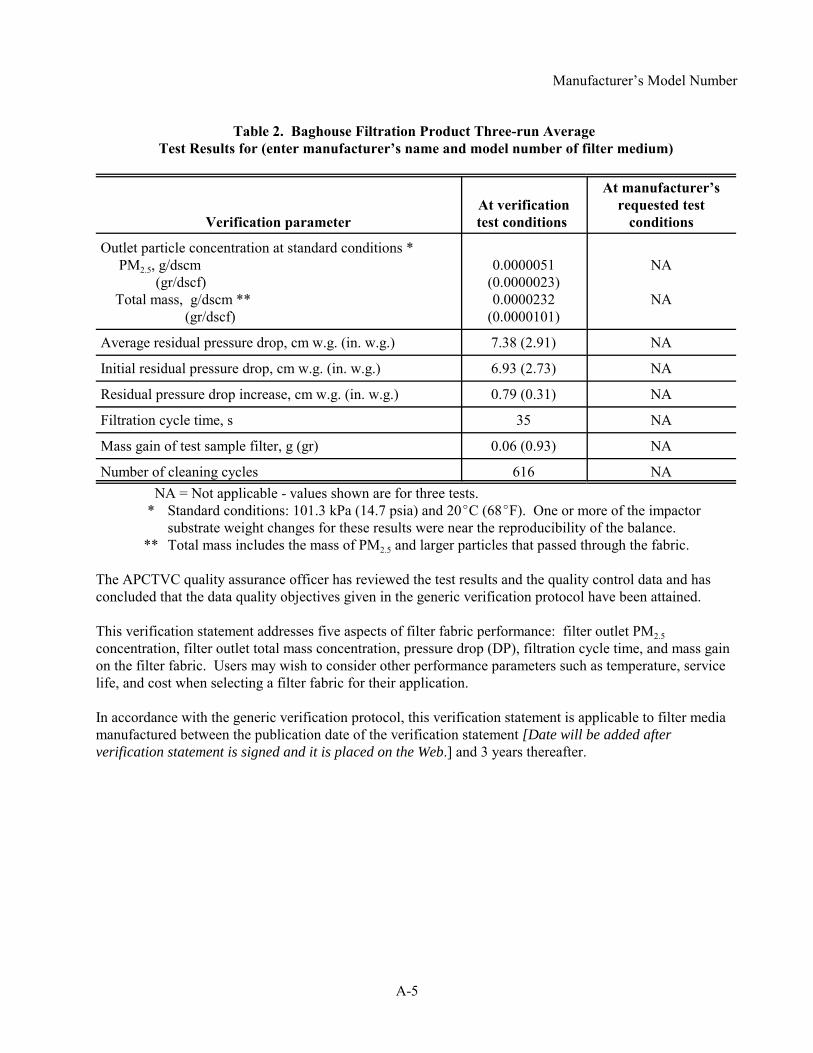
Manufacturer’s Model Number
Table 2. Baghouse Filtration Product Three-run Average Test Results for (enter manufacturer’s name and model number of filter medium)
Verification parameter At verification test conditions
At manufacturer’s requested test
conditions
Outlet particle concentration at standard conditions * PM2.5, g/dscm
(gr/dscf) Total mass, g/dscm ** (gr/dscf)
0.0000051 (0.0000023) 0.0000232
(0.0000101)
NA
NA
Average residual pressure drop, cm w.g. (in. w.g.) 7.38 (2.91) NA
Initial residual pressure drop, cm w.g. (in. w.g.) 6.93 (2.73) NA
Residual pressure drop increase, cm w.g. (in. w.g.) 0.79 (0.31) NA
Filtration cycle time, s 35 NA
Mass gain of test sample filter, g (gr) 0.06 (0.93) NA
Number of cleaning cycles 616 NA NA = Not applicable - values shown are for three tests.
* Standard conditions: 101.3 kPa (14.7 psia) and 20EC (68EF). One or more of the impactor substrate weight changes for these results were near the reproducibility of the balance.
** Total mass includes the mass of PM2.5 and larger particles that passed through the fabric.
The APCTVC quality assurance officer has reviewed the test results and the quality control data and has concluded that the data quality objectives given in the generic verification protocol have been attained.
This verification statement addresses five aspects of filter fabric performance: filter outlet PM2.5 concentration, filter outlet total mass concentration, pressure drop (DP), filtration cycle time, and mass gain on the filter fabric. Users may wish to consider other performance parameters such as temperature, service life, and cost when selecting a filter fabric for their application.
In accordance with the generic verification protocol, this verification statement is applicable to filter media manufactured between the publication date of the verification statement [Date will be added after verification statement is signed and it is placed on the Web.] and 3 years thereafter.
A-5

Manufacturer’s Model Number
This verification statement addresses two aspects of baghouse filtration product performance: outlet particle concentration and pressure drop. Users of this technology may wish to consider other performance parameters when selecting a baghouse filtration product for their application.
________________________ _______ ____________________ _______ E. Timothy Oppelt Date Jack R. Farmer Date Director Director National Risk Management Research Laboratory APCT Verification Center Office of Research and Development RTI United States Environmental Protection Agency
NOTICE: ETV verifications are based on an evaluation of technology performance under specific, predetermined criteria and the appropriate quality assurance procedures. EPA and RTI make no express or implied warranties as to the performance of the technology and do not certify that a technology will always operate as verified. The end user is solely responsible for complying with any and all applicable federal, state, and local requirements. Mention of commercial product names does not imply endorsement.
A-6