genesee & wyoming...genesee & wyoming inc. 2 forward-looking statements this presentation...
TRANSCRIPT

1 Genesee & Wyoming Inc.
Genesee & Wyoming Jack Hellmann Chief Executive Officer
August 28, 2015
2 Genesee & Wyoming Inc.
Forward-Looking Statements This presentation contains “forward-looking statements” regarding future events and the future
performance of Genesee & Wyoming Inc. that involve risks and uncertainties that could cause
actual results to differ materially from those expressed or forecasted, including, but not limited to,
risks related to the operation of our railroads, severe weather conditions and other natural
occurrences, economic and market conditions, customer demand, railroad network congestion,
derailments, currency fluctuations, changes in commodity prices, increased competition in the
relevant market, and others, many of which are beyond our control. The Company refers you to
the documents that it files from time to time with the Securities and Exchange Commission, such
as the Company’s Forms 10-Q and 10-K, which contain additional important factors that could
cause its actual results to differ from its current expectations and from the forward-looking
statements discussed during this presentation. Forward-looking statements speak only as of the
date of this presentation or the date they were made. Genesee & Wyoming Inc. does not
undertake, and expressly disclaims, any duty to update any forward-looking statement contained
in this presentation whether as a result of new information, future events or otherwise, except as
required by law.

3 Genesee & Wyoming Inc.
Agenda
• G&W Overview • Business Update
– Outlook Reset – Commodity Analysis – Iron Ore Update
• Current Outlook and Trends – July Carloads – Second Half 2015 Priorities – Free Cash Flow Capacity
• Appendices – Freightliner and U.K./Europe Segment
Overview – Second Half 2015 Guidance Details
(from August 3, 2015 Earnings Call)
4 Genesee & Wyoming Inc.
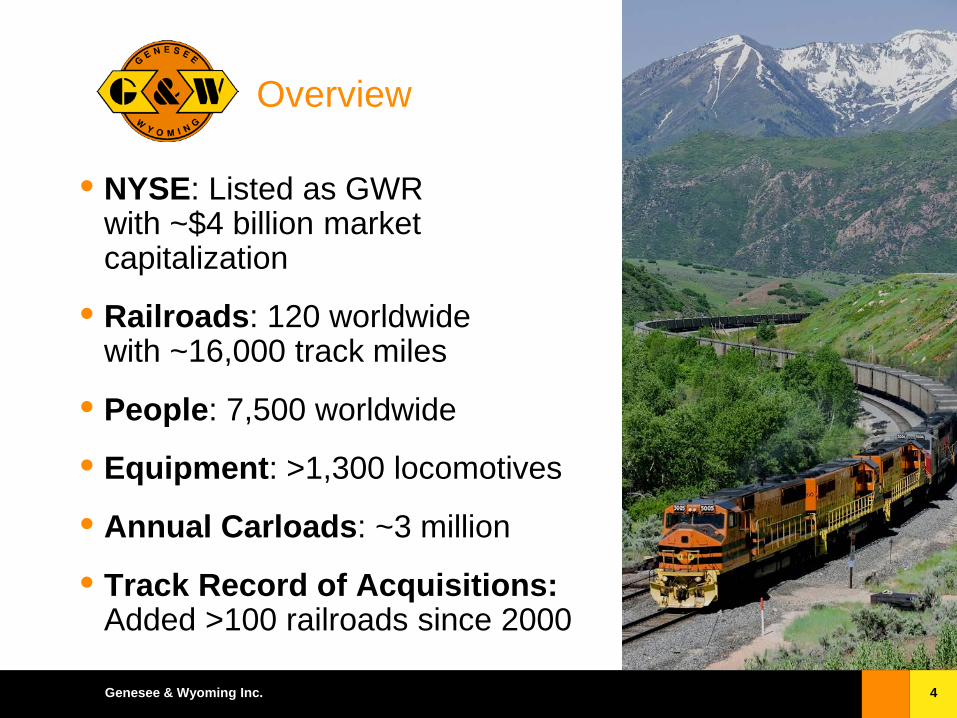
Overview
• NYSE: Listed as GWR with ~$4 billion market capitalization
• Railroads: 120 worldwide with ~16,000 track miles
• People: 7,500 worldwide
• Equipment: >1,300 locomotives
• Annual Carloads: ~3 million
• Track Record of Acquisitions: Added >100 railroads since 2000

5 Genesee & Wyoming Inc.
Genesee & Wyoming Inc. 2015
Australia North America
U.K./Europe

6 Genesee & Wyoming Inc.
G&W Safety Performance – 2015
3.06
2.34
2.09
1.02 0.99 0.91 0.82 0.75 0.74
FRAGroup 2
FRAGroup 3
KCS NS Class I Avg BNSF UP CSX G&W*
Injury Frequency Rate per 200,000 man-hours G&W through July; others through May
*Excludes Freightliner

7 Genesee & Wyoming Inc.
G&W 2015 Pro Forma Operating Income by Geography
Assumes 12-month Freightliner Contribution

2015 Business Update
9 Genesee & Wyoming Inc.
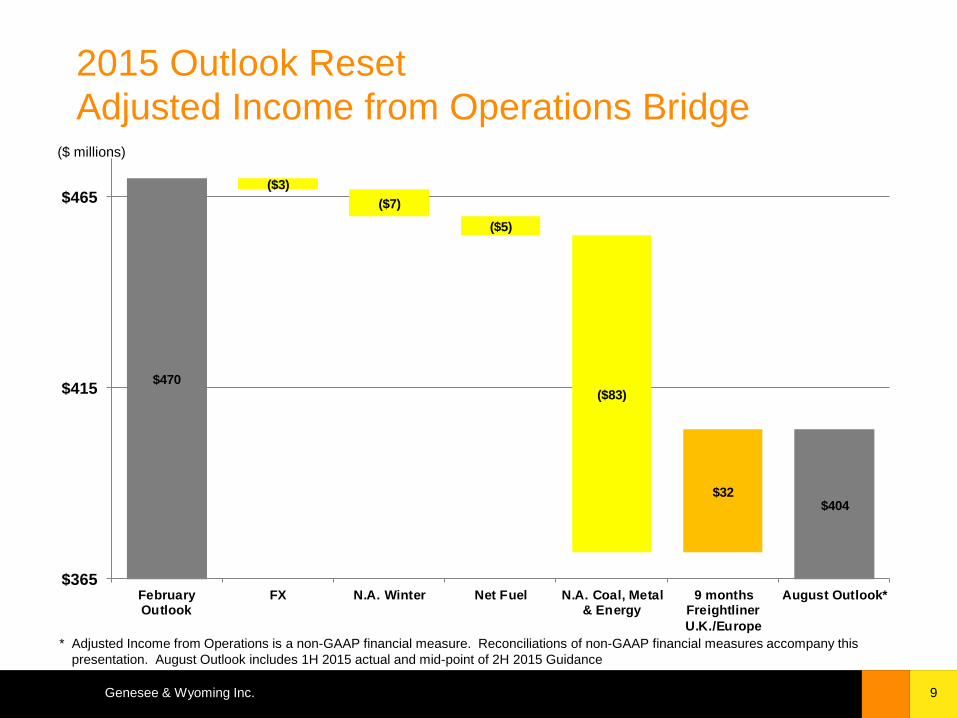
2015 Outlook Reset Adjusted Income from Operations Bridge
$470
$404
($3)($7)
($5)
($83)
$32
$365
$415
$465
FebruaryOutlook
FX N.A. Winter Net Fuel N.A. Coal, Metal& Energy
9 monthsFreightlinerU.K./Europe
August Outlook*
($ millions)
* Adjusted Income from Operations is a non-GAAP financial measure. Reconciliations of non-GAAP financial measures accompany this presentation. August Outlook includes 1H 2015 actual and mid-point of 2H 2015 Guidance

10 Genesee & Wyoming Inc.
Same Railroad North American Carloads YTD July 2015 vs. YTD July 2014
* Includes carloads and intermodal units **Includes 2013 classification adjustments
Commodity Change % CommentAgricultural Products (7,400) (6%) Midwest Corn and Wheat
Autos & Auto Parts (1,700) (9%) Weaker West Coast Export Traffic and plant production issues
Chemicals & Plastics 2,200 2%Coal & Coke (42,400) (21%) North American Steam CoalFood & Kindred Products 400 1% TimingIntermodal (units) (2,100) NM Customer facility closure
Lumber & Forest Products (3,900) (5%) West Coast Housing Market and Export Logs, Weather & Plant Maintenance
Metallic Ores 1,900 15% Copper concentrateMetals (26,000) (25%) North America Steel Minerals & Stone 100 0% Higher Construction Aggregates, Lower Sand & ProppantsPetroleum Products (3,200) (5%) Lower CBR, Higher LPGs/NGLs Pulp & Paper 2,100 2% Liner Board, PackagingWaste (1,100) (5%)Other (8,200) (17%) Class I Overhead TrafficTotal Carloads (89,300) (9%)

11 Genesee & Wyoming Inc.
North American Coal & Coke
Same Railroad
July YTD Carloads 2015 2014 Change % Description
Illinois Basin 33,000 40,000 (7,000) (18%)Origin, destination and overhead traffic in Indiana
Powder River Basin
93,000 113,000 (20,000) (18%)Destination coal for Illinois, Missouri and Oklahoma utilities
Northern Appalachia
30,000 40,000 (10,000) (25%)On-line coal moves in Ohio and Pennsylvania
All Other 9,000 14,000 (5,000) (36%) Declining Utah coal shipments
Total165,000 207,000 (42,000) (20%)
• Weakness due to competition from low-priced natural gas • Flat outlook with future volumes weather and natural gas price dependent for
remainder of 2015
• G&W carloads are approximately 97% steam coal for electricity generation • 2015 Revenue of approximately $57 million (~ 8% of North America Total Revenue)

12 Genesee & Wyoming Inc.
North American Metals Same Railroad
July YTD Carloads 2015 2014 Change % Description
Pipe 5,000 7,000 (2,000) (29%)Oil and gas drilling and transmission related
Scrap Steel 29,000 38,000 (9,000) (24%)Origin and destination customers. Input to steel making
Pig Iron 5,000 6,000 (1,000) (17%) Input to steel making
Slab 14,000 19,000 (5,000) (26%)Origin customers. End markets include auto and appliances
Coil 13,000 21,000 (8,000) (38%)Origin customers. End markets include auto, energy and appliances
All Other 14,000 15,000 (1,000) (7%)
Total 80,000 106,000 (26,000) (25%)
• Weakness across all metals categories primarily due to competition from lower priced imported steel and reduced oil & gas drilling
• Cyclical commodity with ongoing weakness due to strong US$, weaker demand (energy-related) and global oversupply
• 2015 Revenue of $62 million (~8% of North America Total Revenue)

13 Genesee & Wyoming Inc.
North American Shale Energy
Same Railroad
July YTD Carloads 2015 2014 Change % Description
Pipe 5,000 7,000 (2,000) (29%)Oil and gas drilling and transmission related
LPGs/NGLs 32,000 24,000 8,000 33%
Origin traffic from Utica and Marcellus shale fractionation plants. Destination LPG traffic for consumer and industrial use
Crude Oil 7,000 19,000 (12,000) (63%)Bakken and Canadian heavy crude destination traffic
Sand & Proppants 19,000 22,000 (3,000) (14%)Multiple regions, both origin and destination traffic
Total 63,000 72,000 (9,000) (13%)
• Significant decrease in crude traffic, frac sand and pipe largely offset by higher LPG/NGL volumes from new NGL fractionation plants in Utica and Marcellus
• 2015 Revenue of $41 million (~6% of North America Total Revenue)
14 Genesee & Wyoming Inc.
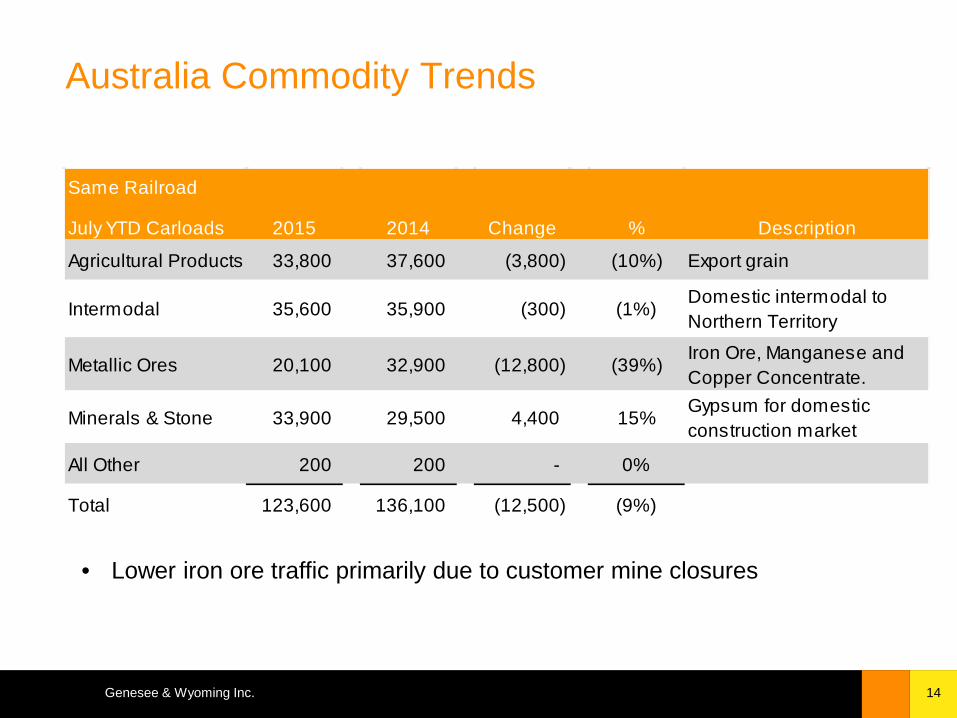
Australia Commodity Trends
Same Railroad
July YTD Carloads 2015 2014 Change % Description
Agricultural Products 33,800 37,600 (3,800) (10%) Export grain
Intermodal 35,600 35,900 (300) (1%)Domestic intermodal to Northern Territory
Metallic Ores 20,100 32,900 (12,800) (39%)Iron Ore, Manganese and Copper Concentrate.
Minerals & Stone 33,900 29,500 4,400 15%Gypsum for domestic construction market
All Other 200 200 - 0%
Total 123,600 136,100 (12,500) (9%)
• Lower iron ore traffic primarily due to customer mine closures

15 Genesee & Wyoming Inc.
Update on G&W Iron Ore Business Global iron ore price declined from US$120s in 2014 to current levels of US$50s per ton
Australian Iron Ore
• Impact of 3 mine closures reflected in 2015 financial outlook (Australia) • Remaining iron ore exposure ~US$51 million
Canadian Iron Ore • Impact of 1 mine closure reflected in 2015 financial outlook (North
America) • Remaining iron ore exposure ~US$9 million
Comments • High proportion of fixed payments on remaining revenues under
contract in Australia and Canada • No expectation for mines reopening at current iron ore price of
US$53/ton, even with significant depreciation of A$ and C$

2015 Current Outlook

17 Genesee & Wyoming Inc.
• North America - Traffic modestly improving - Seasonal improvements in agricultural products, construction
aggregates and cement - Expense reduction plans implemented
• U.K./Europe - Intermodal sequentially improves in peak season - Coal expected to seasonally strengthen in Q4 2015 and Q1 2016
• Australia - Expect seasonally weaker agricultural products traffic heading into
new harvest in Q4 2015 - Ongoing commodity weakness - Weaker Australian dollar
Outlook Overview for Second Half 2015

18 Genesee & Wyoming Inc.
Same Railroad North American Carloads July 2015 vs. July 2014
* Includes carloads and intermodal units **Includes 2013 classification adjustments
Commodity Change % CommentAgricultural Products (2,200) (11%) Midwest Corn and WheatAutos & Auto Parts (700) (24%) Weaker West Coast Export TrafficChemicals & Plastics (700) (5%)Coal & Coke (9,800) (31%) North American Steam CoalFood & Kindred Products (300) (6%)Intermodal (units) (400) NMLumber & Forest Products (600) (5%)Metallic Ores 300 18%Metals (4,600) (28%) North America Steel Minerals & Stone (1,100) (5%) Lower Frac Sand; Higher Rock Salt Petroleum Products (1,200) (13%) Lower CBR; Higher LPGs/NGLs Pulp & Paper 400 3%Waste 600 16%Other (800) (12%) Class I Overhead TrafficTotal Carloads (21,100) (13%)

19 Genesee & Wyoming Inc.
Key Priorities for Second Half 2015
1. Safety
2. Cost Reductions in North America and Australia
3. Successful Freightliner Integration in U.K./Europe/Australia
4. Short Line Tax Credit Extension
5. Acquisitions and Investments
– Evaluating opportunities in North America and abroad
– Near term investments will take into consideration higher than expected leverage (flat at 3.5x Debt/Adj. EBITDA* at year end 2015)
* Adjusted Earnings Before Interest, Taxes, Depreciation and Amortization (EBITDA) is a non-GAAP financial measure. Reconciliations of non-GAAP financial measures accompany this presentation.
20 Genesee & Wyoming Inc.
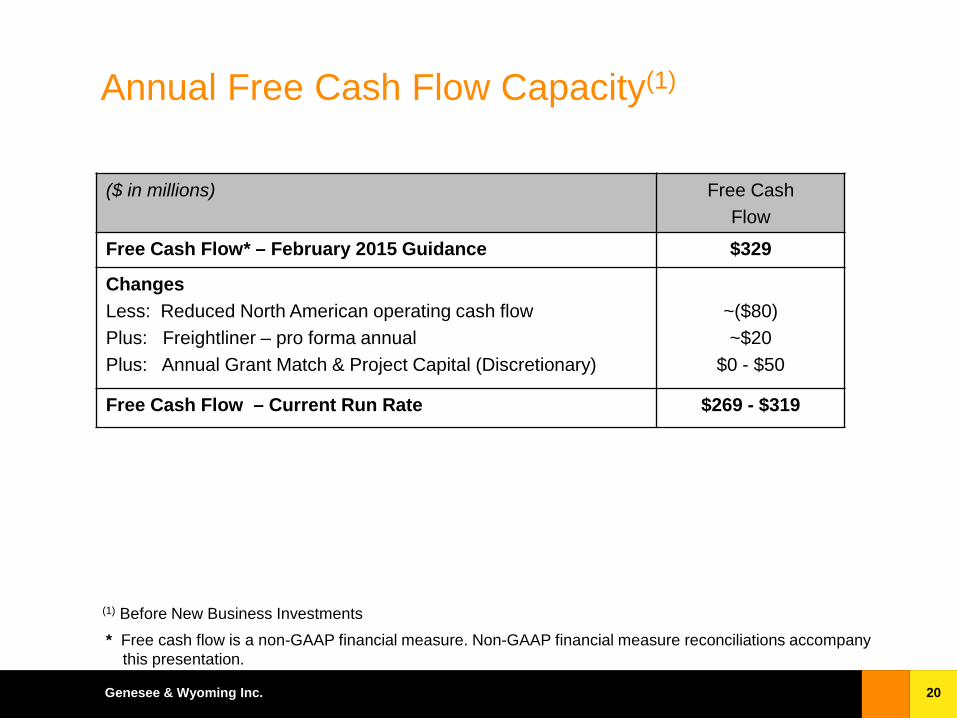
Annual Free Cash Flow Capacity(1)
($ in millions) Free Cash Flow
Free Cash Flow* – February 2015 Guidance $329
Changes Less: Reduced North American operating cash flow Plus: Freightliner – pro forma annual Plus: Annual Grant Match & Project Capital (Discretionary)
~($80) ~$20
$0 - $50
Free Cash Flow – Current Run Rate $269 - $319
* Free cash flow is a non-GAAP financial measure. Non-GAAP financial measure reconciliations accompany this presentation.
(1) Before New Business Investments

21 Genesee & Wyoming Inc.

22 Genesee & Wyoming Inc.
Appendices

Freightliner Overview

24 Genesee & Wyoming Inc.
Freightliner U.K. Intermodal Operations
• Largest rail participant in the UK intermodal market
• Most traffic runs from ports of Felixstowe, Southampton, London Gateway and Tilbury to the Midlands/Northeast/Northwest
• Strong intermodal franchise:
– Excellent service quality (98% on time)
– Terminals at ports and key inland cities
– High-quality product due to wide network, dock-to-door service and scale of train operations (e.g., 100 trains and 3,000 containers per day)
Key Container Origination and Destination Points

25 Genesee & Wyoming Inc.
• Key Commodities Hauled – Aggregates and Cement – Coal – Equipment and materials
to maintain passenger and freight rail network for Network Rail (U.K. track owner)
– Waste & Other
Freightliner U.K. Bulk Operations

26 Genesee & Wyoming Inc.
Freightliner Continental Europe
Poland – Based in Warsaw, Freightliner has less than 3% of the Polish rail
market (2nd largest rail market in Europe)
– The business is diversified with more than 70 customers, primarily aggregates and coal
– Operations also extend into Eastern and Northern Germany

27 Genesee & Wyoming Inc.
Freightliner Continental Europe
ERS (Intermodal)
– Originally set up as in-house rail operator by Maersk in 1994, connecting seaports of Rotterdam, Hamburg and Bremerhaven with cities in Germany, Italy, Poland and beyond
– Based in Rotterdam and acquired in 2013, with restructuring underway

28 Genesee & Wyoming Inc.
Cotton Growing Regions
Hunter Valley Coal Region NSW
GWA-Owned Track GWA-Operated Track
Other Railroads (largely open access)
GWA Headquarters Freightliner Operations
Freightliner Australia
• Operations based near Sydney, NSW
• Key Commodities Hauled • Coal • Cotton • Agricultural Products
• Underpinned by long-term contracts with customers
• Owned 15% by local management

Introduction to U.K./Europe Segment

30 Genesee & Wyoming Inc.
Updated Revenue Presentation
Segment North America U.K./Europe Australia
Freight revenues Traditional carload business (includes fuel surcharges)
Bulk commodities and Intermodal (includes fuel surcharges)
Bulk commodities and Intermodal (includes fuel surcharges)
Freight-Related revenues
Switching, car hire, ancillary freight charges, trackage rights, contracted services
Switching, traction service/hook and pull (locomotive + drivers), infrastructure services
Switching, contracted services, trackage rights, crewing
All other revenues Easements, real estate, 3rd party car and locomotive repair, passenger related revenues
Real estate, 3rd party car and locomotive repair
Real estate, 3rd party car and locomotive repair
• Non-freight revenues is now divided into two categories: Freight-Related and All other

31 Genesee & Wyoming Inc.
($ in millions)Q2 2015
Actual% of
Revenue Notes
Operating revenues:Freight revenues 98.0$ 59.6% Intermodal 70%; Minerals & Stone 18%; Coal 9%
Freight-related revenues 61.0 37.1% Switching; Traction service; Infrastructure
All other revenues 5.4 3.3%
Total operating revenues 164.4 100.0%
Operating expenses:Labor and benefits 46.2$ 28.1%Equipment rents 23.0 14.0% Leased locomotives and freight carsPurchased services
35.2 21.4%Contract drivers/traction in Europe; Port/terminal handling & trucking in U.K.
Depreciation and amortization 5.7 3.5%Diesel fuel used in train operations 11.9 7.2%Electricity used in train operations 5.0 3.0% New category for U.K. and Continental EuropeCasualties and insurance 1.5 0.9%Materials 8.5 5.2%Trackage rights 12.5 7.6% Track access feesNet gain on the sale of assets - 0.0%Other expenses 7.2 4.4%
Total operating expenses 156.7$ 95.3%Income from Operations 7.7$ 4.7%
Introduction to the U.K./Europe Segment

Second Half 2015 Guidance Details

33 Genesee & Wyoming Inc.
North American Operations Outlook 2H 2015 Commodity Trends – versus Q2 2015A
* Includes carloads and intermodal units **Includes 2013 classification adjustments
Commodity Q2 2015A Q3 2015E Q4 2015E Comment
Agricultural Products 53,700 + 55,000 - 60,000 Grain market conditions, timing
Autos & Auto Parts 7,500 + +Chemicals & Plastics 45,600 + -Coal & Coke 63,500 60,000 - 65,000 60,000 - 65,000 FlatFood & Kindred Products 14,700 + +Lumber & Forest Products 35,000 + +Metallic Ores 6,100 - -Metals 35,100 + +Minerals & Stone 55,900 55,000 - 60,000 45,000 - 50,000 Seasonality of aggregatesPetroleum Products 23,900 + +Pulp & Paper 45,300 + +Waste 10,200 + -Other 17,500 15,000 15,000 Class I overheadTotal Carloads 414,000 410,000 - 425,000 400,000 - 415,000
Same Railroad vs. Prior Year (10%) - (13%) (11%) - (14%)
Commodities +/-: expected changes from Q2 up/down 1,000 – 2,000 carloads

34 Genesee & Wyoming Inc.
Australian Operations Outlook 2H 2015 Commodity Trends - versus Q2 2015A
Commodity Q2 2015A Q3 2015E Q4 2015E CommentAgricultural Products 14,800 10,000 - 12,000 10,000 - 12,000 Normal SeasonalityIntermodal 15,700 + +Metallic Ores* 7,100 5,000 5,000 Iron Ore Service Ceased in Q2Minerals & Stone 14,400 + +Total Carloads 52,000 45,000 - 47,000 45,000 - 47,000
Same Railroad vs Prior Year (18%) - (22%) (14%) - (17%)
* Includes carloads and intermodal units
Commodities +/-: expected changes from Q2 up/down 1,000 – 2,000 carloads

35 Genesee & Wyoming Inc.
U.K./European Operations Outlook 2H 2015 Commodity Trends - versus Q2 2015A
Commodity Q2 2015A Q3 2015E Q4 2015E Comment
Coal & Coke 23,400 20,000 - 25,000 40,000 - 45,000 Seasonality; U.K. and Poland
Intermodal 214,200 245,000 - 255,000 230,000 - 240,000 Seasonality; U.K. and Europe
Minerals & Stone 44,100 + - Seasonality; Poland and U.K.
Other 3,200 + +Total Carloads 284,900 315,000 - 330,000 315,000 - 335,000
Commodities +/-: expected changes from Q2 up/down 1,000 – 2,000 carloads

36 Genesee & Wyoming Inc.
Outlook – Third Quarter 2015 (From August 3, 2015 Earnings Call)
(in millions, except per share amounts) North America U.K./Europe Australia
Consolidated Q3 2015Outlook
Revenues $310 - $315 $170 - $175 $60 - $65 $540 - $555
Adjusted Operating Ratio(1) ~73% 92% - 93% ~78% ~80%
Adjusted Income from Operations(1) $82 - $86 $10 - $12 ~$14 $106 - $112
Net Interest Expense $18
Depreciation and Amortization $35 $6 $7 $48
Effective Tax Rate (2) ~36%
Adjusted Diluted EPS (1) $0.95 - $1.05
Diluted Shares 57.5
(1) Adjusted Operating Ratio, Adjusted Income from Operations and Adjusted Diluted EPS are non-GAAP financial measures. Reconciliations of non-GAAP financial measures accompany this presentation.
(2) Excludes the short line tax credit. FX: A$1.00 = US$0.73, C$1.00 = US$0.77, €1.00 = US$1.09, £1.00 = US$1.55, PLN1.00 = US$0.26

37 Genesee & Wyoming Inc.
Outlook – Fourth Quarter 2015 (From August 3, 2015 Earnings Call)
(in millions, except per share amounts) North America U.K./Europe Australia
Consolidated Q4 2015Outlook
Revenues $310 - $315 $170 - $175 $60 - $65 $540 - $555
Adjusted Operating Ratio(1) ~73% 92% - 93% ~78% ~80%
Adjusted Income from Operations(1) $82 - $86 $10 - $12 ~$14 $106 - $112
Net Interest Expense $18
Depreciation and Amortization $37 $6 $7 $50
Effective Tax Rate (2) ~37%
Adjusted Diluted EPS (1) $0.95 - $1.05
Diluted Shares 57.5
(1) Adjusted Operating Ratio, Adjusted Income from Operations and Adjusted Diluted EPS are non-GAAP financial measures. Reconciliations of non-GAAP financial measures accompany this presentation.
(2) Excludes the short line tax credit.
FX: A$1.00 = US$0.73, C$1.00 = US$0.77, €1.00 = US$1.09, £1.00 = US$1.55, PLN1.00 = US$0.26

38 Genesee & Wyoming Inc.
Balance Sheet • Net Debt of $2.3 billion at June 30, 2015 • 3.5x Debt/Adjusted EBITDA* at June 30, 2015
($ in millions)June 30,
2015Cash & Equivalents 30$
Debt:Senior Secured Credit Facility, due March 2020 2,272$ Other Debt 95$ TOTAL DEBT 2,367$
Total Equity 2,432$ TOTAL CAPITALIZATION 4,799$
Total Debt/Total Capitalization 49%
Net Debt/Total Capitalization 49%
* Adjusted Earnings Before Interest, Taxes, Depreciation and Amortization (EBITDA) is a non-GAAP financial measure. Reconciliations of non-GAAP financial measures accompany this presentation.

39 Genesee & Wyoming Inc.
Reconciliation of Non-GAAP Financial Measures

40 Genesee & Wyoming Inc.
Non-GAAP Financial Measures This presentation contains references to Adjusted Income from Operations, Earnings Before Interest, Taxes, Depreciation and Amortization (EBITDA), Adjusted EBITDA, Debt to Adjusted EBITDA, Free Cash Flow, Adjusted Operating Ratio and Adjusted Diluted Earnings Per Common Share (EPS) which are “non-GAAP financial measures” as this term is defined in Item 10(e) of Regulation S-K under the Securities Act of 1933 and the Securities Exchange Act of 1934 and Regulation G under the Securities Exchange Act of 1934. In accordance with these rules, G&W has reconciled these non-GAAP financial measures to their most directly comparable U.S. GAAP measures.
Management views these non-GAAP financial measures as important measures of G&W’s operating performance or, in the case of Free Cash Flow and Free Cash Flow Before New Business Investments, an important financial measure of how well G&W is managing its assets and a useful indicator of cash flow that may be available for discretionary use by G&W. Management also views these non-GAAP financial measures as a way to assess comparability between periods. Key limitations of the Free Cash Flow and Free Cash Flow Before New Business Investments measures include the assumptions that G&W will be able to refinance its existing debt when it matures and meet other cash flow obligations from financing activities, such as principal payments on debt.
These non-GAAP financial measures are not intended to represent, and should not be considered more
meaningful than, or as an alternative to, their most directly comparable GAAP measures. These non-GAAP
financial measures may be different from similarly-titled non-GAAP financial measures used by other companies.
The following tables set forth reconciliations of each of these non-GAAP financial measures to their most directly comparable GAAP measure (in millions, except percentages and per share amounts).

41 Genesee & Wyoming Inc.
Adjusted Income from Operations
Outlook (February 2015)
Outlook (August 2015)
Operating revenues 2,145$ 2,035$ Operating expenses 1,696 1,651 Income from operations (a) 449$ 384$
Operating expenses 1,696$ 1,651$ Business development and related costs (16) (17) Australian severance costs (5) (3) Net gain on sale of assets - 1
Adjusted operating expenses 1,675$ 1,631$
Adjusted income from operations 470$ 404$
(a) Income from operations is calculated as operating revenues less operating expenses.
Twelve Months Ended December 31, 2015

42 Genesee & Wyoming Inc.
Debt/Adjusted EBITDA
Three Months Ended
September 30, 2014
Three Months Ended
December 31, 2014
Three Months Ended
March 31, 2015
Three Months Ended
June 30, 2015 G&W LTMAcquisition
LTM*Combined
Company LTMNet income 72.7$ 87.4$ 23.9$ 52.8$ 236.8$ Add back:
Provision for income taxes 36.9 14.7 16.9 29.3 97.8 Other income, net 0.7 (0.8) (0.3) (0.3) (0.7) Interest expense 12.7 12.1 13.5 17.8 56.0 Interest income (0.1) (0.1) - (0.1) (0.3) Depreciation and amortization expense 40.3 41.0 41.8 48.0 171.1
EBITDA 163.2$ 154.2$ 95.8$ 147.5$ 560.6$ 73.0$ 633.6$ Add back certain items
Non-cash compensation cost related to equity awards 3.1$ 3.8$ 3.8$ 3.8$ 14.5$ Loss on settlement of Freightliner acquisition-related foreign currency forward purchase contracts - - 18.7 - 18.7 Freightliner acquisition-related costs 0.3 1.0 12.6 0.1 13.9 Net gain on sale of assets (1.2) (1.7) (0.3) (0.5) (3.7)
Adjusted EBITDA 165.3$ 157.3$ 130.6$ 150.9$ 604.1$ 73.0$ 677.1$
Combined company debt 2,367$
Debt/Adjusted EBITDA Ratio 3.50 : 1.0
*Includes Freightliner - 9/1/2014 - 3/24/2015; Pinsly - 7/1/2014 - 12/31/2014; and adjustment for various rail car purchases

43 Genesee & Wyoming Inc.
Free Cash Flow
Twelve Months Ended
December 31, 2015 - Outlook
Original (February 2015)
Net cash provided by operating activities 569$ Net cash used in investing activities (277) Net cash used for acquisitions - Free cash flow 292$ New business investments 37 Free cash flow before new business investments 329$

44 Genesee & Wyoming Inc.
Adjusted Income from Operations and Adjusted Operating Ratio – by Segment
North America U.K./Europe Australia TotalOperating revenues $310 - $315 $170 - $175 $60 - $65 $540 - $555Operating expenses 230 - 231 160 - 163 47 - 51 436 - 445Income from operations (a) $80 - $84 $10 - $12 ~14 $104 - $110Operating ratio (b) ~74% 92% - 93% ~78% ~80%
Operating expenses $230 - $231 $160 - $163 $47 - $51 $436 - $445Net gain on sale of assets 1 - - 1 Business development and related (3) - - (3) Australian severance costs - - - -
Adjusted operating expenses $228 - $229 $160 - $163 $47 - $51 $434 - $443
Adjusted income from operations $82 - $86 $10 - $12 ~$14 $106 - $112Adjusted operating ratio ~73% 92% - 93% ~78% ~80%
(a) Income from operations is calculated as operating revenues less operating expenses.(b) Operating ratio is calculated as operating expenses divided by operating revenues.
Three Months Ended September 30, 2015 Outlook (August 3, 2015)

45 Genesee & Wyoming Inc.
Adjusted Income from Operations and Adjusted Operating Ratio – by Segment (cont.)
North America U.K./Europe Australia TotalOperating revenues $310 - $315 $170 - $175 $60 - $65 $540 - $555Operating expenses 229 - 230 160 - 163 47 - 53 437 - 446Income from operations (a) $81 - $85 $10 - $12 ~$13 $103 - $109Operating ratio (b) ~73% 92% - 93% ~79% ~81%
Operating expenses $229 - $230 $160 - $163 $47 - $53 $437 - $446Net gain on sale of assets - - - - Business development and related (1) - - (1) Australian severance costs - - (2) (2)
Adjusted operating expenses $228 - $229 $160 - $163 $46 - $51 $434 - $443
Adjusted income from operations $82 - $86 $10-$12 ~$14 $106 - $112Adjusted operating ratio ~73% 92% - 93% ~78% ~80%
(a) Income from operations is calculated as operating revenues less operating expenses.(b) Operating ratio is calculated as operating expenses divided by operating revenues.
Three Months Ended December 31, 2015 Outlook (August 3, 2015)
46 Genesee & Wyoming Inc.
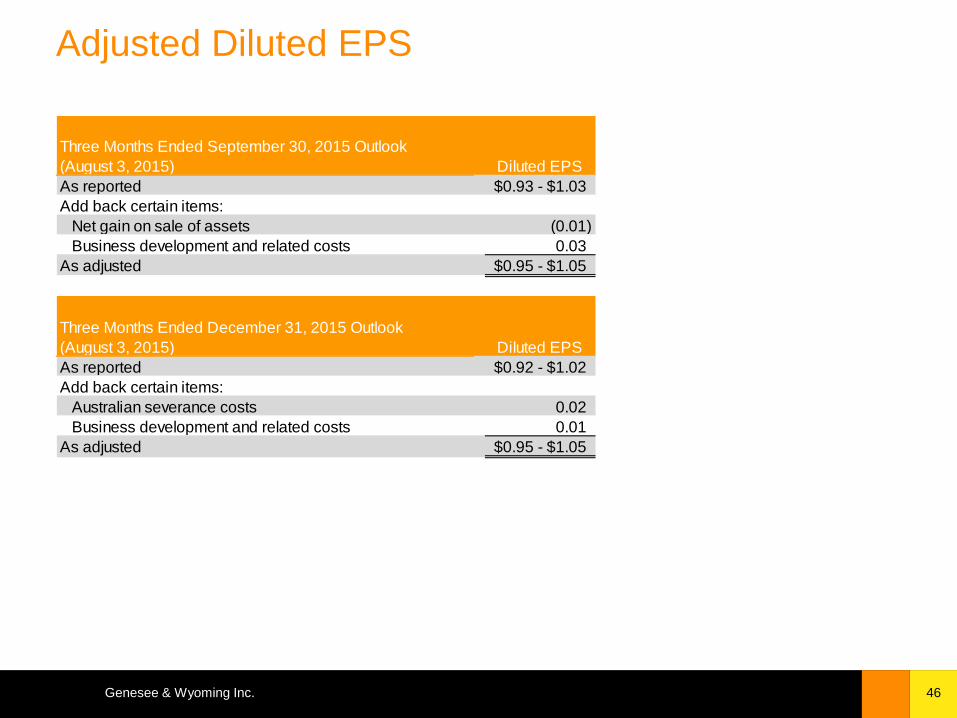
Adjusted Diluted EPS Three Months Ended September 30, 2015 Outlook(August 3, 2015) Diluted EPSAs reported $0.93 - $1.03Add back certain items:
Net gain on sale of assets (0.01) Business development and related costs 0.03
As adjusted $0.95 - $1.05
Three Months Ended December 31, 2015 Outlook (August 3, 2015) Diluted EPSAs reported $0.92 - $1.02Add back certain items:
Australian severance costs 0.02 Business development and related costs 0.01
As adjusted $0.95 - $1.05

47 Genesee & Wyoming Inc.