genesis of a ‘disaster recovery’ solution - dell emc · genesis of a ‘disaster recovery’...
TRANSCRIPT

Genesis of a ‘Disaster Recovery’ Solution
2008 EMC Proven TM Professional Knowledge Sharing
Lalit Mohan EMC Computer Systems (South Asia) Pte Ltd

Table of Contents
Executive Summary ...............................................................................................................................4
Abstract ..................................................................................................................................................5
Introduction ............................................................................................................................................6
Essential Terminology............................................................................................................................8
Assessing DR solution capability .........................................................................................................11
The Model ........................................................................................................................................11
Mathematical Expression .................................................................................................................14
Improving DR solution capability..........................................................................................................15
Operational Schedule Change .........................................................................................................15
Technology Utilized Change ............................................................................................................16
Example Case Scenarios.....................................................................................................................22
Case Scenario 1:..............................................................................................................................22
Case Scenario 2:..............................................................................................................................25
Recommendations in conclusion .........................................................................................................28
Assumptions, their impact & Improvements.........................................................................................29
Author Biography .................................................................................................................................32
Disclaimer: The examples and illustrations presented in this article are fictitious. They were invented solely for the purpose of educating the readers and are not narrations of any customer or prospect setups.

List of Figures Figure 1: Organization’s business and ‘Data’.........................................................................................4
Figure 2: Fall-back dataset creation process .......................................................................................12
Figure 3: Fall-back dataset creation process (contd.) ..........................................................................12
Figure 4: RPO time components and Variance band / Interval............................................................13
Figure 5: Improving DR solution capability...........................................................................................15
Figure 6: LM-Plot for case scenario 1 - Current-state ..........................................................................22
Figure 7: LM-Plot for case scenario 1 – Re-shaped-state....................................................................24
Figure 8: LM-Plot for case scenario 2 - Current-state ..........................................................................25
Figure 9: LM-Plot for case scenario 2 – Transformed-state.................................................................27
Disclaimer: The views, processes or methodologies published in this article are those of the authors. They do not necessarily reflect EMC Corporation’s views, processes or methodologies.

Executive Summary
EMC Proven Professional Knowledge Sharing 2008 4 of 32
Raw data increases in value as it becomes
information and finally knowledge. ‘Information’ and
‘knowledge’ drive the life-processes of businesses, societies and governments. This
data is exposed to a large variety of natural and
manmade risks, with potential to cause data loss.
This mandates business, social and administrative
leaders to naturalize ‘Data’ protection in their
respective spheres of concern and influence.
Figure 1: Organization’s business and ‘Data’
Not only large or mega enterprises are concerned about data protection. Advances in computing and
networking technology have made virtual enterprises possible. These are temporary alliances of
small complementary enterprises that are also called the supply or value chain. They share the
common objective of creating customer value. Data is the core asset for decision-making at each of
these small and large component enterprises. Without this core asset, the world as we know it would
grind to a halt, therefore data protection and recovery is everyone’s concern.
A protective layer must be thrown around these critical assets. The maintenance and review of this
layer is a continuous loop process that keeps protection current in the context of changes in the
organization’s operating environment. Organizations recognize this need and are increasingly
allocating resources for the up-keep of this protective layer. It is easy to understand why
storage/disaster recovery is ranked among the top IT 2008 strategic spending priorities. Spending
must be guided with a measurable approach that enables organizations to address questions
including, “What is the exposure today?” or “How can we reduce exposure?” Business cases
addressing these questions support spending.
This article proposes a consultative and quantitative measurement framework for assessing,
comparing and planning to improve data exposure. The approach was developed in a participative
manner, and is detailed step-by-step throughout the article. This provides an opportunity to critically
examine the underlying theory at every stage in light of the specific situation that you are facing.
This article is written so you have discretion to read specific sections, selected using the pagination
information provided in the ‘Table of contents’ and the ‘Introduction’ sections.
EMC Proven Professional Knowledge Sharing 2008 5 of 32
Abstract Immediately following a disaster, the Business must execute processes for regaining access to the
information infrastructure, namely: data, hardware and software. These must be recovered to the
required level of operational readiness to enable critical business functions to resume. Simply stated,
‘Disaster Recovery enables Business Continuance.’
In this article, the primary focus of disaster recovery is to create data protection and recovery processes. It is part of the much larger process of business continuity planning, which includes
‘impact’ analyses for classifying various business functions into categories e.g. critical, vital, important, non-critical et cetera, according to their respective prominence to the business.
Business significance, stakeholder interest, and compliance are the typical business
considerations that drive these classifications. Values so prescribed to the recovery metrics, RPO and
RTO (these metrics are defined in the section titled ‘Essential Vocabulary’) of the categories, drive the
disaster recovery solution design and its technical requirements.
This article uses example case scenarios to illustrate the impact of these key recovery metrics upon
the shape of the data recovery solution. The article includes:
a. Introduction, relevant terms and definitions
b. Assessing capability of the disaster recovery solution
c. Improving capability of the disaster recovery solution
d. Example case scenarios
e. Recommendations in conclusion
f. Assumptions, their impact, and suggested improvements
After reading this article, you will be able to anticipate the potential impact of the choices you make
about recovery products and technology. It will, therefore, facilitate informed decision-making.
Note:
(1) RPO is Recovery Point Objective.
(2) RTO is Recovery Time Objective.

Introduction I will take you on a learning journey, beginning with the ‘Genesis’ approach. This is followed by two
case scenarios. You will emerge as both, a practitioner and an advocate.
EMC Proven Professional Knowledge Sharing 2008 6 of 32
This article describes the ‘Genesis’ approach, a quantitative
methodology for designing ‘Data’ Disaster Recovery solutions. Its
components, their integration and hence the total cost-to-build are
directly related to its designed performance. The designed performance
is expressed quantitatively using recovery metrics (RPO and RTO)
defined in the ‘Essential Terminology’ section in this article.
First, the article describes the disaster recovery terminology used to
construct and explain the Genesis approach. A common language for
understanding is necessary to accomplish our objective. This section
introduces the LM-Plot, a Graphical representation of a solution’s
recovery metric capability.
We then develop a step-by-step model. This is condensed into a
simple set of mathematical expressions that are used to quantify the
recovery metric capabilities of the existing or proposed disaster recovery
setup. You are encouraged to critically examine the logic used to
develop these expressions.
Subsequently, we will discuss options to improve recovery metrics.
Each option or technique is capable of delivering a different level of
improvement for respective amounts of investment. This improvement-
to-investment characteristic is often the basis to choose one option
over the other.
I will present two case scenarios. The risk to dataset is reduced in both
cases using a combination of different options. This section is intended
to provide a workshop or do-it-yourself flavor. I encourage you to
develop your own alternative solutions to these case scenarios.
Improving DR solution
capability • Change operational schedule • Change technology utilized
Page: 15
Example Case Scenarios
• Case 1: Single-site, tape • Case 2: Two-site, replication
Page: 22
Assessing DR solution
Capability • The Model • Mathematical Expression
Page: 11
Essential Terminology
Page: 8
Business Problem as
outlined in the Executive Summary
Page: 4
Continued on Next Page
EMC Proven Professional Knowledge Sharing 2008 7 of 32
The recommendation in the conclusion section stresses the need for
a clear and objective measurement for comparing performance of
the complex options and their combinations. Following this, I will
summarize three high-level steps for executing the complex task of
creating suitable disaster recovery solutions.
Assumptions, their Impacts and Improvements
Page: 29
Recommendations in Conclusion
Page: 28
Following the above, I will present the assumptions that are made to
make it easier for you to understand this article. After this, I will
propose suggestions for further developing the ‘Genesis’ approach.
This will make it easier to use and more effective.
The article concludes with a brief experience and the author’s profile.
EMC Proven Professional Knowledge Sharing 2008 8 of 32
Essential Terminology Production: The action(s) conducted by a legitimate organization to fulfill its purpose of existence.
Dataset: Electronic recording on a storage media e.g. hard disk drive, tape media et cetera, that
makes-up the information required for the application(s) necessary for an organizations to operate.
Time-Stamp: Date and time mark associated with a dataset at which it is consistent, and hence
useable by the organization.
Currency: The state of being current; up-to-date, e.g.: Check the currency of this address?
Loss-of-Currency: Situation that describes when the only good available dataset is behind the
current wall-clock/calendar time and date.
Disaster: A ‘state’ of the production dataset due to one or more, related or independent events, that
result in the current dataset becoming inconsistent, un-useable, and unavailable for at least a period
of time beyond the threshold permitted by the organization’s operations. This justifies the act of
reinstating all or very large part of the ‘last good’ dataset. The act of reinstatement is referred to as
‘disaster recovery’ or DR.
Domino: This term describes a situation where more than one disruptive event occurs sequentially.
The recovery process is started after the first event, but a second event occurs before completion
causing the recovery to fail.
Image: Faithful re-production of a source dataset on a different electronic media, e.g. tape, disk drive
et cetera. In this article, an image is a whole or very large part of the production dataset.
Setup: Integrated system of hardware and software components that carry out the main production
or a support function for a computing facility e.g. disaster recovery, archival, management application
et cetera.

EMC Proven Professional Knowledge Sharing 2008 9 of 32
‘Objective’ Alphabet-soup: RPO Recovery Point Objective is a goal that an organization sets regarding the currency of the last good
dataset available for recovery following a disaster. Simply stated – the difference between the time-
stamp on the last good dataset and the current wall-clock/calendar time and date, at which the
business is re-started after the completion of recovery from the disaster. It is express in time UOM
(Unit-of-Measure), usually ‘hours’. For the context of this article, RPO is an as-designed objective.
RTO Recovery Time Objective is a goal that the organization sets for the length of time between the
declaration of the disaster status and the availability of the data for re-start of the Business. For the
context of this article RTO is an as-designed objective.
Recovery Metrics: Set of values that numerically describe the recovery capability of the setup. In the
context of this article, these would be RPO and RTO.
Time Component: Cycle time (CT1 and CT2), No cycle gap time (ε) and RTO are referred to as the
time components that build the RPO value. Label names CT1, CT2 and ε are defined formally in a
later section in the article.
Refresh Process: The Refresh Process reads, prepares for transmission, and transmits the
production dataset. It subsequently receives and writes to create the image of the production dataset
on any type of digital media e.g. tape or hard disk drive et cetera. The image created is an integral
and consistent reproduction of the production dataset at a specific point-of-time. This point-in-time
image may also be referred to as snapshot or check-point.
Loss-of-Currency Measure Plot (LM-Plot): An LM-Plot is a presentation and planning graphic
representing the ‘designed recovery metric’ versus ‘elapsed time.’ It provides a framework to measure
different disaster recovery solution alternatives for comparison and development of improvement
strategies. See figure 6-to-9 for examples. This representation overcomes the natural limitations in
human ability to judge multivariate scenario by creating a single condensed picture.

EMC Proven Professional Knowledge Sharing 2008 10 of 32
Gold Copy: A Gold Copy is an image of the only good target dataset created before it is committed to
any refresh operation. This eliminates the risk of an abnormal event occurring and rendering the
dataset useless, leaving no copy available to the organization. This recognizes that the risk of failure
exists in conducting any operation. This risk can be eliminated by preparing, creating and maintaining
the ‘Gold Copy’ image prior to every operation involving the ‘only good target’ dataset.
Info-Infrastructure: This term encompasses every component that makes the information entry,
processing and distribution, and its protection and management for transacting the business of the
organization. The human resources aspect is not intended to be covered under this term for the
purpose of this article.
Stubs: Stubs are links that act as placeholders or pointers. They are usually only a few kilobytes in
size, and point to a data object that was previously located in the primary dataset but subsequently
relocated in the archived dataset.
Bandwidth: This term refers the amount of data per unit time that can be sent through a
communication link. This is measured in bits per second or “bps” UOM (Unit-of-Measure). The more
bandwidth, the more data can be transferred in given amount of time.
EMC Proven Professional Knowledge Sharing 2008 11 of 32
Assessing DR Solution Capability Every computing facility has some provision for periodically creating an image of their production
dataset. It maybe a simple image created locally or remotely. It could be made on a hard disk drive or
removable tape media that may be held securely at a local site or transported to an alternate safe-
site. This image is referred to as ‘fall-back dataset’.
The currency of the fall-back dataset regresses as time moves forward. Hence, there is a need to
constantly update the fall-back dataset image to keep it as near-current as possible. This is
achieved by refreshing the dataset in the computing facility’s daily operational schedule.
We can compute a maximum and minimum RPO based on the characteristics of the fall-back dataset
creation setup. It is very important to note here that RPO for a given setup is not constant. This
is because the actual instance of a disaster cannot be predicted; it can happen at any time. Therefore, RPO will swing in a band or an interval bounded by the two extremities of RPOmax and RPOmin. A model will be developed in the next section of this article to write the suitable
expression for computing these two extremities of the RPO recovery metric value.
The Model
We can visualize a common unified model for the working of any fall-back dataset refresh process.
As it begins operation, this process picks up a bucket of data and transports it to refresh the fall-back
dataset. During the time it takes to complete this action, fresh incoming data is received by the
production dataset. Just before the completion of the refresh task, the fall-back dataset is behind the
production dataset by:
a) CT - the cycle time taken for this copy to complete
b) The new incoming data received by the production dataset during this refresh, for the same
duration as the cycle time (CT)
The fall-back dataset timestamps are shown in the Figures 1 and 2.
This model assumes that the fall-back dataset is not an integral, useable image during the working
of the refresh cycle, until it is complete. A reserve image of the fall-back dataset, the ‘Gold Copy’
must be kept safe before initiating the refresh process. Do not initiate the refresh process on the only
available fall-back dataset image. If a mishap occurs during the refresh process and it aborts, the only
available fall-back dataset would be corrupted.

Figure 2: Fall-back dataset creation process
Figure 3: Fall-back dataset creation process (contd.)
Two assumptions are implicit in the model above. First, there are fresh updates to production; rate of
this activity is constant. Second, the refresh process requires the same cycle time, every time. Both
of these assumptions will not be true in a real world situation. To accommodate for the variation in the
fresh production dataset update rate and the refresh process cycle time in the model, the expression
for the time-stamp of the refresh dataset must be modified.
The ‘2 CT’ expression (figure 2) is replaced with ‘CT1 + CT2’. The cycle time taken by
the refresh process for the first refresh is CT1 and the cycle time taken by the refresh
process for the immediately next refresh cycle is CT2. Hence, the expression
representing the time-stamp of the fall-back dataset, just prior to cycle completion and
as the cycle completes would change to became [ T - { CT1 + CT2 } ] and [ T - CT2 ] respectively.
2 x CT
CT1 + CT2
EMC Proven Professional Knowledge Sharing 2008 12 of 32

Also, note that the refresh process cycle may not always be scheduled to run continuously. In a real-
life operational schedule, there may be gaps between consecutive refresh process cycles. The length
of this time gap is represented by label ‘ε’. As a result, the expression representing the time-stamp of
the fall-back dataset, just prior to cycle completion and as the cycle completes, would have to include
this additional time gap and become [ T - { CT1 + ε + CT2 } ] and [ T – CT2 ] respectively. Note: ‘ε’ does not get added in the latter expression. As soon as the cycle is complete,
the fresh update to the production dataset received during the ‘ε’ time gap
period is applied to update the fall-back dataset. Only the fresh updates to the
production dataset received during the progress of the CT2 cycle of the refresh
process are still outstanding for update to the fall-back dataset.
+ ε CT1 + CT2
CT1 + ε + CT2
Once a ‘disaster’ is declared and components for recovery including the fall-back dataset are
identified, it takes some time to re-start the business. This time is referred to as RTO, recovery time
objective. RTO has to be added to the expression for the time-stamp, as the business transactions
during this period will continue and need to be accounted for. Some businesses name this period the
‘catch-up’ period, where business transactions may be manually recorded by business operations. As
a result, the expression representing the time-stamp of the fall-back
dataset, just prior to cycle completion and as the cycle completes,
would have to include this additional period and hence became
+ RTOCT1 + ε + CT2
CT1 + ε + CT2 + RTO [ T - { CT1 + ε + CT2 + RTO } ] and [ T – { CT2 + RTO } ]
respectively.
Figure 4: RPO time components and Variance band / Interval
The dataset RPO may vary depending on when the disaster strikes and on the setup characteristics
for creating and using the fall-back dataset. This ensures that stakeholders have a consistent and
correct understanding and expectation. I hope to help you avoid a situation where your
stakeholders are shocked by losing business data currency, e.g. in tens of hours, when they believed they had invested their precious resources to create images of their production datasets in a very short period of time. We must know our deployed technologies and how they
are scheduled to operate. This knowledge enables us to arrive at the setup’s true design capability.
EMC Proven Professional Knowledge Sharing 2008 13 of 32
EMC Proven Professional Knowledge Sharing 2008 14 of 32
As a result, we can make appropriate decisions for installing, replacing or upgrading disaster recovery
protection setups in accordance with business requirements and budget availability.
Mathematical Expression
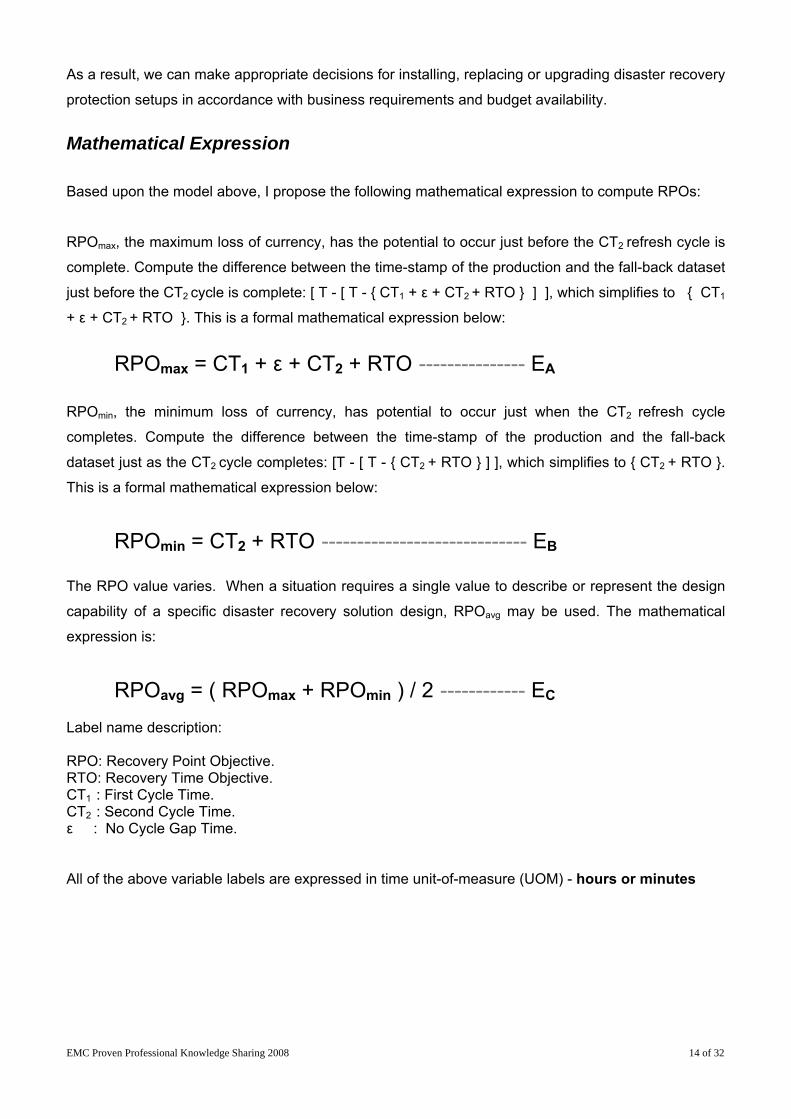
Based upon the model above, I propose the following mathematical expression to compute RPOs:
RPOmax, the maximum loss of currency, has the potential to occur just before the CT2 refresh cycle is
complete. Compute the difference between the time-stamp of the production and the fall-back dataset
just before the CT2 cycle is complete: [ T - [ T - { CT1 + ε + CT2 + RTO } ] ], which simplifies to { CT1
+ ε + CT2 + RTO }. This is a formal mathematical expression below:
RPOmax = CT1 + ε + CT2 + RTO --------------- EA
RPOmin, the minimum loss of currency, has potential to occur just when the CT2 refresh cycle
completes. Compute the difference between the time-stamp of the production and the fall-back
dataset just as the CT2 cycle completes: [T - [ T - { CT2 + RTO } ] ], which simplifies to { CT2 + RTO }.
This is a formal mathematical expression below:
RPOmin = CT2 + RTO ----------------------------- EBB
The RPO value varies. When a situation requires a single value to describe or represent the design
capability of a specific disaster recovery solution design, RPOavg may be used. The mathematical
expression is:
RPOavg = ( RPOmax + RPOmin ) / 2 ------------ EC
Label name description: RPO: Recovery Point Objective. RTO: Recovery Time Objective. CT1 : First Cycle Time. CT2 : Second Cycle Time. ε : No Cycle Gap Time. All of the above variable labels are expressed in time unit-of-measure (UOM) - hours or minutes
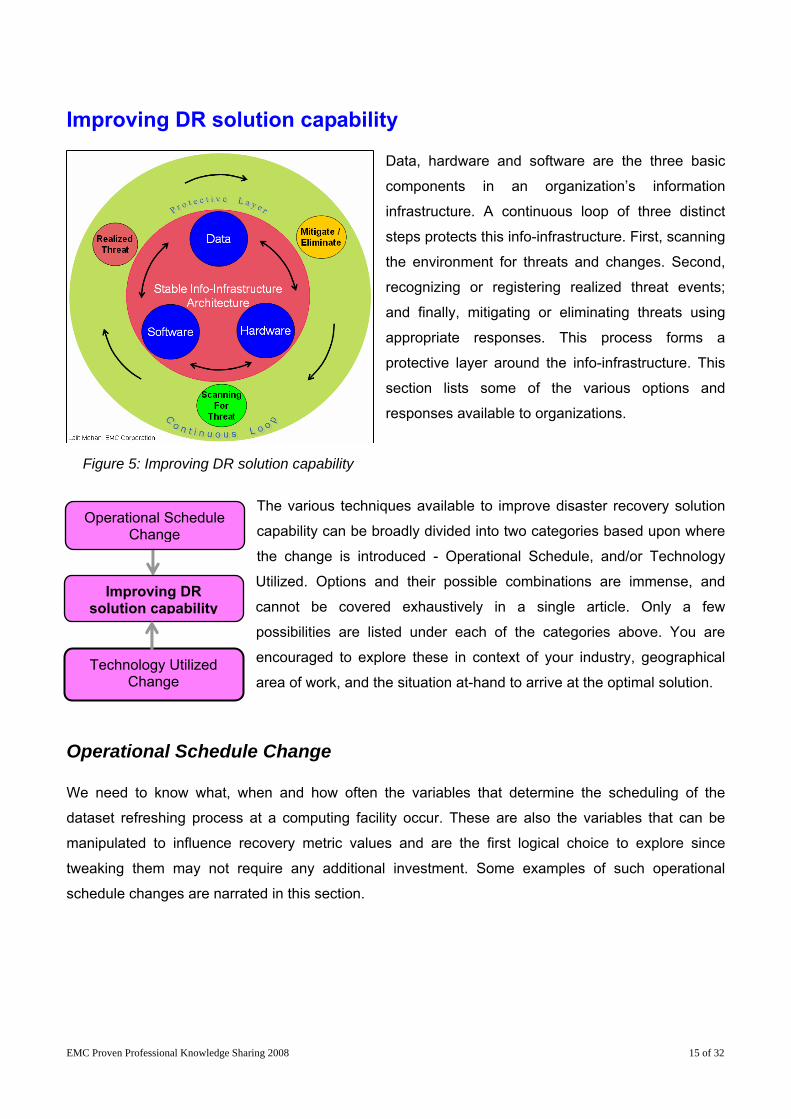
Improving DR solution capability Data, hardware and software are the three basic
components in an organization’s information
infrastructure. A continuous loop of three distinct
steps protects this info-infrastructure. First, scanning
the environment for threats and changes. Second,
recognizing or registering realized threat events;
and finally, mitigating or eliminating threats using
appropriate responses. This process forms a
protective layer around the info-infrastructure. This
section lists some of the various options and
responses available to organizations.
Figure 5: Improving DR solution capability
The various techniques available to improve disaster recovery solution
capability can be broadly divided into two categories based upon where
the change is introduced - Operational Schedule, and/or Technology
Utilized. Options and their possible combinations are immense, and
cannot be covered exhaustively in a single article. Only a few
possibilities are listed under each of the categories above. You are
encouraged to explore these in context of your industry, geographical
area of work, and the situation at-hand to arrive at the optimal solution. Technology Utilized
Change
Improving DR solution capability
Operational Schedule Change
Operational Schedule Change We need to know what, when and how often the variables that determine the scheduling of the
dataset refreshing process at a computing facility occur. These are also the variables that can be
manipulated to influence recovery metric values and are the first logical choice to explore since
tweaking them may not require any additional investment. Some examples of such operational
schedule changes are narrated in this section.
EMC Proven Professional Knowledge Sharing 2008 15 of 32

EMC Proven Professional Knowledge Sharing 2008 16 of 32
There may be periods of time when the image refresh process may not be scheduled to run in the
current setup. This may be due to a time or technology limitation. However, when faced with the
requirement to improve recovery metrics, there is one variable you should consider. ‘No Cycle Gap Time’ (ε) may be reduced or totally eliminated, as it best serves the need-at-hand. This would impact
reduction of the RPOmax.
Computing facilities typically operate around-the-clock, running multiple applications to serve the
enterprise. Some periods of time are typically busier than others. Operations management would
usually schedule the execution of support applications and processes around the main business-
application related activities. Tweaking and tuning within the permissible time periods may allow for
shorter cycle times (CT) and potentially reduce RPO.
Another avenue is to run the refresh process more frequently. As you do so, fewer fresh updates
accumulate, thus reducing the individual cycle time (CT). This may not always be feasible and would
require analysis before planning the implementation.
Technology Utilized Change
There are numerous applied technologies that can be used to improve disaster recovery capability.
These choices are increasing by the day. Huge investments are being made in research and
development by various players in the storage and communications infrastructure industry, and they
are churning out newer, better, and faster alternatives.
Tape media:
Tape technology is not well suited for disaster recovery applications due to the large volumes of data
that would require recovery. A large number of tape media cartridges would be required, invoking
reliability and performance concerns.
The facilities that are still using tape technology for creating their fall-back dataset will benefit from
advances in tape technology. These advances offer a quantum leap in the capacity of a single tape
cartridge, performance and reliability, both for writing and reading from the tape media. The impact is
to reduce the RPO by reducing the cycle time (CT) and the RTO duration.

EMC Proven Professional Knowledge Sharing 2008 17 of 32
At times, the production dataset is too large to be accommodated as whole in every fall-back image
refreshing cycle. In these cases, a switch from full to pseudo-full image would reduce the refresh
process cycle time to manageable lengths. Pseudo-full image is a full image created by combining the
older full image and the incremental or differential (cumulative) images. Pseudo image, however, due
to multi-stage recovery process adversely impact RTO and RPO. LM-Plot is an apt tool to graph and
see the net or cumulative impact of multiple interrelated changes upon the DR solution in-place in a
single picture.
Disk Libraries
The phenomenal growth of production dataset size and demanded availability for longer periods of
time is quickly shrinking the opportunity window to create a fall-back dataset beyond the capability of
tape technology. Additionally, the requirements for the RPO and RTO are becoming more stringent,
increasing the requirement for high-performance and high reliability disaster recovery solutions.
Tests comparing the disk library with the latest and greatest tape technology show significant
performance improvements. Typically, dataset image creation using disk library takes one-third and
dataset recovery one-tenth of the time required when using tape technology. This is a quantum leap
forward in terms of performance improvement and directly reduces the cycle time (CT), RTO, and
RPO.
Additionally, disk libraries are highly-available equipments. Redundant components eliminate all
potential single points of failures. Disk Libraries can be eased-in to a production environment
providing benefits without causing major changes or disruption. In other words, you get the gain
without the pain. This is possible because disk libraries can emulate tape media as the virtual tape
libraries (VTL), eliminating disruption and the need for costly re-building of the fall-back dataset
creation environment.
Disk libraries can be connected in a primary-secondary relationship across sites using shared IP
networks links. This eliminates the need to deploy a tape media type just because it can be removed
and transported to an off-site location. Remote replication between Disk Libraries provides an image
in the local environment for quick restore, and a remote image created efficiently by sending only the
changed data in every refresh cycle. If the situation demands that dataset images must be restored
from the remote site, the cycle time CT, RTO and RPO may vary based upon the cross-site
bandwidth deployed.
EMC Proven Professional Knowledge Sharing 2008 18 of 32
Disk Array Virtual tape libraries are attractive to businesses that simply cannot engage in process changes.
However, they bring limitations and licensing cost of the physical tape libraries. Disk arrays can
present file systems or disk extents for creating the fall-back dataset. These file systems are used as
the fall-back images’ container or the target in-place of the tape cartridges. This eliminates the need
to artificially emulate the behavior of a physical tape media and library. However, the application
software running the refresh process must be able to manage the flow from the primary disk drive
location to the fall-back image disk target location. Using the disk array technology in this manner,
you will see a large potential for improvement in the cycle time (CT), RTO, and a reduction in RPO.
De-duplication
The large size of dataset refreshed in a refresh cycle gives rise to: interference with the production
activity, network bottlenecks, and the high cost of buying and managing too many disk drives or tape
media. Fortunately, a significant portion of data that is moved across in any full or pseudo-full image
refresh cycles is redundant. Consider, for example, that different versions of edited files have most of
the bits and bytes in common. People send the same files to multiple recipients regularly using
messaging systems. De-duplication or data reduction technology targets a reduction by identifying
redundant data. It is most effective to do this before transmitting data to the target over the network
links. Data reduction reduces the cycle time (CT). A de-duplication product maintains the full-virtual
copy of the dataset as the fall-back image. It is a one-stage, full image recovery when required, and
reduces the RTO. This is in contrast to the multi-staged traditional fall-back image restore process,
that elongates the RTO and hence the RPO.
This family of products positively impacts both the cycle time (CT) and the RTO, and reduces the
RPO. There is a large cost benefit resulting from the reduction in networking bandwidth and the
underlying storage, disk drives or tape media, required to store the image.
Continuous Protection Continuous protection inspires a new family of products that provide continuous, automated, often
policy driven, local and remote fall-back dataset image refresh processes using replication software
running on dedicated appliances. These solutions use storage area networks and IP (Internet-
Protocol) based LANs (Local Area Networks) and WANs (Wide Area Networks) to move data. These
products enable organizations to limit the loss of currency in the fall-back dataset in the event of a
disaster. The amount of loss depends upon the replication mode deployed. Through the use of

EMC Proven Professional Knowledge Sharing 2008 19 of 32
snapshot (a.k.a point-in-time or check-point) replication, powerful bandwidth reduction and
compression technology, these solutions create more and more current fall-back dataset image using
less time and infrastructure resources. This results in a positive impact on both the cycle time (CT)
and the RTO, thereby reducing the RPO. Techniques like journaling combined with the fall-back
dataset provides a useful event roll-back feature, if necessary. Consistency of the fall-back dataset is
guaranteed at the expense of currency so that production can successfully start from the fall-back
dataset in case of a disaster. Synchronous no-data-loss mode is possible using these solutions
provided the underlying info-infrastructure is able to support a tolerable response time elongation.
However, discussion of a synchronous mode solution is outside the scope of this article.
‘Business Continuity’ split-image volumes
An effective way to protect data is to use Intelligent storage array based technology that splits
independently addressable image volumes off any dataset. These volumes may even be split from a
production dataset as it is live and serving business transactions. Technology advances have made it
possible to maintain data consistency, so that the captured image is useable for recovery or parallel
operations. Split-images are exact and full persistent images of the production dataset.
There are three types of such technologies available: mirrors, clones and snapshots. Mirrors and
clones are full persistent, point in time images of the production dataset. Mirrors are on volumes that
are exactly the same size as the production dataset; clones may be on volumes larger than the
source production dataset volumes. The computing horse-power to create, maintain and use them
comes from the storage array. Hence, there is no impact on the performance of the production
dataset or business application. Mirrors and Clones, because they are full image, need more storage
and are more costly when compared to snapshots.
Snapshots are shorter-term point in time images of the production dataset. They use the copy-on-
first-write algorithm to maintain a virtual full image of the production dataset at the point in time they
were activated, using a combination of saved information and software pointers. Reading or writing
from these snapshot volumes has adverse impacts on the performance of the production dataset
because some part of the information is always shared between the production and the snapshot
dataset. At times, independent processes may compete for this shared information. The impact on
the production dataset performance is balanced by the cost advantage that snapshots have over the
mirror and clone images.

EMC Proven Professional Knowledge Sharing 2008 20 of 32
The production dataset may already be large, or becoming so large, that it may not be feasible to
refresh it in every process cycle. Split-image technologies can reduce the size of data handled in
each cycle by tracking changes or fresh updates that have been received by the production dataset
since the last refresh cycle. This increases efficiency by permitting every fall-back refresh cycle to
work with only the fresh updates since the last cycle. This has a direct impact in reducing the cycle
time of the refresh cycles (CT) and hence the RPO. The instant restore capability of such
technologies has the potential to eliminate the RTO component of RPO completely. This is a huge
positive impact that improves the recovery capability of the disaster recovery solution.
Technology developers provide storage array based application programming interfaces (API) for
these technologies which can then be can be used in scripts and programs. These scripts and
programs can easily be schedule-driven by time or event. This integration provides a very fertile and
flexible framework for developing and implementing automated data protection strategies.
Data Archival
Tiered storage provides a financial benefit to customers by physically moving the information dataset
as it progressively ages along its life-cycle in the organization’s info-infrastructure. It starts its journey
on the SAN (Storage Area Network) based disk media when it is created, progresses to IP network
based RAIN (Redundant Array of Inexpensive Nodes) disk media as it becomes fixed content, and is
finally purged, electronically shredded or moved to tape media as it is retired.
This movement or data archiving is transparent to business applications in order to eliminate the pain
of changing the environment to introduce these tiers. The delay in accessing older data that has been
moved to lower tiers is the only perceptible change that business applications may experience. In
such an environment, the fall-back image creation process also needs to be archival–aware. Instead
of backing up entire physical dataset component objects, only stubs or links that point to the relocated
dataset objects archived on the lower tier are included in the refresh process bucket.
In this situation, the complete fall-back image is a combination of the fall-back dataset image with
stubs plus the archival image to form a complete and valid whole-body fall-back dataset. If either of
the partial images is lost, the remaining portion is invalid and the fall-back dataset image is lost.
This combination of technology provides dual benefits. The cycle time (CT) is reduced since stubs
reduce the amount of data in the refresh bucket. The refresh process window becomes shorter,
providing ensuing benefits. RTO improves as less data has to be restored due to the presence of the
stubs in the fall-back dataset. Together, this provides the benefit of reducing RPO.

EMC Proven Professional Knowledge Sharing 2008 21 of 32
Moving fixed content data to RAIN based disk media provides the opportunity to spawn an additional
layer of protection features including controlling, restricting, retaining and deleting data for compliance
to governance requirements.
Communications Networks
Optical and digital networking standards i.e. SONET/SDH (Synchronous Optical Network /
Synchronous Digital Hierarchy) are a cost-effective, scalable, time-division multiplexing networking
technology option. It provides an enterprise with high service levels for reliability, low latency and
predictable high throughput. This is made possible by the new evolving standards such as GFP
(Generic Framing Procedure), LCAS (Link Capacity Adjustment Scheme) and VCAT (Virtual
Concatenation) to efficiently converge many applications onto a single reliable, scalable and secure
network infrastructure.
Today, large and reliable bandwidth provisioning over long distances is not a problem. A future-proof
multiplexing specification like SDH provides the flexibility to extract and insert lower data rate stream
tributaries without the error-prone and costly multiplexing and de-multiplexing operations and
equipment. It also provides resilience using self-healing rings in case of link failures. The
SONET/SDH specification is complementary to DWDM (Dense Wave Division Multiplexing)
technology, providing a very high bandwidth by combining forty or more wavelengths on one single
fibre. Together, these technologies provide very low-latency, highly secure and reliable bandwidth
over long distances.
This advancement in digital network specification and protocol technology is revolutionizing the use of
existing SONET/SDH communications network infrastructures, enabling their use for new IP-based
network and SAN data traffic services, in addition to the traditional voice and private line services.
This provides the industry more flexibility in the utilization of the available bandwidth.
Storage networking for disaster recovery application demands high quality network services. In the
past it required the enterprise to acquire expensive dark-fibre links, WDM (Wave Division
Multiplexing) and fibre-channel extender devices. Current technology enables service providers to
provide shared pay-as-you-use services with attractive price-performance characteristics. Even
smaller enterprises are locating their fall-back dataset images at remote sites and are still achieving a
respectfully low RTO and RPO. Affordability and availability stumbling blocks have vanished.

An organization’s real benefit comes from building DR solutions that combine some of the technology
components discussed above. DR Solution consulting is an important function that helps to design
and integrate various components into a solution that meets the needs of the specific organization.
LM-Plot is a very important and effective tool for envisioning, discussing and finalizing disaster
recovery goals.
Example Case Scenarios
Case Scenario 1: Scenario description: A fall-back image of the production dataset of an important manufacturing business application is
created locally to limit the loss of data currency. This image has to be created after the application is
shutdown to guarantee its consistency. Any unavailability of the business application data outside the
6.00 pm to 12.00 am window would affect business transactions and important batch update and
reporting activities that are business-critical. Currently, this fall-back dataset is created by using
software application to write the image of the production dataset to tape media. This process takes six
hours. The size of the dataset permits every image refresh process to be ‘Full’, and we expect no
significant growth in dataset size. We estimate a nine hour restore time. Defining the maximum
amount of hours of production loss of dataset currency that can be tolerated is critical to the business.
Figure 6: LM-Plot for case scenario 1 - Current-state
EMC Proven Professional Knowledge Sharing 2008 22 of 32

EMC Proven Professional Knowledge Sharing 2008 23 of 32
Scenario analysis: Based on the scenario, here are the numerical values of the current setup’s characteristics. It
describes the ability to cope with a disaster event in terms of loss of data currency. If disaster strikes
at 23:40 hours, the fall-back dataset would be about 39 hours (6 + 18 + 6 + 9), behind the production
dataset. However, if the disaster event occurs at 24:00 hours the loss of currency is exactly 15 hours
(6 + 9). At all other times the loss of currency value will be between the two values, i.e. 39 and 15
hours. Thus for the current protection setup the values for RPOmax is 39 hours, RPOmin is 15 hours.
and RPOavg is 27 hours.
Scenario Review: Upon review, the business owners decided that a maximum 39 hour loss of production data currency
was too risky for their business. It would jeopardize the manufacturing operations and commitments
to their customers. They assessed that their business commitment required a 30% risk reduction.
They chartered the information infrastructure team to create a proposal to re-shape the current
protection setup to meet this objective, keeping cost in mind.
Re-shaped Solution proposal: The Infrastructure team went back to their system engineering design drawing board to re-
engineer the dataset protection setup. They explored two options available to them, schedule- and
technology- related alternatives. Finally, they decided upon a combination of these two options.
The team knew that they would have to create the production dataset image more often. Currently,
there was a long gap of eighteen hours between the successive refresh process cycles. This was a
major contributor to the unacceptably high values of achievable recovery metrics. This constraint was
due to the inability to shutdown the application outside the 6.00 pm to 12:00 am window.
There were advances in the software application that allowed creation of an integral image of the live
production dataset as it was being used for production transactions. However, the application
software provider licenses this new feature separately. The Infrastructure team discussed this with the
business people, and identified the lean business period between 6.00 am and 12.00 pm after the
business-critical batch update and reporting activities. The team estimated that six hours would be
required for this live dataset image creation process. Additionally, the team decided to replace the
older generation tape drives with the latest generation technology to reduce the restore process time
from nine hours to seven hours. The team presented their proposal to the business after costing the
introduction of the new tape drive technology, professional services for implementation of the new
setup, and the license for the live dataset image creation feature.

Figure 7: LM-Plot for case scenario 1 – Re-shaped-state
Re-shaped Solution analysis: For the re-shaped solution, the RPOmax now was 25 hours compared to 39 hours, a 35%
improvement that was well above the minimum 30% required by the Business. Now, if disaster strikes
at 11:40 hours, the fall-back dataset would be about 25 hours (6 + 6 + 6 + 7), behind the production
dataset. However, if the disaster event occurs at 12:00 hours the loss of currency would be 13 hours
(6 + 7). During all other times, the loss of currency value will be between the two values, i.e. 25 and
13 hours. Thus for the re-shaped protection setup the values for RPOmax is 25 hours, the RPOmin is 13
hours and the new computed RPOavg became 19 hours.
Scenario follow-up exploration: There can be other improvements in the case scenario above. The reader should consider other
solutions and quantify the improvements (e.g. % of risk reduced and estimate the cost-to-implement).
Finally, compare a number of solutions using improvements quantum versus cost-to-implement to
arrive at the final choice.
EMC Proven Professional Knowledge Sharing 2008 24 of 32

Case Scenario 2:
Scenario description: A large financial institution needed to address sovereign risk to its most important business asset,
the business critical production dataset. Its fall-back dataset image is created remotely at a site
outside the country of operation, thousands of kilometers away. The remote site is equipped with an
identical storage array. The storage arrays at the two sites were connected using a shared, packet
switched optical network link leased from a reliable international telecommunication service provider.
Existing storage based technology enabled the image refreshing process to send only fresh updates
to the production dataset collected during the progress of the previous cycle. As a result, current
bandwidth is able to refresh the fall-back dataset at the remote site in nine hours. This is also the time
required to restore the fall-back dataset back as production dataset, if required. Disaster recovery
tests and drills have suggested that three hours are required to setup and start the alternate
production facility at a standby centre at the primary site. This time was in addition to the nine hours
for obtaining the fall-back dataset from the remote site. Hence currently total dataset restore-of-
operations required twelve hours.
Figure 8: LM-Plot for case scenario 2 - Current-state
EMC Proven Professional Knowledge Sharing 2008 25 of 32
EMC Proven Professional Knowledge Sharing 2008 26 of 32
Scenario analysis: Based upon the scenario, here are the numerical values of the current setup in place at this business,
describing its ability to cope up with a disaster in terms of loss of currency of data. If disaster strikes at
17:40 hours, the fall-back dataset would be about 30 hours (9 + 9 + 12), behind the production
dataset. However, if the disaster event occurs at 18:00 hours the loss of currency is exactly 21 hours
(9 + 12). All other times the loss of currency value will be between the two values, i.e. 30 and 21
hours. Thus for the current protection setup the values for RPOmax is 30 hours RPOmin 21 hours and
RPOavg is 25.5 hours.
Scenario Review: The Board expressed that a 30 hour potential loss of production dataset currency at the maximum
and 25.5 hours on average was unacceptably high, and did not align with the institution’s business
charter. They required a hefty 40% risk reduction. The Vice-President of G-CIT services (Global-
Communications & Information Technology) was directed to propose a transformational approach to
attain this objective. Maintaining and enhancing the sovereign risk capability was important for the
Board. Although the amount of investment was a factor, it was not a constraint.
Transformed solution proposal: The VP of G-CIT assembled a task force to create a transformation plan to meet the Board’s
objectives. Twelve hours was the largest component in the fall-back dataset creation process. Within
this component the largest portion of time was spent transmitting the fall-back dataset from the
remote site to the production site, requiring nine hours of the twelve.
After brain-storming, the team proposed an alternate disaster recovery production setup at the
remote site. The fall-back dataset would not have to be copied back to the production site, and the
disaster-time production could be started remotely. This eliminated the nine hours required for the fall-
back data to be copied back from the remote site to the production site after the disaster.
This approach also strengthened the institution’s sovereign risk coverage objective. However, the
three hours required to setup the alternate production facility at the nearby site grew to five hours at
the remote site. Still, there was a reduction of seven hours in the time required to make data available
to re-start the business from the remote site production facility. The team estimated costs to set up
this alternative production facility and for the additional communication arrangements to make it
accessible to the users. The task force also short-listed the recommendation to requisition more
transmission bandwidth to speed the transmission of the production dataset from production to the
remote site. This was expected to reduce the refresh process cycle time from nine hours to six hours.

Figure 9: LM-Plot for case scenario 2 – Transformed-state
Transformed solution analysis: For the transformed solution the RPOmax now is 17 hours and RPOavg has became 14 hours
compared to previous value of 30 and 25.5 hours respectively, this is a 43% and 45% improvement
respectively, well above the 40% least required by the Board. Now, if disaster strikes at 11:40 hours,
the fall-back dataset would be about 17 hours (6 + 6 + 5), behind the production dataset. However, if
the disaster event occurs at 12:00 hours the loss of currency would still be exactly 11 hours (6 + 5).
All other times the loss of currency value will be between the two values, i.e. 17 and 11 hours. Thus
for the transformed protection setup the values for RPOmax is 17 hours the RPOmin 11 hours. and the
new computed RPOavg becomes 14 hours.
Scenario follow-up exploration: There can be other improvement solutions to scenario presented. The reader should take some time
to suggest other solutions, quantify the improvements e.g. % of risk reduced and estimate the cost-to-
implement. Finally, compare various solutions using improvements quantum versus cost-to-
implement to arrive at the final choice.
EMC Proven Professional Knowledge Sharing 2008 27 of 32
Recommendations in Conclusion An organization must first achieve self awareness. It must assess its strengths and weaknesses,
and threats and opportunities in the current and proposed data protection scheme (or the protective
layer as referred to in the executive summary). This may be achieved through use of analysis
techniques like SWOT. Once awareness is developed, the organization can objectively guide their
scarce resources to guard against threats, and use their strengths to capitalize on opportunities.
Plan and develop a Disaster Recovery solution using an objective and structured technique, such
as the ‘Genesis’ approach presented in this article. This helps the stakeholders to arrive at a
decision after considering relevant factors in order of their importance. This provides a valuable
measurement system that enables a comparison of the different complex disaster recovery solutions.
This is particularly important when using combinations of technologies and scheduling options.
In the absence of a cogent and quantitative measuring system, there would be no objective basis of
comparison to arrive at the most suitable choice. Every change to the information infrastructure may
increase or decrease the cycle time (CT), no cycle gap (ε), the RTO and hence the RPO. With new
promising technological development arriving at our shores continuously, LM-Plot is an excellent
planning tool to plot and predict the cumulative net effect of ‘the-every-next-thing’ introduced in the
disaster recovery solution.
An instance of large RPO is a weakness. Its components must be analyzed and measured to isolate
the time component(s) that are the real contributors to the large RPO value. Organizations must then
use the strength of their resources to plan and implement the scheme. This will reduce the identified
time component and the RPO, which is a threat to its business operations. This process must be
executed repeatedly as a continuous loop to keep the protective layer current and functional in
achieving its objective of protecting the organization’s critical asset, namely, the production dataset.
EMC Proven Professional Knowledge Sharing 2008 28 of 32
Chose change options Consolidate design
and implement
Identify time components to change
• Business Risk • Investment budget
Map time components on the LM-Plot
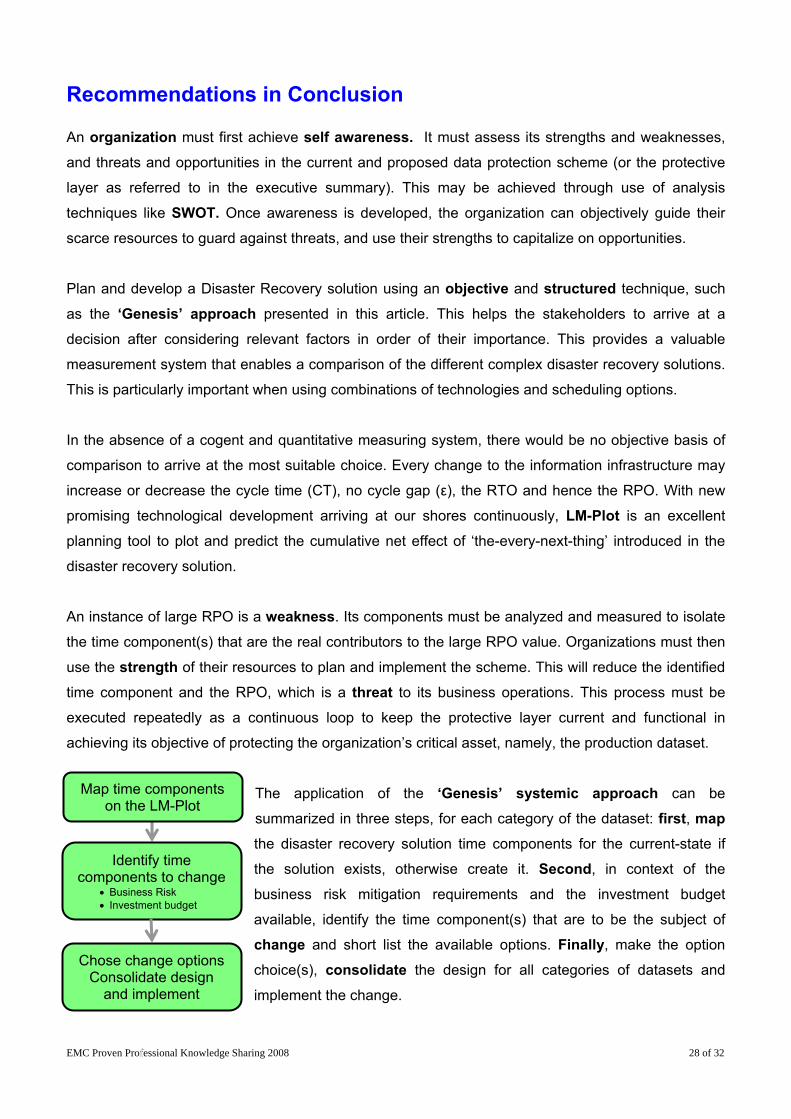
The application of the ‘Genesis’ systemic approach can be
summarized in three steps, for each category of the dataset: first, map
the disaster recovery solution time components for the current-state if
the solution exists, otherwise create it. Second, in context of the
business risk mitigation requirements and the investment budget
available, identify the time component(s) that are to be the subject of
change and short list the available options. Finally, make the option
choice(s), consolidate the design for all categories of datasets and
implement the change.

EMC Proven Professional Knowledge Sharing 2008 29 of 32
Assumptions, their Impact & Improvements Assumptions, their impact: This article assumes no change in the rate of incoming fresh production updates or rate at which
every fall-back dataset refresh process cycle progresses. In reality, this would not be the case. The
business activity always shows some daily, weekly and monthly patterns. The infrastructure
components used by the refresh process e.g. networks, are usually not dedicated, but are
increasingly shared between applications and processes whose demand on the infrastructure
component varies following different patterns. The introduction of a QOS feature in the components,
networks and systems can address this issue to a certain extent. The ultimate impact is that cycle
times will vary. As a result, the RPO value can vary beyond the fixed uniform sized saw-tooth shape
plotted on various LM-Plots (figure 6-to-9).
The article assumes that there is only one dataset in enterprises. In real-life, this will not be the case.
We have used this simplification to make the process easier to understand. There is no impact of this
assumption upon the working of the Genesis approach for real-life situations. The computing landscape of an enterprise in any industry sector is composed of multiple applications and datasets, logically and temporally dependent upon each other to support business activities. These
would fall into multiple categories based on the business functions they serve. Examples of these
classifications or categories are - critical, vital, important, non-critical et cetera (as also listed in the
‘Abstract’ section). Former dataset classification categories would have more stringent RPOs,
relaxing significantly as we move to the latter. The fall-back dataset of each of these categories have
to be created separately. A specific dataset may move from one category to another during its life
cycle. The recovery metric of these federated datasets of different categories should be planned
using the LM-Plot separately, but in co-ordination with and in view of each other. The overall
enterprise recovery metric will be same as that of the dataset with the greatest RPO.
This same concept can be extended at the sovereign or national level. Administrative planners may
create the blueprint for the recovery of a sovereign Nation’s information infrastructure in an event of
disaster, by defining a network of inter-dependent datasets required for the normal peacetime
functioning of the nation and its society e.g. datasets describing: sources and stocks of food and
medical supplies, security profiles, transportation and financial information etc. A sub-set of this may
be defined as the mini-network of designated essential services datasets, which must be made
available for functioning first during the crisis and for recovering from the disaster after it strikes. Plans
for disaster recovery solutions for these datasets must be put in place on the same lines as narrated
in the main sections of this article.
EMC Proven Professional Knowledge Sharing 2008 30 of 32
This article assumes that solutions are non-synchronous. That is, every single fresh update to the
production dataset is not automatically mirrored to the fall-back dataset before completing the update
to the production dataset. Such synchronous solutions are not the subject of this article. The dataset
RPO accomplished by such solutions is ‘Zero’.
It is assumed that for the class of solutions covered in this article, the freshly updated fall-back image
is not useable until the refresh process cycle is complete.
Improvements: This article considers only the build aspect of the disaster recovery solution as it discusses the case
scenarios and develops the re-shaped or transformed solutions for comparison. It does not touch
upon the operational aspect of the developed solutions. This is to retain the focus on the intricacies
of building the disaster recovery solution. From an operational perspective, some solutions may be
better, easier and cheaper than others to operate. An overall approach may result in the selection of a
different solution than the one discussed in this article. Researching an overall combined approach
would require more time, effort and experience.
The LM-Plot is an illustrative presentation and planning tool (figure 6-to-9) based on the simple
mathematical expressions generated from the model as explained in the ‘Assessing DR Solution
Capability’ section in this article. This tool can be automated into a simulation program using an
intuitive GUI (Graphical User Interface). It will prompt and guide the user to enter necessary and
available values to generate the current-state LM-Plot. The planner may then try ‘what-if’ scenarios by
tweaking components that make up the RPO metric, observing the change in the solution design
capability in the simulator, as shown in the transformed LM-Plot. This simulation program may even
contain a repository of options to alter the schedule and/or technologies. This allows you to observe
the combined effect of multiple changes upon disaster recovery capability.
A ‘Domino’ scenario involves more than one disruptive event happening one after another, i.e. progressively. After the first event, a state of disaster is declared and recovery is initiated. However,
before completion of the recovery, a second event disrupts the recovery causing it to fail. The second
event may be internal and related to the info-infrastructure, or external related to some other issue in
the organization or in its external environment. Protection from such events requires planning and
provisioning to another level of detail and investment. The cases and metrics presented in this article
detail protection from the first disruption event only. Treating the protection from domino events would
require more time, effort and experience.

EMC Proven Professional Knowledge Sharing 2008 31 of 32
We must enumerate the impact of foregoing provisioning for data protection and recovery. This
would convince the skeptics, and build a solid business case to estimate and make sufficient
provisions with confidence. It is a reasonable assumption that most of today’s businesses cannot
function without their computing facilities.
There are many approaches to achieve this, depending upon the type of business. The common
thread may to link the loss of availability of computing facility to the lost opportunity of clocking
business revenue or transactions. A Stock Exchange, for example, may consider the trading
volumes or the dollar worth of the transaction for a chosen unit of time e.g. a day. Then multiply this
by the business tolerable time of outage. A Wafer Fabrication plant may do the same in terms of
number of wafers produced per unit time. They may convert the opportunity lost to produce a certain
aggregate number of wafers to dollars based upon the market value of each wafer, to arrive at the
tolerable outage.
The aggregate dollar amount calculated would provide an idea of the reasonable amount that should
be invested in standing-up a DR solution. The capability of the DR solution proposed must be equal to or less then the tolerable outage estimated above.
Such estimates require more time, effort, experience and research than is available for this article. It
is therefore suggested as a future expansion or improvement to this article.
EMC Proven Professional Knowledge Sharing 2008 32 of 32
Author Biography Lalit Mohan is a Senior Solutions Architect at EMC Corporation since 1999. His current role
involves creating and architecting integrated data storage solutions to address client’s business
requirements. He manages these engagements and relationships with customers and partners to
implement these solutions, using industry standard project management methodologies.
He has spent the past 18 years in the IT industry, contributing in pre-sales consulting, management
and implementation roles for Enterprise Resource Planning and Engineering Automation software
solutions, and IT system integration projects, before dedicating to work in the area of IT data storage
for past 9 years. Prior to the IT industry he was employed in the automotive industry for 4 years, in
the productivity systems and vehicle research and development centers.
Mr. Mohan holds a Bachelor’s degree in Engineering with honors and a number of prestigious
certifications including: Project Management Institute (PMI) - PMP (Project Management
Professional); The Association of Operations Management (APICS) - CIRM (Certified in Integrated
Resource Management) and CPIM (Certified in Production and Inventory Management); and ITIL
Version 3 Foundation level certification. Additionally, he holds technical certifications from Microsoft
(MCSE – Windows2000 stream) and EMC Proven Professional Expert level certification in Business
Continuity - EMCTAe. He is an EMC Symmetrix® Performance Engineering Evaluation Database
(SPEED) ‘Guru’ community member since 2000. He has also qualified for the intermediate level Cost
Accounting certificate from the ICWAI (Institute of Cost & Works Accountants of India).