genetic characterization of brown bears of the kodiak archipelago
TRANSCRIPT

GENETIC CHARACTERIZATION OF BROWN BEARS OF THE KODIAK ARCHIPELAGO
Sandra L. Talbot1, Judy R. Gust1, George K. Sage1, Anthony Fischbach1, Kristin Amstrup1,
William Leacock2 and Larry Van Daele3
1U. S. Geological Survey, Alaska Science Center, 1011 East Tudor Road, MS 701, Anchorage, AK 99503
2 U. S. Fish and Wildlife Service, Yukon Delta National Wildlife Refuge, P.O. Box 346,
Bethel, AK 99559
3Alaska Department of Fish and Game, Division of Wildlife Conservation, 211 Mission Rd.,
Kodiak, AK 99615
Final Report To:
Kodiak National Wildlife Refuge
U. S. Fish and Wildlife Service
1390 Buskin River Road
Kodiak, Alaska 99615
2 February 2006
2
Table of Contents
Executive Summary 3 Technical Abstract 6 Materials and Methods 11
Sample Collection and Extraction 11 Genotyping and Sequencing 11 Linkage and Hardy Weinberg Equilibrium 12 Genetic Diversity 12 Genetic Differentiation 13 Population Relationships 13 Detection of Bottlenecks 13 Marker Resolution for Genetic Tagging Studies. 14 Population Demographics 14 Phylogeographic Analyses of MtDNA Sequence 14 Analysis of MHC DQB and DQA Sequences 15
Project Management and Acknowledgements 15 Results 16
Data Collection 16 Matching Samples 16 Linkage and Hardy Weinberg Equilibrium 16 Genetic Diversity 17 Sequence Diversity 17 Genetic Differentiation 17 Population Relationships 18 Contemporary and Historical Population Demographics 19 Marker Resolution for Genetic Tagging Studies 19 Phylogeographic Analyses 19 MHC DQA and DQB Analyses 20
Discussion 22 Genetic Diversity and Substructuring at Neutral DNA Markers 22 Phylogenetic Relationships 25 Major Histocompatibility Genes: DQB1 Exon 2 27
Conservation Implications 29 Literature Cited 32 Figure Legends 43
3
Executive Summary
Studies conducted during the last decade demonstrate that brown bears of the Aliulik Peninsula
on Kodiak Island exhibit the lowest levels of genetic diversity at nuclear microsatellite loci of
any brown bear population in North America. It is unclear whether the low levels of genetic
variation observed at these neutral nuclear markers in bears of the Aliulik Peninsula are
representative of Kodiak Island and the Kodiak Archipelago as a whole, and, if so, whether the
low genetic variation observed in the neutral markers reflects low variability in functional
markers involved in fitness. Furthermore, published and unpublished sequence data from the
cytochrome b gene and the control region of the maternally-inherited mitochondrial DNA
(mtDNA) from bears across a broader geographic region in the Kodiak Archipelago suggest that
levels of genetic variation at the mtDNA genome are higher than those reported from several
populations on mainland Alaska (the Kenai Peninsula and Izembek National Wildlife Refuge).
This study was initiated to address questions regarding levels of diversity in Kodiak Archipelago
populations at genetic markers that differ in mode of inheritance and rate of evolution, to provide
an improved basis for conservation of the Kodiak brown bear, and to respond to objectives of the
Kodiak National Wildlife Refuge to “...assess genetic diversity of the Kodiak brown bear so as to
understand gene flow between the southern and northern Archipelago, the vulnerability of
Kodiak brown bears to wildlife diseases, environmental stresses, and parameters of population
viability” (Kodiak NWR 2002 Draft Comprehensive Conservation Plan Revision, 2004).
We examined genetic characteristics of brown bears of Kodiak and Afognak Islands
using 14 variable nuclear microsatellite loci and nucleotide sequence information from the
hypervariable I domain of the mtDNA control region, across a broader geographic range than
previously studied. We also collected data from the class II DQA and DQB loci of the brown
bear major histocompatibility complex (MHC), to examine levels of variation at this important
immunology-mediating supergene. These data were evaluated to address the following
questions: 1) are earlier findings of extremely low levels of variation at nuclear microsatellite
loci representative of the Kodiak Archipelago populations as a whole? 2) Is the level and type of
variation at the maternally inherited mtDNA lower, or similar to, levels found in other
populations in Alaska? 3) Is there concordance between low levels of genetic variation observed

4
at neutral nuclear markers with levels of variation observed at functional genes? 4) What is the
connectivity between populations on Afognak and those on Kodiak Island? 5) Is there
population substructuring within Kodiak and Afognak islands? 6) What is the phylogeographic
relationship among bears of the Kodiak Archipelago and those on nearby mainland Alaska and
other western Beringian populations? 7) Do the genetic markers employed provide adequate
resolution to use in future genetic tagging studies?
The results of this research demonstrate that the earlier findings of extremely low levels
of genetic variation at neutral nuclear microsatellite markers in the Aliukik Peninsula are
representative of the Kodiak Archipelago as a whole. Comparative data from the class II exon 2
DQB of the MHC suggest the low levels of genetic variation observed at neutral nuclear markers
on the Kodiak Archipelago reflect low levels of variation at nuclear functional genes involved in
fitness. Higher levels of variation at the maternally-inherited mtDNA loci are observed within
the Kodiak Archipelago populations relative to some other Alaskan populations. However, the
type of site substitutions observed in mtDNA sequence data comprised largely of
insertions/deletions in “mutational hotspots”1 associated with the 5’ thymine repeat region.
Haplotypes defined using variation at this mutational hotspot appear to be geographically
segregated across the Kodiak Archipelago. This is similar to variation in maternal lineages
observed and used to examine microgeographic structuring resulting from female philopatry in
brown bear populations on the island of Hokkaido, Japan. Researchers suspect that the
Hokkaido population has been isolated from mainland populations since the end of the last
Pleistocene glaciation, approximately 12,000 BP. Our genetic evidence suggests a similar pattern
of colonization, establishment, and isolation, for brown bears of the Kodiak Archipelago.
Nevertheless, Kodiak Archipelago bears share closest evolutionary relationships with
populations in western Alaska, the Alaska Peninsula, and Siberia.
1“mutational hotspots” are sites that evolve at a rate much faster than average. There are several “hotspot” regions within the mitochondrial control region.
5
Despite evidence of substructuring2 of maternal lineages within the larger population on
Kodiak Island, genetic evidence from nuclear microsatellite loc suggests bears of Kodiak Island
comprise a single interbreeding population; the same is true for Afognak Island bears. This
pattern is consistent with female philopatry and largely male-mediated gene flow, even at the
microgeographic scale. However, gene flow between Kodiak and Afognak is small enough that
Afognak comprises a genetically distinguishable population. We found that the levels of genetic
diversity at loci adequate for use in genetic tagging in other populations of brown bears in Alaska
are insufficiently variable for similar use in Kodiak Archipelago populations. Furthermore, it is
unlikely that the use of additional variable genetic markers would improve resolution sufficient
to support a robust study of population estimation using genetic tagging. The most variable gene
known to occur in terrestrial vertebrates, the class II DQB1 exon 2 locus, is essentially
monomorphic within the archipelago’s two brown bear populations.
Low variation at the DQB1 exon 2 MHC class II locus, which plays an essential role in
the recognition of, and response to, parasites (bacterial, protozoan and other parasites and
pathogens), has been documented in other natural populations that have undergone recent
bottlenecks. However, genetic tests for recent (from 2 – 20 generations) bottlenecks in the
Kodiak Archipelago populations did not uncover a signature of a bottleneck in either the Kodiak
Island or Afognak populations. Other tests, however, suggest the Kodiak Archipelago
populations may be characterized by longer term (up to 100 generations) low effective
population size3.
Knowledge of the relationship between MHC variation and resistance to parasites in a
given individual, population or species is limited for brown bears. However, there are several
2substructuring here refers to a phenomenon whereby a population, by definition considered to be comprised of a single population of randomly interbreeding individuals, is actually comprised of two or more smaller “subpopulations” that are distinct. In this case, substructuring is observed within the female lineages on Kodiak Island, assessed using data from the maternally-inherited mitochondrial DNA.
3effective population size is the number of individuals in a population who contribute offspring to the next generation. In practice, effective population size is usually lower than the ecologically-observed population size.
6
well-documented cases in other species in which specific MHC haplotypes or genotypes confer
resistance to parasites. On the other hand, researchers have also documented cases in which
healthy natural populations are characterized by low genetic variability at MHC loci, so it is
unclear whether this finding of low variation at a MHC locus necessarily reflects an unhealthy
population. Presently, the archipelago’s bear populations appear healthy and viable; they show
no apparent genetic signature of inbreeding or phenotypic signs of inbreeding depression.
Nevertheless, continued vigilance may be warranted. Because Kodiak brown bears exhibit
extremely low variability at the MHC class II DQBI exon 2 gene, they may have reduced
capacity to thwart novel or introduced pathogens.
Technical Abstract In previous studies, bears of the Aliulik Peninsula on Kodiak Island were found to exhibit the
lowest levels of genetic diversity at neutral nuclear microsatellite loci of any brown bear
population in North America. It was unclear, however, whether the observed low genetic
diversity was representative of Kodiak Archipelago as a whole, and whether this low variation in
neutral markers would also be reflected in functional genes, specifically the immune-regulating
major histocompatibility complex (MHC). Levels of population substructuring within the
Archipelago are also unknown. We used three sets of genetic markers to characterize brown
bears of Kodiak and Afognak Islands of the Kodiak Archipelago: fragment analysis of 14
variable nuclear microsatellite loci, sequence from the nuclear class II exon 2 DQB1 of the
MHC (MHC DQB), and sequence from the mtDNA control region. Our data extend the earlier
finding of extremely low levels of genetic variation at neutral nuclear microsatellite markers in
the Aliulik Peninsula as being representative of the Kodiak Archipelago as a whole.
Comparative data from the nuclear functional gene involved in the immune response, MHC
DQB, corresponds with the low levels of genetic variation observed in neutral nuclear markers.
Divergence at the MHC DQB locus from mainland Alaskan bear populations also suggests that
7
Kodiak Archipelago bears have experienced different selection pressures since isolation. No
evidence of substructuring within the Kodiak or Afognak island populations was observed in the
nuclear loci. The two island populations, however, were found to be significantly differentiated
from each other based on variance of nuclear microsatellite allele and mtDNA control region
haplotype frequency. Variation observed at the maternally-inherited mitochondrial DNA
(mtDNA) control region is lower than many, but not all, populations of brown bears elsewhere in
Alaska. However, most of the observed variation in the Archipelago is found in “mutational
hotspots” which has likely arisen since the isolation of brown bears on Kodiak Island subsequent
to the recession of ice sheets at the end of the last Pleistocene glaciation. The variation in the
mtDNA control region appears to be useful in examining segregation of maternal lineages in the
Kodiak Island population. However, the low levels of variation observed at the nuclear markers
likely preclude their use as “genetic tags” for individual identification.
The Kodiak National Wildlife Refuge (Kodiak NWR) supports a large population of brown bears
(Ursus arctos L.), which are distributed throughout the Kodiak Archipelago, a group of islands
that lie at the western border of the Gulf of Alaska. Extrapolation from studies conducted from
five areas on Kodiak Island to comparable habitat suggest approximately 2,980 brown bears
inhabit the entire Archipelago, with densities averaging 0.24 bears/km2 (Alaska Department of
Fish and Game 2002). Highest densities occur at Karluk Lake in southwestern Kodiak Island
(0.42 bears/km2), and lowest on small, isolated islands (0.04 bears/km2) (Barnes and Smith
1998). Brown bears of the Kodiak Archipelago are generally recognized as an endemic
subspecies (U. a. middendorffi) based on morphological and ecological characteristics (Rausch
1963, Kurtén 1973, and Hall 1984). However, phylogenetic and phylogeographic analyses based
on extensive mitochondrial DNA (mtDNA) nucleotide sequence data (Talbot and Shields 1996a,
b; Waits et al. 1998) have not supported the status of these bears as a unique taxonomic unit
when placed within a comparative framework with other populations of brown bears in Alaska.
Nevertheless, because bears of the Kodiak Archipelago are morphologically unique, hold a
8
special symbolic value for the public, and because genetic studies of brown bears of the Aliulik
Peninsula, Kodiak Island (Paetkau et al. 1998b) have revealed the population on Kodiak has less
variability at neutral nuclear loci than mainland Alaskan populations, conservation efforts
continue to consider the Kodiak brown bear as a distinct subspecies or population of special
conservation value (Miller and Schoen 1999).
The Kodiak brown bear is thought to have been isolated from mainland brown bears for
approximately 12,000 years and has survived several periods of intense ecological disruption
during the EuroAmerican settlement period, including reduction in salmon food supply,
unregulated harvest, and commercial fur trade activities (Van Daele 2003). Isolation from other
brown bear populations on mainland Alaska, coupled with cyclic ecological disruption, may
have left the brown bears on Kodiak Island with low levels of genetic diversity. This is
supported by the observation that brown bears from the Aliulik Peninsula on Kodiak Island are
characterized by the lowest levels of genetic diversity at nuclear microsatellite loci recorded for
any brown bear population in North America (Paetkau et al. 1998b). However, preliminary
analysis of Kodiak brown bear mtDNA control region sequence information from across Kodiak
has uncovered higher haplotype diversity than found on the Kenai Peninsula (Talbot,
unpublished data; Jackson et al. 2005).
It is not known whether the populations inhabiting the Kodiak Archipelago are
genetically substructured, either within Kodiak Island, or between Kodiak Island and other
islands comprising the Archipelago, such as Afognak Island. Kodiak Island, encompassing an
area of 9,375 km2, affords high quality brown bear habitat. Inland habitat on Kodiak Island is
contiguous and mostly intact, human activity is generally restricted to isolated areas along the
coast, extent of roads is limited (< 160 km total); and bear conservation is a high priority (Alaska
Department of Fish and Game 2003). The only large-scale disruption to inland habitat,
development and operation of the Terror Lake hydroelectric project, minimally impacted bears
(Van Daele 2003).
Afognak Island, encompassing an area of 180 km2, apparently once supported an array of
non-forested habitats similar in composition to those found on Kodiak Island (Tae 1997).
However, habitat composition on Afognak has changed substantially since Sitkas (Picea
sitchensis) established there, probably about 1,000 years ago (Tae 1997). Presently about 48%
of the area of Afognak Island and 3% of the area of Kodiak Island are dominated by spruce
9
vegetation types (Fleming and Spencer 2004). In addition, during the past 25 years, Afognak
Island has experienced considerable habitat alteration as a result of commercial logging, mostly
on private forest lands outside of Refuge boundaries (USFWS 2004). Because monitoring the
bear population on Afognak is difficult, it is not known whether these practices have impacted
brown bear populations on the island. It is presumed that logging practices, thus far, have had
minimal adverse impact on brown bears, due to Afognak’s healthy salmon runs, good berry and
grass production, low levels of direct human-bear interaction and substantial limitations to access
of privately-owned logging roads (Alaska Department of Fish and Game 2002, Van Daele 2003).
Levels of gene flow between brown bear populations occupying the islands of the Kodiak
Archipelago are uncharacterized, and it is not clear whether the Afognak population receives
augmentation from Kodiak Island populations. The single genetic study including data from
brown bears of Afognak Island (Talbot and Shields 1996a) demonstrates these bears share
mitochondrial DNA cytochrome b haplotypes with bears of Kodiak Island. However, the
addition of nucleotide sequence information from the more variable mtDNA control region
collected from a small number of bears on Afognak Island (n = 6) afforded increased resolution
over cytochrome b sequences alone, and at least one unique haplotype has been observed on
Afognak Island (Talbot, unpublished data). It is unknown whether the low levels of genetic
diversity observed at nuclear microsatellite markers on the Aliulik Peninsula on Kodiak Island
(Paetkau et al. 1998b) are also characteristic of Afognak Island populations.
Restricted genetic diversity at neutral loci may reflect lower levels of diversity in the
population at functional loci and, therefore, decreased fitness (Hansson and Westerberg 2002).
This has raised concern over the Kodiak brown bear’s ability to resist novel pathogens and other
sources of environmental stress, such as habitat fragmentation, although the brown bear
population on the Kodiak Refuge is considered to be healthy and its habitat adequately protected
(USFWS 2004). Nevertheless, the presence of domestic cattle, small-scale livestock operations,
and game ranches in the Archipelago may increase the likelihood of exposure to novel epizootic
pathogens.
Currently, there are four major ranching operations on the Kodiak Archipelago. While
two of these raise cattle, the other two raise a combination of cattle and semi-domesticated game,
such as elk and bison. There are also numerous small-scale livestock operations run wholly on
rural private lands (Tom Lance, National Conservation Service, pers. comm. 29 Sept. 2005).
10
Most of these livestock and game operations are along the Kodiak Island road system, but at
least one is located on a remote island. Although statewide prohibitions forbid the importation of
new domestic elk, and although ongoing surveillance by Alaska Department of Fish and Game
personnel has uncovered no evidence for introduced diseases as a result of these domestic game
operations (ADF&G 2002), history has demonstrated that human protection against wildlife
epizootics is often unsuccessful without high levels of philosophical and economic commitment
(see Woodson and Rossiter 1994, Wobeser 2002 and references therein). It is, therefore, sensible
to assess the ability of the isolated brown bear populations on the Kodiak Archipelago to respond
to novel or introduced epizootics. Determining levels of genetic diversity at other neutral, as
well as functional, genes over a larger geographic range within the Kodiak Archipelago will
allow Refuge staff to apply appropriate management options and frame the appropriate level of
management concern.
The major histocompatibility complex (MHC) is a fundamental part of the immune
system in vertebrates (Edwards and Hedrick 1998). High variability in many MHC genes is
thought to play an essential role in the recognition of (and response to) parasites (viral, bacterial,
protozoan and other parasites and pathogens). Documenting the levels of MHC variation in
natural populations should provide insight into its potential resistance or susceptibility to various
parasites. Although demonstrating the connection between MHC variation and resistance to
parasites in a given population or species is difficult, there are several well-documented cases in
which specific MHC haplotypes or genotypes provide resistance to certain parasites (Briles et al.
1977, Hill et al. 1991, Xu et al. 1993, Thursz et al. 1997, Paterson et al. 1998, Carrington et al.
1999). One of the complications in demonstrating association between levels of variation and
susceptibility to disease is that the MHC is a multi-gene family, making it difficult to separate
the effects of specific alleles from the background genotypes, or even to determine which MHC
sequence is allelic and which are from other loci. Nevertheless, we have identified what we
believe are alleles of the class II DQB1 exon 2 MHC gene in Alaskan brown bears (Talbot,
unpublished data), a first step in testing such associations.
Here we examine genetic characteristics of brown bears of Kodiak and Afognak islands,
using 14 variable nuclear microsatellite loci and nucleotide sequence information including the
hypervariable domain I of the mtDNA control region (Wakely 1993). Because these markers, or
a subset of them, have been used to characterize brown bears of the Kenai Peninsula (Jackson et

11
al. 2005), Katmai National Park, Seward Peninsula, and nine other populations in Alaska
(Talbot, unpublished data), we compared levels of genetic diversity and relationships among
populations when possible. In addition, we obtained preliminary comparative information from
class II DQA and DQB genes of the brown bear MHC, to examine levels of variation at this
important immunology-mediating supergene. These data were used to answer the following
questions: 1) are earlier findings of extremely low levels of variability at nuclear (biparentally-
inherited) microsatellite loci from a small geographic area (Paetkau et al. 1998b) representative
of Kodiak Archipelago populations as a whole? 2) Is the level and type of variation at the
maternally-inherited mtDNA lower, or similar to, levels found in other populations in Alaska?
3) Is there concordance between low levels of genetic variation observed at neutral markers with
levels of variation observed at functional genes? 4) Is there population substructuring within
Kodiak and Afognak islands? 5) What is the connectivity between populations on Afognak
Island and Kodiak Island? 6) What are the phylogeographic relationships between bears of the
Kodiak Archipelago with brown bears on mainland Alaskan and other western Beringian
populations? We also test whether these markers will provide an appropriate baseline for
designing genetic tagging studies for use in future research and management activities, such as
mark-recapture efforts, on the Refuge.
Materials and Methods
Sample Collection and Extraction
Blood and tissue samples were collected from Kodiak Archipelago brown bears while they were handled during related
radio-telemetry studies, or from harvested bears, between 1991 and 2004. Blood samples were stored in whole blood
Vacutainer® tubes containing EDTA. A list of all samples and associated locale data are provided as Appendix 1; distribution of
samples are listed in Figure 1. Muscle and skin biopsies were kept frozen after sampling at –80º, and shipped on wet ice from
Kodiak, or from the University Alaska Museum (UAM) to the Molecular Ecology Laboratory (MEL) at the U. S. Geological
Survey Alaska Science Center. Tissue samples were extracted according to Medrano et al. (1990). Blood samples were
extracted using Epicentre® Masterpure™ DNA Purification Kit for Blood (Epicentre Cat. No. MG71100, Epicentre ®, Madison,
Wisconsin) spin-columns. Samples were diluted as appropriate to 50ng/µL concentration prior to further laboratory processing.
Genotyping and Sequencing
Primers targeting 14 variable nuclear microsatellite loci were selected from Ostrander et al. (1993), Taberlet et al.
(1997), and Paetkau et al. (1995, 1998a, b). Microsatellite loci were assayed using the multiplex polymerase chain reaction
(PCR) and fluorescently-labeled (IRD700 and IRD800) primers, using methods outlined in Jackson et al. (2005). Products were
visualized on a LI-COR Long ReadIR™ 4200 automated sequencer, using a 6% denaturing polyacrylamide gel. Individuals
representing each locus were compared to an M13 sequence ladder of known size, and to samples of known genotype obtained

12
from D. Paetkau (Wildlife Genetics International, British Columbia, Canada) to allow future calibration of datasets from different
laboratories. Samples sized against these standards were used in each subsequent gel as size standards. Negative controls were
included in all reactions for the detection of contamination, and 10% of all samples were re-extracted and reprocessed for quality
control. Microsatellite fragment data were analyzed using Gene ImageIR™ Data Analysis software (Scanalytics, Inc., Fairfax,
Virginia).
PCR primers specific to ursid mtDNA were used to amplify a target fragment including a portion of the cytochrome b
gene, the tRNAthr and tRNApro genes, and the hypervariable portion of the control region (Wakely 1993). The light-strand primer
L15774b (5′-GAA TTG GAG GAC AAC CAG T-3′) which anneals to the 3’ end of the ursid mtDNA cytochrome b gene, and
the heavy-strand primer anneals to the Conserved Sequence Block C of the ursid mtDNA control region (H00019: Talbot and
Shields 1996a). We used the primers DQBF (5’-GAT TTC GTG TAC CAG TTT AAG GGC-3’) and DQBR (5’-CCA CCT
CGT AGT TGT GTC TGC A-3’) to amplify a 241 base pair (bp) fragment of the putative MHC class II DQB1 exon 2. We used
the primers DQAF (5’-GAT GGA GAT GAG GWG TTT TAY GTG GA-3’) and DQAR (5’-CCA CRG WCA ACC GCA GGG
CAC A-3’) to amplify a 1121 bp fragment of the MHC class II DQA gene. Primers were synthesized with an added universal
M13F(-29) and M13Rev tail on the light and heavy strand primers, respectively. PCR products were electrophoresed in TBE
(89mM Tris, 89mM boric acid, 2mM EDTA) against a 100bp DNA ladder on a 1.0 1.5% agarose gel stained with ethidium
bromide, and visualized under ultraviolet light. PCR products were purified using Quantum Prep® PCR Kleen Spin Columns
(BIORAD: Hercules, California). Purified products were cycle-sequenced via simultaneous bidirectional sequencing (SBS: LI-
COR 1998) using a commercial kit (Sequitherm LCII 2.0®: Epicentre Technologies, Madison, Wisconsin). We used
fluorescently-labelled universal primers [LI-COR: M13F (-29) and M13Rev] to prime the SBS reaction. For quality control
purposes, DNA from 10 individuals representing each designated subpopulation were extracted, amplified and sequenced in
duplicate. MtDNA sequences were analyzed using LI-COR eSeq™ imaging software and aligned using AlignIR 2.0 ™ (LI-COR
Inc., Lincoln, Nebraska).
Linkage and Hardy Weinberg Equilibrium
We used Excel Microsatellite Toolkit (version 2.1, Park 2001) to prepare data for analysis. All microsatellite loci were
tested for gametic phase disequilibrium and for deviations from Hardy-Weinberg equilibrium (HWE) using the Fisher’s Exact
Test in GENEPOP 3.1 (Raymond and Rousset 1995). We set two a priori conditions for retention of loci for analysis: to
exclude one of any pair of loci found to be significantly linked, and to exclude any loci found to deviate from HWE from any
analyses requiring conformation to Hardy-Weinberg proportions.
Genetic Diversity
We estimated the mean observed heterozygosity (HO), expected heterozygosity (HE), mean number of alleles per locus,
and allele size variance using BIOSYS-L (Swofford and Selander 1981). Allelic richness (rg; El Mousadik and Petit 1996) was
estimated using FSTAT (ver 2.9.3, Goudet 1995, 2001). Estimates of HO and HE were used to generate the inbreeding coefficient
(F = 1 - [HO / HE]) combined across loci for each population (Wright 1951). Significance of F was tested as described in Li and
Horovitz (1953). Overall FIS (inbreeding coefficient) and significance of FIS was calculated using FSTAT. Average relatedness
and variance (Queller and Goodnight 1989) were estimated using Identix (Belkhir et al. 2002). MtDNA control region and MHC
DQA and DQB haplotypes were assigned based on at least a single nucleotide substitution or insertion/deletion (indel) found
within the segment sequenced. We used ARLEQUIN 2.0 (Schneider et al. 2000) to estimate haplotype (h) and nucleotide (π)
diversity (Nei 1987, Eq. 8.4 and 10.6, respectively) for mtDNA data.

13
Genetic Differentiation
Significance of spatial variation was assessed using F-statistics (Weir and Cockerham 1984). These measures can be
viewed simply as variance components that describe the apportionment of allelic variance among individuals within (FIS) and
among (FST) populations. Values of FST are summary statistics ranging essentially from 0 to 1 that describe the extent of spatial
variation among populations or population groups. A value of 1 at a specific locus would imply that all populations are fixed for
different alleles (i.e., the total variance at that locus is segregating among populations). A value of 0 implies all populations share
the same alleles in equal frequency (panmixia). Overall multilocus (microsatellite) estimates of FST variance, θ, were obtained
using FSTAT (Ver 2.9.3, Goudet 2001). Estimates of interpopulational variance (θ) were derived using the program ARLEQUIN
2.0 (Schneider et al. 2000). Significance of θ values were based on random permutation tests (n = 1,000), whereby alleles were
randomly permuted between two populations. A significant value of θ implies that a significant portion of the total genomic
variation across loci is partitioned among populations. We further examined substructuring of Kodiak Archipelago brown bear
populations using a Bayesian clustering approach (Structure 2.0: Pritchard et al. 2000) to estimate the likely number of
populations occurring on Kodiak and Afognak islands, both pooled and unpooled. We also tested for significance of
heterogeneity of microsatellite alleles between populations, as described in Raymond and Rousset (1995), using ARLEQUIN.
For significance testing, all α-values were set at 0.05 and, where appropriate, adjusted using Bonferroni procedures (Rice 1995).
Heterogeneity of mtDNA haplotypes between the Kodiak and Afognak populations was assessed using Monte Carlo re-
sampling of haplotype variation using REAP 4.0 (McElroy et al. 1991). We used the maximum likelihood criterion in Modeltest
3.06 (Posada and Crandall 1998) to determine the evolutionary model that best fit the sequence data. These distances were used
to calculate Φst (Excoffier et al. 1992), which tests for interpopulational variance at mtDNA loci, and tested for significance using
ARLEQUIN 2.0 (Schneider et al. 2000).
Population Relationships
We used allele frequencies at microsatellite loci to calculate Cavalli-Sforza and Edwards (1967) chord distances among
populations and constructed multi-locus population neighbor-joining tree bootstrapped trees (3000 replicates) using the program
NJBP2 (J.R. Cornuet, INRA, Laboratoire de Neurobiologie Comparée des Invertébrés, Bures-sur Yvette, France). This distance
method produces robust tree topologies for groups separated for time periods comparable to the brown bear populations
(Takezaki and Nei 1996). We also determined population relationships based on mtDNA control region data by constructing
neighbor-joining population trees using coancestry coefficient distances (Reynolds et al. 1983) using ARLEQUIN and MEGA
2.0 (Kumar et al. 2001). For the microsatellite population tree we included data from Afognak and Kodiak islands, Katmai
National Park and Kamchatka, Russia, with preliminary data from 16 individual bears from southcentral Alaska added for
comparative purposes. For the mtDNA population tree, we include data from 6 other populations in interior and western Alaska,
and from Kamchatka.
Detection of Bottlenecks
We used BOTTLENECK 1.0 (Piry et al. 1999) to perform the Wilcoxon test to detect excess heterozygosity of
polymorphic microsatellite loci resulting from a recent bottleneck (Nei et al. 1975, Cornuet and Luikart 1996). Tests were
conducted under the infinite alleles model (IAM: Ohta and Kimura 1973, Maruyama and Fuerst 1985), the stepwise mutation
model (SMM: Freimer and Slatkin 1996), and the two-phase model (TPM: Di Rienzo et al. 1994) of microsatellite mutation.
These models span the range of mutational models hypothesized to operate on microsatellite loci. Parameters for the TPM were
set at 88% SMM with a variance of 9 (Piry et al. 1999, Garza and Williamson 2001).
We also used the program AGARst (Harley 2002) to determine M, the mean ratio of number of alleles to total range in
allele size (Garza and Williamson 2001). Unlike heterozygosity excess (Cornuet and Liukart 1996), M can detect reductions
14
within populations that occurred more historically (over 100 generations past; Garza and Williamson 2001). We used
Critical_M.exe (http://santacruz.nmfs.noaa.gov/staff/carlos_garza/software.php) to infer critical M values (MC), which were
calculated using pre-bottleneck effective population sizes (Ne) of 50 to 1500 for KOD, and 25 to 250 for AFOG. These were
determined as in Allendorf et al. (1991), who recommended that pre-bottleneck effective population sizes be one quarter the high
and low estimates of actual population size. We used a constant mutation rate (μ = 5 X 10⁻⁴ locus/year), and the TPM model
whereby 88% of mutations are single-step changes and the average size of all other mutations is 3.5 repeats.
Marker Resolution for Genetic Tagging Studies.
We used the statistical program, GIMLET 1.3.2 (Valieré 2002), to generate P(IDobs) and P(IDsib) values to determine
whether the microsatellite markers are sufficiently variable to allow for use in individual identification in genetic tagging studies.
P(IDobs) is the probability at which another individual with the same genotype would be observed, given the sample frequency of
the alleles observed at those loci, within the population. P(IDsib) estimates the probability of observing identical multilocus
genotypes between two individuals sampled from a population comprised of first-order relatives (e.g., between siblings or parent-
offspring). General guidelines for genetic tagging studies suggest using a suite of markers that achieve a reasonably low P(ID)
bounded between 0.01 and 0.0001; P(IDsib) provides a conservative upper bound on this estimate (Waits et al. 2001).
Population Demographics
Evidence of population expansion was tested using multiple methods for mtDNA data. Rapid population expansion
leads to low levels of diversity among haplotypes over large areas (Hewitt 1996), producing basal polytomy or star-like
phylogenies (Avise 2000). Fu’s FS values test for neutrality of the data, and also may indicate groups that have recently
expanded (Fu 1997). Negative Fu’s FS values suggest population expansion. We used ARLEQUIN to estimate haplotype and
nucleotide diversities. Haplotypic diversity (h) is the probability that two randomly chosen haplotypes differ (Schneider et al.
2000) and varies from 0 to 1 (Grant and Bowen 1998). Nucleotide diversity (л) is the probability that two randomly chosen
homologous nucleotides are different (Schneider et al. 2000) and varies from 0, for no divergence, to over 0.10 for deep
divergences (Grant and Bowen 1998). Thus, high h and low л indicate an excess of different haplotypes with minimal variation,
and suggest a rapidly expanding population (Avise 2000).
Phylogeographic Analyses of MtDNA Sequence
Phylogenetic analyses of control region sequences were conducted using PAUP*4.0b8 (Swofford 2000), using
maximum likelihood (ML) and distance (minimum evolution, ME). The simplest evolutionary model of DNA substitution that
was significantly better than less complex models, was determined using the hierarchical nested likelihood ratio tests
implemented in MODELTEST version 3.06 (Posada and Crandall 1998) to be HKY+I+G (Hasegawa et al. 1985), incorporating a
gamma distribution shape parameter of 0.4796. For this model, the transition to transversion ratio was estimated at 31.404. We
thus weighted tranversions 31:1 over transitions in subsequent analyses where appropriate. The HKY+I+G model was used in
maximum likelihood and maximum likelihood distance tree reconstructions. Heuristic tree searches were conducted for each
analysis, with 20 and 100 random additions of taxa for maximum likelihood and parsimony analyses, respectively, each followed
by tree bisection-reconnection topological rearrangements. Robustness of nodes was assessed using tree reconstructions of
bootstrap-resampled data sets for 1,000 replicates under distance and parsimony criteria, and 200 replicates for ML criteria.
Phylogenetic comparisons were made using a dataset comprised of haplotypes observed among 14 populations of brown bears in
Alaska as well as those observed in 6 bears of Kamchatka and elsewhere in eastern Siberia (Talbot, unpublished data; Leacock,
unpublished data).

15
Analysis of MHC DQB and DQA Sequences
Our first concern with the MHC loci was to correctly identify the MHC genes, since these genes occur as families and
varying levels of multiformity has been observed (Bowen et al. 2004). Once identified, we then compared levels of genetic
diversity (in terms of number of observed alleles) at the identified locus between populations inhabiting the Kodiak Archipelago,
and those of a less isolated population (KAT), to determine if the low level of genetic diversity at neutral genetic markers is also
reflected in the MHC loci. To identify the genes, we used FUGUE (Shi et al. 2001) and BLAST (Altschul et al. 1997) analyses
to compare sequences we obtained from the putative MHC genes with homologous sequences already identified for other species
and available on public databases. All sequences were aligned with MHC DQB or DRB sequences from elephant seal (Zalophus
californianus; Bowen et al. 2002), wolf (Canis lupus; Seddon and Ellegren 2002), human (Homo sapiens; Apple et al. 1993,
Kimura, unpublished data) and polar bear (Ursus maritimus, Wei and Happ, unpublished data) and translated into corresponding
amino acid sequences using MEGA (Ver. 2.0, Kumar et al. 2001). Amino acid positions involved in peptide binding were
identified by comparison with the peptide binding groove structure of the human class II molecule (Brown et al. 1993). Relative
frequencies of nonsynonymous (dN) and synonymous (dS) substitutions were calculated for the peptide binding region, the non-
peptide-binding region, and the entire sequence according to Nei and Gojobori (1986) using the Jukes-Cantor (1969) correction.
All dN and dS frequencies and standard errors were estimated using MEGA. Genetic distance matrices were estimated using the
Kimura 2-parameter model (Kimura 1980). Phylogenetic relationships among alleles were estimated using minimum evolution
(neighbor-joining) methods, using MEGA.
Project Management and Acknowledgements
Study concept and design was performed by T. Fischbach, L. Van Daele and S. Talbot. The bulk
of the laboratory work was conducted by G. K. Sage, J. R. Gust, K. Amstrup and S. L. Talbot.
G. K. Sage, J. R. Gust and S. L. Talbot processed and proofed genetic data. All laboratory
analyses were conducted at the Alaska Science Center’s (ASC) Molecular Ecology Laboratory
(MEL) in Anchorage, Alaska. Data analyses were conducted by S. Talbot, G. K. Sage and J.
Gust. Sample acquisition was performed by L. Van Daele and T. Fischbach for Kodiak
Archipelago bears, with additional samples provided by the ASC from archived specimens.
Nucleotide sequence data from brown bears from other populations (Alaska, Siberia and Turkey)
were provided by S. Talbot; data from Kamchatka brown bears were collected from samples
funded by field work of W. Leacock as part of his Ph. D. dissertation research. A portion of the
microsatellite data from Kamchatka was collected by J. Jackson and G. Petersen, ASC.
Microsatellite data from Katmai National Park were provided in part by K. Scribner (ASC,
MSU) and S. Talbot. Curation of Kodiak Archipelago samples was provided by T. Fischbach
and J. Gust. Critical reviews and comments of analyses were contributed by J. Pearce, D.
Derksen, and B. Pyle. We thank the University of Alaska Museum, as well as numerous staff
members of the U. S. Fish and Wildlife Service and the Alaska Department of Fish and Game,
16
for providing samples. Financial support for analyses was provided by U. S. Fish and Wildlife
Service, Kodiak National Wildlife Refuge, the U. S. Geological Survey Alaska Science Center,
and the Alaska Department of Fish and Game.
Results
Data Collection
We obtained data from brown bears of Afognak Island (AFOG; n = 29), and Kodiak
Island (KOD; n = 218). General sample locations are given in Figure 1. Data include 1)
fragment analysis of 14 microsatellite loci, 2) nucleotide sequence data from 589 – 592 base pair
(bp) segment of mtDNA (comprising 106 bp of the cytochrome b gene, 70 bp of the tRNA-thr,
65 bp of the tRNA-pro, and 348-351 bp of the hypervariable portion of the control region, 3) a
228 bp segment from the putative ursid MHC class II DQB1 gene, and 4) a 1194 bp segment
from the putative ursid MHC DQA1 gene. For comparative purposes, we include allele and
haplotype frequency data from brown bears from Katmai National Park, Alaska (KAT; n = 29 -
41) and Kamchakta, Russia (KAM, n = 11), and phylogeographic comparison involving 358
brown bears from among 14 populations in Alaska, two populations in Russia, and from Turkey
(Talbot, unpublished data; Leacock, unpublished data).
Matching Samples
Among the 218 individuals from KOD, 14 bears involved in 9 pair-wise comparisons
possessed identical genotypes at all 12 polymorphic loci (Appendix 2). One of each pair was
eliminated from further analysis. Thus, 209 brown bears from KOD were included in all
subsequent analyses of microsatellite data. No individuals from AFOG shared multilocus
genotypes.
Linkage and Hardy Weinberg Equilibrium
The KOD population exhibited significant deviations from HWE at three loci (G1A, p =
0.008; G10J, p = 0.049; UARμ50, p = 0.029; α = 0.050; Table 1), due to heterozygote deficit.
AFOG exhibited no deviations from HWE at any locus. Two loci were monomorphic in both
AFOG and KOD (G10H, G10M; Table 1). After excluding these 5 loci, we found no significant
17
linkage disequilibrium among loci in either population. The three loci found to deviate from
HWE were excluded from any analysis that depends upon Hardy-Weinberg proportions.
Because we present levels of polymorphism as one type of genetic diversity, we calculated
comparative genetic diversity indices using all 14 loci.
Genetic Diversity
Levels of genetic diversity at 14 microsatellite loci for bears of the Kodiak Archipelago,
KAT and KAM are given in Table 1. Genetic diversity values (polymorphism, heterozygosity
and allelic richness) in Kodiak Archipelago populations were substantially lower than values
observed in KAT and KAM (Table 2). HO for brown bears on AFOG was 0.259 (SE = 0.049);
HE was 0.270 (SE = 0.050). Overall HO for KOD was 0.263 (SE = 0.058); HE was 0.280 (SE =
0.062) (Tables 1 and 2). Allelic richness was 2.01 and 2.26 for AFOG and KOD, respectively.
The mean inbreeding coefficient was not significantly different from zero (F = 0.041 – 0.061; χ 2.
< 3.84, df = 1) for KOD and AFOG (Table 2), and FIS was not significantly different from zero
(FIS = -0.021 and 0.040; p >0.05, Bonferroni correction applied). Average relatedness was
similar across populations; variance was highest for AFOG (Table 2).
Sequence Diversity
Seven mtDNA control region haplotypes were identified among 124 Kodiak brown
bears; one haplotype was observed among 28 bears from AFOG (Table 2, 3). Four haplotypes
occurring on KOD were unique (private haplotypes); one haplotype was shared by AFOG (and
one with Magadan, Russia), and one haplotype was also observed in seven other populations in
Alaska (see Figure 2 and associated legends). Fifteen polymorphic sites, including 5
insertions/deletions (indels) and 10 transitions, separated the haplotypes (Table 3). Haplotype
(h) and nucleotide diversity (π) was lowest in AFOG (Table 2). In AFOG, Fu’s FS was positive
(not significant), and Tajima’s D was not significantly different from zero; Fu’s FS and Tajima’s
D were both for negative for KOD and significantly different from zero (Table 2).
Genetic Differentiation
STRUCTURE analysis detected only one population each in AFOG (ln Pr( X | K ) = -
360.1; log P = 0.634; based on 12 loci), and KOD (ln Pr( X | K ) =-2253.3; log P = 0.208; based
18
on 9 loci). When AFOG and KOD were pooled under an admixture model, STRUCTURE
detected two populations (ln Pr( X | K ) = -2338.9, log P = 0.9866). These results are consistent
with lack of sub-structuring within KOD and AFOG. Analysis of variance indicated that > 99%
of variation at microsatellite loci occurred among individuals within both KOD, and AFOG (data
not shown). Pairwise θ values between AFOG and KOD were significantly different from zero
(θ = 0.116, p = 0.000 ± 0.000; Table 4). However, pairwise ρ values were not significantly
different between AFOG and KOD (ρ = 0.038 ± -0.0072 p = 0.045, α = 0.005). Analysis of
mtDNA sequence data, using Modeltest 3.06 (Posada and Crandall 1998) suggested the best
evolutionary model fit to the data was the HKY+I(0.7107)+Γ(0.4796) model (Hasegawa et al. 1985);
this model was used to generate pairwise distances used in AMOVA analysis (see below). We
detected significant difference between AFOG and KOD in the distribution of mtDNA
haplotypes using Monte Carlo simulation (p = 0.000 ± 0.000), and when FST values were based
on frequency alone (FST = 0.307, p = 0.000 ± 0.000), but not in the variance in haplotype
frequency when a model of evolution was invoked (ΦST = -0.012; p = 0.559 ± 0.0158; Table 4).
Both AFOG and KOD were significantly differentiated from KAT and KAM at both
microsatellite loci and mtDNA (Table 4). Expanded analyses including comparison of mtDNA
variance in haplotype frequency involving pair-wise comparisons among 14 populations of
brown bears in Alaska, and KAM, demonstrated that both KOD and AFOG are significantly
differentiated from all other populations assayed in Alaska (data not shown).
Population Relationships
The neighbor-joining tree based on overall genetic similarities among populations,
calculated using Cavalli-Sforza and Edwards (1967) chord distances for microsatellite data,
placed AFOG and KOD together with high bootstrap support (100%, see Figure 3), clustering
away from KAT and south central Alaska (SCEN); the latter were also placed together with high
bootstrap support. KAM clustered together with KAT and SCEN, away from KOD and AFOG,
but without bootstrap support (Figure 3). A similar topology was obtained using net shared
alleles (data not shown). The neighbor joining tree based on the coancestry coefficient
(Reynolds et al. 1983) from the mtDNA control region data placed Seward Peninsula (SPEN)
together with AFOG (Figure 4), both clustered with KOD.
19
Contemporary and Historical Population Demographics
There was no evidence of significant heterozygosity excess, expected in the case of a
recent contemporary bottleneck (within the past two to 20 generations; G. Luikart, pers. comm.),
on either KOD or AFOG using the Wilcoxon one-tailed test under any of the models of
evolution, after the application of Bonferroni corrections (p > 0.005, Table 5). A significant
deficit of heterozygosity was observed in KOD under the SMM using the Wilcoxon one-tailed
test for heterozygosity deficit (p = 0.003, Table 5). Values of M for both AFOG and KOD
(0.375 and 0.600, respectively) were significantly lower than the calculated range of critical
values (MC = 0.650 – 0.739, depending upon estimated theta values of 3 to 0.05). Locus G10D
(Paetkau 1998a, b) was excluded from the calculation of M, due to the presence of a single base
pair difference in allele size.
Negative Fu’s FS values (Table 2) were obtained for all populations except AFOG. For
KOD in particular, these values corroborate haplotypes and nucleotide diversity values and the
star-like topology of the phylogenetic trees (see results in Phylogeographics Analyses section
below), suggesting rapid historical (post-Pleistocene) population expansion.
Marker Resolution for Genetic Tagging Studies
Probability of identity values for AFOG and KOD are given in Table 6. A 12-locus
genotype appears adequate to distinguish an individual from among 4184 individuals on AFOG
(P(IDobs) = 0.000239; P(IDsib) = 0.020422), and among 5649 individuals on KOD (P(IDobs) =
0.000177; P(IDsib) = 0.015098). Nevertheless, match statistics (Appendix 2) suggested these 12
loci were not able to distinguish among 14 individual brown bears on KOD. P(IDobs) and P(IDsib)
values are larger within both AFOG and KOD than recommended by Waits et al. (2001).
Comparative data from KAT suggest the same 12-locus suite is adequate to distinguish an
individual among 294,550 first order relatives (P(IDsib) = 0.00000339; data not shown).
Phylogeographic Analyses
Similar to results shown in earlier research that compared nucleotide sequence
information from the brown bear cytochrome b and two tRNA genes (Talbot and Shields 1996a),
our mtDNA control region data show that brown bears in Alaska fall into three distinct clusters:
1) a “western Beringian” cluster, corresponding to Clade III of Talbot and Shields, 1996a); 2) an
20
“eastern Beringian” cluster, corresponding to Clade II of Talbot and Shields 1996a), and a cluster
comprised of individuals inhabiting the islands of the Alexander Archipelago, corresponding to
Clade I, Talbot and Shields 1996 (Figure 2a, b). Bears of the Kodiak Archipelago fall clearly
within the “western Beringian” cluster, in an unresolved, star-like phylogeny (Figure 2b).
Haplotypes found in the Kodiak Archiplelago cluster more closely with haplotypes from SPEN
and Brooks Range (BR) than the Alaska Peninsula [KAT, Izembek NWR (IZE)] or KAM.
Nevertheless, bootstrap support for the placement of SPEN and BR close to haplotypes in the
Kodiak Archipelago is not high (Figure 2a).
MHC DQA and DQB Analyses
Initial screening of 1194 bp of the DQA gene uncovered four DQA haplotypes among six
individual bears from three different populations in south central Alaska and the Kodiak
Archipelago (SCEN, n = 3; KAT, n = 1; KOD, n = 3). Similar screening of 228 bp of DQB gene
uncovered 11 haplotypes among 13 bears screened from Alaska (SCEN, n = 2, KAT, n = 4,
KOD, n = 2, KEN, n = 3, SEAK, n = 2; data not shown). Due to overall lower levels of
haplotypic and nucleotide diversity among brown bears of Alaska at the larger DQA locus
relative to the DQB locus (data not shown), we dropped this locus from further consideration and
concentrated on obtaining data at the more variable DQB locus. Variation at the DQA locus is
shown in Appendix 3.
Ten different sequences (alleles) were observed among the 80 bears typed among KOD,
AFOG and KAT at the DQB locus (Table 7). BLAST (Altschul et al. 1997) and FUGUE
(V2.s.07, Shi et al. 2001) analyses suggest the ten sequences obtained from brown bears in
Alaska are homologous with the MHC class II DQB1 exon 2 sequences (Z-score 9.17 to 23.41,
p < 0.01) from humans and mice (Mus musculus). We illustrate this in an alignment comparing
the DNA sequences of all 10 DQB alleles and five outgroup sequences (Figure 5) and an
alignment of translated sequences using the same outgroups (Figure 6). We observed no indels,
and no stop codons (indicative of pseudogenes of DQB1 exon 2, Bowen et al. 2002). The amino
acid alignment illustrates the conservation of motifs between brown bear, gray wolf, elephant
seal, and human DQB1 exon 2 sequences that are not shared with human DQB2 sequences or
sequence from the polar bear MHC DRB gene. This, and the finding that multiple amplification
of the same individuals never revealed more than the observed sequences (data not shown),
21
suggest we were successful at amplifying a single locus from the brown bear and that the
amplified locus is homologous to the human leucocyte antigen and the dog leucocyte antigen
(DLA) DQB1 exon 2 locus.
Polymorphisms at MHC class II loci, including DQBI, occur predominantly in exon 2,
which codes for a majority of the peptide binding region (PBR). The exon translates into a
sequence length of 83 amino acids with 16 possible amino acid binding sites (ABS) for
presentation to foreign peptides (Brown et al. 1993). Here we have information from 228 base
pairs that code for 76 amino acids for the U. arctos DQB1 exon 2 gene (UrarDQB1; Figure 5
and Figure 6) with 15 possible ABSs. Seventeen polymorphic sites, including 7 transitions and
10 transversions, were observed among all brown bears sequences (Figure 5). Only two of the
17 site substitutions were synonymous (e.g. did not result in a change of amino acid), neither of
which are at putative ABSs (Figure 6); the remainder of variable sites resulted in
nonsynonymous substitutions (Figure 6). In an alignment of the 76 inferred exon amino acid
sequences obtained for UrarDQB1, we found that the majority (67%) of amino acid changes (at
residues 21, 23, 30, 54, 60 and 67) were at putative ABSs (Figure 6). In the total sequence
examined, there were 15 positions that were ABS and 61 that were non-ABS.
The relative frequency of non-synonymous substitutions (dN = 0.084, SE = 0.000) was
larger than the frequency of synonymous substitutions (dS = 0.000, SE = 0.000) in the ABS for
all alleles, with a dN/dS ratio greater than one. This suggests selection for diversity (balancing
selection) in these positions (Tamura and Nei 1989). In the non-ABS region, non-synonymous
substitution occurred less frequently (dN = 0.018, SE = 0.008) than synonynous substitutions (dS
= 0.024, SE = 0.013); the dN/dS ratio is less than unity for the non-ABS region.
One of the 10 sequences typed was observed in AFOG; this same sequence type (allele)
was found in 31 of the 32 bears typed from KOD (Table 7). The substitutions observed between
the two sequences found on KOD were non-ABS, but were non-synonymous changes. Eight of
the 10 sequences were observed in bears of KAT (Table 7). We observed little evidence of
heterozygous individuals (single individuals with more than one allele at this locus) within
Kodiak Archipelago brown bears, which would have been detectable as comigration of
fragments terminated at more than one base. However, there was evidence of heterozygosity
within KAT (data not shown). The ability to discern the level of heterozygosity within the KAT
populations will require additional development.
22
A neighbor-joining tree for the 10 UrarDQB1 nucleotide sequences was constructed
using outgroup sequences derived from human, elephant seal, dog, and polar bear. Genetic
distances were estimated using the Tamura-Nei (Tamura and Nei 1993) and Kimura 2-parameter
(Kimura 1980) distance model. Both distance models produced strongly supported trees of equal
topology, revealing 2 evolutionary lineages; Figure 7 shows Tamura-Nei distances. Within
lineage I, the two alleles found within the Kodiak Archipelago cluster closely together, away
from alleles found in bears from KAT, while lineage II comprises UrarDQB1*004 and
UrarDQB1*007. The neighbor joining tree suggests the alleles from the Kodiak Archipelago
(UrarDQB1*001 and UraDQB1*002), which cluster together with 75% bootstrap support, are
recently derived. Other nodes also show high bootstrap support, but in general the topology
within lineage I is shallow.
Discussion
Genetic Diversity and Substructuring at Neutral DNA Markers
Our microsatellite data based on larger geographic coverage across Kodiak Island and
increased sample sizes confirm earlier findings of low levels of genetic variation in Kodiak
brown bear based on similar data from brown bears from the Aliulik Peninsula of Kodiak Island
alone (Paetkau et al. 1998b). This pattern of low genetic variation is also evident within AFOG.
We found little statistical evidence of substructuring within KOD or AFOG, based on nuclear
microsatellite loci. Nevertheless, we found significant spatial differentiation between KOD and
AFOG at both nuclear microsatellite and mtDNA loci, when analyses of variance consider allele
or haplotype frequencies only (without incorporating a model of evolution). This finding
suggests that the two populations within the Archipelago are evolutionarily recently diverged but
not sufficiently connected via recent gene flow to maintain panmixia. This is surprising, given
the small distances between the two islands and the demonstrated ability of brown bears to swim
across large bodies of water (see discussion in Paetkau 1998a). Analyses of molecular variance
(e.g. when considering a model of evolution in addition to frequency of alleles) failed to reject
the null hypothesis of panmixia. If these two populations are more subject to drift and migration
(e.g., the populations are very recently diverged and differentiation, while significant, is still
shallow), then FST-based tests are more appropriate than tests invoking a model of evolution
23
(Slatkin 1995), such as R-statistics for microsatellite loci and ΦST values for mitochondrial DNA
which incorporate a model of evolution.
Levels of genetic variation at the mtDNA in KOD are higher than on AFOG. We
observed seven mtDNA control region haplotypes on KOD among 124 bears, and one on AFOG
(among 28 bears). Fewer haplotypes were observed on KOD (and AFOG) than on KAT, where
nine haplotypes were observed among 41 bears. However, it is also important to distinguish the
type of variation that differentiates haplotypes within the Kodiak Archipelago and that observed
on the mainland population of KAT and elsewhere in Alaska. Haplotypes (and thus haplotype
diversity) are defined based on a single site difference, and such differences can include indels as
well as site substitutions (transitions and tranversions). However, not all site differences are
equally likely to occur. Among the site changes observed among the seven haplotypes typed in
bears on the Kodiak Archipelago, only two (UARCR30 and UARCR33) involved site
substitutions (transitions); the remainder of the differences occurred as differences in the number
of thymine (Tn) repeats at the 5’ end of the control region (indels). Conversely, eight of the nine
haplotypes observed among KAT bears, and all four of the haplotypes found in KAM, were
defined by both transition substitutions and Tn repeats.
Variation in the Tn repeat number at the 5’ end of the brown bear control region likely
occurs through DNA replication slippage in cells similar to the type explaining mutation at
microsatellite loci (Levinson and Gutman 1987, Hancock 1999). Such hypervariable sites within
the control region are considered “mutational hotspots”, or nucleotide sites that evolve at a rate
much faster rate than average (Stoneking 2000). This type of variation has been observed in
control region sequences of bears in all other populations in Alaska (except on the Kenai
Peninsula; S. Talbot, unpublished data; Jackson et al. 2005). Mutations at the Tn repeat region
within brown bears may occur more frequently than site substitutions (Matsuhashi et al. 1999),
and thus haplotype diversity values based on differences at this site may be biased upward,
resulting in misleading levels of comparative haplotypic diversity. It is possible that variation
observed at the Tn repeat in Kodiak bears may be the result of mutation occurring subsequent to
the immigration and isolation of brown bears (possessing different lineages) on the Kodiak
Archipelago. This scenario has been proposed for bears of Hokkaido, Japan (Matsuhashi et al.
1999), which, like Kodiak Island, are thought to have been isolated from mainland populations
for about 12,000 years.
24
In addition to the Tn repeats at the 5’ end of the control region, we have also observed 10
bp repeat arrays (SLT, unpublished data) at the 3’ end of the control region in Alaskan brown
bears. Such repeats, found in other mammals (Hayasaka et al. 1991, Wilkinson and Chapman
1991, Hoelzel 1994, Casane et al. 1997, Lunt et al. 1998), were reported for Hokkaido bears
(Matsuhashi et al. 1999) and used to understand post-immigration relationships of bears of
Hokkaido. In bears of KOD, this repeat array includes an 11 bp motif, ACGTACGCATA, that
repeats approximately 29 times (S. Talbot, unpublished data). This region may be useful in
assessing microgeographic variation within subpopulations of brown bears on Kodiak, since this
array, like the 5’ Tn repeat array, may be more likely to occur than site substitutions (Matsuhashi
et al. 1999). However, the 3’ repeat arrays show heteroplasmy (more than one copy within an
individual) in some individuals within populations in Alaska (SLT, data not shown) and
Hokkaido (Matsuhashi et al. 1999), perhaps due to natural DNA replication errors, or to artificial
slippage via PCR (Madsen et al. 1993). Conversely, heteroplasmy was not observed at the 5’ Tn
repeat array. Duplicate PCR amplification and sequencing, including use of different sequencing
platforms and protocols, yielded identical 5’ Tn repeat arrays for the same individual, suggesting
little or no heteroplasmy at this repeat. We suggest the 5’ sequence patterns observed within
KOD and AFOG may provide a more useful tool for investigating microgeographic population
structure as well as potentially providing an additional marker for individual identification, since
low P(IDobs) values for 14 microsatellite loci for KOD and AFOG suggest additional markers
would be required for genetic tagging studies.
For example, in the brown bear population on Hokkaido, different mtDNA lineages based
on these 5’ (Tn) and 3’ repeat arrays were found to be geographically segregated. This may be
due to female philopatry and the tendency of dispersing females to establish territories adjacent
to their mothers (Rogers 1987, Schwartz and Franzmann 1992, Craighead et al. 1998). Although
STRUCTURE analysis failed to uncover substructuring within KOD or AFOG based on nuclear
microsatellite data, an obvious next step in the research is to plot female haplotypes across the
landscape and determine whether substructuring occurs at the mtDNA. An initial exploration of
our control region data suggests substructuring does occur at mtDNA; simply mapping mtDNA
haplotype frequencies (for females only) across the archipelago suggests that mtDNA lineages
are arranged non-randomly, and indeed appear to be geographically segregated (Figure 8).
Again, this pattern, coupled with the lack of substructuring observed at nuclear microsatellite
25
data, is consistent with the tendency of young female brown bears to settle in home ranges closer
to their mother’s home ranges (female philopatry), and of males to disperse farther, leading to
largely male-mediated gene flow. It is of interest that the haplotype observed on Afognak
(UarCR30) is observed at highest frequency in the northern portion of Kodiak Island, the most
likely source of colonizers (Figure 8).
Phylogenetic Relationships
Three taxonomic hypotheses give subspecies status (U. a. middendorffi) to bears of Kodiak
Island and, presumably, to the rest of the Kodiak Archipelago, including Afognak Island (Rausch
1963, Kurtén 1973, Hall 1984). While we observed six unique haplotypes on the Kodiak
Archipelago, the second most common haplotype on the Archipelago, UARCR9 (the most
common type found on KOD), also occurs to varying degrees in all other regions of mainland
Alaska examined here, except in southcoastal Alaska and the Alexander Archipelago (Figure
2a,b). Thus, our phylogenetic analyses of haplotypes suggest that Kodiak Archipelago bears
share a close evolutionary relationship to bears of BR, KAT, SP and SCEN (Figure 2a, b).
Examination of Figure 2 (a, b) suggests this relationship is shallow, without the deeper,
reciprocally monophyletic lineages characterizing a taxon that is evolving independently over
(on average) 2Nef generations (Zink 2003). By this criterion, the relationship among Alaskan
populations or clades/clusters, based on mtDNA sequence information, presented in Figure 2a,
suggests subspecies status of Kodiak Archipelago brown bears is less defendable than subspecies
status of bears of the Alexander Archipelago of southeastern Alaska, given criteria based on the
evolutionary history of Kodiak Island based on neutral genetic markers alone.
Talbot and Shields (1996a) report findings similar to those presented here, but based
largely on mtDNA cytochrome b information; they suggest that KOD may have been colonized
by bears from mainland western Alaska. However, Talbot and Shields (1996a) did not include
samples from Kamchatka, so were unable to test Kurtén’s (1973) hypothesis that bears of the
Kodiak Archipelago are more closely allied to bears of Kamchatka than elsewhere in either
Alaska or eastern Siberia. Our control region data lend little support for that hypothesis.
The presence of private haplotypes on KOD, and complete pairwise differentiation
relative to the population on KAT (based on variance of allele and haplotype frequency), is
suggestive of very low gene flow to and from mainland Alaskan populations.

26
Surprisingly, the most common haplotype on KOD is not found on AFOG, although the
second most common haplotype, UARCR30, is shared between the two islands as well as with
bears from eastern Siberia. UARCR30 differs from the most common KOD haplotype
(UARCR9) by a single site substitution at position 287(C – T), and by a deletion in the 5’
thymine Tn repeat array. That the most common haplotype on KOD is not present on AFOG can
at least partially explain our results that frequency-only based FST measures of variance at
mtDNA loci suggested significant differentiation between AFOG and KOD, yet this difference
disappears upon invoking a model of evolution (ΦST).
Although our data suggest bears of the Kodiak Archipelago share recent evolutionary
ancestry with bears on mainland Alaska, KAM and Siberia, AMOVA suggests that populations
on the Kodiak Archipelago are experiencing very limited gene flow with mainland Alaskan
bears. This is demonstrated by significant differentiation between KOD and KAT, and between
AFOG and KAT, at microsatellite loci (data not shown for R-statistic analysis). Similarly,
Kodiak Archipelago populations are significantly differentiated from all other populations
examined in Alaska for mtDNA, whether a model of evolution is used or not (data not shown).
This pattern reflects significant long-term geographic isolation of the populations on the Kodiak
Archipelago, perhaps at least since the last glacial maximum. This pattern is also observed at the
DQB1 exon 2 locus, which is under balancing selection (see below). The two alleles observed
on the Kodiak Archipelago are not observed on the mainland population of KAT, suggesting
isolation and perhaps different responses to past selection pressures on the protein binding region
(PBR) of the MHC DQB1 exon 2 gene of the Kodiak Archipelago populations.
Biogeographic events resulting from Pleistocene glaciation and retraction are thought to
have significantly influenced the generation of modern species diversity (Lovette 2005). The
Pleistocene epoch was a time of dramatic oscillations of global climate, with unprecedented
cycles of global cooling occurring about every 100,000 years and resulting in continental
glaciation (Berger 1984). These ice ages were periodically interrupted by warming similar to
conditions characterizing the Holocene (the last 10,000 years). The evolutionary histories of
organisms in the northern latitudes were profoundly impacted by these glacial-interglacial cycles.
At least two unglaciated regions (refugia) were separated by full glacial advance in North
America. One was the Beringian sub-continent, which joined North America and Asia, and one
was in the lower latitudes, south of the reaches of glacial ice. Additional ice-free regions have
27
been hypothesized for the Pacific coast, mostly for the area currently known as the Alexander
Archipelago in southeastern Alaska and British Columbia (e.g., Moodie and Reimchen 1976,
O’Reilly et al. 1993, Heaton et al. 1996, Byun et al. 1997, 1999). Following the late Wisconsin
glacial period, some mammals, such as wolves (Klein 1965), are thought to have repopulated
Alaska from regions south of the glacial extent, since the glaciated coast range to the north and
northeast presented a physical barrier to access from the interior of Alaska (Pedersen 1982).
Other mammals, including caribou, moose and wolves isolated in the Beringian sub-continent,
are thought to have expanded to the south, repopulating areas following the retreat of the ice.
Since Kodiak Island was glaciated during the Wisconsin period, it is likely that brown
bears colonized Kodiak after glacial retreat some 10-12,000 years ago, although Kurtén (1973)
suggests a refugium large enough to support plants may have existed on Kodiak Island. The
mtDNA genetic data, however, are more consistent with a pattern of rapid expansion of
populations from refugia on the Beringian sub-continent of Asia into a recently deglaciated
region, followed by isolation and de novo mutations, rather than the existence of a Kodiak glacial
refugium that subsequently remained isolated from the rest of western Beringia. In the latter
case, we would expect to uncover deeper phylogenetic lineages rather than the shallow, starlike
phylogeny characterizing haplotype relationships on the Kodiak Archipelago. We find no
genetic evidence of expansion from a southern (continental United States) refugium, which
would likely have resulted in the presence of haplotypes currently observed in the eastern
Beringian and/or Alexander Archipelago clusters (Figure 2a, b), as observed for the same gene
region assayed in Alaskan gray wolves (Weckworth et al. 2005).
Major Histocompatibility Genes: DQB1 Exon 2
A comparison of amino acid sequences showed polymorphism within the PBR of the
ursid DQB1 exon 2 locus. The relative frequencies of nonsynonymous substitutions exceed that
of synonymous substitutions in the ABS, suggesting observed allelic polymorphism in brown
bears of Alaska is maintained by positive selection between populations (Hughes and Nei 1989).
However, the differences observed between the two haplotypes found on Kodiak Island were not
at ABS sites, and therefore the observed mutation may be neutral (see Seddon and Ellegren
2004). Mechanisms responsible for retaining polymorphism at MHC loci include
overdominance, frequency-dependent selection (driven by pathogens), and disassortative (non-

28
random) mating (Potts et al. 1991). Levels of variation in our comparative regional samples of
western Alaskan brown bears at both selected (DQB1 exon 2) and neutral (microsatellite loci,
mtDNA) loci were similar and concordant, as has been reported for other species (Boyce et al.
1997, Hedrick et al. 2001, Landry and Bernatchez 2001). Thus, we find that low levels of
variation at neutral nuclear markers reflect low levels of variation at a nuclear marker associated
with fitness (in this case, disease resistance).
The major histocompatibility complex is a family of highly polymorphic genes encoding
a set of transmembrane proteins critical to the generation of immune responses (Klein and Sato
2000a, b). These cell-surface glycoproteins play a key role in the initiation of immune response
by binding foreign peptides and presenting them to T-cells (Klein and Sato 2000a.b).
Polymorphism at MHC-encoded proteins ultimately determines the ability of the individuals to
respond to infectious diseases. High levels of variation at class I and class II proteins is thought
to be an adaptation to the large numbers of pathogens encountered by natural populations (Klein
and Takahata 1990), and infectious disease epidemics may have played a central role in
determining MHC allele frequencies observed in extant populations (Yuhki and O’Brien 1990).
Genetic and antigenic diversity at the MHC may play an important role in an individual’s ability
to respond to rapidly-evolving infectious diseases that periodically sweep through natural
populations. A lack of population-wide variation at the MHC and fixation at novel alleles
relative to source populations may be the result of past differential pathogen pressure (Babik et
al. 2005) and may increase susceptibility of isolated populations to infectious disease epidemics
(Yukhi and O’Brien 1990). Because of the key role of MHC diversity in disease susceptibility,
characterizing and understanding polymorphism at these genes is critical in the study of
infectious disease ecology at the population level.
Genes within the MHC are divided into at least three major types (class I, II and III).
Here we have characterized a locus within one of the three broad classes of MHC molecules, the
class II molecules. Class II molecules primarily bind peptides from proteins originating outside
of the cell, such as those produced by extracellular bacteria, and are expressed only on antigen
presenting cells, such as macrophages. Class I genes code for proteins that bind peptides from
proteins degraded in the cytosol, such as those produced during viral infections, and are present
in all somatic cells. Class III molecules are structurally unrelated to class I and II molecules and
are also unrelated to antigen presentation (Wagner et al. 1999). Although there is no class II
29
DQB sequence information publicly available for U. arctos, class II DQB gene information from
the domestic dog (Sarmiento et al. 1992, 1993; Schreiber et al. 1998; Wagner et al. 1996a, b,
1999) show that the canine DQB gene products are polymorphic and may be important in
generating peptide-binding diversity.
Our data suggest the levels of allelic diversity at the MHC class II DQB1 exon 2 gene
within brown bears of the Kodiak Archipelago are much lower than levels observed in
populations elsewhere in Alaska; however, only one mainland population (KAT) has been
reasonably well-characterized. Low levels of variation at the MHC have been observed in
populations that are also characterized by low levels of variation at neutral genetic markers
attributable to severe recent demographic bottlenecks (Hoelzel et al. 1993, Bonnell and Selander
1994). Although the brown bears of the Kodiak Archipelago are characterized by low genetic
variation at microsatellite loci, we found no signature of a recent demographic bottleneck (within
the last 2 to 20 generations, G. Luikart pers. comm.) in either AFOG or KOD. Garza’s M,
however, was significantly lower than the critical value expected, consistent with longer term
(over the past 100 generations) small effective population size (Garza and Williamson 2001).
Although low levels of variation in the MHC in endangered species have been implicated in their
response to infectious disease (O’Brien and Evermann 1988), it is not certain whether this effect
necessarily applies to brown bears of the Kodiak Archipelago. Although high allelic diversity is
thought to establish a stronger host defense and increase individual fitness (Hughes and Nei
1989, Takahata and Nei 1990), some studies have shown that species with low MHC diversity
are still viable (Hoelzel et al. 1999, Mikko et al. 1999). The Kodiak Archipelago bears appear
viable (USFWS 2002) and show no apparent phenotypic signs of inbreeding depression.
Nevertheless, the populations on the Kodiak Archipelago may have a smaller chance at mounting
immune responses against pathogens over the long term, given the low variability at the MHC
class II DQB1 exon 2 gene. The DQB1 exon 2 alleles present within the Kodiak Archipelago are
not found on Katmai (and vice versa), and these differences are at sites that are apparently under
selection. This suggests the Archipelago populations have been subjected to a different selection
regime since differentiation from mainland bears.
Conservation Implications
30
Although mtDNA haplotypes and microsatellite alleles are shared between Kodiak Archipelago
bears and those in mainland Alaska populations, they occur at different frequencies and those
differences are significant and indicative of genetic isolation. However, divergences are much
more shallow than those observed among other Alaskan populations (Talbot and Shields 1996a,
Waits et al. 1998, Paetkau et al. 1998a), and thus there is little support for currently hypothesized
subspecies designation applied to bears of the Kodiak Archipelago. Nevertheless, the
importance of the Linnean rank of subspecies to conservation policy is under critical appraisal
(Zink 2003). Although Mayr (1970) suggested that subspecific variation represents local
adaptation, Crandall et al. (2000) suggest the subspecies may reflect adaptive variation critical to
the species’ survival, regardless of pattern of mtDNA reciprocal monophyly. Because many
subspecies that fail to exhibit reciprocal monophyly at the mtDNA genome, but exhibit
geographic pattern in morphology (phenotypic variation) that may reflect local adaptations
(probably important in the species’ future survival), there appears to be a conflict between the
use of a historical approach advocated by Zink (2003) and that advocated by Crandall et al.
(2002; see Moritz 2002). Because phenotypic variation can evolve quite rapidly, but reciprocal
monophyly of neutral markers requires much longer to evolve, restoration of historical groups
would take much longer than the restoration of phenotypic variation characterizing subspecies
(Mooers and Atkins 2003). Zink (2003) argues that the preservation of reciprocally
monophyletic groups and attendant “significant bouts of independent history” will concomitantly
preserve adaptive phenotypic variation included in such groups (see Crokrak and Merila 2002).
This debate is not new and will not be resolved in the near future.
Regardless of future resolution of operational criteria for delineation of subspecies, it is
clear that Kodiak Archipelago brown bear populations are genetically isolated from mainland
populations, and apparently genetically isolated from each other, although certainly more
recently. Contemporary demographic independence may leave island populations more
vulnerable to environmental disruptions, including habitat fragmentation or disease, particularly
if those populations are characterized by low levels of variation at markers thought to be
involved in immune response.
Genetic variation in neutral nuclear loci is so low on KOD and AFOG that it is unlikely
that a suite of 14 microsatellite loci (of which only 12 are polymorphic in Kodiak Archipelago
populations) are adequate to provide individual identification for genetic tagging studies on

31
AFOG or KOD. Even genes in the most variable portion of the MHC supergene (class II, exon 2
peptide-binding regions) are essentially monomorphic in Kodiak Archipelago populations. It is
possible that additional markers can be added to this suite to boost exclusion probabilities, but
such a large suite of loci may be impractical for robust genetic tagging studies due to technical
considerations (Paetkau 2003).
32
Literature Cited
Alaska Department of Fish and Game (2002) Kodiak Archipelago Bear Conservation and
Management Plan. Alaska Department of Fish and Game, Anchorage, Alaska, Division
of Wildlife Conservation. 240 pp.
Altschul SF, TL Madden, AA Schäffer, J Zhang, Z Zhang, W Miller and DJ Lipman (1997)
Gapped BLAST and PSI-BLAST: a new generation of protein database search
programs. Nucleic Acids Res. 25:3389-3402.
Allendorf FW and RF Leary (1986) Heterozygosity and fitness in natural populations of
animals. In: (ed. ME Soulé), Conservation Biology: the Science of Scarcity and
Diversity, pp. 57-76. Sinauer Associates, Inc., New York.
Allendorf FW, RB Harris and LH Metzgar LH (1991) Estimation of effective population size of
grizzly bears by computer simulation. In: Proceedings of the Fourth International
Congress of Systematics and Evolutionary Biology, pp. 650-654. Fourth Discords Press,
Portland, OR.
Apple R, C Weeler, T Becker, W Klitz and H Erlich (1993) HLA DR-DO disease associations
in Hispanic cervical carcinoma. Hum. Immunol. 37:62.
Apple RJ, TL Bugawan, R Griffith, JD Chang and HA Erlich (1993) A new DRB1 allele and a
novel DR4 haplotype found in a Filipino family. Tissue Antigens 41(1): 51-54.
Avise JC (2000) Phylogeography, the history and formation of species. Harvard University
Press, Cambridge, United Kingdom.
Babik W, W Durka and J Radwan (2005) Sequence diversity of the MHC DRB gene in the
Eurasian beaver (Castor fiber). Molecular Ecology 14:4249-4257.
Barnes Jr. VG and RB Smith (1998) Estimates of brown bear abundance on Kodiak Island,
Alaska. Ursus 10:1-9.
Belkhir K, V Castric and F Bonhomme (2002) IDENTIX, a software to test for relatedness in a
population using permutation methods. Mol. Ecol. Notes 2:611-614.
Berger A (1984) Accuracy and frequency stability of the Earth’s orbital elements during the
Quarternary. In: (eds A Berger, J Imbrie, J Hays, G Kukla, B Salzmann) Milankovitch
and Climate, Part I, pp. 527-537. Reidel: Dordrecht.
33
Bonnell ML and RK Selander (1974) Elephant seals: genetic variation and near extinction.
Science 184:908-909.
Bowen L, BM Aldridge, F Gulland, J Woo, W Van Bonn, R DeLong, JL Stott and ML Johnson
(2002) Molecular characterization of expressed DQA and DQB genes in the California
sea lions (Zalophus californianus). Immunogenetics 54:332-347.
Bowen L, BM Aldridge, F Gulland, W Van Bonn, R DeLong, S Melin, LJ Lowenstine, JL Stott
and ML Johnson (2004) Class II multiformity generated by variable MHC-DRB region
configurations in the California sea lion (Zalophus californianus). Immunogenetics
56:12-27.
Boyce WM, PW Hedrick, NE Muggli-Cockett, S Kalinowski, MC Penedo and RR Ramey
(1997) Genetic variation of major histocompatibility complex and microsatellite loci: a
comparison with bighorn sheep. Genetics 145:421-433.
Brown JH, TS Jardetzky, JC Gorda, LJ Stern, RG Urban, JL Stominger and DC Wiley (1993)
Three-dimensional structure of the human class II histocompatibility antigen HLA-DR1.
Nature 364:33-39.
Briles WE, HA Stone and RK Cole (1977) Marek’s disease: effects of B histocompatibility
alloalleles in resistant and susceptible chicken lines. Science 195:193-195.
Byun SA, BF Koop and TE Reimchen (1997) North American black bear mtDNA
phylogeography: implication for morphology and the Haida Gwaii glacial refugium
controversy. Evolution 51:1647-1653.
Byun SA, BF Koop and TE Reimchen (1999) Coastal refugia and postglacial recolonization
routes: a reply to Demboski, Stone, and Cook. Evolution 53:2013-2015.
Carrington MG, W Nelson, MP Martin, T Kissner, D Vlahov, JJ Goedert, R Kaslow, S
Buchbinder, K Hoots and SJ O’Brien (1999) HLA and HIV-1: heterozygote advantage
and B*35-C2*04 disadvantage. Science 238:1748-1752.
Casane D, N Dennebouy, H DeRochambeau, JC Mounolou and M Monnerot (1997) Nonneutral
evolution of tandem repeats in the mitochondrial DNA control region of Lagomorphs.
Mol. Biol. Evol. 14:779-789.
Cavalli-Sforza LL and AWF Edwards (1967) Phylogenetic analysis: models and estimation
procedures. Evolution 21:550-570.
34
Cornuet J-M and G Luikart (1996) Description and power analysis of two tests for detecting
recent population bottlenecks from allele frequency data. Genetics 144:2001-2014.
Craighead FL, D Paetkau, HV Reynolds, C Strobeck and ER Vyse (1998) Use of microsatellite
DNA analysis to infer breeding behavior and demographic processes in an Arctic grizzly
bear population. Ursus 10:323-327.
Crandall KA, ORP Bininda-Emonds, GM Mace and RKWayne (2000) Considering
evolutionary processes in conservation biology. Trends Ecol. Evol. 15:290-295.
Crokrak P and J Merila (2002) Genetic population divergence: markers and trait. Trends Ecol.
Evol. 17:501.
Di Rienzo A, AC Peterson, JC Garza, AM Valdes, M Slatkin and NB Freimer (1994) Mutational
processes of simple-sequence repeat loci in human populations. Proc. Natl. Acad. Sci.
USA 91:3166-3170.
Edwards SV and PW Hedrick (1998) Evolution and ecology of MHC molecules: from genomics
to sexual selection. TREE 13:305-311.
El Mousadik A and RJ Petit (1996) High level of genetic differentiation for allelic richness
among populations of the argan tree [Argania spinosa (L.) Skeels] endemic of Morocco.
Theor. App. Gen. 92:832-839.
Excoffier L, PE Smouse and JM Quattro (1992) Analysis of molecular variance inferred from
metric distances among DNA haplotypes: Application to human mitochondrial DNA
restriction data. Genetics 131:479-491.
Fleming MD and P Spencer (2004) Covertype descriptions of Kodiak Archipelago. USGS in-
house report. USGS Alaska Science Center, Geography Branch, Anchorage, AK. 65 pp.
Freimer NB and M Slatkin (1996) Microsatellites: evolution and mutational processes. Ciba
Found. Symp. 197:51-72.
Fu Y-X (1997) Statistical tests of neutrality of mutation against population growth, hitchhiking
and background selection. Genetics 147:915-925.
Garza JC and Williamson (2001) Detection of reduction in population size when using data
from microsatellite loci. Molecular Ecology 10:305-318.
Goudet J (1995) FSTAT(ver 1.2): A computer program to calculate F-statistics. J. Hered.
86:485-486.
35
Goudet J (2001) FSTAT, a program to estimate and test gene diversities and fixation indices
(version 2.9.3). Available from http://www.unil.ch/izea/softwares/fstat.html. Updated
from Goudet (1995)
Grant WS and BW Bowen (1998) Shallow population histories in deep evolutionary lineages of
marine fishes: insights from sardines and anchovies and lessons for conservation.
Journal of Heredity 89:445-426.
Hall ER (1984) Geographic variation among brown and grizzly bears (Ursus arctos) in North
America. University of Kansas Museum of Natural History Special Publication Vol 13.
Hancock JM (1999) Microsatellites and other simple sequences: genomic context and
mutational mechanisms. In: (Eds. DB Goldstein, C Schlötterer) Microsatellites:
Evolution and Applications, pp. 1-9. Oxford University Press.
Hansson B and L Westerberg (2002) On the correlation between heterozygosity and fitness in
natural populations. Molecular Ecology 11:2467-2474.
Harley EH (2002) AGARst: a program for calculating allele frequencies, Gst and Rst from
microsatellite data plus a number of other population genetic estimates and outputting
files formatted for various other population genetic programs,
http://web.uct.ac.za/dept/chempath/genetic/htm.
Hasegawa M, K Kishino and T Yano (1985) Dating the human-ape splitting by a molecular
clock of mitochondrial DNA. Journal of Molecular Evolution 22:160-174.
Hayasaka K, T Ishida and S Horai (1991) Heteroplasmy and polymorphism in the major
noncoding region of mitochondrial DNA in Japanese monkeys: association with
tandomly repeated sequences. Molecular Biology and Evolution 14:779-789.
Heaton TH, SL Talbot and GF Shields (1996) An ice age refugium for large mammals in the
Alexander Archipelago, southeastern Alaska. Quarternary Research 46:186-192.
Hedrick PW, GA Gutierrez-Espeleta and RN Lee (2001) Founder effect in an island population
of bighorn sheep. Molecular Ecology 10:851-857.
Hewitt GM (1996) Some genetic consequences of ice ages, and their role in divergence and
speciation. Biological Journal of the Linnean Society, 58:247-276.
Hill AVS, CEM Allson, D Kwiatdowski, NM Anstey, P Twunasi, PA Rowe, S Bennett, D
Brewster, AJ McMichael and BM Greenwood (1991) Common West African HLA
antigens are associated with protection from severe malaria. Nature 352:595-600.
36
Hoelzel AR, J Halley, SJ O’Brien, C Campagna, T Arnbom, J Le Boeuf, K Ralls and GA Dover
(1993) Elephant seal genetic variation and the use of simulated models to investigate
historical bottlenecks. Journal of Heredity 84:443-449.
Hoelzel AR, JV Lopez, GA Dover and SJ O’Brien (1994) Rapid evolution of a heteroplasmic
repetitive sequence in the mitochondrial DNA control region of carnivores. Journal of
Molecular Evolution 39:191-199.
Hoelzel AR, J Stephens and SJ O’Brien (1999) Molecular genetic diversity and evolution at the
MHC DQB locus in four species of pinnipeds. Molecular Biology and Evolution 16:611-
618.
Hughes AL and M Nei (1989) Nucleotide substitution at major histocompatibility complex class
II loci, evidence for overdominant selection. Proceedings of the National Academy of
Sciences USA 86:958-962.
Jackson JV, SL Talbot and S Farley (2005) Genetic characterization of Kenai brown bears
(Ursus arctos): microsatellite and mitochondrial DNA control region variation in brown
bears of the Kenai Peninsula, southcentral Alaska. Conservation Genetics: in review.
Jukes TH and CR Cantor (1969) Evolution of protein molecules. Pp. 21-132 In. Munro HM
(ed.) Mammalian Protein Metabolism. Academic Press, NY.
Kimura M (1980) A simple method for estimating evolutionary rates of base substitutions
through comparative studies of nucleotide sequences. Journal of Molecular Evolution
16:111-120.
Klein DR (1965) Post glacial distribution patterns of mammals in the southern coastal regions
of Alaska. Arctic 10:7-10.
Klein J and A Sato (2000a) The HLA system: first of two parts. New England Journal of
Medicine 343:702-709.
Klein J and A Sato (2000b) The HLA system: second of two parts. New England Journal of
Medicine 343:789-786.
Klein J and N Takahata (1990) The major histocompatibility complex and the quest for origins.
Immunological Reviews 113:5-26.
Kumar S, TK Koichiro, IB Jakobsen and M Nei (2001) MEGA2: molecular evolutionary
genetics analysis software. Bioinformatics 17:1244-1245.
37
Kurtén B (1973) Transberingian relationships of Ursus arctos Linné (brown and grizzly bears)
Commentat. Biol. 65:1-10.
Landry C and L Bernatchez (2001) Comparative analysis of population structure across
environments and geographical scales at major histocompatibility complex and
microsatellite loci in Atlantic salmon (Salmo salar). Molecular Ecology 10:2525-2539.
Levinson G and GA Gutman (1987) Slipped strand mispairing: a major mechanism for DNA
sequence evolution. Molecular Biology and Evolution 4:203-221.
Li CC and DG Horovitz (1953) Some methods for estimating the inbreeding coefficient.
American Journal of Human Genetics 5:107-117.
LI-COR (1999) Sequencing Protocols. Section 4 in: DNA Sequencing Manual: Global
Edition, IR2 System. Lincoln, Nebraska.
Lovette I (2005) Glacial cycles and the tempo of avian speciation. Trends in Ecology and
Evolution 20:57-59.
Luikart G and J-M Cornuet (1998) Empirical evaluation of a test for identifying recently
bottlenecked populations from allele frequency data. Conservation Biology 12:228-237.
Lunt DH, LE Whipple and BC Hyman (1998) Mitochondrial DNA variable number of tandem
repeats (VNTRs): utility and problems in molecular ecology. Molecular Ecology
7:1441-1455.
Madsen CS, SC Ghivizzani and WW Hauswirth (1993) In vivo and in vitro evidence for
slipped mispairing in mammalian mitochondria. Proceedings of the National Academy
of Sciences USA 90:7671-7675
Maruyama T and PA Fuerst (1985) Population bottlenecks and nonequilibrium models in
population genetics. II. Number of alleles in a small population that was formed by a
recent bottleneck. Genetics 111:675-689.
Matsuhashi T, R Masuda, T Mano and C Yoshida (1999) Microevolution of the mitochondrial
DNA control region in the Japanese brown bear (Ursus arctos) population. Molecular
Biology and Evolution 16:676-684.
Mayr E (1970) Populations, Species and Evolution. Belknap, Cambridge MA.
McElroy D, P Moran, E Bermingham and I Kornfield (1991) REAP: The Restriction Enzyme
Analysis Program, Version 4.0. Dept. Zool., Univ. Maine, Orono, ME.
38
Medrano JF, E Aasen and J Sharrow (1990) DNA extraction from nucleated red blood cells.
Biotechniques 8:43.
Mikko S, K Roed, S Schmutz and L Andersson (1999) Monomorphism and polymorphism at
MHC DRB loci in domestic and wild ruminants. Immunological Reviews 167:169-178.
Miller S and J Schoen (1999) Brown bear conservation action plan for North America. In:
(eds. S Herrero, B Peyton) Bears – Status survey and conservation action plan:
ICUM/SSC bear and polar bear specialist groups, Chapter 6. Gland, Switzerland.
Moodie GEE and TE Reimchen (1976) Glacial refugia, endemism and stickleback populations
of the Queen Charlotte Islands. Canadian Field Naturalist 90:471-474.
Mooers AØ and RA Atkins (2003) Indonesia’s threatened birds: over 500 years of
evolutionary heritage at risk. Animal Conservation 6:183-188.
Moritz C (2002) Strategies to protect biological diversity and the processes that sustain it.
Systematic Biology 51:238-254.
Nei M and T Gojobori (1986) Simple methods for estimating the numbers of synonymous and
nonsynonymous nucleotide substitutions. Molecular Biology and Evolution 3:418-426.
Nei M (1987) Molecular Evolutionary Genetics. New York: Columbia University Press.
Nei M, T Maruyama and R Chakraborty (1975) The bottleneck effect and genetic variability in
populations. Evolution 29:1-10.
Ohta T and K Kimura (1973) The model of mutation appropriate to estimate the number of
electrophoretically detectable alleles in a genetic population. Genetical Research
22:201-204.
O’Brien SJ and JF Evermann (1988) Interactive influence of infectious disease and genetic
diversity in natural population. Trends in Ecology and Evolution 3:254-259.
O’Reilley P, TE Reimchen, R Beech and C Strobeck (1993) Mitochondrial DNA in
Gasterosteus and Pleistocene glacial refugium on Queen Charlotte Islands, British
Columbia. Evolution 47:678-694.
Ostrander EA, GF Sprague and J Rine (1993) Identification and characterization of di-nucleotide
repeat (CA)n markers for genetic mapping in dog. Genomics 167:207-213.
Paetkau D, W Calvert, I Stirling and C Strobeck (1995) Microsatellite analysis of population
structure in Canadian polar bears. Molecular Ecology 4:347-354.
39
Paetkau D, GF Shields and C Strobeck (1998a) Gene flow between insular, coastal and interior
populations of brown bears in Alaska. Molecular Ecology 7:1283-1292.
Paetkau, D, LP Waits, PL Clarkson, L Craighead and C Strobek (1998b) Dramatic variation in
genetic diversity across the range of North American brown bears. Conservation Biology
12:418-429.
Paetkau D (2003) An empirical exploration of data quality in DNA-based population
inventories. Molecular Ecology 12:1375-1387.
Park SDE (2001) Trypanotolerance in west African cattle and the population genetics effects of
selection. Ph. D. thesis, University of Dublin.
Paterson S, K Wilson and JM Pemberton (1998) Major histocompatibility complex variation
associated with juvenile survival and parasitic resistance in a large unmanaged ungulate
population (Ovis ares L.). Proceedings of the National Academy of Sciences. USA
95:3714-3719.
Pedersen S (1982) Geographical variation in Alaskan wolves. In: (eds. FH Harrington, PC
Paquet) Wolves of the World, pp. 334-344. Noyes Publishers, Park Ridge, NJ.
Piry S, G Luikart and J-M Cornuet (1999) BOTTLENECK: A computer program for detecting
recent reductions in the effective population size using allele frequency data. Journal of
Heredity 90:502-503.
Posada D and KA Crandall (1998) Modeltest: testing the model of DNA substitution.
Bioinformatics 14:817-818.
Potts WK, CJ Manning and EK Wakeland (1991) Mating patterns in seminatural populations of
mice influenced by MHC genotype. Nature 352:619-621.
Pritchard JK, M Stephens and P Donnelly (2000) Inference of population structure using multi
locus genotype data. Genetics 155:945-959.
Queller DC and KF Goodnight (1989) Estimating relatedness using genetic markers. Evolution
43:258-275.
Rausch RL (1963) Geographic variation in size in North American brown bears, Ursus arctos
L. as indicated by condylobasal length. Canadian Journal of Zoology. 41:33-45.
Raymond M and F Rousset (1995) GENEPOP (Ver 1.2): population genetics software for exact
tests and ecumenicism. Journal of Heredity 86:248-249.
40
Reynolds JB, S Weir and CC Cockerham (1983) Estimation of the coancestry coefficient: basis
for short term genetic distance. Genetics 105:767-779.
Rice WR (1989) Analyzing tables of statistical tests. Evolution 43:223-225.
Roff DA and P Bentzen (1989) The statistical analysis of mitochondrial DNA polymorphism:
χ2 and the problem of small samples. Mol. Biol. Evol. 6:539-545.
Rogers LL (1987) Effects of food supply and kinship on social behavior, movements, and
population growth of black bears in northeastern Minnesota. Wildlife Monographs
97:1-72.
Sarmiento UM, S DeRose, JI Sarmiento and R Storb (1992) Allelic variation in the DQ
subregion of the canine major histocompatibility complex: I. DQA. Immunogenetics
35:416-420.
Sarmiento UM, S DeRose, JI Sarmiento and R Storb (1993) Allelic variation in the DQ
subregion of the canine major histocompatibility complex: 2. DQB. Immunogenetics
37:148-152.
Sarmiento UM, JI Sarmiento and R Storb (1990) Allelic variation in the DR subregion of the
canine major histocompatibility complex. Immunogenetics 32:13-19.
Schneider S, D Roessli and L Excoffier (2000) Arlequin ver. 2.000: a software for population
genetics data analysis. Genetics and Biometry Laboratory, University of Geneva,
Switzerland. Available: http://anthropologie.unige.ch/arlequin.
Schreiber A, K Eulenberger and K Bauer (1998) Immunogenetic evidence for the phylogenetic
sister group relationships of dogs and bears (Mammalia, Carnivora: Canidae and
Ursidae), a comparative determinant analysis of carnivoran albumin, c3 complement and
immunoglobulin micro-chain. Experimental and Clinical Immunogenetics 15:154-170.
Schwartz CC and AW Franzmann (1992) Dispersal and survival of subadult black bears from the
Kenai Peninsula, Alaska. Journal of Wildlife Manage. 56:426-431.
Seddon JM and H Ellegren (2002) MHC class II genes in European wolves: a comparison with
dogs. Immunogenetics 54:490-500.
Seddon JM and H Ellegren (2004) A temporal analysis shows MHC loci in the Scandinavian
wolf population are consistent with neutral evolution. Proceedings of the Royal Society
London, Series B 271: 2283-2291.

41
Shi J, TL Blundell and K Mizuguchi (2001) FUGUE: sequence-structure homology recognition
using environment-specific substitution tables and structure-dependent gap penalties.
Journal of Molecular Biology 310:243-257.
Slatkin M (1995) A measure of population subdivision based on microsatellite allele
frequencies. Genetics 139:457-462.
Spencer CC, JE Neigel and PL Leberg (2000) Experimental evaluation of the usefulness of
microsatellite DNA for detecting demographic bottlenecks. Molecular Ecology 9:1517-
1528.
Stoneking M (2000) Hypervariable sites in the mtDNA control region are mutational hotspots.
Am. J. Hum. Genet. 67:1029-1032.
Swofford DL (2000) PAUP*: Phylogenetic Analysis Using Parsimony (*and other methods).
Version 4. Sinauer Associates, Sunderland, Mass.
Swofford DL and RB Selander (1981) BIOSYS-1: A FORTRAN program for the
comprehensive analysis of electrophoretic data in population genetics and systematics.
Journal of Heredity 72:281-283.
Taberlet P, JJ Camarra and S Griffin (1997) Non-invasive genetic tracking of the endangered
Pyrenean brown bear population. Molecular Ecology 6:869-876.
Tae KE (1997) Processes controlling the range expansion of Sitka spruce on Kodiak Island,
Alaska. M.S. Thesis, University of Alaska Fairbanks, Fairbanks, AK.
Tajima F (1983) Evolutionary relationship of DNA sequences in finite populations. Genetics
105:437-460.
Tajima F (1989) The effect of change in population size on DNA polymorphism. Genetics
123:597-601.
Takahata N and M Nei (1990) Allelic genealogy under overdominant selection and frequency-
dependent selection and polymorphism of major histocompatibility complex loci.
Genetics 124:967-978.
Takezaki N and M Nei (1996) Genetic distances and reconstruction of phylogenetic trees from
microsatellite DNA. Genetics 144:389-399.
Talbot SL and GF Shields (1996a) Phylogeography of brown bears (Ursus arctos) of Alaska
and paraphyly within the Ursidae. Molecular Phylogenetics and Evolution 5:477-494.
42
Talbot SL and Shields GF (1996b) A phylogeny of the bears (Ursidae) inferred from complete
sequences of three mitochondrial genes. Molecular Phylogenetics and Evolution 5:567-
575.
Tamura K and M Nei (1989) Positive Darwinian selection observed at the variable-region genes
of immunoglobulins. Molecular Biology and Evolution 6:447-459.
Tamura K and M Nei (1993) Estimation of the number of nucleotide substitutions in the control
region of mitochondrial DNA in humans and chimpanzees. Molecular Biology and
Evolution 10:512-526.
Thursz MR, HC Thomas, BM Greenwood and AVS Hill (1997) Heterozygote advantage for
HLA class-II type in hepatitis E virus infection. Nat. Genet. 17:11-12.
U. S. Fish and Wildlife Service (2004) Draft Revised Comprehensive Conservation Plan and
Environmental Impact Statement for Kodiak National Wildlife Refuge. U. S. Fish and
Wildlife Service, Anchorage, AK.
Valieré N (2002) GIMLET: a computer program for analyzing genetic individual identification
data. Molecular Ecology Notes 2:377-379.
Van Daele LJ (2003) The History of Bears on the Kodiak Archipelago. Anchorage, Alaska:
Alaska Natural History Association. 83 pp.
Wagner JL, R Burnett and R Storb (1996a) Molecular analysis of the DLA DR region. Tissue
Antigens 48:549-553.
Wagner JL, RC Burnett, JD Works and R Storb (1996b) Molecular analysis of DLA-DRBBI
polymorphism. Tissue Antigens 48:554-561.
Wagner JL, R Burnett and R Storb (1999) Organization of the canine major histocompatibility
complex; current perspectives. Journal of Heredity 90:35-38.
Waits LP, SL Talbot, RH Ward and GF Shields (1998) Mitochondrial DNA phylogeography of
the North American brown bear and implications for conservation. Conservation
Biology 12:408-417.
Waits LP, G Luikart and P Taberlet (2001) Estimating the probability of identity among
genotypes in natural populations: cautions and guidelines. Molecular Ecology 10:249-
256.
Wakely J (1993) Substitution rate variation among sites in hypervariable region 1 of human
mitochondrial DNA. Ph.D. dissertation, University of California, Berkeley.

43
Weckworth BV, SL Talbot and JA Cook (2005) Tracking wolves (Canis lupus) across North
America with signatures of genetic footprints. Journal of Evolutionary Biology: in
review.
Weir BS and CC Cockerham (1984) Estimating F-statistics for the analysis of population
structure. Evolution 38:1358-1370.
Wilkinson GS and AM Chapman (1991) Length and sequence variation in evening bat D-loop
mtDNA. Genetics 128:607-617.
Wobeser G (2002) Disease management strategies for wildlife. Rev. Sci. Tech. Off. Int. Epiz.,
21:159-178.
Woodford MH and PB Rossiter (1994) Disease risks associated with wildlife translocation
projects. In: (eds. GM Mace, ATC Feistner) Creative Conservation: Interactive
Management of Wild and Captive Animals, pp. 178-200. Chapman and Hall, London,
United Kingdom.
Wright S (1951) The genetical structure of populations. Annals of Eugenics 15:323-354.
Yuhki N and S O’Brien (1990) Nature and origin of polymorphism in feline MHC class II DRA
and DRB genes. Journal of Immunology. 158:2822-2833.
Xu A, MJT Van Eijk, C Park and HA Lewin (1993) Polymorphism on Bo LA-DRB3 exon 2
correlates with resistance to persistent lymphocytosis caused by bovine leukemia virus.
Journal of Immunology 151:6977-6985.
Zink RM (2003) The role of subspecies in obscuring avian biological diversity and misleading
conservation policy. Proceedings of the Royal Society London, Series B 271:561-564.
Figure Legends
FIGURE 1. Sample locations. Distribution of samples on Kodiak and Afognak Island
characterized at: a) nuclear microsatellite loci, b) the mtDNA control region, and c) the MHC
class II DQBI exon 2 gene.
FIGURE 2. Distance (minimum evolution, neighbor-joining) tree describing evolutionary
relationships among 45 haplotypes resolved on the basis of sequence information from a 589-592
bp fragment of the mitochondrial DNA geneome encompassing portions of the cytochrome b
44
gene, the tRNA-pro, tRNA-thr genes, and a portion of the hypervariable domain I of the control
region. Pairwise haplotypic relationships are based on the Hasegawa et al. (1985) model
incorporating a gamma distribution of 0.4796. a) traditional phenogram, rooted using haplotypes
found in the Alexander Archipelago; bootstrap values exceeding 50%, based on 1000 replicates,
are given at the nodes, and populations in which haplotypes are found are listed to the right; b)
radiation tree illustrating the same relationships, without rooting. Population designators are:
[Alexander Archipelago: ADM = Admiralty Island; CHI = Chichagof Island; BAR = Baranof
Island] [Eastern and Western Beringia: ANWR = Arctic National Wildlife Refuge; INT =
Fairbanks area; BR = Brooks Range; AKR = Alaska Range; SCOA = southcoastal Alaska; KAT
= Katmai National Park; IZE = Izembek National Wildlife Refuge; SCEN = southcentral Alaska;
KOD = Kodiak Island; AFOG = Afognak Island; SPEN = Seward Peninsula; KAM =
Kamchatka, Russia; ESIB = Eastern Siberia/Sea of Okohotsk/Magadan, Russia].
FIGURE 3. Neighbor-joining tree based on Cavalli-Sforza and Edward’s (1967) chord distances,
based on 12 nuclear microsatellite loci. Values on branches are bootstrap values based on 3000
permutations.
FIGURE 4. Neighbor-joining tree based on the coancestry coefficient (Reynolds et al. 1983),
using mtDNA sequence data. Label designations: AFOG = Afognak; BR = Brooks Range; IZE
= Izembek National Wildlife Refuge; KAM = Kamchatka, Russia; KAT = Katmai National Park;
KOD = Kodiak; SCEN = Southcentral Alaska; SPEN = Seward Peninsula.
FIGURE 5. Nucleotide sequence identity between Ursus arctos class II MHC DQB1 exon 2
clones (UrarDQB1) and human, canine, elephant seal and other DQB sequences. Abbreviations
for individual species MHC molecules are as follows: Urar = brown bear (Ursus arctos; this
study); Zaca-DQB = elephant seal (Zalophus californianus; GenBank Accession No. AF503407;
Bowen et al. 2002); Calu-DQB1 = wolf (Canis lupus; GenBank Accession No. AY126652;
Seddon and Ellegren 2002); HLA-DRB1 = human MHC DRB1 exon 2 gene (GenBank
Accession No. M84188; Apple et al. 1993); Urma-DRB = polar bear DRB1 exon 2 (Ursus
maritimus; GenBank Accession No. AF458914; Wei and Happ, unpublished data); HLA-DQB2
= human MHC DQB2 exon 2 gene (GenBank Accession No. M83891; Kimura 1991). The
45
complete sequence of UarDQB1*001 is shown. Single letters and dots below the nucleotide
sequence represent nucleotides that are, respectively, distinct from or identical to
UarDQB1*001. The allelic numbers for the brown bear are assigned according to multispecies
guidelines (Klein et al. 1990), with the assumption of a single DQB1 lineage based on close
sequence homology between individual clones.
FIGURE 6. Alignment of amino acid sequences from the 10 sequences of MHC class II DQB1
exon 2 alleles of Ursus arctos, given in Figure 5. Sequence similarity to UrarDQB1*001 is
indicated by a dot, while amino acid changes are represented by single letter codes. An asterisk
indicates putative sites involved in peptide binding (ABS) as determined by Brown et al. 1993.
FIGURE 7. Neighbor-joining tree for brown bear sequences from the class II MHC DQB1 exon 2
gene, and outgroup sequences [Zaca = elephant seal (Zalophus californianus; GenBank
Accession No. AF503407; Bowen et al. 2002); Calu = wolf (Canis lupus; GenBank Accession
No. AY126652; Seddon and Ellegren 2002); Urma = polar bear (Ursus maritimus; GenBank
Accession No. AF458914; Wei and Happ, unpublished data); HumanDRB1-1105 = human MHC
DRB1 exon 2 gene (GenBank Accession No. M84188; Apple et al. 1993); HumanDQB2 =
human MHC DQB2 exon 2 gene (GenBank Accession No. M83891; Kimura 1991)]. The
numbers indicate bootstrap values for internal nodes. Distances are based on the Tamura-Nei
model (Tamura and Nei 1993).
FIGURE 8. Distribution of brown bear mtDNA control region haplotypes for females only. Pie
charts represent frequencies of each haplotype within the specific hunt areas.

46
Table 1. A description of 14 microsatellite loci and summary of allelic variation among three populations of brown bears (U. arctos) in Alaska (AFOG, KOD, KAT) and one in Kamchatka, Russia (KAM). ________________________________________________________________________________________________________________________________________________
AFOG KOD KAT KAM
(n = 29) (n = 218) (n = 29) (n = 11)
Locus ID Na1 Size
Range2 HE3 HO
4 P5 HE HO P HE HO P HE HO P G1A 6 184-194 0.353 0.345 3 0.657 0.594* 3 0.639 0.448* 0.615 0.727 5
G10B 9 140-164 0.132 0.138 3 0.047 0.048 2 0.671 0.767 0.827 0.909 7
G10C 6 201-211 0.440 0.345 3 0.502 0.488 2 0.752 0.767 0.558 0.636 3
G1D 10 172-176 0.373 0.414 2 0.414 0.411 3 0.850 0.967 0.697 0.636 4
G10H 11 221-259 0.000 0.000 1 0.000 0.000 1 0.788 0.767 0532 0.545 6
G10J 6 178-200 0.448 0.379 2 0.494 0.425* 2 0.669 0.667 0.645 0.364* 5
G10L 8 147-175 0.131 0.138 2 0.038 0.039 2 0.722 0.633 0.745 0.818 6
G10M 6 206-216 0.000 0.000 1 0.000 0.000 1 0.728 0.633 0.519 0.636 4
G10P 8 133-161 0.494 0.621 2 0.465 0.431 3 0.605 0.533 0.701 0.727 5
G10X 8 129-149 0.131 0.138 2 0.060 0.053 2 0.578 0.600 0.840 0.909 7
Uarµ26 9 170-192 0.068 0.069 2 0.374 0.373 5 0.689 0.667 0.723 1.000 7
Uarµ50 11 106-138 0.533 0.414 3 0.056 0.048* 3 0.768 0.733 0.714 0.636 7
UaCµ59 10 227-249 0.321 0.321 2 0.426 0.426 5 0.699 0.600 0.788 0.818 6
CXX203 8 104-124 0.354 0.310 2 0.389 0.370 5 0.769 0.700 0.818 0.727 5
Mean 0.270 0.259 0.280 0.263 0.709 0.677 0.694 0.721
SE 0.050 0.049 0.062 0.058 0.020 0.033 0.029 0.044 1total number of alleles/haplotypes found among the populations and groups studied 2size range in base pairs for microsatellite loci, including primers 3expected heterozygosity (Nei 1987; eq. 7.39, pg. 164) 4observed heterozygosity 5total number of alleles found within population or group *significant deviation from HWE
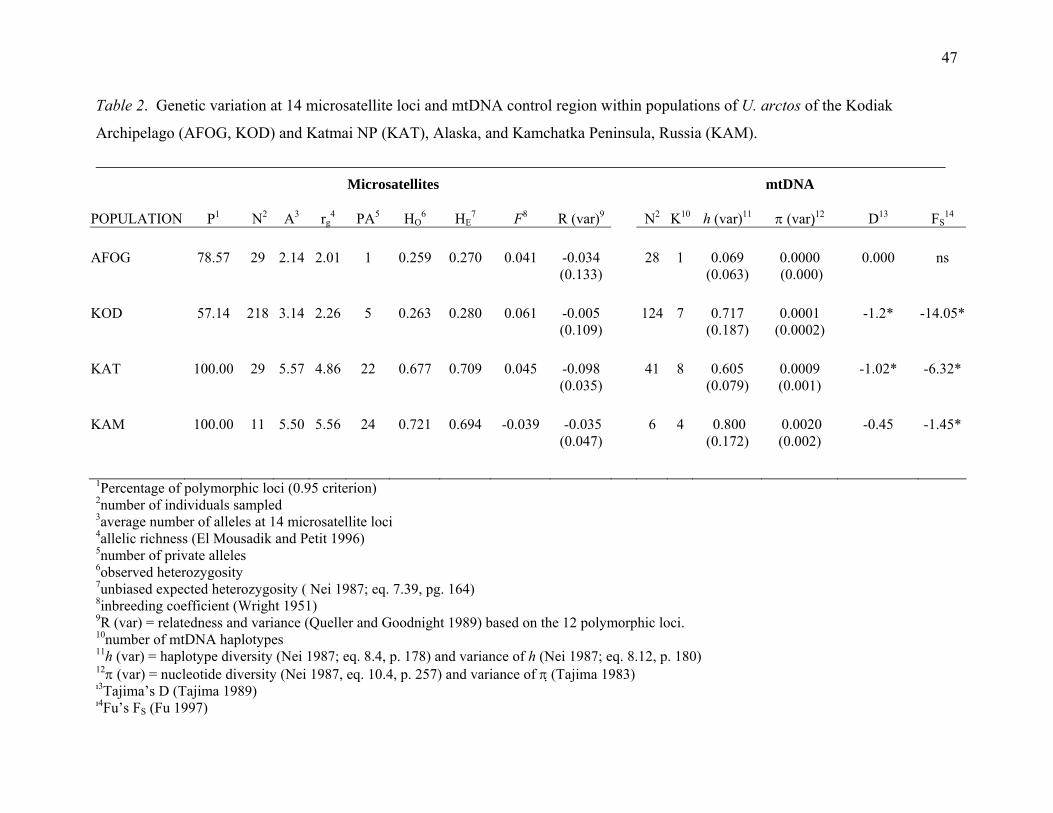
47
Table 2. Genetic variation at 14 microsatellite loci and mtDNA control region within populations of U. arctos of the Kodiak
Archipelago (AFOG, KOD) and Katmai NP (KAT), Alaska, and Kamchatka Peninsula, Russia (KAM).
Microsatellites mtDNA
POPULATION
P1 N2 A3 rg4 PA5 HO
6 HE7 F8 R (var)9
N2 K10 h (var)11 π (var) 12 D13 FS
14
AFOG 78.57 29 2.14 2.01 1 0.259 0.270 0.041 -0.034 (0.133)
28 1 0.069 (0.063)
0.0000 (0.000)
0.000 ns
KOD 57.14 218 3.14 2.26 5 0.263 0.280 0.061 -0.005 (0.109)
124 7 0.717 (0.187)
0.0001 (0.0002)
-1.2* -14.05*
KAT 100.00 29 5.57 4.86 22 0.677 0.709 0.045 -0.098 (0.035)
41 8 0.605 (0.079)
0.0009 (0.001)
-1.02* -6.32*
KAM 100.00 11 5.50 5.56 24 0.721 0.694 -0.039 -0.035 (0.047)
6 4 0.800 (0.172)
0.0020 (0.002)
-0.45 -1.45*
1Percentage of polymorphic loci (0.95 criterion) 2number of individuals sampled 3average number of alleles at 14 microsatellite loci 4allelic richness (El Mousadik and Petit 1996) 5number of private alleles 6observed heterozygosity 7unbiased expected heterozygosity ( Nei 1987; eq. 7.39, pg. 164) 8inbreeding coefficient (Wright 1951) 9R (var) = relatedness and variance (Queller and Goodnight 1989) based on the 12 polymorphic loci. 10number of mtDNA haplotypes 11h (var) = haplotype diversity (Nei 1987; eq. 8.4, p. 178) and variance of h (Nei 1987; eq. 8.12, p. 180) 12π (var) = nucleotide diversity (Nei 1987, eq. 10.4, p. 257) and variance of π (Tajima 1983) 3Tajima’s D (Tajima 1989) 4Fu’s FS (Fu 1997)
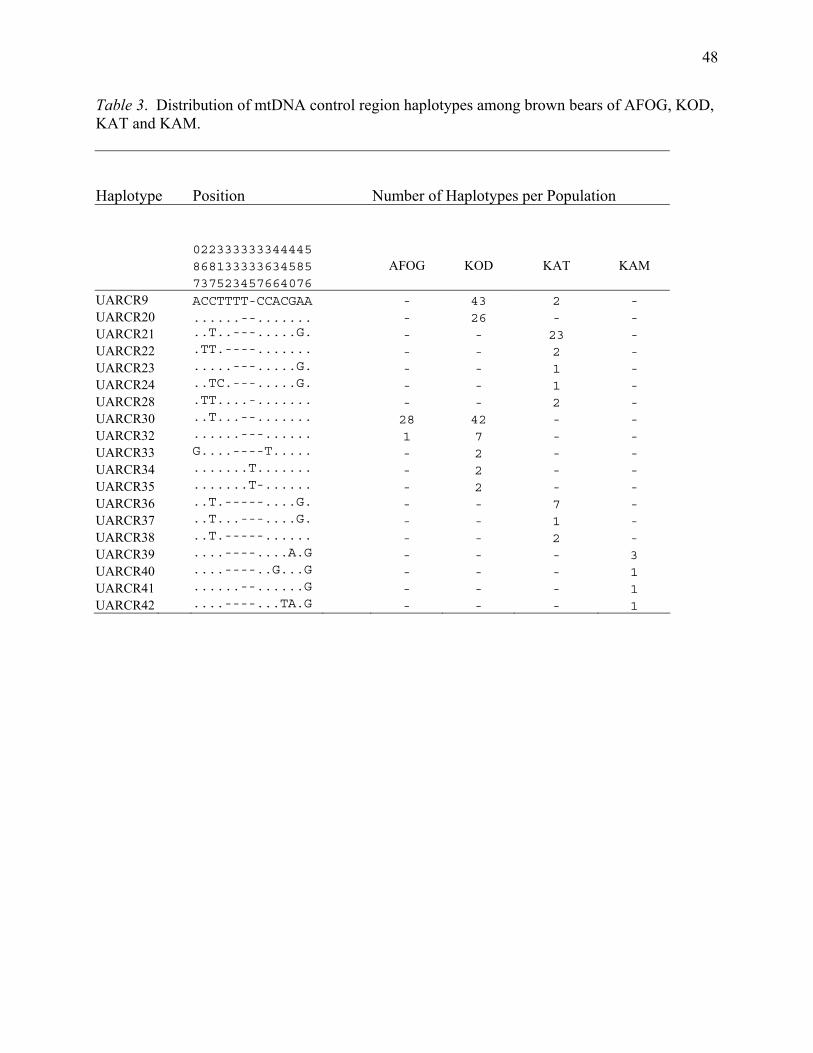
48
Table 3. Distribution of mtDNA control region haplotypes among brown bears of AFOG, KOD, KAT and KAM.
Haplotype Position Number of Haplotypes per Population 022333333344445 868133333634585 AFOG KOD KAT KAM 737523457664076 UARCR9 ACCTTTT-CCACGAA - 43 2 - UARCR20 ......--....... - 26 - - UARCR21 ..T..---.....G. - - 23 - UARCR22 .TT.----....... - - 2 - UARCR23 .....---.....G. - - 1 - UARCR24 ..TC.---.....G. - - 1 - UARCR28 .TT....-....... - - 2 - UARCR30 ..T...--....... 28 42 - - UARCR32 ......---...... 1 7 - - UARCR33 G....----T..... - 2 - - UARCR34 .......T....... - 2 - - UARCR35 .......T-...... - 2 - - UARCR36 ..T.-----....G. - - 7 - UARCR37 ..T...---....G. - - 1 - UARCR38 ..T.-----...... - - 2 - UARCR39 ....----....A.G - - - 3 UARCR40 ....----..G...G - - - 1 UARCR41 ......--......G - - - 1 UARCR42 ....----...TA.G - - - 1
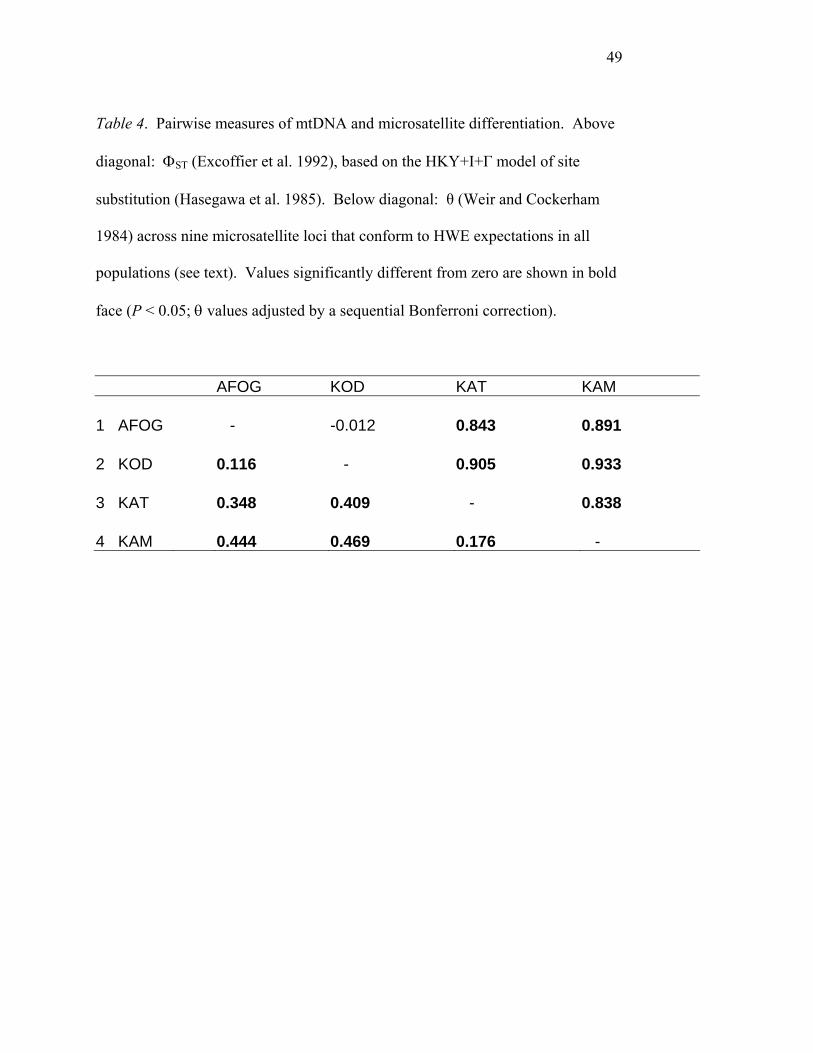
49
Table 4. Pairwise measures of mtDNA and microsatellite differentiation. Above
diagonal: ΦST (Excoffier et al. 1992), based on the HKY+I+Γ model of site
substitution (Hasegawa et al. 1985). Below diagonal: θ (Weir and Cockerham
1984) across nine microsatellite loci that conform to HWE expectations in all
populations (see text). Values significantly different from zero are shown in bold
face (P < 0.05; θ values adjusted by a sequential Bonferroni correction).
AFOG KOD KAT KAM 1 AFOG - -0.012 0.843 0.891 2 KOD 0.116 - 0.905 0.933 3 KAT 0.348 0.409 - 0.838 4 KAM 0.444 0.469 0.176 -

50
Table 5. Wilcoxon tests for heterozygosity in four populations of brown bear (U. arctos).
Values for heterozygote excess are based on 9 microsatellite loci. Values in bold are significant
at P < 0.05, Bonferroni correction applied.
WILCOXON
TEST
IAM3 TPM3 SMM3
Population (N)1 H2 excess H deficit H excess H deficit H excess H deficit
AFOG (58) 0.248 0.787 0.545 0.500 0.715 0.326
KOD (418) 0.674 0.367 0.986 0.018 0.998 0.002
KAT (60) 0.018 0.988 0.469 0.594 0.711 0.344
KAM (22) 0.014 0.990 0.102 0.918 0.589 0.456
1Number of alleles compared
2Ratio of heterozygote excess or deficit (Cornuet and Luikart 1996)
3IAM, TPM, SMM = infinite alleles, two-phase and stepwise mutational models of microsatellite
evolution, respectively (see text)
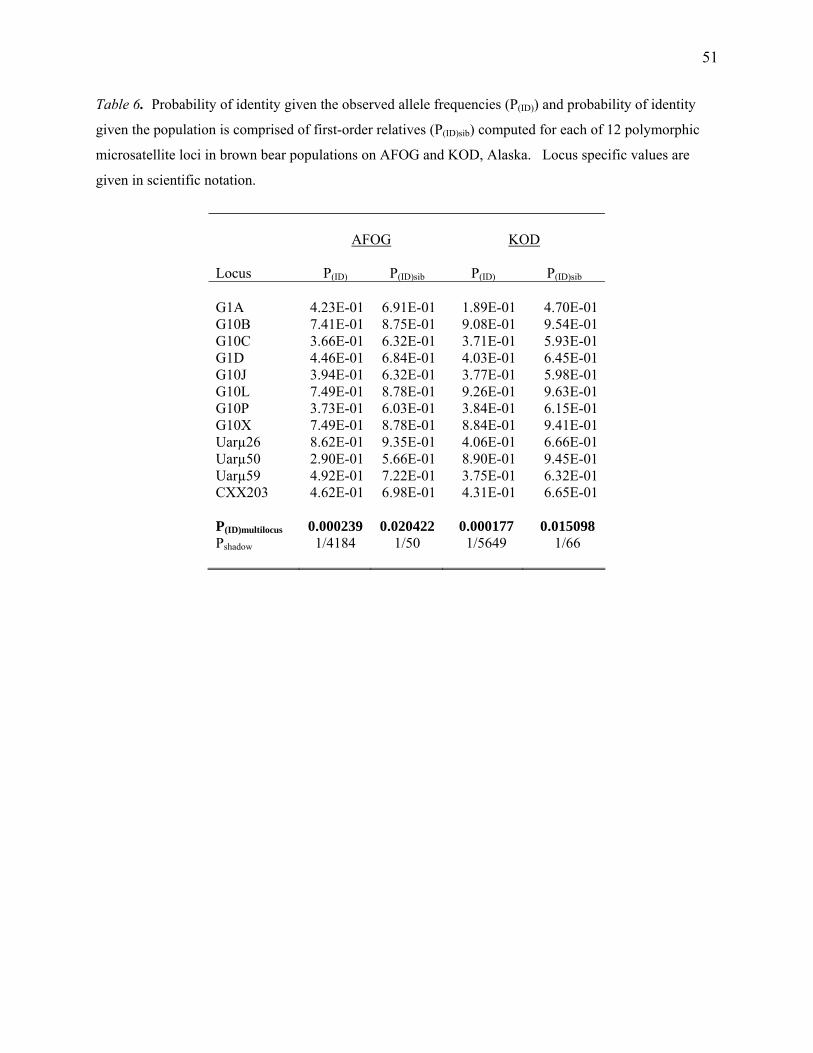
51
Table 6. Probability of identity given the observed allele frequencies (P(ID)) and probability of identity
given the population is comprised of first-order relatives (P(ID)sib) computed for each of 12 polymorphic
microsatellite loci in brown bear populations on AFOG and KOD, Alaska. Locus specific values are
given in scientific notation.
AFOG KOD Locus P(ID) P(ID)sib P(ID) P(ID)sib G1A 4.23E-01 6.91E-01 1.89E-01 4.70E-01 G10B 7.41E-01 8.75E-01 9.08E-01 9.54E-01 G10C 3.66E-01 6.32E-01 3.71E-01 5.93E-01 G1D 4.46E-01 6.84E-01 4.03E-01 6.45E-01 G10J 3.94E-01 6.32E-01 3.77E-01 5.98E-01 G10L 7.49E-01 8.78E-01 9.26E-01 9.63E-01 G10P 3.73E-01 6.03E-01 3.84E-01 6.15E-01 G10X 7.49E-01 8.78E-01 8.84E-01 9.41E-01 Uarµ26 8.62E-01 9.35E-01 4.06E-01 6.66E-01 Uarµ50 2.90E-01 5.66E-01 8.90E-01 9.45E-01 Uarµ59 4.92E-01 7.22E-01 3.75E-01 6.32E-01 CXX203 4.62E-01 6.98E-01 4.31E-01 6.65E-01 P(ID)multilocus 0.000239 0.020422 0.000177 0.015098 Pshadow 1/4184 1/50 1/5649 1/66
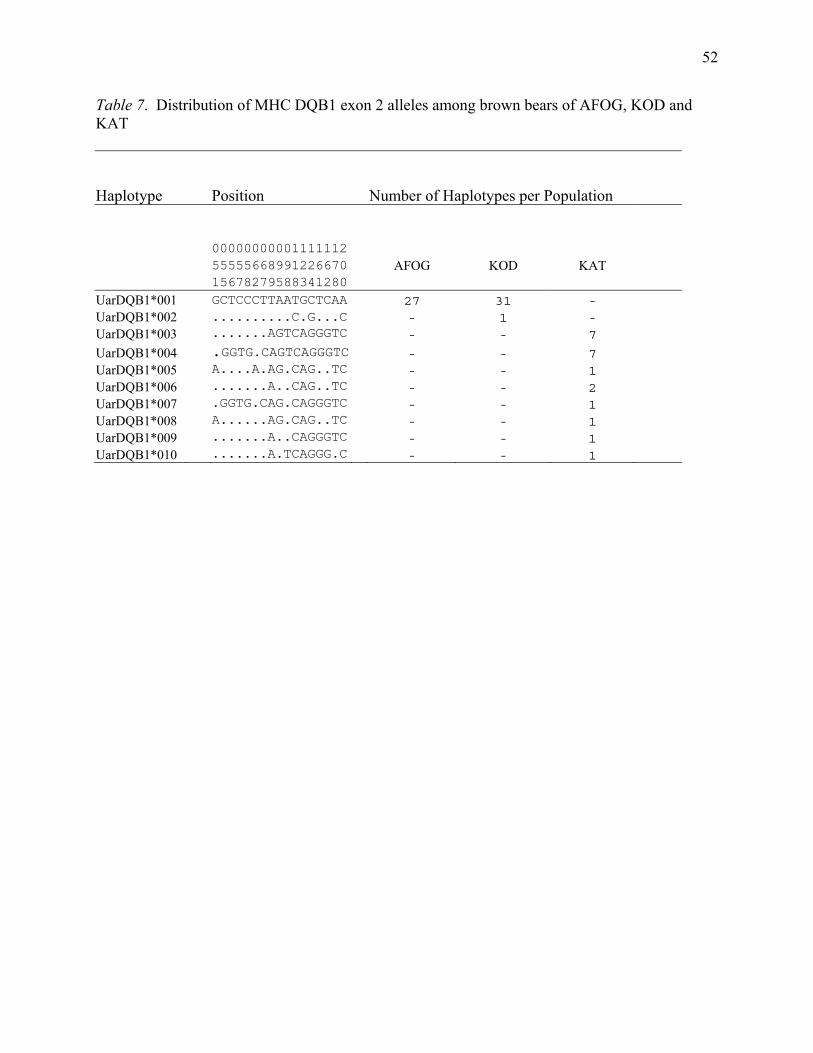
52
Table 7. Distribution of MHC DQB1 exon 2 alleles among brown bears of AFOG, KOD and KAT
Haplotype Position Number of Haplotypes per Population 00000000001111112 55555668991226670 AFOG KOD KAT 15678279588341280 UarDQB1*001 GCTCCCTTAATGCTCAA 27 31 - UarDQB1*002 ..........C.G...C - 1 - UarDQB1*003 .......AGTCAGGGTC - - 7
UarDQB1*004 .GGTG.CAGTCAGGGTC - - 7 UarDQB1*005 A....A.AG.CAG..TC - - 1 UarDQB1*006 .......A..CAG..TC - - 2 UarDQB1*007 .GGTG.CAG.CAGGGTC - - 1 UarDQB1*008 A......AG.CAG..TC - - 1 UarDQB1*009 .......A..CAGGGTC - - 1 UarDQB1*010 .......A.TCAGGG.C - - 1
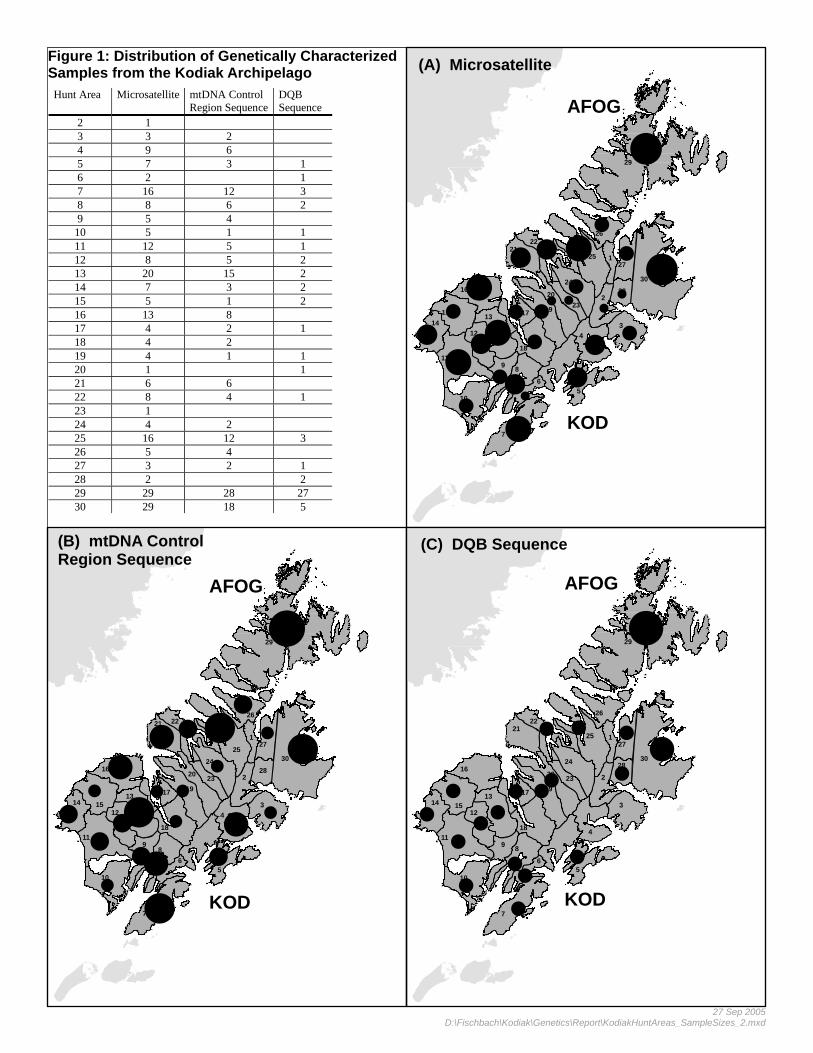
!
!
!
!
!!
!!
!
!
!!
!
!
!
!
!
!
! !
!
!
!
!
!
!!
!!
29
30
7
4
5
3
811
2
9
25
16
10
18
15 1913
24
20
6
21
26
1412
127
22
28
2317
Figure 1: Distribution of Genetically Characterized Samples from the Kodiak Archipelago
!
!
!
!
!!
!
!
!
!!
!
!!
!
!
!
!
!!
!
!
! !
29
30
7
4
5
3
8
11
2
9
25
16
10
18
15
1913
24
20
6
2126
1412
127
22
2823
17
!
!
!
!
!
!
!
!
!!
!
!
!
!!
!
!
!
!
29
30
7
4
5
3
811
2
9
25
16
10
18
15
1913
24
20
6
21
26
1412
127
22
28
23
17
(A) Microsatellite
(B) mtDNA Control Region Sequence
(C) DQB Sequence
27 Sep 2005D:\Fischbach\Kodiak\Genetics\Report\KodiakHuntAreas_SampleSizes_2.mxd
Hunt Area Microsatellite mtDNA Control Region Sequence
DQB Sequence
2 1 3 3 2 4 9 6 5 7 3 1 6 2 1 7 16 12 3 8 8 6 2 9 5 4
10 5 1 1 11 12 5 1 12 8 5 2 13 20 15 2 14 7 3 2 15 5 1 2 16 13 8 17 4 2 1 18 4 2 19 4 1 1 20 1 1 21 6 6 22 8 4 1 23 1 24 4 2 25 16 12 3 26 5 4 27 3 2 1 28 2 2 29 29 28 27 30 29 18 5
AFOG
KOD
AFOG
KOD
AFOG
KOD
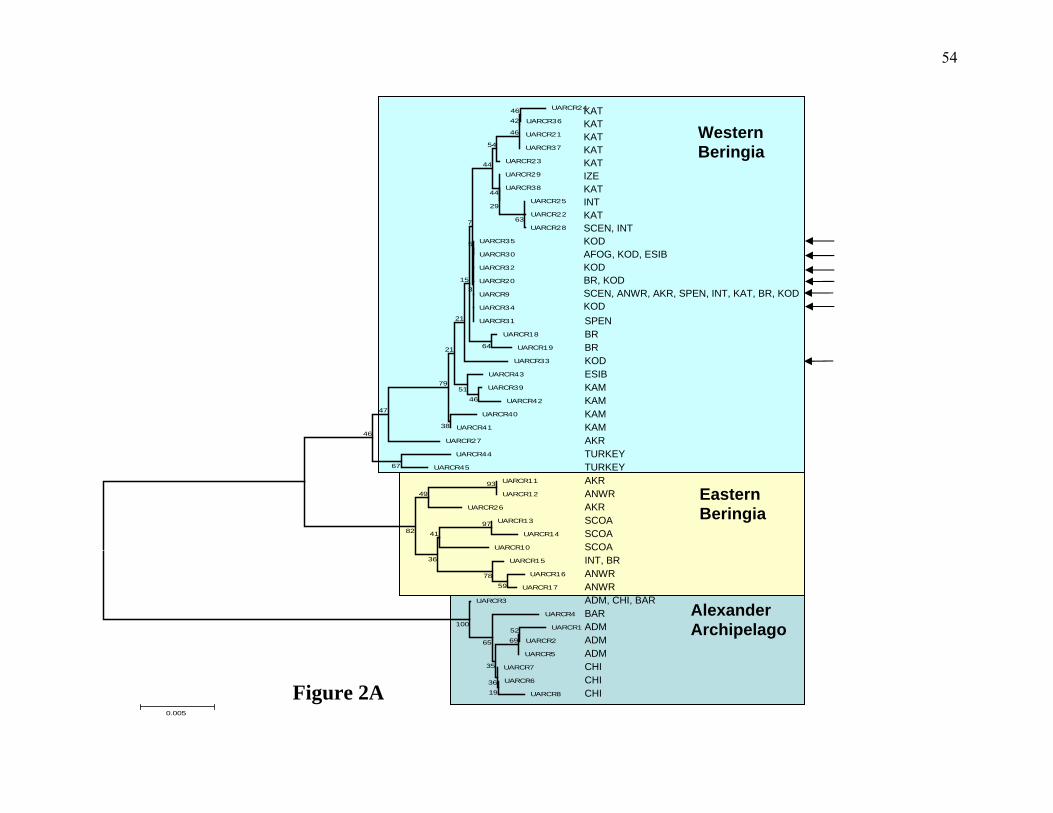
54
UARCR24
UARCR36
UARCR21
UARCR37
UARCR23
UARCR29
UARCR38
UARCR25
UARCR22
UARCR28
UARCR35
UARCR30
UARCR32
UARCR20
UARCR9
UARCR34
UARCR31
UARCR18
UARCR19
UARCR33
UARCR43
UARCR39
UARCR42
UARCR40
UARCR41
UARCR27
UARCR44
UARCR45
UARCR11
UARCR12
UARCR26
UARCR13
UARCR14
UARCR10
UARCR15
UARCR16
UARCR17
UARCR3
UARCR4
UARCR1
UARCR2
UARCR5
UARCR7
UARCR6
UARCR8
5269
1936
35
65
100
93
97
5978
82 41
36
49
67
46
47
46
63
4642
46
64
51
38
54
44
29
44
79
21
15
21
3
7
5
0.005
SPEN BR BR KOD ESIB KAM KAM KAM KAM AKR TURKEY TURKEY AKR ANWR AKR SCOA SCOA SCOA INT, BR ANWR ANWR ADM, CHI, BAR BAR ADM ADM ADM CHI CHI CHI
Eastern Beringia
Western Beringia
Alexander Archipelago
Figure 2A
KAT KAT KAT KAT KAT IZE KAT INT KAT SCEN, INT KOD AFOG, KOD, ESIB KOD BR, KOD SCEN, ANWR, AKR, SPEN, INT, KAT, BR, KOD KOD
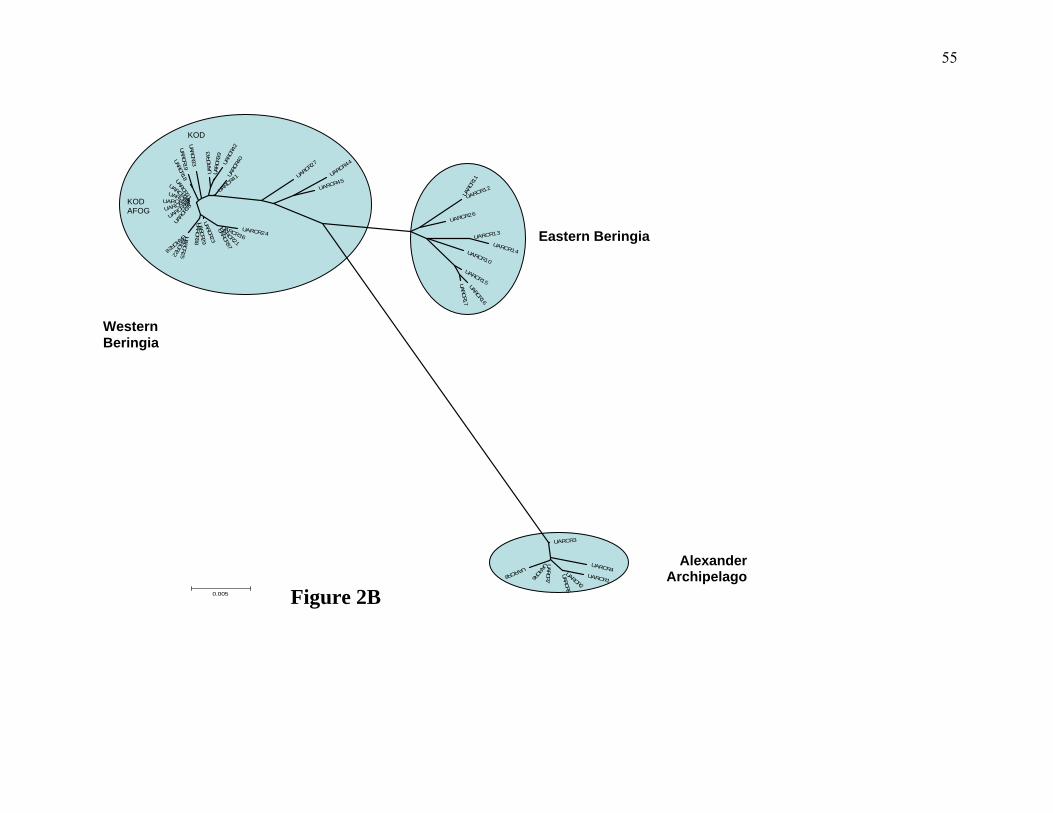
55
UARCR24
UARCR36
UARCR21
UARCR37
UARCR23
UARCR29
UARCR38
UARCR25
UARCR22
UARCR28
UARCR35
UARCR30
UARCR3
2UARCR20
UARCR9
UARCR34
UARCR31
UARCR18
UARCR19
UARCR33
UARCR43
UARCR39
UARCR42
UARCR40
UARCR41 U
ARCR27
UARCR44
UARCR
45
UARCR11
UARCR12
UARCR
26
UARCR13
UARCR14 UARCR10
UARCR15 UARCR16
UARCR17
UARCR3
UARCR4 UARCR1
UARCR2
UARCR5
UARCR7
UARCR6
UARCR8
0.005
Eastern Beringia
Alexander Archipelago
Western Beringia
Figure 2B
KOD AFOG
KOD
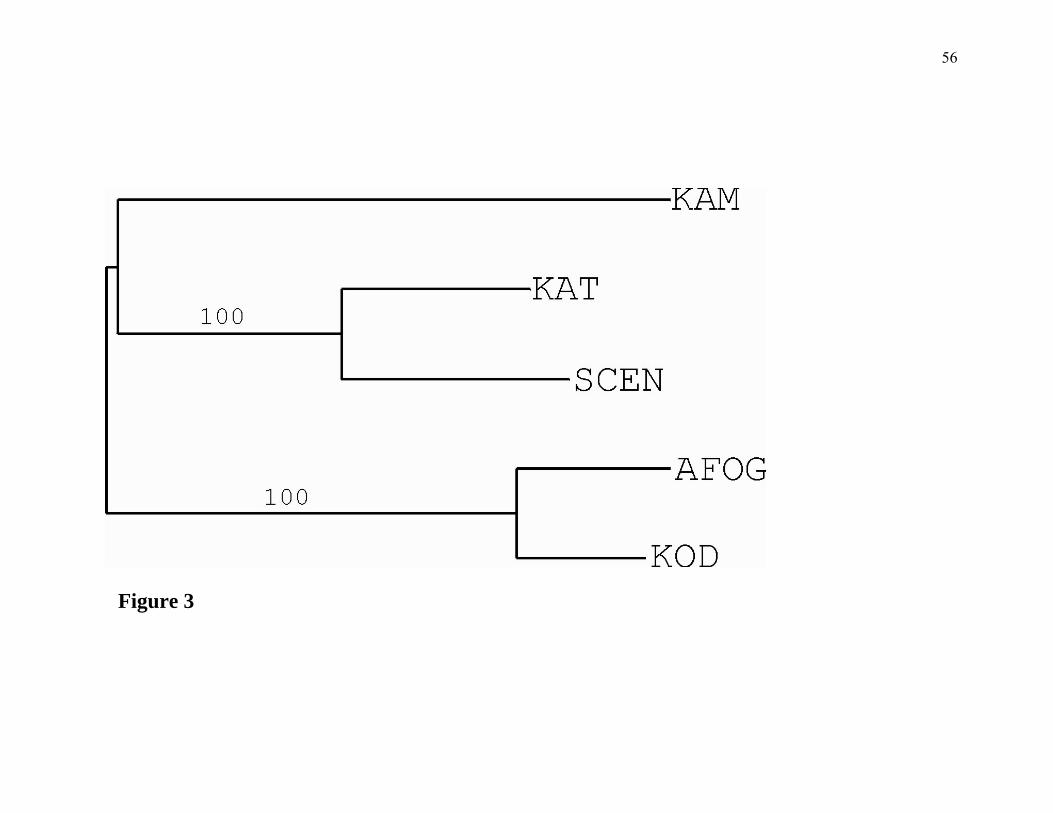
56
Figure 3
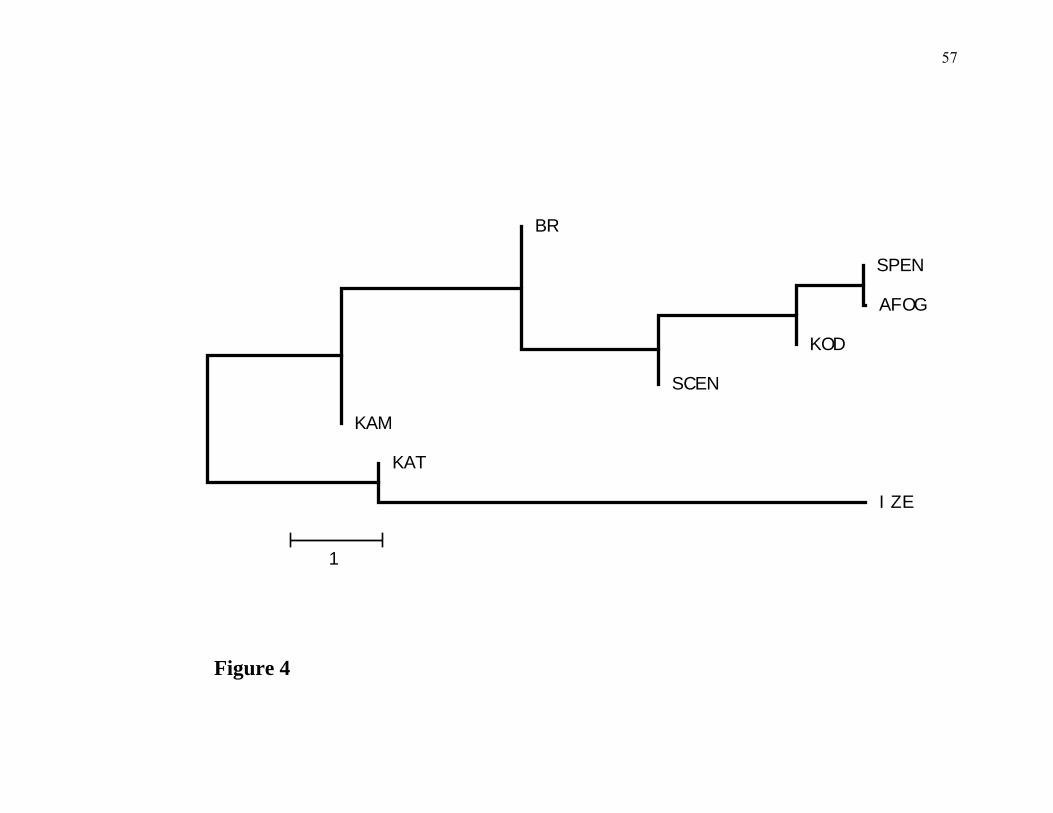
57
BR
SPEN
AFOG
KOD
SCEN
KAM
KAT
IZE
1
Figure 4
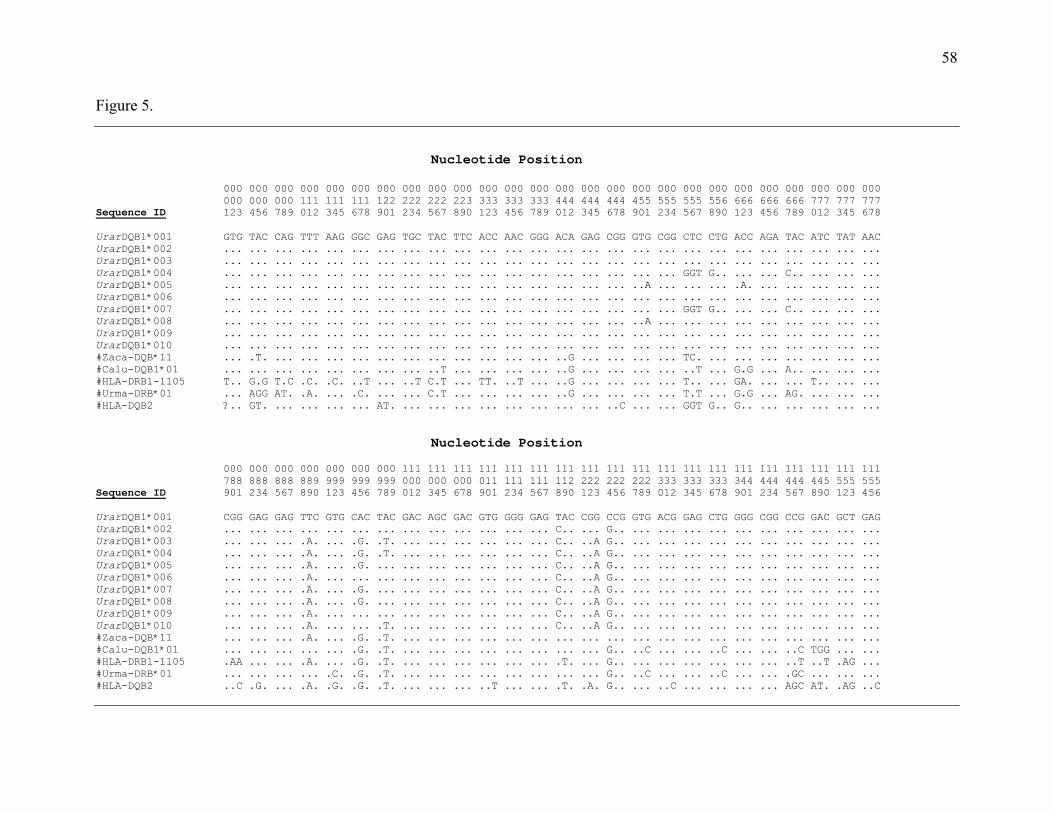
58
Figure 5. Nucleotide Position 000 000 000 000 000 000 000 000 000 000 000 000 000 000 000 000 000 000 000 000 000 000 000 000 000 000 000 000 000 111 111 111 122 222 222 223 333 333 333 444 444 444 455 555 555 556 666 666 666 777 777 777 Sequence ID 123 456 789 012 345 678 901 234 567 890 123 456 789 012 345 678 901 234 567 890 123 456 789 012 345 678 UrarDQB1*001 GTG TAC CAG TTT AAG GGC GAG TGC TAC TTC ACC AAC GGG ACA GAG CGG GTG CGG CTC CTG ACC AGA TAC ATC TAT AAC UrarDQB1*002 ... ... ... ... ... ... ... ... ... ... ... ... ... ... ... ... ... ... ... ... ... ... ... ... ... ... UrarDQB1*003 ... ... ... ... ... ... ... ... ... ... ... ... ... ... ... ... ... ... ... ... ... ... ... ... ... ... UrarDQB1*004 ... ... ... ... ... ... ... ... ... ... ... ... ... ... ... ... ... ... GGT G.. ... ... C.. ... ... ... UrarDQB1*005 ... ... ... ... ... ... ... ... ... ... ... ... ... ... ... ... ..A ... ... ... .A. ... ... ... ... ... UrarDQB1*006 ... ... ... ... ... ... ... ... ... ... ... ... ... ... ... ... ... ... ... ... ... ... ... ... ... ... UrarDQB1*007 ... ... ... ... ... ... ... ... ... ... ... ... ... ... ... ... ... ... GGT G.. ... ... C.. ... ... ... UrarDQB1*008 ... ... ... ... ... ... ... ... ... ... ... ... ... ... ... ... ..A ... ... ... ... ... ... ... ... ... UrarDQB1*009 ... ... ... ... ... ... ... ... ... ... ... ... ... ... ... ... ... ... ... ... ... ... ... ... ... ... UrarDQB1*010 ... ... ... ... ... ... ... ... ... ... ... ... ... ... ... ... ... ... ... ... ... ... ... ... ... ... #Zaca-DQB*11 ... .T. ... ... ... ... ... ... ... ... ... ... ... ..G ... ... ... ... TC. ... ... ... ... ... ... ... #Calu-DQB1*01 ... ... ... ... ... ... ... ... ..T ... ... ... ... ..G ... ... ... ... ..T ... G.G ... A.. ... ... ... #HLA-DRB1-1105 T.. G.G T.C .C. .C. ..T ... ..T C.T ... TT. ..T ... ..G ... ... ... ... T.. ... GA. ... ... T.. ... ... #Urma-DRB*01 ... AGG AT. .A. ... .C. ... ... C.T ... ... ... ... ..G ... ... ... ... T.T ... G.G ... AG. ... ... ... #HLA-DQB2 ?.. GT. ... ... ... ... AT. ... ... ... ... ... ... ... ... ..C ... ... GGT G.. G.. ... ... ... ... ... Nucleotide Position 000 000 000 000 000 000 000 111 111 111 111 111 111 111 111 111 111 111 111 111 111 111 111 111 111 111 788 888 888 889 999 999 999 000 000 000 011 111 111 112 222 222 222 333 333 333 344 444 444 445 555 555 Sequence ID 901 234 567 890 123 456 789 012 345 678 901 234 567 890 123 456 789 012 345 678 901 234 567 890 123 456 UrarDQB1*001 CGG GAG GAG TTC GTG CAC TAC GAC AGC GAC GTG GGG GAG TAC CGG CCG GTG ACG GAG CTG GGG CGG CCG GAC GCT GAG UrarDQB1*002 ... ... ... ... ... ... ... ... ... ... ... ... ... C.. ... G.. ... ... ... ... ... ... ... ... ... ... UrarDQB1*003 ... ... ... .A. ... .G. .T. ... ... ... ... ... ... C.. ..A G.. ... ... ... ... ... ... ... ... ... ... UrarDQB1*004 ... ... ... .A. ... .G. .T. ... ... ... ... ... ... C.. ..A G.. ... ... ... ... ... ... ... ... ... ... UrarDQB1*005 ... ... ... .A. ... .G. ... ... ... ... ... ... ... C.. ..A G.. ... ... ... ... ... ... ... ... ... ... UrarDQB1*006 ... ... ... .A. ... ... ... ... ... ... ... ... ... C.. ..A G.. ... ... ... ... ... ... ... ... ... ... UrarDQB1*007 ... ... ... .A. ... .G. ... ... ... ... ... ... ... C.. ..A G.. ... ... ... ... ... ... ... ... ... ... UrarDQB1*008 ... ... ... .A. ... .G. ... ... ... ... ... ... ... C.. ..A G.. ... ... ... ... ... ... ... ... ... ... UrarDQB1*009 ... ... ... .A. ... ... ... ... ... ... ... ... ... C.. ..A G.. ... ... ... ... ... ... ... ... ... ... UrarDQB1*010 ... ... ... .A. ... ... .T. ... ... ... ... ... ... C.. ..A G.. ... ... ... ... ... ... ... ... ... ... #Zaca-DQB*11 ... ... ... .A. ... .G. .T. ... ... ... ... ... ... ... ... ... ... ... ... ... ... ... ... ... ... ... #Calu-DQB1*01 ... ... ... ... ... .G. .T. ... ... ... ... ... ... ... ... G.. ..C ... ... ..C ... ... ..C TGG ... ... #HLA-DRB1-1105 .AA ... ... .A. ... .G. .T. ... ... ... ... ... ... .T. ... G.. ... ... ... ... ... ... ..T ..T .AG ... #Urma-DRB*01 ... ... ... ... .C. .G. .T. ... ... ... ... ... ... ... ... G.. ..C ... ... ..C ... ... .GC ... ... ... #HLA-DQB2 ..C .G. ... .A. .G. .G. .T. ... ... ... ..T ... ... .T. .A. G.. ... ..C ... ... ... ... AGC AT. .AG ..C

59
Figure 5. Continued. Nucleotide Position 111 111 111 111 111 111 111 111 111 111 111 111 111 111 122 222 222 222 222 222 222 222 222 222 555 666 666 666 677 777 777 778 888 888 888 999 999 999 900 000 000 001 111 111 111 222 222 222 Sequence ID 789 012 345 678 901 234 567 890 123 456 789 012 345 678 901 234 567 890 123 456 789 012 345 678 UrarDQB1*001 TAC TTC AAC CAG CAG AAG GAC ATC ATG GAG CAG ACG CGG GCC GAG GTG GAC ACG GTG TGC AGA CAC AAC TAC UrarDQB1*002 ... ... ... ... ... ... ... ... ... ... ... ... ... ... .C. ... ... ... ... ... ... ... ... ... UrarDQB1*003 ... .GG ... ... ... ... ... T.. ... ... ... ... ... ... .C. ... ... ... ... ... ... ... ... ... UrarDQB1*004 ... .GG ... ... ... ... ... T.. ... ... ... ... ... ... .C. ... ... ... ... ... ... ... ... ... UrarDQB1*005 ... ... ... ... ... ... ... T.. ... ... ... ... ... ... .C. ... ... ... ... ... ... ... ... ... UrarDQB1*006 ... ... ... ... ... ... ... T.. ... ... ... ... ... ... .C. ... ... ... ... ... ... ... ... ... UrarDQB1*007 ... .GG ... ... ... ... ... T.. ... ... ... ... ... ... .C. ... ... ... ... ... ... ... ... ... UrarDQB1*008 ... ... ... ... ... ... ... T.. ... ... ... ... ... ... .C. ... ... ... ... ... ... ... ... ... UrarDQB1*009 ... .GG ... ... ... ... ... T.. ... ... ... ... ... ... .C. ... ... ... ... ... ... ... ... ... UrarDQB1*010 ... .GG ... ... ... ... ... ... ... ... ... ... ... ... .C. ... ... ... ... ... ... ... ... ... #Zaca-DQB*11 ... .GG ..T AGC ... ... ... ... C.. ... .G. ... ... ... ... .C. ... ... ... ... ... ... ... ..T #Calu-DQB1*01 ... .GG ... GG. ... ... ..G ... T.. ... .G. .A. ... ... ... C.. ... ... ... ... ... ... ... ... #HLA-DRB1-1105 ... .GG ... AGC ... ... ... T.. C.. ..A G.C .G. ... ... .C. ... ... ..C TAC ... ... ... ... ... #Urma-DRB*01 .C. .GG ... .C. ... ... ..G C.. T.. ... .G. G.. ... ... .C. ... ... ..C TAC ... ... ... ... ... #HLA-DQB2 .GG AA. ... T.T A.. G.C TT. T.G GA. C.. G.. CG. GCC ..G .T. .AC A.G GT. TGC A.A CAC A.. T.. G.G
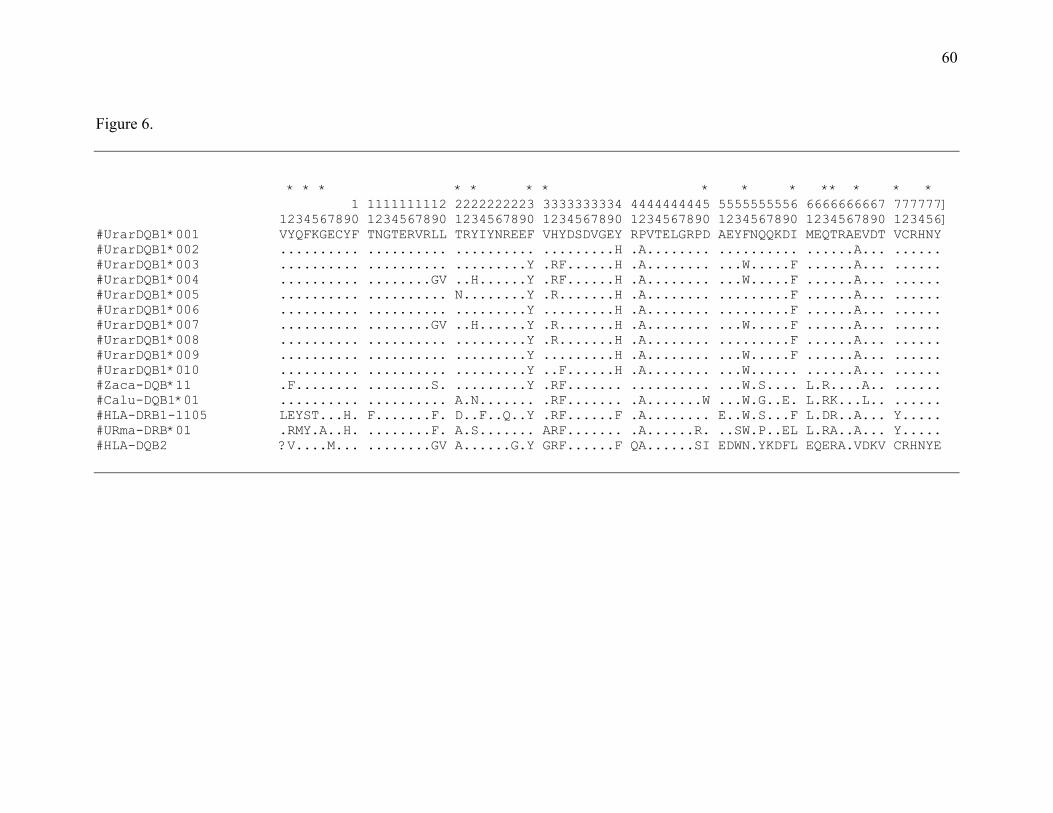
60
Figure 6. * * * * * * * * * * ** * * * 1 1111111112 2222222223 3333333334 4444444445 5555555556 6666666667 777777] 1234567890 1234567890 1234567890 1234567890 1234567890 1234567890 1234567890 123456] #UrarDQB1*001 VYQFKGECYF TNGTERVRLL TRYIYNREEF VHYDSDVGEY RPVTELGRPD AEYFNQQKDI MEQTRAEVDT VCRHNY #UrarDQB1*002 .......... .......... .......... .........H .A........ .......... ......A... ...... #UrarDQB1*003 .......... .......... .........Y .RF......H .A........ ...W.....F ......A... ...... #UrarDQB1*004 .......... ........GV ..H......Y .RF......H .A........ ...W.....F ......A... ...... #UrarDQB1*005 .......... .......... N........Y .R.......H .A........ .........F ......A... ...... #UrarDQB1*006 .......... .......... .........Y .........H .A........ .........F ......A... ...... #UrarDQB1*007 .......... ........GV ..H......Y .R.......H .A........ ...W.....F ......A... ...... #UrarDQB1*008 .......... .......... .........Y .R.......H .A........ .........F ......A... ...... #UrarDQB1*009 .......... .......... .........Y .........H .A........ ...W.....F ......A... ...... #UrarDQB1*010 .......... .......... .........Y ..F......H .A........ ...W...... ......A... ...... #Zaca-DQB*11 .F........ ........S. .........Y .RF....... .......... ...W.S.... L.R....A.. ...... #Calu-DQB1*01 .......... .......... A.N....... .RF....... .A.......W ...W.G..E. L.RK...L.. ...... #HLA-DRB1-1105 LEYST...H. F.......F. D..F..Q..Y .RF......F .A........ E..W.S...F L.DR..A... Y..... #URma-DRB*01 .RMY.A..H. ........F. A.S....... ARF....... .A......R. ..SW.P..EL L.RA..A... Y..... #HLA-DQB2 ?V....M... ........GV A......G.Y GRF......F QA......SI EDWN.YKDFL EQERA.VDKV CRHNYE
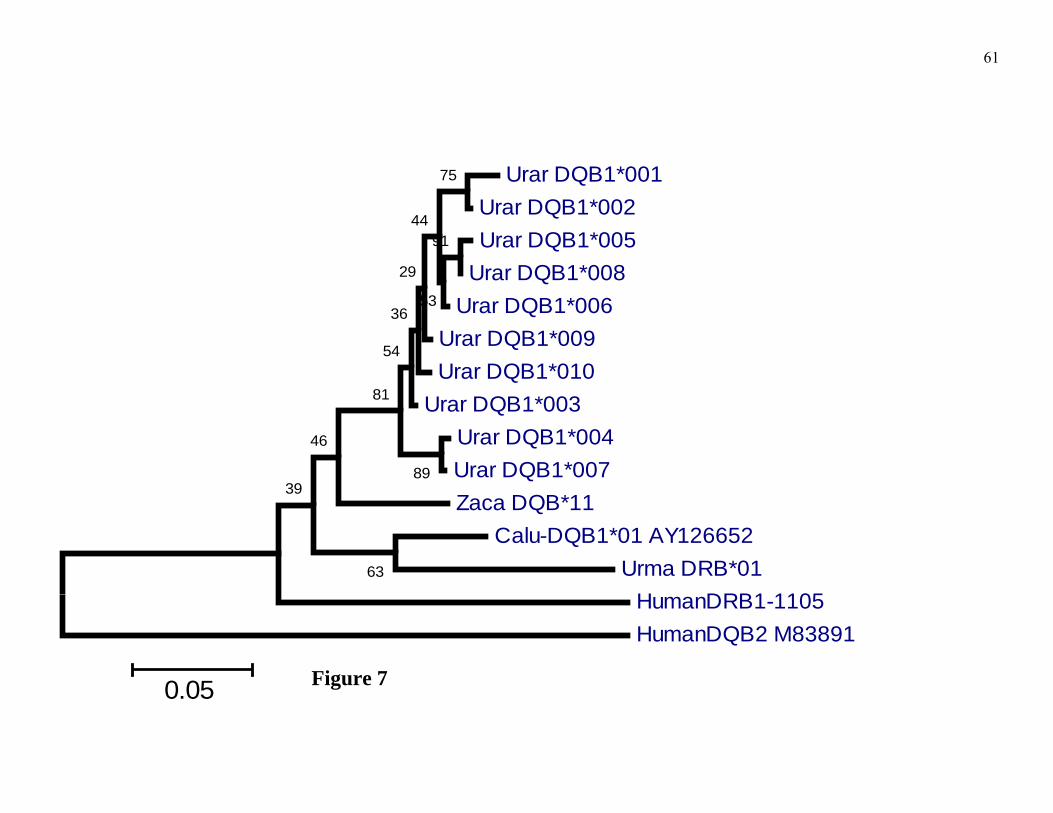
61
Urar DQB1*001 Urar DQB1*002 Urar DQB1*005
Urar DQB1*008 Urar DQB1*006
Urar DQB1*009 Urar DQB1*010
Urar DQB1*003 Urar DQB1*004 Urar DQB1*007 Zaca DQB*11
Calu-DQB1*01 AY126652 Urma DRB*01
HumanDRB1-1105 HumanDQB2 M83891
63
39
46
89
75
91
81
53
44
54
36
29
0.05 Figure 7
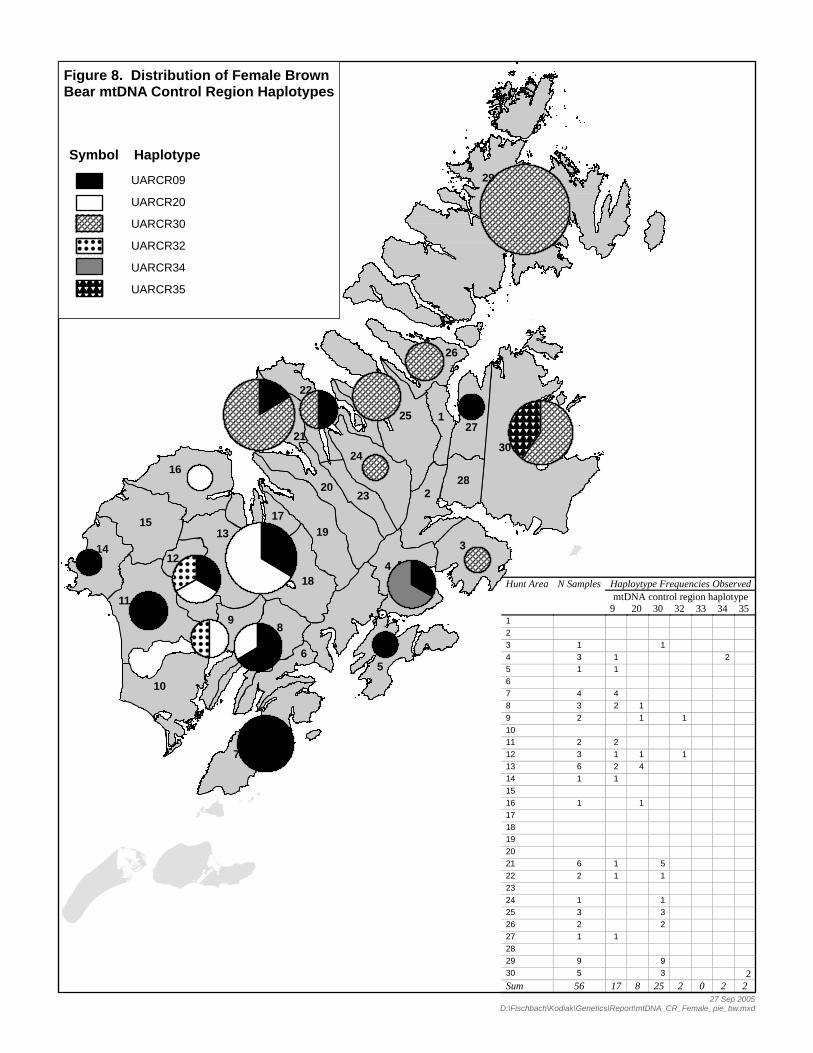
# ## # ## # # ## # # # ## # # # ## # # # ## # # # ## # # # #
# # # #
29
30
7
4
5
3
8
11
2
9
25
16
10
18
151913
24
20
6
21
26
1412
127
22
2823
17
Figure 8. Distribution of Female Brown Bear mtDNA Control Region Haplotypes
UARCR09
UARCR20
UARCR30
UARCR32
UARCR34
UARCR35# # # ## # # ## # # #
Symbol Haplotype
Haploytype Frequencies ObservedmtDNA control region haplotype
Hunt Area N Samples
9 20 30 32 33 34 35 1 2 3 1 14 3 1 25 1 1 6 7 4 4 8 3 2 1 9 2 1 110 11 2 2 12 3 1 1 113 6 2 4 14 1 1 15 16 1 1 17 18 19 20 21 6 1 522 2 1 123 24 1 125 3 326 2 227 1 1 28 29 9 930 5 3 2Sum 56 17 8 25 2 0 2 2 27 Sep 2005
D:\Fischbach\Kodiak\Genetics\Report\mtDNA_CR_Female_pie_bw.mxd
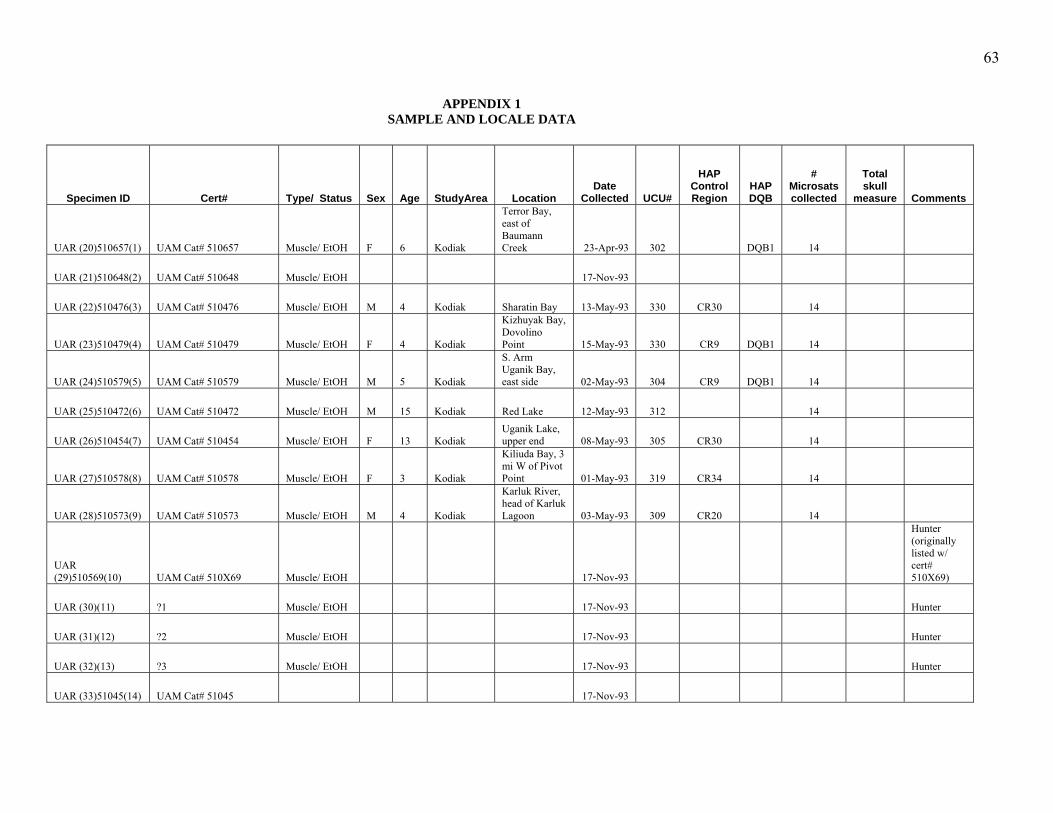
63
APPENDIX 1 SAMPLE AND LOCALE DATA
Specimen ID Cert# Type/ Status Sex Age StudyArea Location Date
Collected UCU#
HAP Control Region
HAP DQB
# Microsats collected
Total skull
measure Comments
UAR (20)510657(1) UAM Cat# 510657 Muscle/ EtOH F 6 Kodiak
Terror Bay, east of Baumann Creek 23-Apr-93 302 DQB1 14
UAR (21)510648(2) UAM Cat# 510648 Muscle/ EtOH 17-Nov-93
UAR (22)510476(3) UAM Cat# 510476 Muscle/ EtOH M 4 Kodiak Sharatin Bay 13-May-93 330 CR30 14
UAR (23)510479(4) UAM Cat# 510479 Muscle/ EtOH F 4 Kodiak
Kizhuyak Bay, Dovolino Point 15-May-93 330 CR9 DQB1 14
UAR (24)510579(5) UAM Cat# 510579 Muscle/ EtOH M 5 Kodiak
S. Arm Uganik Bay, east side 02-May-93 304 CR9 DQB1 14
UAR (25)510472(6) UAM Cat# 510472 Muscle/ EtOH M 15 Kodiak Red Lake 12-May-93 312 14
UAR (26)510454(7) UAM Cat# 510454 Muscle/ EtOH F 13 Kodiak Uganik Lake, upper end 08-May-93 305 CR30 14
UAR (27)510578(8) UAM Cat# 510578 Muscle/ EtOH F 3 Kodiak
Kiliuda Bay, 3 mi W of Pivot Point 01-May-93 319 CR34 14
UAR (28)510573(9) UAM Cat# 510573 Muscle/ EtOH M 4 Kodiak
Karluk River, head of Karluk Lagoon 03-May-93 309 CR20 14
UAR (29)510569(10) UAM Cat# 510X69 Muscle/ EtOH 17-Nov-93
Hunter (originally listed w/ cert# 510X69)
UAR (30)(11) ?1 Muscle/ EtOH 17-Nov-93 Hunter
UAR (31)(12) ?2 Muscle/ EtOH 17-Nov-93 Hunter
UAR (32)(13) ?3 Muscle/ EtOH 17-Nov-93 Hunter
UAR (33)51045(14) UAM Cat# 51045 17-Nov-93
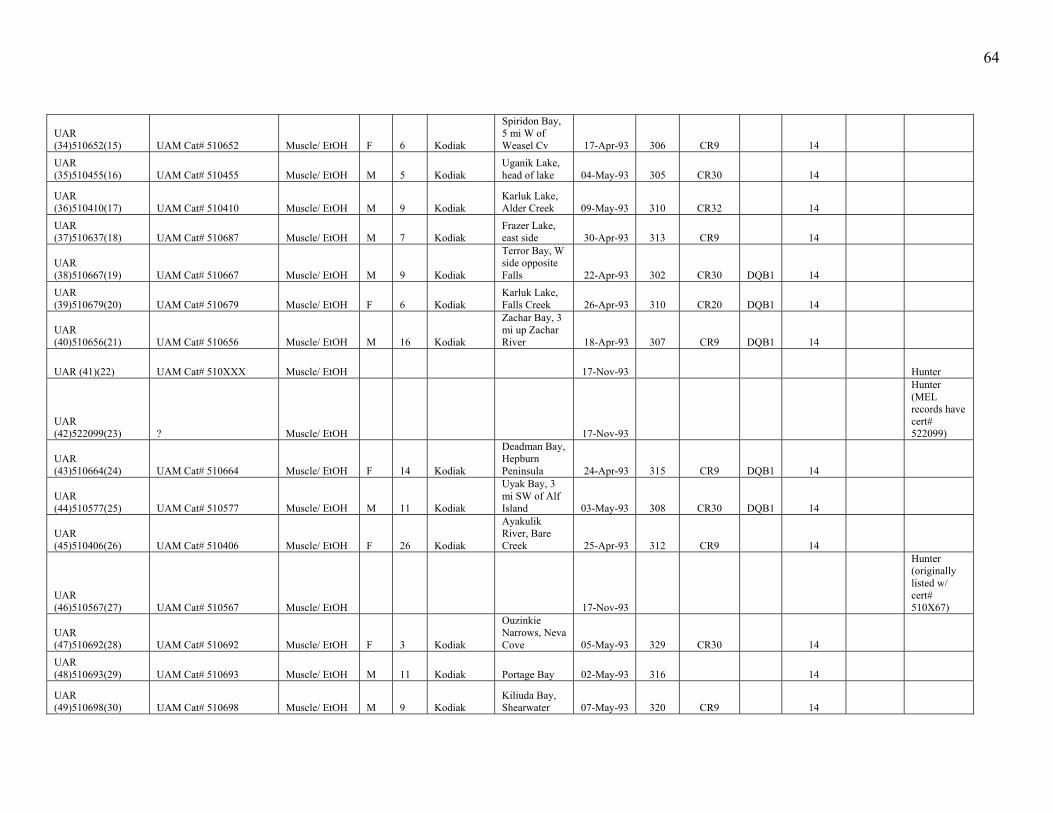
64
UAR (34)510652(15) UAM Cat# 510652 Muscle/ EtOH F 6 Kodiak
Spiridon Bay, 5 mi W of Weasel Cv 17-Apr-93 306 CR9 14
UAR (35)510455(16) UAM Cat# 510455 Muscle/ EtOH M 5 Kodiak
Uganik Lake, head of lake 04-May-93 305 CR30 14
UAR (36)510410(17) UAM Cat# 510410 Muscle/ EtOH M 9 Kodiak
Karluk Lake, Alder Creek 09-May-93 310 CR32 14
UAR (37)510637(18) UAM Cat# 510687 Muscle/ EtOH M 7 Kodiak
Frazer Lake, east side 30-Apr-93 313 CR9 14
UAR (38)510667(19) UAM Cat# 510667 Muscle/ EtOH M 9 Kodiak
Terror Bay, W side opposite Falls 22-Apr-93 302 CR30 DQB1 14
UAR (39)510679(20) UAM Cat# 510679 Muscle/ EtOH F 6 Kodiak
Karluk Lake, Falls Creek 26-Apr-93 310 CR20 DQB1 14
UAR (40)510656(21) UAM Cat# 510656 Muscle/ EtOH M 16 Kodiak
Zachar Bay, 3 mi up Zachar River 18-Apr-93 307 CR9 DQB1 14
UAR (41)(22) UAM Cat# 510XXX Muscle/ EtOH 17-Nov-93 Hunter
UAR (42)522099(23) ? Muscle/ EtOH 17-Nov-93
Hunter (MEL records have cert# 522099)
UAR (43)510664(24) UAM Cat# 510664 Muscle/ EtOH F 14 Kodiak
Deadman Bay, Hepburn Peninsula 24-Apr-93 315 CR9 DQB1 14
UAR (44)510577(25) UAM Cat# 510577 Muscle/ EtOH M 11 Kodiak
Uyak Bay, 3 mi SW of Alf Island 03-May-93 308 CR30 DQB1 14
UAR (45)510406(26) UAM Cat# 510406 Muscle/ EtOH F 26 Kodiak
Ayakulik River, Bare Creek 25-Apr-93 312 CR9 14
UAR (46)510567(27) UAM Cat# 510567 Muscle/ EtOH 17-Nov-93
Hunter (originally listed w/ cert# 510X67)
UAR (47)510692(28) UAM Cat# 510692 Muscle/ EtOH F 3 Kodiak
Ouzinkie Narrows, Neva Cove 05-May-93 329 CR30 14
UAR (48)510693(29) UAM Cat# 510693 Muscle/ EtOH M 11 Kodiak Portage Bay 02-May-93 316 14
UAR (49)510698(30) UAM Cat# 510698 Muscle/ EtOH M 9 Kodiak
Kiliuda Bay, Shearwater 07-May-93 320 CR9 14
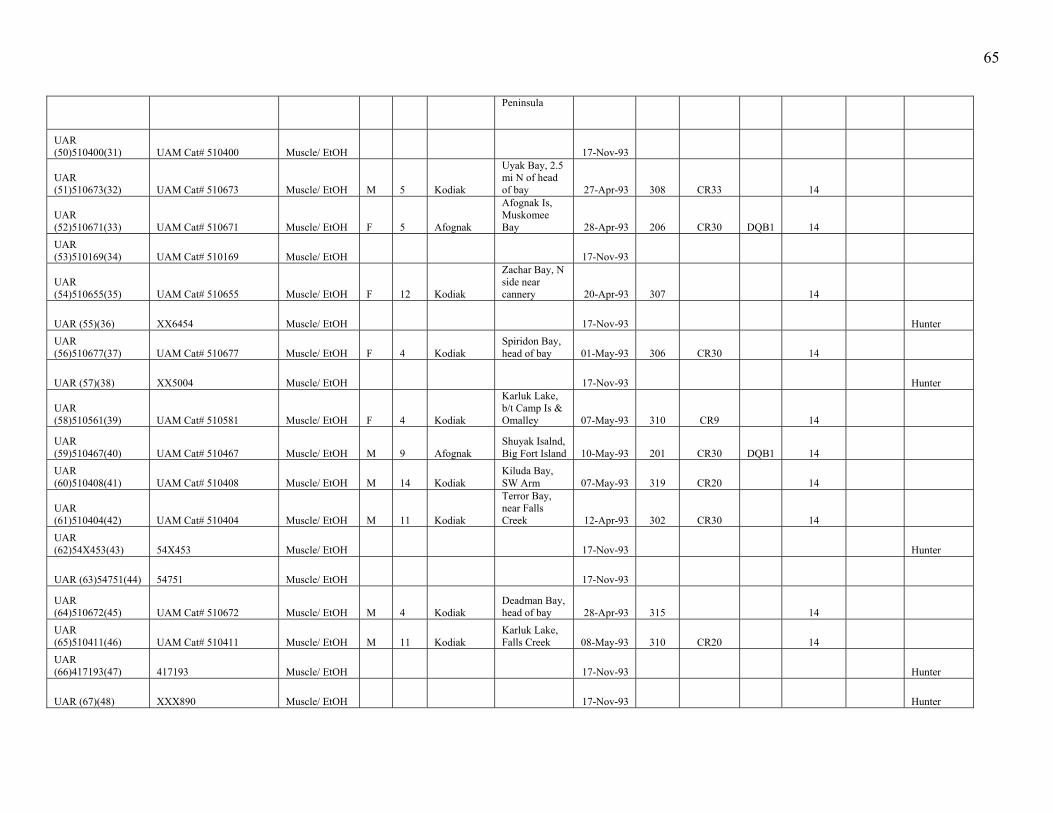
65
Peninsula
UAR (50)510400(31) UAM Cat# 510400 Muscle/ EtOH 17-Nov-93
UAR (51)510673(32) UAM Cat# 510673 Muscle/ EtOH M 5 Kodiak
Uyak Bay, 2.5 mi N of head of bay 27-Apr-93 308 CR33 14
UAR (52)510671(33) UAM Cat# 510671 Muscle/ EtOH F 5 Afognak
Afognak Is, Muskomee Bay 28-Apr-93 206 CR30 DQB1 14
UAR (53)510169(34) UAM Cat# 510169 Muscle/ EtOH 17-Nov-93
UAR (54)510655(35) UAM Cat# 510655 Muscle/ EtOH F 12 Kodiak
Zachar Bay, N side near cannery 20-Apr-93 307 14
UAR (55)(36) XX6454 Muscle/ EtOH 17-Nov-93 Hunter UAR (56)510677(37) UAM Cat# 510677 Muscle/ EtOH F 4 Kodiak
Spiridon Bay, head of bay 01-May-93 306 CR30 14
UAR (57)(38) XX5004 Muscle/ EtOH 17-Nov-93 Hunter
UAR (58)510561(39) UAM Cat# 510581 Muscle/ EtOH F 4 Kodiak
Karluk Lake, b/t Camp Is & Omalley 07-May-93 310 CR9 14
UAR (59)510467(40) UAM Cat# 510467 Muscle/ EtOH M 9 Afognak
Shuyak Isalnd, Big Fort Island 10-May-93 201 CR30 DQB1 14
UAR (60)510408(41) UAM Cat# 510408 Muscle/ EtOH M 14 Kodiak
Kiluda Bay, SW Arm 07-May-93 319 CR20 14
UAR (61)510404(42) UAM Cat# 510404 Muscle/ EtOH M 11 Kodiak
Terror Bay, near Falls Creek 12-Apr-93 302 CR30 14
UAR (62)54X453(43) 54X453 Muscle/ EtOH 17-Nov-93 Hunter
UAR (63)54751(44) 54751 Muscle/ EtOH 17-Nov-93
UAR (64)510672(45) UAM Cat# 510672 Muscle/ EtOH M 4 Kodiak
Deadman Bay, head of bay 28-Apr-93 315 14
UAR (65)510411(46) UAM Cat# 510411 Muscle/ EtOH M 11 Kodiak
Karluk Lake, Falls Creek 08-May-93 310 CR20 14
UAR (66)417193(47) 417193 Muscle/ EtOH 17-Nov-93 Hunter
UAR (67)(48) XXX890 Muscle/ EtOH 17-Nov-93 Hunter
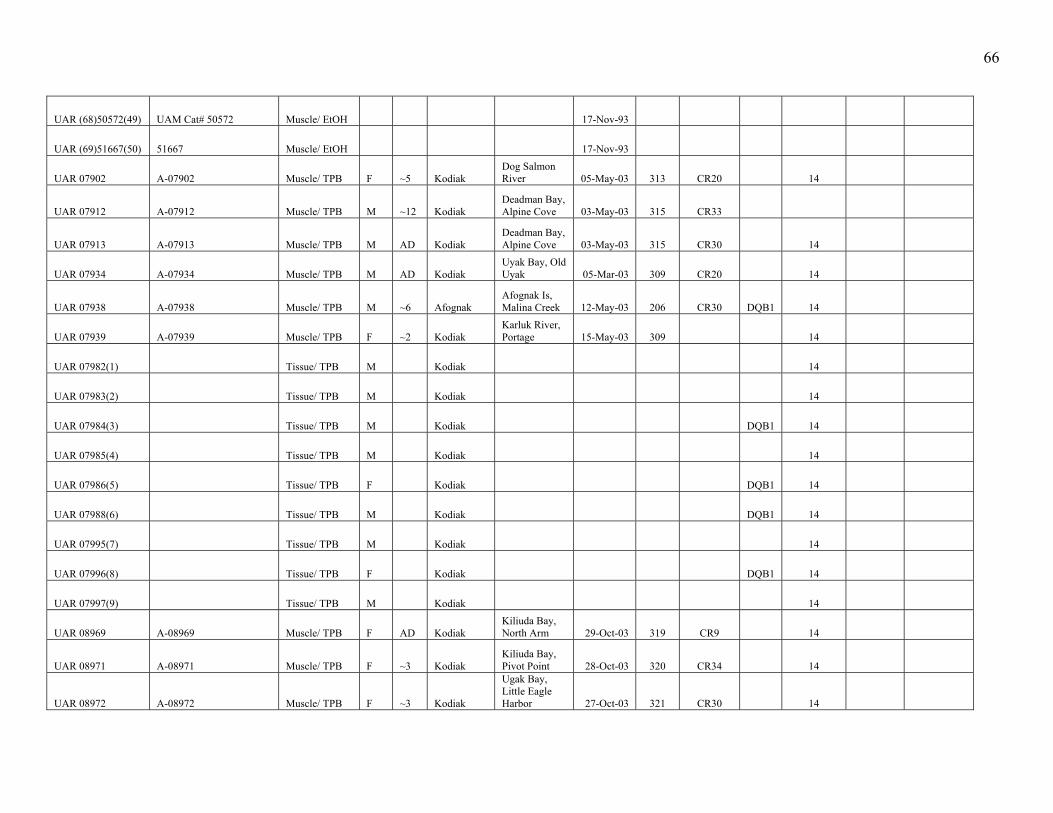
66
UAR (68)50572(49) UAM Cat# 50572 Muscle/ EtOH 17-Nov-93
UAR (69)51667(50) 51667 Muscle/ EtOH 17-Nov-93
UAR 07902 A-07902 Muscle/ TPB F ~5 Kodiak Dog Salmon River 05-May-03 313 CR20 14
UAR 07912 A-07912 Muscle/ TPB M ~12 Kodiak Deadman Bay, Alpine Cove 03-May-03 315 CR33
UAR 07913 A-07913 Muscle/ TPB M AD Kodiak Deadman Bay, Alpine Cove 03-May-03 315 CR30 14
UAR 07934 A-07934 Muscle/ TPB M AD Kodiak Uyak Bay, Old Uyak 05-Mar-03 309 CR20 14
UAR 07938 A-07938 Muscle/ TPB M ~6 Afognak Afognak Is, Malina Creek 12-May-03 206 CR30 DQB1 14
UAR 07939 A-07939 Muscle/ TPB F ~2 Kodiak Karluk River, Portage 15-May-03 309 14
UAR 07982(1) Tissue/ TPB M Kodiak 14
UAR 07983(2) Tissue/ TPB M Kodiak 14
UAR 07984(3) Tissue/ TPB M Kodiak DQB1 14
UAR 07985(4) Tissue/ TPB M Kodiak 14
UAR 07986(5) Tissue/ TPB F Kodiak DQB1 14
UAR 07988(6) Tissue/ TPB M Kodiak DQB1 14
UAR 07995(7) Tissue/ TPB M Kodiak 14
UAR 07996(8) Tissue/ TPB F Kodiak DQB1 14
UAR 07997(9) Tissue/ TPB M Kodiak 14
UAR 08969 A-08969 Muscle/ TPB F AD Kodiak Kiliuda Bay, North Arm 29-Oct-03 319 CR9 14
UAR 08971 A-08971 Muscle/ TPB F ~3 Kodiak Kiliuda Bay, Pivot Point 28-Oct-03 320 CR34 14
UAR 08972 A-08972 Muscle/ TPB F ~3 Kodiak
Ugak Bay, Little Eagle Harbor 27-Oct-03 321 CR30 14
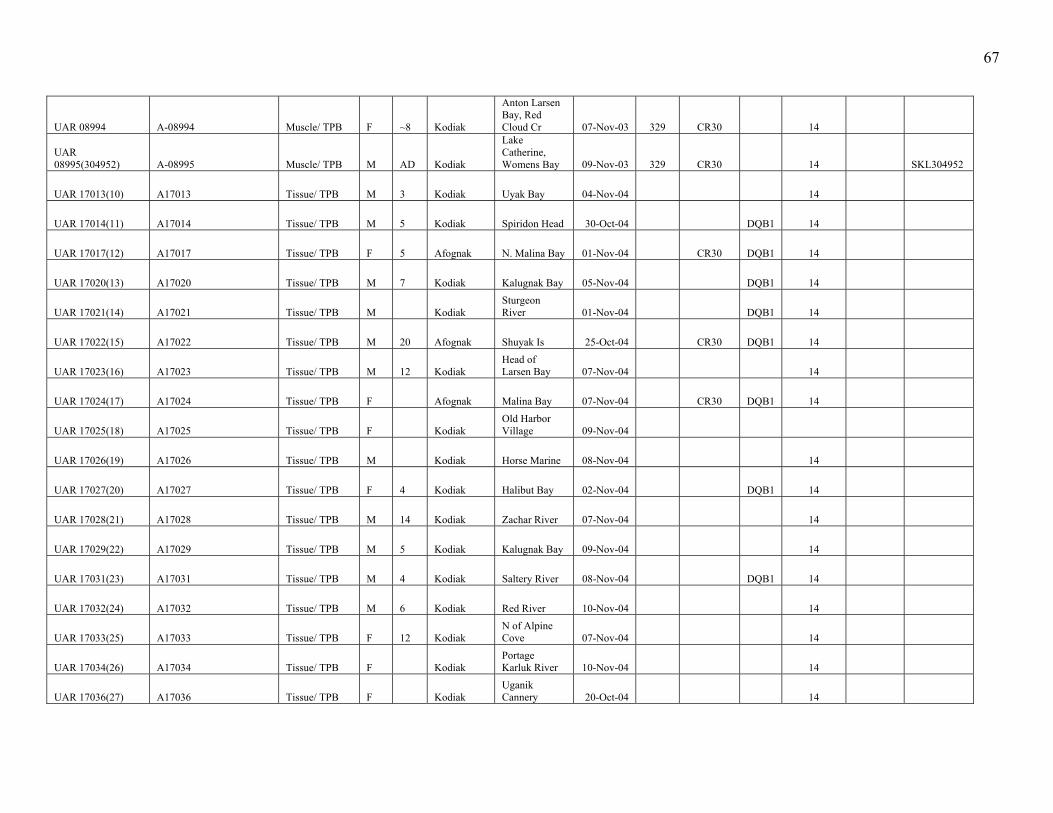
67
UAR 08994 A-08994 Muscle/ TPB F ~8 Kodiak
Anton Larsen Bay, Red Cloud Cr 07-Nov-03 329 CR30 14
UAR 08995(304952) A-08995 Muscle/ TPB M AD Kodiak
Lake Catherine, Womens Bay 09-Nov-03 329 CR30 14 SKL304952
UAR 17013(10) A17013 Tissue/ TPB M 3 Kodiak Uyak Bay 04-Nov-04 14
UAR 17014(11) A17014 Tissue/ TPB M 5 Kodiak Spiridon Head 30-Oct-04 DQB1 14
UAR 17017(12) A17017 Tissue/ TPB F 5 Afognak N. Malina Bay 01-Nov-04 CR30 DQB1 14
UAR 17020(13) A17020 Tissue/ TPB M 7 Kodiak Kalugnak Bay 05-Nov-04 DQB1 14
UAR 17021(14) A17021 Tissue/ TPB M Kodiak Sturgeon River 01-Nov-04 DQB1 14
UAR 17022(15) A17022 Tissue/ TPB M 20 Afognak Shuyak Is 25-Oct-04 CR30 DQB1 14
UAR 17023(16) A17023 Tissue/ TPB M 12 Kodiak Head of Larsen Bay 07-Nov-04 14
UAR 17024(17) A17024 Tissue/ TPB F Afognak Malina Bay 07-Nov-04 CR30 DQB1 14
UAR 17025(18) A17025 Tissue/ TPB F Kodiak Old Harbor Village 09-Nov-04
UAR 17026(19) A17026 Tissue/ TPB M Kodiak Horse Marine 08-Nov-04 14
UAR 17027(20) A17027 Tissue/ TPB F 4 Kodiak Halibut Bay 02-Nov-04 DQB1 14
UAR 17028(21) A17028 Tissue/ TPB M 14 Kodiak Zachar River 07-Nov-04 14
UAR 17029(22) A17029 Tissue/ TPB M 5 Kodiak Kalugnak Bay 09-Nov-04 14
UAR 17031(23) A17031 Tissue/ TPB M 4 Kodiak Saltery River 08-Nov-04 DQB1 14
UAR 17032(24) A17032 Tissue/ TPB M 6 Kodiak Red River 10-Nov-04 14
UAR 17033(25) A17033 Tissue/ TPB F 12 Kodiak N of Alpine Cove 07-Nov-04 14
UAR 17034(26) A17034 Tissue/ TPB F Kodiak Portage Karluk River 10-Nov-04 14
UAR 17036(27) A17036 Tissue/ TPB F Kodiak Uganik Cannery 20-Oct-04 14
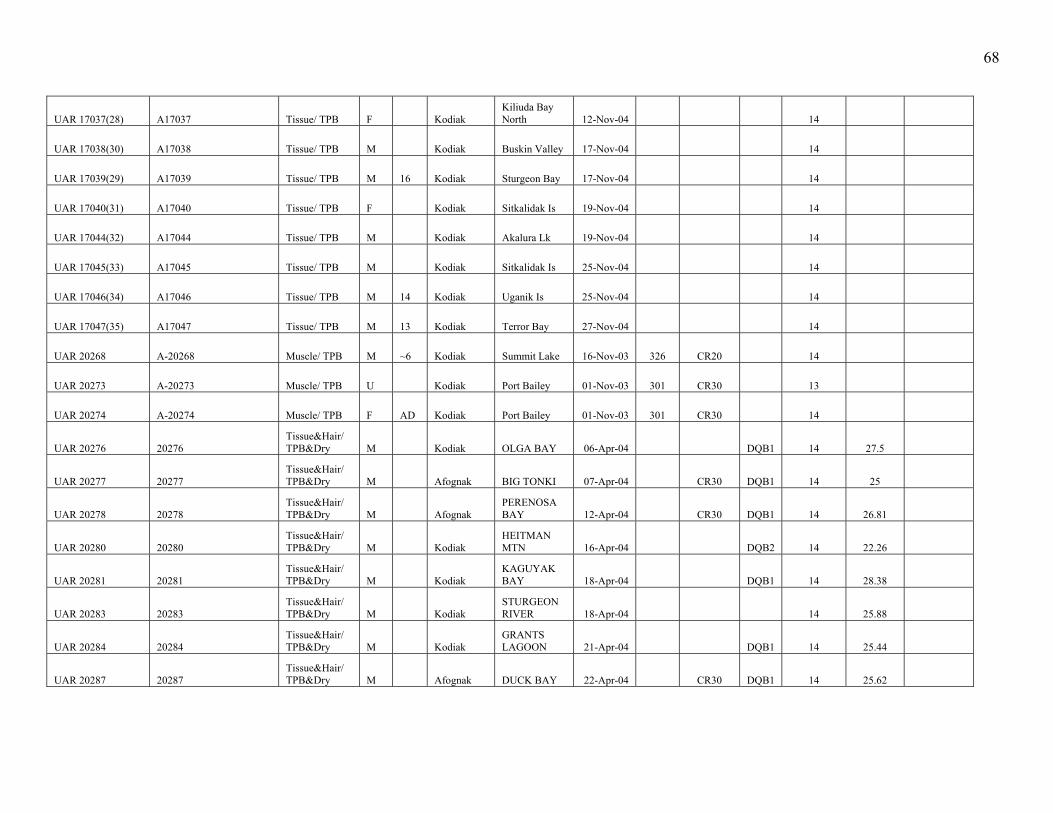
68
UAR 17037(28) A17037 Tissue/ TPB F Kodiak Kiliuda Bay North 12-Nov-04 14
UAR 17038(30) A17038 Tissue/ TPB M Kodiak Buskin Valley 17-Nov-04 14
UAR 17039(29) A17039 Tissue/ TPB M 16 Kodiak Sturgeon Bay 17-Nov-04 14
UAR 17040(31) A17040 Tissue/ TPB F Kodiak Sitkalidak Is 19-Nov-04 14
UAR 17044(32) A17044 Tissue/ TPB M Kodiak Akalura Lk 19-Nov-04 14
UAR 17045(33) A17045 Tissue/ TPB M Kodiak Sitkalidak Is 25-Nov-04 14
UAR 17046(34) A17046 Tissue/ TPB M 14 Kodiak Uganik Is 25-Nov-04 14
UAR 17047(35) A17047 Tissue/ TPB M 13 Kodiak Terror Bay 27-Nov-04 14
UAR 20268 A-20268 Muscle/ TPB M ~6 Kodiak Summit Lake 16-Nov-03 326 CR20 14
UAR 20273 A-20273 Muscle/ TPB U Kodiak Port Bailey 01-Nov-03 301 CR30 13
UAR 20274 A-20274 Muscle/ TPB F AD Kodiak Port Bailey 01-Nov-03 301 CR30 14
UAR 20276 20276 Tissue&Hair/ TPB&Dry M Kodiak OLGA BAY 06-Apr-04 DQB1 14 27.5
UAR 20277 20277 Tissue&Hair/ TPB&Dry M Afognak BIG TONKI 07-Apr-04 CR30 DQB1 14 25
UAR 20278 20278 Tissue&Hair/ TPB&Dry M Afognak
PERENOSA BAY 12-Apr-04 CR30 DQB1 14 26.81
UAR 20280 20280 Tissue&Hair/ TPB&Dry M Kodiak
HEITMAN MTN 16-Apr-04 DQB2 14 22.26
UAR 20281 20281 Tissue&Hair/ TPB&Dry M Kodiak
KAGUYAK BAY 18-Apr-04 DQB1 14 28.38
UAR 20283 20283 Tissue&Hair/ TPB&Dry M Kodiak
STURGEON RIVER 18-Apr-04 14 25.88
UAR 20284 20284 Tissue&Hair/ TPB&Dry M Kodiak
GRANTS LAGOON 21-Apr-04 DQB1 14 25.44
UAR 20287 20287 Tissue&Hair/ TPB&Dry M Afognak DUCK BAY 22-Apr-04 CR30 DQB1 14 25.62
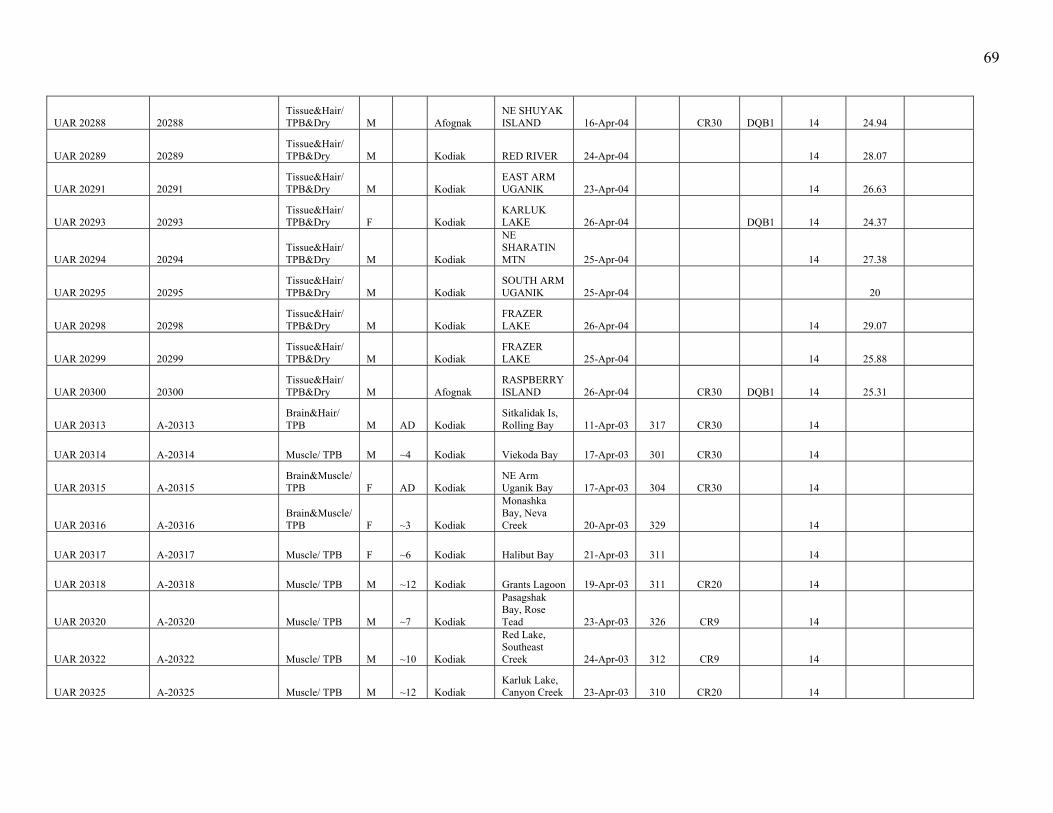
69
UAR 20288 20288 Tissue&Hair/ TPB&Dry M Afognak
NE SHUYAK ISLAND 16-Apr-04 CR30 DQB1 14 24.94
UAR 20289 20289 Tissue&Hair/ TPB&Dry M Kodiak RED RIVER 24-Apr-04 14 28.07
UAR 20291 20291 Tissue&Hair/ TPB&Dry M Kodiak
EAST ARM UGANIK 23-Apr-04 14 26.63
UAR 20293 20293 Tissue&Hair/ TPB&Dry F Kodiak
KARLUK LAKE 26-Apr-04 DQB1 14 24.37
UAR 20294 20294 Tissue&Hair/ TPB&Dry M Kodiak
NE SHARATIN MTN 25-Apr-04 14 27.38
UAR 20295 20295 Tissue&Hair/ TPB&Dry M Kodiak
SOUTH ARM UGANIK 25-Apr-04 20
UAR 20298 20298 Tissue&Hair/ TPB&Dry M Kodiak
FRAZER LAKE 26-Apr-04 14 29.07
UAR 20299 20299 Tissue&Hair/ TPB&Dry M Kodiak
FRAZER LAKE 25-Apr-04 14 25.88
UAR 20300 20300 Tissue&Hair/ TPB&Dry M Afognak
RASPBERRY ISLAND 26-Apr-04 CR30 DQB1 14 25.31
UAR 20313 A-20313 Brain&Hair/ TPB M AD Kodiak
Sitkalidak Is, Rolling Bay 11-Apr-03 317 CR30 14
UAR 20314 A-20314 Muscle/ TPB M ~4 Kodiak Viekoda Bay 17-Apr-03 301 CR30 14
UAR 20315 A-20315 Brain&Muscle/ TPB F AD Kodiak
NE Arm Uganik Bay 17-Apr-03 304 CR30 14
UAR 20316 A-20316 Brain&Muscle/ TPB F ~3 Kodiak
Monashka Bay, Neva Creek 20-Apr-03 329 14
UAR 20317 A-20317 Muscle/ TPB F ~6 Kodiak Halibut Bay 21-Apr-03 311 14
UAR 20318 A-20318 Muscle/ TPB M ~12 Kodiak Grants Lagoon 19-Apr-03 311 CR20 14
UAR 20320 A-20320 Muscle/ TPB M ~7 Kodiak
Pasagshak Bay, Rose Tead 23-Apr-03 326 CR9 14
UAR 20322 A-20322 Muscle/ TPB M ~10 Kodiak
Red Lake, Southeast Creek 24-Apr-03 312 CR9 14
UAR 20325 A-20325 Muscle/ TPB M ~12 Kodiak Karluk Lake, Canyon Creek 23-Apr-03 310 CR20 14

70
UAR 20327 A-20327 Muscle/ TPB M ~12 Afognak
Afognak Is, Paramanof Bay 26-Apr-03 204 CR30 DQB1 14
UAR 20329 A-20329 Muscle/ TPB M AD Kodiak Frazer Lake, NE end 26-Apr-03 313 14
UAR 20331 A-20331 Skin/ TPB M ~17 Kodiak Terror Bay, head of bay 11-May-03 302 14
UAR 20332 A-20332 Muscle/ TPB M AD Kodiak
Red Lake, Southeast Creek 27-Apr-03 312 CR9 14
UAR 20334 A-20334 Muscle/ TPB M ~4 Kodiak Red Lake 28-Apr-03 312 CR9 14
UAR 20337 A-20337 Muscle/ TPB M AD Kodiak Larsen Bay, head of bay 24-Apr-03 309 CR9 14
UAR 20342 A-20342 Muscle/ TPB F ~2 Kodiak Spiridon Lake 30-Apr-03 306 CR30
UAR 20347 A-20347 Muscle/ TPB M ~3 Kodiak Karluk Lake, Canyon Creek 02-May-03 310 CR32 14
UAR 20398(304619) A-20398 Muscle/ TPB F AD Kodiak Red Lake 06-May-03 312 14 SKL304619
UAR 20399 A-20399 Skin/ TPB M ~17 Kodiak Dog Salmon River 07-May-03 313
UAR 20701 20701 Tissue&Hair/ TPB&Dry F Afognak
RASPBERRY ISLAND 27-Apr-04 CR30 DQB1 14 21.06
UAR 20702 20702 Tissue&Hair/ TPB&Dry M Kodiak
DOG SALMON RIVER 23-Apr-04 14 25.56
UAR 20703 20703 Tissue&Hair/ TPB&Dry M Kodiak
DOG SALMON RIVER 27-Apr-04 14 22.62
UAR 20705 20705 Tissue&Hair/ TPB&Dry M Kodiak
UGANIK RIVER 22-Apr-04 14 27.75
UAR 20706 20706 Tissue&Hair/ TPB&Dry M Kodiak
UGANIK BAY SOUTH 27-Apr-04 14 25.38
UAR 20707 20707 Tissue&Hair/ TPB&Dry M Kodiak
ZACHAR RIVER 26-Apr-04 14 21
UAR 20708 20708 Tissue&Hair/ TPB&Dry F Kodiak
SITKALIDAK ISLAND 28-Apr-04 14 21.88
UAR 20709 20709 Tissue&Hair/ TPB&Dry F Kodiak
SOUTH OLGA LAKES 29-Apr-04 14 19.06
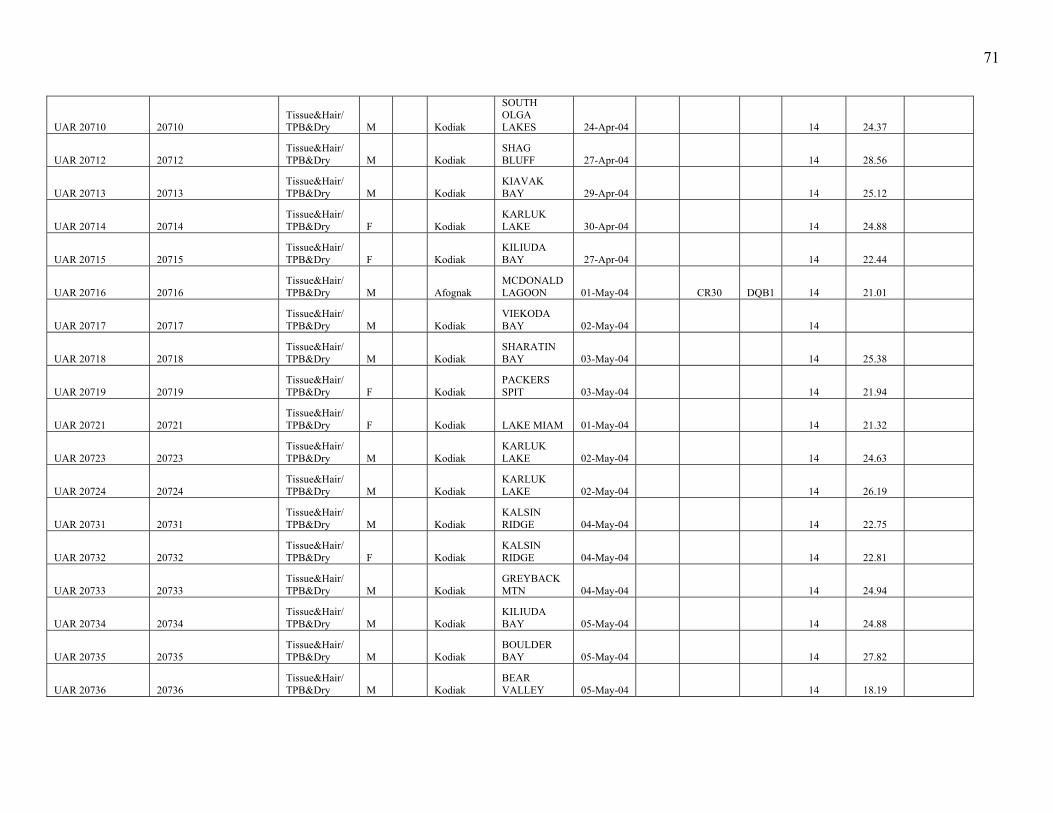
71
UAR 20710 20710 Tissue&Hair/ TPB&Dry M Kodiak
SOUTH OLGA LAKES 24-Apr-04 14 24.37
UAR 20712 20712 Tissue&Hair/ TPB&Dry M Kodiak
SHAG BLUFF 27-Apr-04 14 28.56
UAR 20713 20713 Tissue&Hair/ TPB&Dry M Kodiak
KIAVAK BAY 29-Apr-04 14 25.12
UAR 20714 20714 Tissue&Hair/ TPB&Dry F Kodiak
KARLUK LAKE 30-Apr-04 14 24.88
UAR 20715 20715 Tissue&Hair/ TPB&Dry F Kodiak
KILIUDA BAY 27-Apr-04 14 22.44
UAR 20716 20716 Tissue&Hair/ TPB&Dry M Afognak
MCDONALD LAGOON 01-May-04 CR30 DQB1 14 21.01
UAR 20717 20717 Tissue&Hair/ TPB&Dry M Kodiak
VIEKODA BAY 02-May-04 14
UAR 20718 20718 Tissue&Hair/ TPB&Dry M Kodiak
SHARATIN BAY 03-May-04 14 25.38
UAR 20719 20719 Tissue&Hair/ TPB&Dry F Kodiak
PACKERS SPIT 03-May-04 14 21.94
UAR 20721 20721 Tissue&Hair/ TPB&Dry F Kodiak LAKE MIAM 01-May-04 14 21.32
UAR 20723 20723 Tissue&Hair/ TPB&Dry M Kodiak
KARLUK LAKE 02-May-04 14 24.63
UAR 20724 20724 Tissue&Hair/ TPB&Dry M Kodiak
KARLUK LAKE 02-May-04 14 26.19
UAR 20731 20731 Tissue&Hair/ TPB&Dry M Kodiak
KALSIN RIDGE 04-May-04 14 22.75
UAR 20732 20732 Tissue&Hair/ TPB&Dry F Kodiak
KALSIN RIDGE 04-May-04 14 22.81
UAR 20733 20733 Tissue&Hair/ TPB&Dry M Kodiak
GREYBACK MTN 04-May-04 14 24.94
UAR 20734 20734 Tissue&Hair/ TPB&Dry M Kodiak
KILIUDA BAY 05-May-04 14 24.88
UAR 20735 20735 Tissue&Hair/ TPB&Dry M Kodiak
BOULDER BAY 05-May-04 14 27.82
UAR 20736 20736 Tissue&Hair/ TPB&Dry M Kodiak
BEAR VALLEY 05-May-04 14 18.19
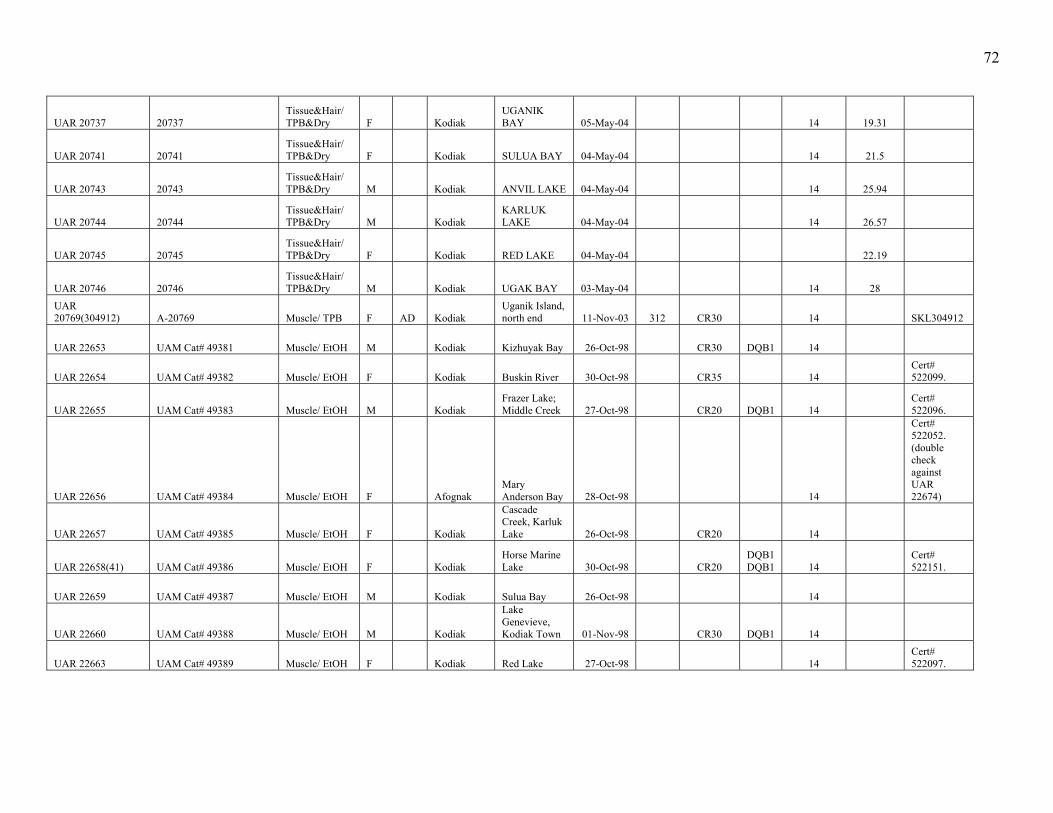
72
UAR 20737 20737 Tissue&Hair/ TPB&Dry F Kodiak
UGANIK BAY 05-May-04 14 19.31
UAR 20741 20741 Tissue&Hair/ TPB&Dry F Kodiak SULUA BAY 04-May-04 14 21.5
UAR 20743 20743 Tissue&Hair/ TPB&Dry M Kodiak ANVIL LAKE 04-May-04 14 25.94
UAR 20744 20744 Tissue&Hair/ TPB&Dry M Kodiak
KARLUK LAKE 04-May-04 14 26.57
UAR 20745 20745 Tissue&Hair/ TPB&Dry F Kodiak RED LAKE 04-May-04 22.19
UAR 20746 20746 Tissue&Hair/ TPB&Dry M Kodiak UGAK BAY 03-May-04 14 28
UAR 20769(304912) A-20769 Muscle/ TPB F AD Kodiak
Uganik Island, north end 11-Nov-03 312 CR30 14 SKL304912
UAR 22653 UAM Cat# 49381 Muscle/ EtOH M Kodiak Kizhuyak Bay 26-Oct-98 CR30 DQB1 14
UAR 22654 UAM Cat# 49382 Muscle/ EtOH F Kodiak Buskin River 30-Oct-98 CR35 14 Cert# 522099.
UAR 22655 UAM Cat# 49383 Muscle/ EtOH M Kodiak Frazer Lake; Middle Creek 27-Oct-98 CR20 DQB1 14
Cert# 522096.
UAR 22656 UAM Cat# 49384 Muscle/ EtOH F Afognak Mary Anderson Bay 28-Oct-98 14
Cert# 522052. (double check against UAR 22674)
UAR 22657 UAM Cat# 49385 Muscle/ EtOH F Kodiak
Cascade Creek, Karluk Lake 26-Oct-98 CR20 14
UAR 22658(41) UAM Cat# 49386 Muscle/ EtOH F Kodiak Horse Marine Lake 30-Oct-98 CR20
DQB1DQB1 14
Cert# 522151.
UAR 22659 UAM Cat# 49387 Muscle/ EtOH M Kodiak Sulua Bay 26-Oct-98 14
UAR 22660 UAM Cat# 49388 Muscle/ EtOH M Kodiak
Lake Genevieve, Kodiak Town 01-Nov-98 CR30 DQB1 14
UAR 22663 UAM Cat# 49389 Muscle/ EtOH F Kodiak Red Lake 27-Oct-98 14 Cert# 522097.
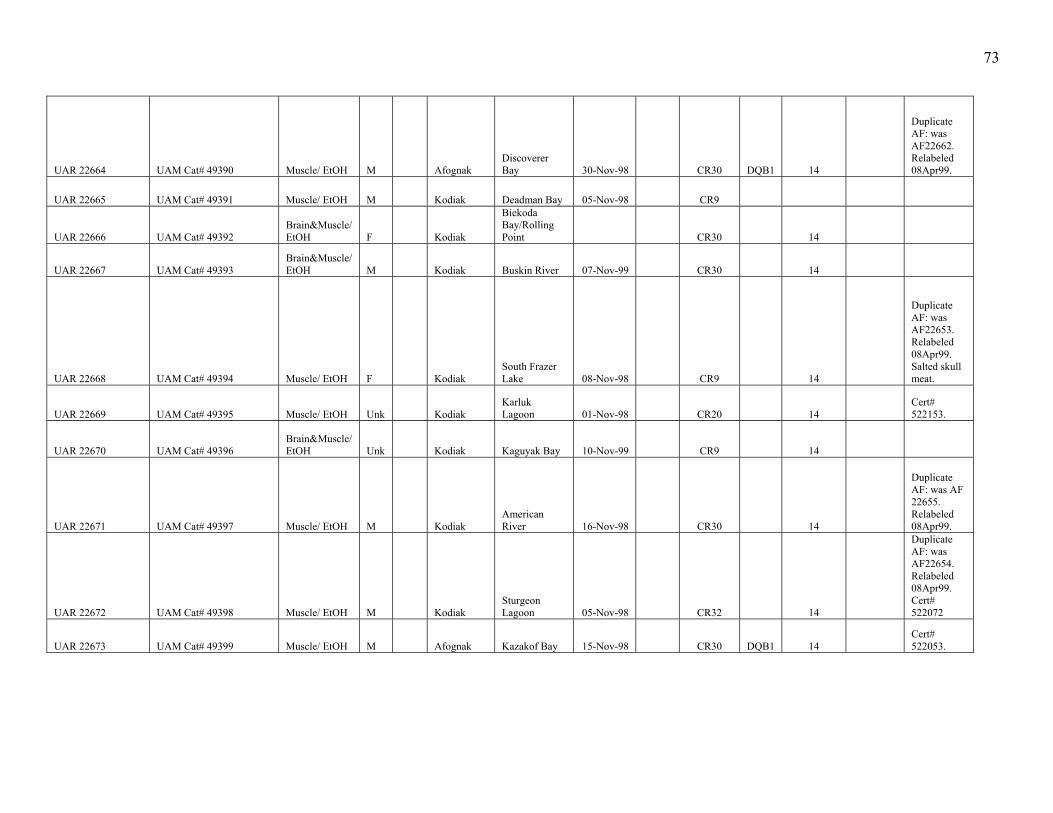
73
UAR 22664 UAM Cat# 49390 Muscle/ EtOH M Afognak Discoverer Bay 30-Nov-98 CR30 DQB1 14
Duplicate AF: was AF22662. Relabeled 08Apr99.
UAR 22665 UAM Cat# 49391 Muscle/ EtOH M Kodiak Deadman Bay 05-Nov-98 CR9
UAR 22666 UAM Cat# 49392 Brain&Muscle/ EtOH F Kodiak
Biekoda Bay/Rolling Point CR30 14
UAR 22667 UAM Cat# 49393 Brain&Muscle/ EtOH M Kodiak Buskin River 07-Nov-99 CR30 14
UAR 22668 UAM Cat# 49394 Muscle/ EtOH F Kodiak South Frazer Lake 08-Nov-98 CR9 14
Duplicate AF: was AF22653. Relabeled 08Apr99. Salted skull meat.
UAR 22669 UAM Cat# 49395 Muscle/ EtOH Unk Kodiak Karluk Lagoon 01-Nov-98 CR20 14
Cert# 522153.
UAR 22670 UAM Cat# 49396 Brain&Muscle/ EtOH Unk Kodiak Kaguyak Bay 10-Nov-99 CR9 14
UAR 22671 UAM Cat# 49397 Muscle/ EtOH M Kodiak American River 16-Nov-98 CR30 14
Duplicate AF: was AF 22655. Relabeled 08Apr99.
UAR 22672 UAM Cat# 49398 Muscle/ EtOH M Kodiak Sturgeon Lagoon 05-Nov-98 CR32 14
Duplicate AF: was AF22654. Relabeled 08Apr99. Cert# 522072
UAR 22673 UAM Cat# 49399 Muscle/ EtOH M Afognak Kazakof Bay 15-Nov-98 CR30 DQB1 14 Cert# 522053.
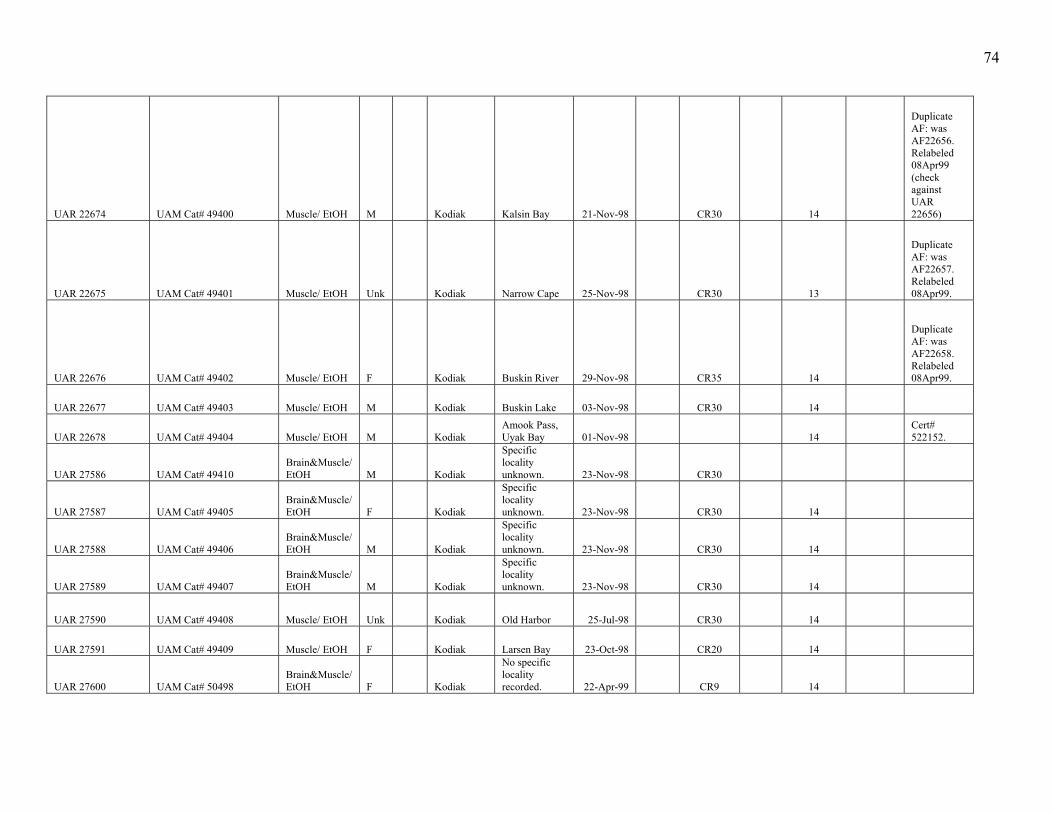
74
UAR 22674 UAM Cat# 49400 Muscle/ EtOH M Kodiak Kalsin Bay 21-Nov-98 CR30 14
Duplicate AF: was AF22656. Relabeled 08Apr99 (check against UAR 22656)
UAR 22675 UAM Cat# 49401 Muscle/ EtOH Unk Kodiak Narrow Cape 25-Nov-98 CR30 13
Duplicate AF: was AF22657. Relabeled 08Apr99.
UAR 22676 UAM Cat# 49402 Muscle/ EtOH F Kodiak Buskin River 29-Nov-98 CR35 14
Duplicate AF: was AF22658. Relabeled 08Apr99.
UAR 22677 UAM Cat# 49403 Muscle/ EtOH M Kodiak Buskin Lake 03-Nov-98 CR30 14
UAR 22678 UAM Cat# 49404 Muscle/ EtOH M Kodiak Amook Pass, Uyak Bay 01-Nov-98 14
Cert# 522152.
UAR 27586 UAM Cat# 49410 Brain&Muscle/ EtOH M Kodiak
Specific locality unknown. 23-Nov-98 CR30
UAR 27587 UAM Cat# 49405 Brain&Muscle/ EtOH F Kodiak
Specific locality unknown. 23-Nov-98 CR30 14
UAR 27588 UAM Cat# 49406 Brain&Muscle/ EtOH M Kodiak
Specific locality unknown. 23-Nov-98 CR30 14
UAR 27589 UAM Cat# 49407 Brain&Muscle/ EtOH M Kodiak
Specific locality unknown. 23-Nov-98 CR30 14
UAR 27590 UAM Cat# 49408 Muscle/ EtOH Unk Kodiak Old Harbor 25-Jul-98 CR30 14
UAR 27591 UAM Cat# 49409 Muscle/ EtOH F Kodiak Larsen Bay 23-Oct-98 CR20 14
UAR 27600 UAM Cat# 50498 Brain&Muscle/ EtOH F Kodiak
No specific locality recorded. 22-Apr-99 CR9 14
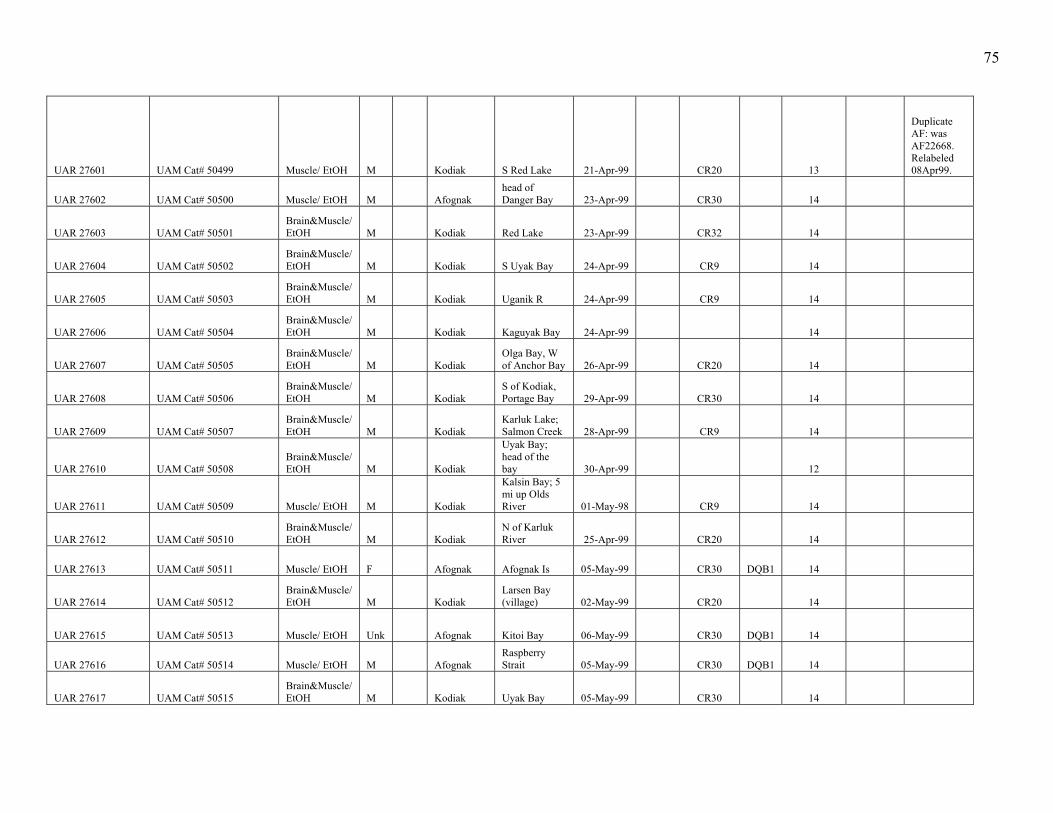
75
UAR 27601 UAM Cat# 50499 Muscle/ EtOH M Kodiak S Red Lake 21-Apr-99 CR20 13
Duplicate AF: was AF22668. Relabeled 08Apr99.
UAR 27602 UAM Cat# 50500 Muscle/ EtOH M Afognak head of Danger Bay 23-Apr-99 CR30 14
UAR 27603 UAM Cat# 50501 Brain&Muscle/ EtOH M Kodiak Red Lake 23-Apr-99 CR32 14
UAR 27604 UAM Cat# 50502 Brain&Muscle/ EtOH M Kodiak S Uyak Bay 24-Apr-99 CR9 14
UAR 27605 UAM Cat# 50503 Brain&Muscle/ EtOH M Kodiak Uganik R 24-Apr-99 CR9 14
UAR 27606 UAM Cat# 50504 Brain&Muscle/ EtOH M Kodiak Kaguyak Bay 24-Apr-99 14
UAR 27607 UAM Cat# 50505 Brain&Muscle/ EtOH M Kodiak
Olga Bay, W of Anchor Bay 26-Apr-99 CR20 14
UAR 27608 UAM Cat# 50506 Brain&Muscle/ EtOH M Kodiak
S of Kodiak, Portage Bay 29-Apr-99 CR30 14
UAR 27609 UAM Cat# 50507 Brain&Muscle/ EtOH M Kodiak
Karluk Lake; Salmon Creek 28-Apr-99 CR9 14
UAR 27610 UAM Cat# 50508 Brain&Muscle/ EtOH M Kodiak
Uyak Bay; head of the bay 30-Apr-99 12
UAR 27611 UAM Cat# 50509 Muscle/ EtOH M Kodiak
Kalsin Bay; 5 mi up Olds River 01-May-98 CR9 14
UAR 27612 UAM Cat# 50510 Brain&Muscle/ EtOH M Kodiak
N of Karluk River 25-Apr-99 CR20 14
UAR 27613 UAM Cat# 50511 Muscle/ EtOH F Afognak Afognak Is 05-May-99 CR30 DQB1 14
UAR 27614 UAM Cat# 50512 Brain&Muscle/ EtOH M Kodiak
Larsen Bay (village) 02-May-99 CR20 14
UAR 27615 UAM Cat# 50513 Muscle/ EtOH Unk Afognak Kitoi Bay 06-May-99 CR30 DQB1 14
UAR 27616 UAM Cat# 50514 Muscle/ EtOH M Afognak Raspberry Strait 05-May-99 CR30 DQB1 14
UAR 27617 UAM Cat# 50515 Brain&Muscle/ EtOH M Kodiak Uyak Bay 05-May-99 CR30 14

76
UAR 27618 UAM Cat# 50516 Brain&Muscle/ EtOH F Kodiak Chief Cove 04-May-99 CR30 14
UAR 27619 UAM Cat# 50517 Brain&Muscle/ EtOH F Kodiak Deadman Bay 04-May-99 CR9 14
UAR 27620 UAM Cat# 50518 Brain&Muscle/ EtOH M Kodiak Halibut Bay 04-May-99 CR20 14
UAR 27621 UAM Cat# 50519 Muscle/ EtOH M Afognak Malina Bay, S side 04-May-99 CR30
DQB1DQB1 14
UAR 27622 UAM Cat# 50520 Brain&Muscle/ EtOH M Kodiak Uyak Bay 07-May-99 14
UAR 27623 UAM Cat# 50521 Brain&Muscle/ EtOH M Kodiak Ayakulik R 04-May-99 CR30 14
UAR 27624 UAM Cat# 50522 Brain&Muscle/ EtOH M Kodiak Red Lake 05-May-99 DQB1 14
UAR 27625 UAM Cat# 50523 Brain&Muscle/ EtOH M Kodiak Red Lake 07-May-99 14
UAR 27626 UAM Cat# 50524 Brain&Muscle/ EtOH M Kodiak Terror Bay 06-May-99 CR30 14
UAR 27627 UAM Cat# 50525 Brain&Muscle/ EtOH F Kodiak
Frazer Lake; Middle Creek 04-May-99 CR32 14
UAR 27628 UAM Cat# 50526 Brain&Muscle/ EtOH F Kodiak
Horse Marine Lagoon 08-May-99 CR32 13
UAR 27629 UAM Cat# 50527 Brain&Muscle/ EtOH M Kodiak Kodiak 07-May-99 CR9 DQB1 14
UAR 27630 UAM Cat# 50528 Brain&Muscle/ EtOH F Kodiak
Aliulik Peninsula; Cape Trinity 11-May-99 CR9 DQB1 14
UAR 27631 UAM Cat# 50529 Brain&Muscle/ EtOH F Kodiak
Frazer Lake; Middle Creek 12-May-99 CR20 DQB1 14
UAR 27632 UAM Cat# 50530 Brain&Muscle/ EtOH M Kodiak
Seven Rivers; Aliulik Peninsula 15-May-99 CR9 DQB1 14
UAR 27633 UAM Cat# 50531 Brain&Muscle/ EtOH Unk Kodiak
E fork of the Dog Salmon R 15-May-99 CR9
UAR 510407 510407 Muscle/ EtOH M 6 Kodiak
East Fork Ayakulik River 25-Apr-93 311
UAR 510452 510452 Muscle/ EtOH F 4 Kodiak Barling Bay 05-May-93 318
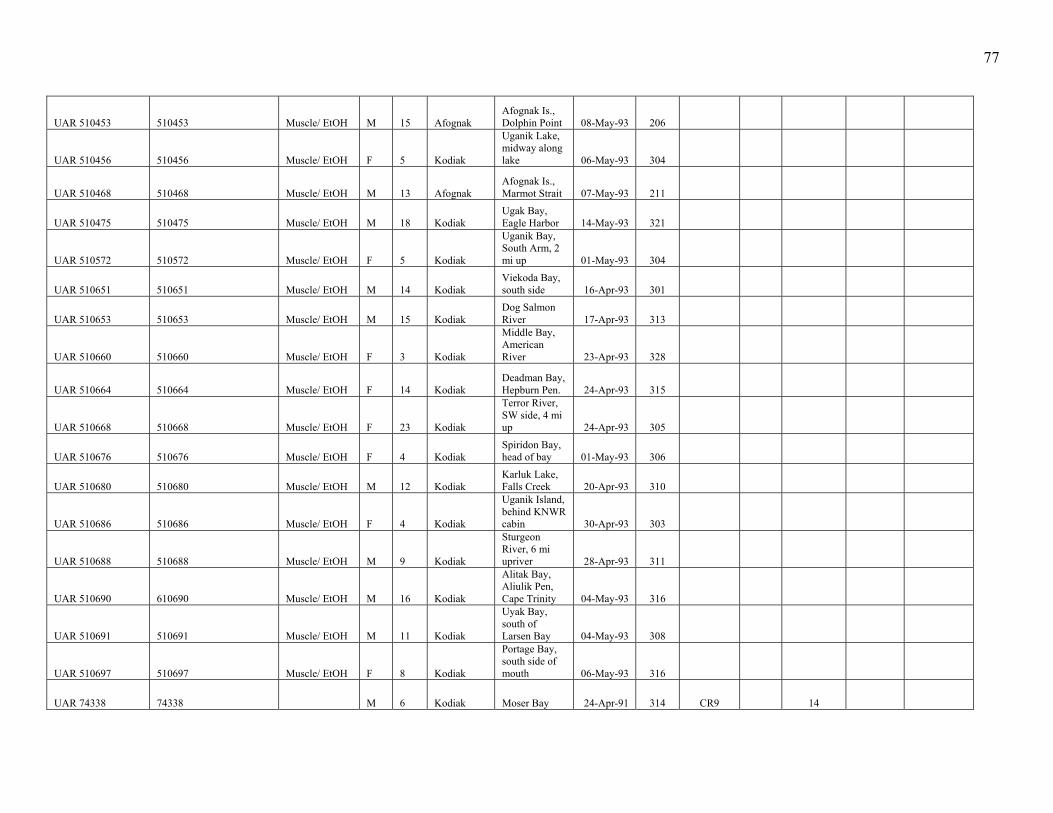
77
UAR 510453 510453 Muscle/ EtOH M 15 Afognak Afognak Is., Dolphin Point 08-May-93 206
UAR 510456 510456 Muscle/ EtOH F 5 Kodiak
Uganik Lake, midway along lake 06-May-93 304
UAR 510468 510468 Muscle/ EtOH M 13 Afognak Afognak Is., Marmot Strait 07-May-93 211
UAR 510475 510475 Muscle/ EtOH M 18 Kodiak Ugak Bay, Eagle Harbor 14-May-93 321
UAR 510572 510572 Muscle/ EtOH F 5 Kodiak
Uganik Bay, South Arm, 2 mi up 01-May-93 304
UAR 510651 510651 Muscle/ EtOH M 14 Kodiak Viekoda Bay, south side 16-Apr-93 301
UAR 510653 510653 Muscle/ EtOH M 15 Kodiak Dog Salmon River 17-Apr-93 313
UAR 510660 510660 Muscle/ EtOH F 3 Kodiak
Middle Bay, American River 23-Apr-93 328
UAR 510664 510664 Muscle/ EtOH F 14 Kodiak Deadman Bay, Hepburn Pen. 24-Apr-93 315
UAR 510668 510668 Muscle/ EtOH F 23 Kodiak
Terror River, SW side, 4 mi up 24-Apr-93 305
UAR 510676 510676 Muscle/ EtOH F 4 Kodiak Spiridon Bay, head of bay 01-May-93 306
UAR 510680 510680 Muscle/ EtOH M 12 Kodiak Karluk Lake, Falls Creek 20-Apr-93 310
UAR 510686 510686 Muscle/ EtOH F 4 Kodiak
Uganik Island, behind KNWR cabin 30-Apr-93 303
UAR 510688 510688 Muscle/ EtOH M 9 Kodiak
Sturgeon River, 6 mi upriver 28-Apr-93 311
UAR 510690 610690 Muscle/ EtOH M 16 Kodiak
Alitak Bay, Aliulik Pen, Cape Trinity 04-May-93 316
UAR 510691 510691 Muscle/ EtOH M 11 Kodiak
Uyak Bay, south of Larsen Bay 04-May-93 308
UAR 510697 510697 Muscle/ EtOH F 8 Kodiak
Portage Bay, south side of mouth 06-May-93 316
UAR 74338 74338 M 6 Kodiak Moser Bay 24-Apr-91 314 CR9 14
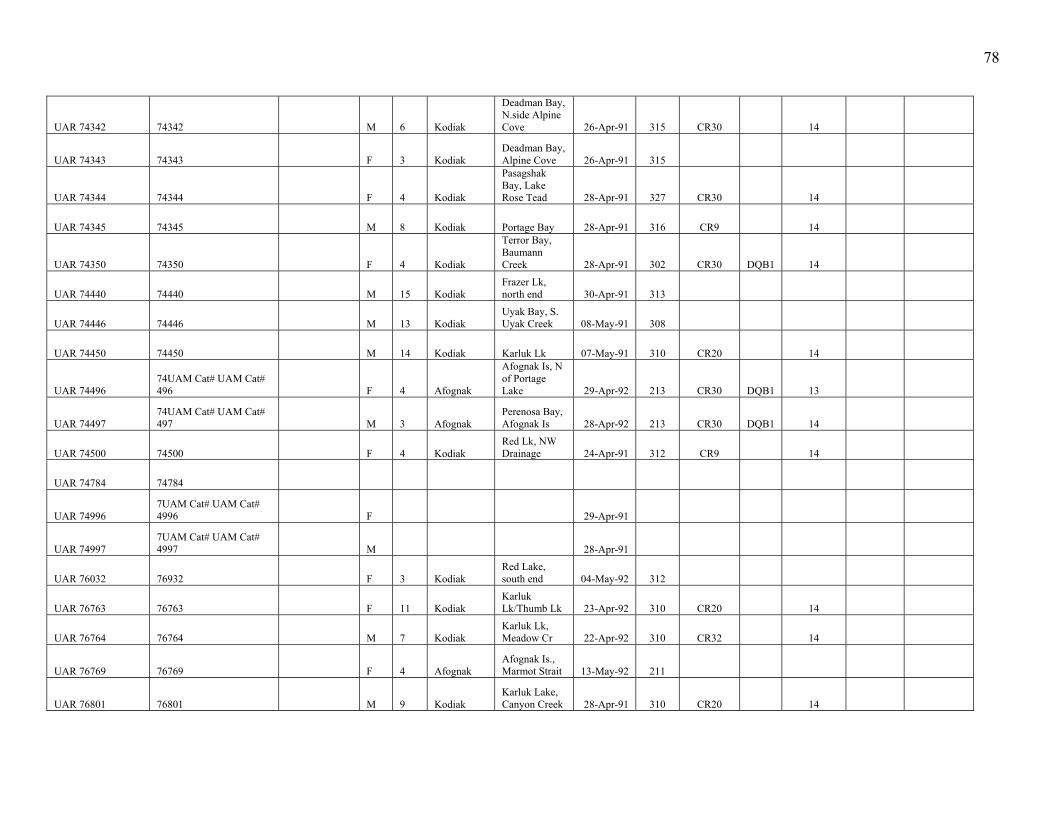
78
UAR 74342 74342 M 6 Kodiak
Deadman Bay, N.side Alpine Cove 26-Apr-91 315 CR30 14
UAR 74343 74343 F 3 Kodiak Deadman Bay, Alpine Cove 26-Apr-91 315
UAR 74344 74344 F 4 Kodiak
Pasagshak Bay, Lake Rose Tead 28-Apr-91 327 CR30 14
UAR 74345 74345 M 8 Kodiak Portage Bay 28-Apr-91 316 CR9 14
UAR 74350 74350 F 4 Kodiak
Terror Bay, Baumann Creek 28-Apr-91 302 CR30 DQB1 14
UAR 74440 74440 M 15 Kodiak Frazer Lk, north end 30-Apr-91 313
UAR 74446 74446 M 13 Kodiak Uyak Bay, S. Uyak Creek 08-May-91 308
UAR 74450 74450 M 14 Kodiak Karluk Lk 07-May-91 310 CR20 14
UAR 74496 74UAM Cat# UAM Cat# 496 F 4 Afognak
Afognak Is, N of Portage Lake 29-Apr-92 213 CR30 DQB1 13
UAR 74497 74UAM Cat# UAM Cat# 497 M 3 Afognak
Perenosa Bay, Afognak Is 28-Apr-92 213 CR30 DQB1 14
UAR 74500 74500 F 4 Kodiak Red Lk, NW Drainage 24-Apr-91 312 CR9 14
UAR 74784 74784
UAR 74996 7UAM Cat# UAM Cat# 4996 F 29-Apr-91
UAR 74997 7UAM Cat# UAM Cat# 4997 M 28-Apr-91
UAR 76032 76932 F 3 Kodiak Red Lake, south end 04-May-92 312
UAR 76763 76763 F 11 Kodiak Karluk Lk/Thumb Lk 23-Apr-92 310 CR20 14
UAR 76764 76764 M 7 Kodiak Karluk Lk, Meadow Cr 22-Apr-92 310 CR32 14
UAR 76769 76769 F 4 Afognak Afognak Is., Marmot Strait 13-May-92 211
UAR 76801 76801 M 9 Kodiak Karluk Lake, Canyon Creek 28-Apr-91 310 CR20 14
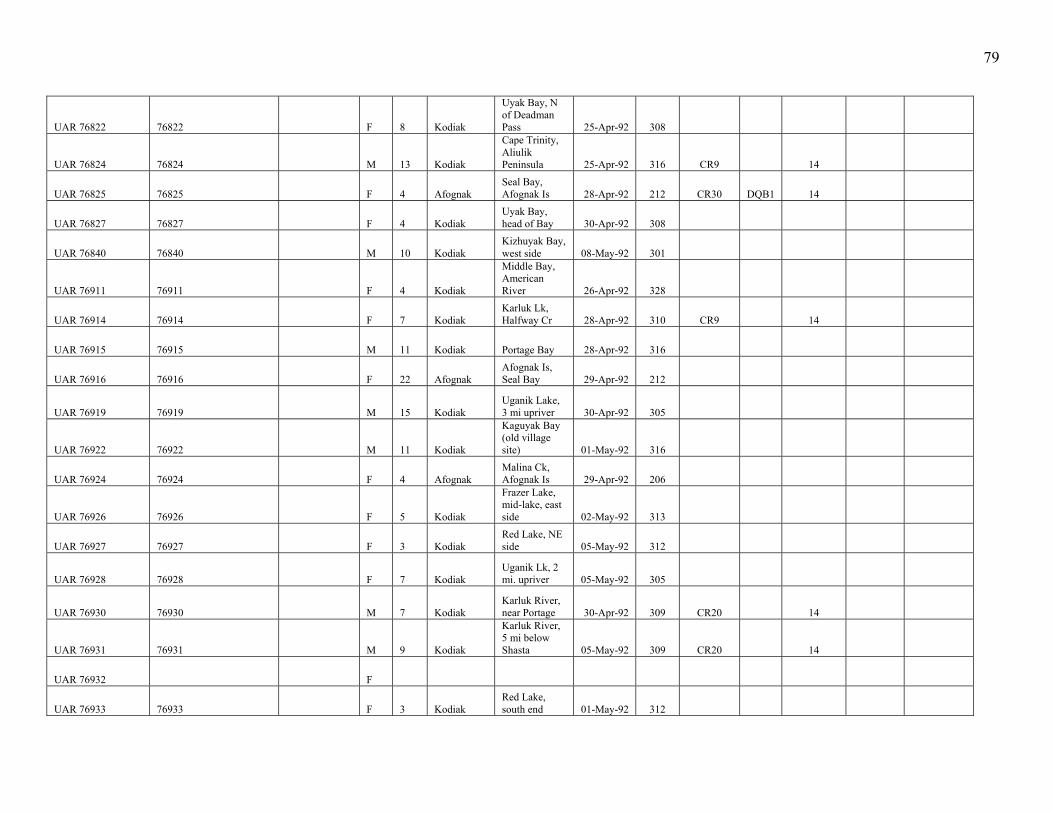
79
UAR 76822 76822 F 8 Kodiak
Uyak Bay, N of Deadman Pass 25-Apr-92 308
UAR 76824 76824 M 13 Kodiak
Cape Trinity, Aliulik Peninsula 25-Apr-92 316 CR9 14
UAR 76825 76825 F 4 Afognak Seal Bay, Afognak Is 28-Apr-92 212 CR30 DQB1 14
UAR 76827 76827 F 4 Kodiak Uyak Bay, head of Bay 30-Apr-92 308
UAR 76840 76840 M 10 Kodiak Kizhuyak Bay, west side 08-May-92 301
UAR 76911 76911 F 4 Kodiak
Middle Bay, American River 26-Apr-92 328
UAR 76914 76914 F 7 Kodiak Karluk Lk, Halfway Cr 28-Apr-92 310 CR9 14
UAR 76915 76915 M 11 Kodiak Portage Bay 28-Apr-92 316
UAR 76916 76916 F 22 Afognak Afognak Is, Seal Bay 29-Apr-92 212
UAR 76919 76919 M 15 Kodiak Uganik Lake, 3 mi upriver 30-Apr-92 305
UAR 76922 76922 M 11 Kodiak
Kaguyak Bay (old village site) 01-May-92 316
UAR 76924 76924 F 4 Afognak Malina Ck, Afognak Is 29-Apr-92 206
UAR 76926 76926 F 5 Kodiak
Frazer Lake, mid-lake, east side 02-May-92 313
UAR 76927 76927 F 3 Kodiak Red Lake, NE side 05-May-92 312
UAR 76928 76928 F 7 Kodiak Uganik Lk, 2 mi. upriver 05-May-92 305
UAR 76930 76930 M 7 Kodiak Karluk River, near Portage 30-Apr-92 309 CR20 14
UAR 76931 76931 M 9 Kodiak
Karluk River, 5 mi below Shasta 05-May-92 309 CR20 14
UAR 76932 F
UAR 76933 76933 F 3 Kodiak Red Lake, south end 01-May-92 312
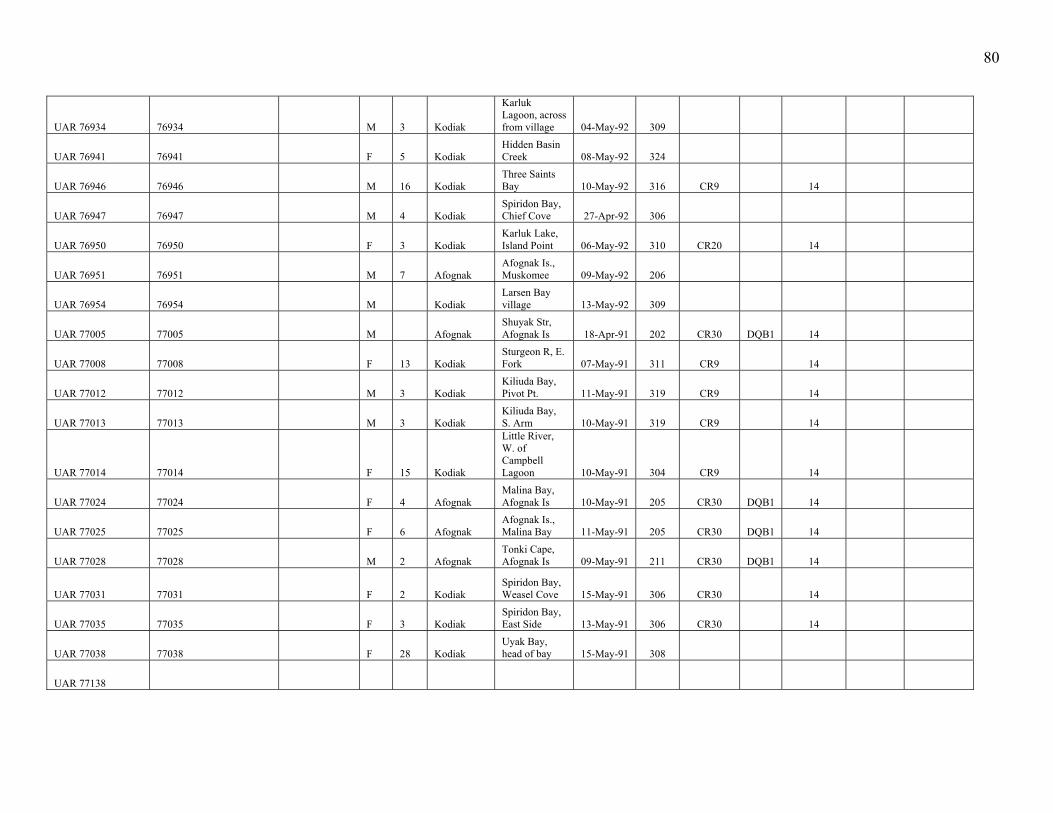
80
UAR 76934 76934 M 3 Kodiak
Karluk Lagoon, across from village 04-May-92 309
UAR 76941 76941 F 5 Kodiak Hidden Basin Creek 08-May-92 324
UAR 76946 76946 M 16 Kodiak Three Saints Bay 10-May-92 316 CR9 14
UAR 76947 76947 M 4 Kodiak Spiridon Bay, Chief Cove 27-Apr-92 306
UAR 76950 76950 F 3 Kodiak Karluk Lake, Island Point 06-May-92 310 CR20 14
UAR 76951 76951 M 7 Afognak Afognak Is., Muskomee 09-May-92 206
UAR 76954 76954 M Kodiak Larsen Bay village 13-May-92 309
UAR 77005 77005 M Afognak Shuyak Str, Afognak Is 18-Apr-91 202 CR30 DQB1 14
UAR 77008 77008 F 13 Kodiak Sturgeon R, E. Fork 07-May-91 311 CR9 14
UAR 77012 77012 M 3 Kodiak Kiliuda Bay, Pivot Pt. 11-May-91 319 CR9 14
UAR 77013 77013 M 3 Kodiak Kiliuda Bay, S. Arm 10-May-91 319 CR9 14
UAR 77014 77014 F 15 Kodiak
Little River, W. of Campbell Lagoon 10-May-91 304 CR9 14
UAR 77024 77024 F 4 Afognak Malina Bay, Afognak Is 10-May-91 205 CR30 DQB1 14
UAR 77025 77025 F 6 Afognak Afognak Is., Malina Bay 11-May-91 205 CR30 DQB1 14
UAR 77028 77028 M 2 Afognak Tonki Cape, Afognak Is 09-May-91 211 CR30 DQB1 14
UAR 77031 77031 F 2 Kodiak Spiridon Bay, Weasel Cove 15-May-91 306 CR30 14
UAR 77035 77035 F 3 Kodiak Spiridon Bay, East Side 13-May-91 306 CR30 14
UAR 77038 77038 F 28 Kodiak Uyak Bay, head of bay 15-May-91 308
UAR 77138
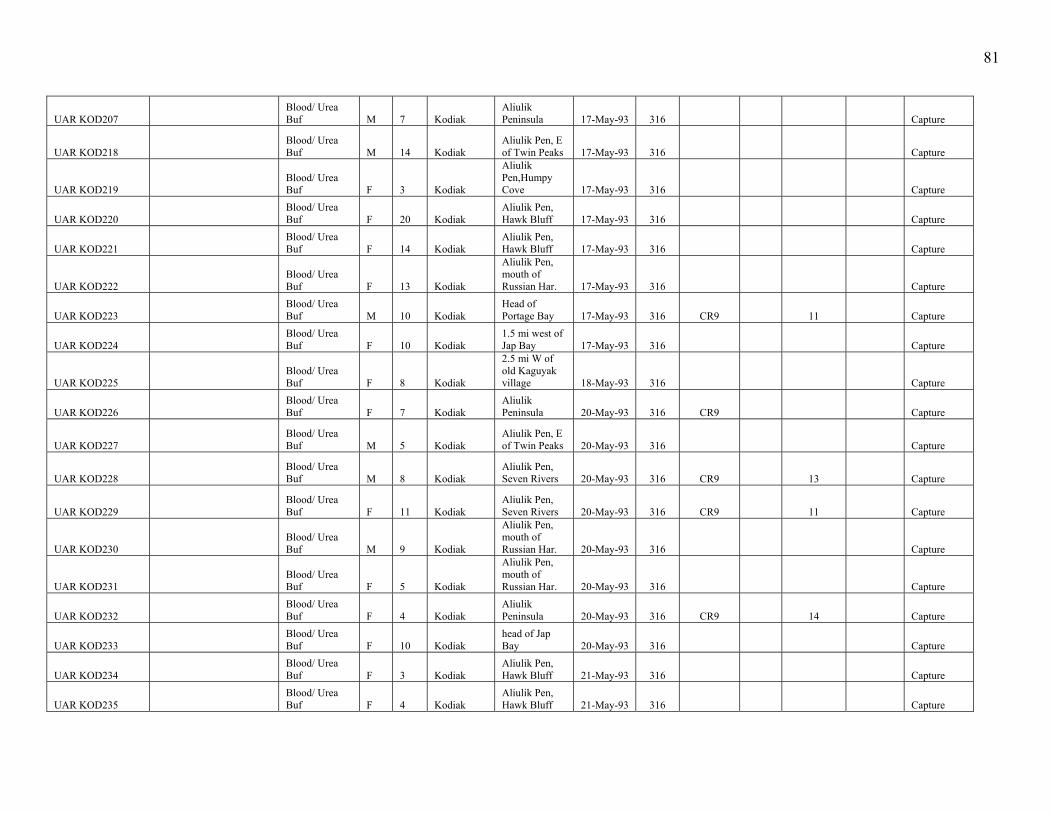
81
UAR KOD207 Blood/ Urea Buf M 7 Kodiak
Aliulik Peninsula 17-May-93 316 Capture
UAR KOD218 Blood/ Urea Buf M 14 Kodiak
Aliulik Pen, E of Twin Peaks 17-May-93 316 Capture
UAR KOD219 Blood/ Urea Buf F 3 Kodiak
Aliulik Pen,Humpy Cove 17-May-93 316 Capture
UAR KOD220 Blood/ Urea Buf F 20 Kodiak
Aliulik Pen, Hawk Bluff 17-May-93 316 Capture
UAR KOD221 Blood/ Urea Buf F 14 Kodiak
Aliulik Pen, Hawk Bluff 17-May-93 316 Capture
UAR KOD222 Blood/ Urea Buf F 13 Kodiak
Aliulik Pen, mouth of Russian Har. 17-May-93 316 Capture
UAR KOD223 Blood/ Urea Buf M 10 Kodiak
Head of Portage Bay 17-May-93 316 CR9 11 Capture
UAR KOD224 Blood/ Urea Buf F 10 Kodiak
1.5 mi west of Jap Bay 17-May-93 316 Capture
UAR KOD225 Blood/ Urea Buf F 8 Kodiak
2.5 mi W of old Kaguyak village 18-May-93 316 Capture
UAR KOD226 Blood/ Urea Buf F 7 Kodiak
Aliulik Peninsula 20-May-93 316 CR9 Capture
UAR KOD227 Blood/ Urea Buf M 5 Kodiak
Aliulik Pen, E of Twin Peaks 20-May-93 316 Capture
UAR KOD228 Blood/ Urea Buf M 8 Kodiak
Aliulik Pen, Seven Rivers 20-May-93 316 CR9 13 Capture
UAR KOD229 Blood/ Urea Buf F 11 Kodiak
Aliulik Pen, Seven Rivers 20-May-93 316 CR9 11 Capture
UAR KOD230 Blood/ Urea Buf M 9 Kodiak
Aliulik Pen, mouth of Russian Har. 20-May-93 316 Capture
UAR KOD231 Blood/ Urea Buf F 5 Kodiak
Aliulik Pen, mouth of Russian Har. 20-May-93 316 Capture
UAR KOD232 Blood/ Urea Buf F 4 Kodiak
Aliulik Peninsula 20-May-93 316 CR9 14 Capture
UAR KOD233 Blood/ Urea Buf F 10 Kodiak
head of Jap Bay 20-May-93 316 Capture
UAR KOD234 Blood/ Urea Buf F 3 Kodiak
Aliulik Pen, Hawk Bluff 21-May-93 316 Capture
UAR KOD235 Blood/ Urea Buf F 4 Kodiak
Aliulik Pen, Hawk Bluff 21-May-93 316 Capture

82
APPENDIX 2 MATCH STATISTICS
Appendix 2. Data associated with 14 bears sharing identical multilocus genotypes with at least one other individual. Samples listed under “Sample 1” matched at
all alleles with samples listed under “Sample 2”. “Score” is the percentage of samples matching, “No. Alleles” is the number of alleles compared, and “No.
Matched” is the number of matching samples. Field data are included for each pairwise comparison to demonstrate that samples matching at all loci, in most
cases, can still be differentiated based on date of harvest, estimated age of birth, and/or sex.
Matching Samples Match Statistics
Sample 1
Year
Harvested
Est. Year
of Birth
Sex Sample 2
Year
Harvested
Est. Year
of Birth
Sex Score
No.
Alleles No. Matched
1-1 Kod07912 2003
Before
1991 M 1-2 Kod20745 2004 1999 F 100.00% 28 28
2-1 Kod07912 2003
Before
1991 M 2-2 Kod74345 1991 1983 M 100.00% 28 28
3-1 Kod20342 2003 2001 F 3-2 Kod27589 1998 - M 100.00% 28 28
4-1 Kod27586 1998 - M 4-2 Kod17027 2004 2000 F 100.00% 28 28
5-1 Kod27633 1999 - Unk 5-2 Kod510673 1993 1988 M 100.00% 28 28
6-1 Kod22665 1998 - M 6-2 Kod17033 2004 1992 F 100.00% 28 28
7-1 Kod20295 2004 - M 7-2 Kod20714 2004 - F 100.00% 28 28
8-1 Kod20745 2004 1999 F 8-2 Kod74345 1991 1983 M 100.00% 28 28
9-1 Kod22655 1998 - M 9-2 Kod226 n/a 1986 F 100.00% 22 22
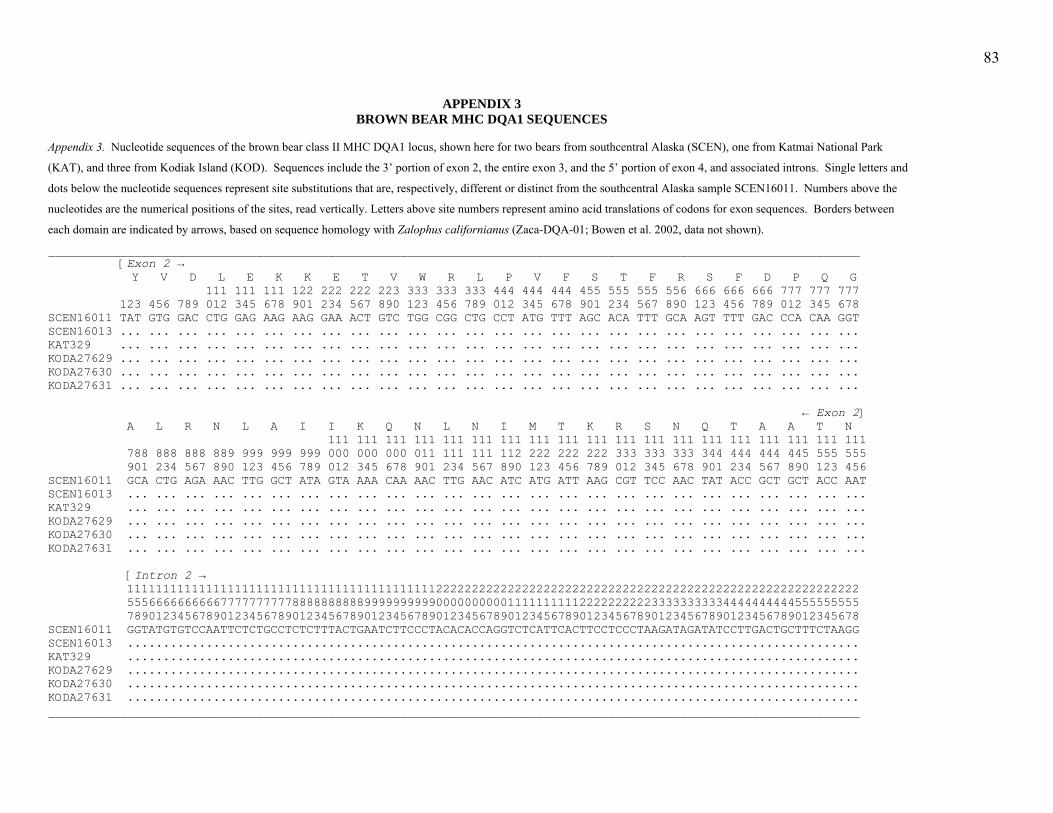
83
APPENDIX 3 BROWN BEAR MHC DQA1 SEQUENCES
Appendix 3. Nucleotide sequences of the brown bear class II MHC DQA1 locus, shown here for two bears from southcentral Alaska (SCEN), one from Katmai National Park
(KAT), and three from Kodiak Island (KOD). Sequences include the 3’ portion of exon 2, the entire exon 3, and the 5’ portion of exon 4, and associated introns. Single letters and
dots below the nucleotide sequences represent site substitutions that are, respectively, different or distinct from the southcentral Alaska sample SCEN16011. Numbers above the
nucleotides are the numerical positions of the sites, read vertically. Letters above site numbers represent amino acid translations of codons for exon sequences. Borders between
each domain are indicated by arrows, based on sequence homology with Zalophus californianus (Zaca-DQA-01; Bowen et al. 2002, data not shown).
_________________________________________________________________________________________________________________ [Exon 2 → Y V D L E K K E T V W R L P V F S T F R S F D P Q G 111 111 111 122 222 222 223 333 333 333 444 444 444 455 555 555 556 666 666 666 777 777 777 123 456 789 012 345 678 901 234 567 890 123 456 789 012 345 678 901 234 567 890 123 456 789 012 345 678 SCEN16011 TAT GTG GAC CTG GAG AAG AAG GAA ACT GTC TGG CGG CTG CCT ATG TTT AGC ACA TTT GCA AGT TTT GAC CCA CAA GGT SCEN16013 ... ... ... ... ... ... ... ... ... ... ... ... ... ... ... ... ... ... ... ... ... ... ... ... ... ... KAT329 ... ... ... ... ... ... ... ... ... ... ... ... ... ... ... ... ... ... ... ... ... ... ... ... ... ... KODA27629 ... ... ... ... ... ... ... ... ... ... ... ... ... ... ... ... ... ... ... ... ... ... ... ... ... ... KODA27630 ... ... ... ... ... ... ... ... ... ... ... ... ... ... ... ... ... ... ... ... ... ... ... ... ... ... KODA27631 ... ... ... ... ... ... ... ... ... ... ... ... ... ... ... ... ... ... ... ... ... ... ... ... ... ... ← Exon 2] A L R N L A I I K Q N L N I M T K R S N Q T A A T N 111 111 111 111 111 111 111 111 111 111 111 111 111 111 111 111 111 111 111 788 888 888 889 999 999 999 000 000 000 011 111 111 112 222 222 222 333 333 333 344 444 444 445 555 555 901 234 567 890 123 456 789 012 345 678 901 234 567 890 123 456 789 012 345 678 901 234 567 890 123 456 SCEN16011 GCA CTG AGA AAC TTG GCT ATA GTA AAA CAA AAC TTG AAC ATC ATG ATT AAG CGT TCC AAC TAT ACC GCT GCT ACC AAT SCEN16013 ... ... ... ... ... ... ... ... ... ... ... ... ... ... ... ... ... ... ... ... ... ... ... ... ... ... KAT329 ... ... ... ... ... ... ... ... ... ... ... ... ... ... ... ... ... ... ... ... ... ... ... ... ... ... KODA27629 ... ... ... ... ... ... ... ... ... ... ... ... ... ... ... ... ... ... ... ... ... ... ... ... ... ... KODA27630 ... ... ... ... ... ... ... ... ... ... ... ... ... ... ... ... ... ... ... ... ... ... ... ... ... ... KODA27631 ... ... ... ... ... ... ... ... ... ... ... ... ... ... ... ... ... ... ... ... ... ... ... ... ... ... [Intron 2 → 111111111111111111111111111111111111111111122222222222222222222222222222222222222222222222222222222222 555666666666677777777778888888888999999999900000000001111111111222222222233333333334444444444555555555 789012345678901234567890123456789012345678901234567890123456789012345678901234567890123456789012345678 SCEN16011 GGTATGTGTCCAATTCTCTGCCTCTCTTTACTGAATCTTCCCTACACACCAGGTCTCATTCACTTCCTCCCTAAGATAGATATCCTTGACTGCTTTCTAAGG SCEN16013 ...................................................................................................... KAT329 ...................................................................................................... KODA27629 ...................................................................................................... KODA27630 ...................................................................................................... KODA27631 ...................................................................................................... _________________________________________________________________________________________________________________
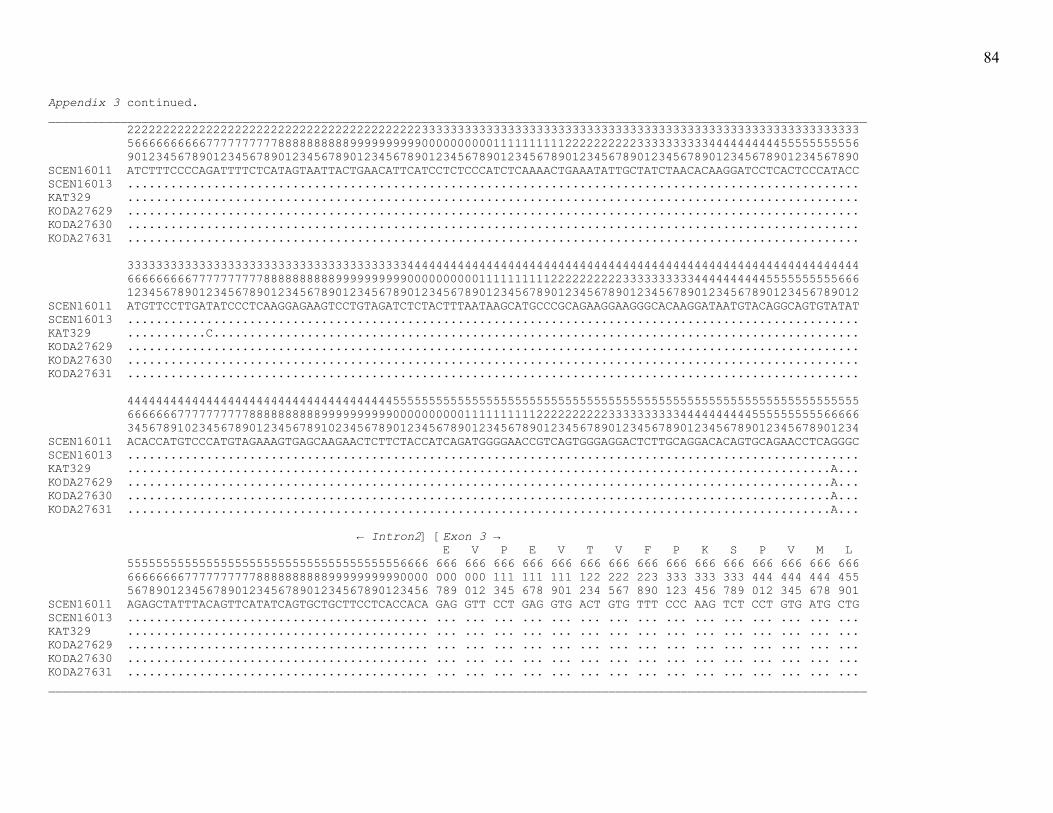
84
Appendix 3 continued. __________________________________________________________________________________________________________________ 222222222222222222222222222222222222222223333333333333333333333333333333333333333333333333333333333333 566666666667777777777888888888899999999990000000000111111111122222222223333333333444444444455555555556 901234567890123456789012345678901234567890123456789012345678901234567890123456789012345678901234567890 SCEN16011 ATCTTTCCCCAGATTTTCTCATAGTAATTACTGAACATTCATCCTCTCCCATCTCAAAACTGAAATATTGCTATCTAACACAAGGATCCTCACTCCCATACC SCEN16013 ...................................................................................................... KAT329 ...................................................................................................... KODA27629 ...................................................................................................... KODA27630 ...................................................................................................... KODA27631 ...................................................................................................... 333333333333333333333333333333333333333444444444444444444444444444444444444444444444444444444444444444 666666666777777777788888888889999999999000000000011111111112222222222333333333344444444445555555555666 123456789012345678901234567890123456789012345678901234567890123456789012345678901234567890123456789012 SCEN16011 ATGTTCCTTGATATCCCTCAAGGAGAAGTCCTGTAGATCTCTACTTTAATAAGCATGCCCGCAGAAGGAAGGGCACAAGGATAATGTACAGGCAGTGTATAT SCEN16013 ...................................................................................................... KAT329 ...........C.......................................................................................... KODA27629 ...................................................................................................... KODA27630 ...................................................................................................... KODA27631 ...................................................................................................... 444444444444444444444444444444444444455555555555555555555555555555555555555555555555555555555555555555 666666677777777778888888888999999999900000000001111111111222222222233333333334444444444555555555566666 345678910234567890123456789102345678901234567890123456789012345678901234567890123456789012345678901234 SCEN16011 ACACCATGTCCCATGTAGAAAGTGAGCAAGAACTCTTCTACCATCAGATGGGGAACCGTCAGTGGGAGGACTCTTGCAGGACACAGTGCAGAACCTCAGGGC SCEN16013 ...................................................................................................... KAT329 ..................................................................................................A... KODA27629 ..................................................................................................A... KODA27630 ..................................................................................................A... KODA27631 ..................................................................................................A... ← Intron2] [Exon 3 → E V P E V T V F P K S P V M L 555555555555555555555555555555555555556666 666 666 666 666 666 666 666 666 666 666 666 666 666 666 666 666666667777777777888888888899999999990000 000 000 111 111 111 122 222 223 333 333 333 444 444 444 455 567890123456789012345678901234567890123456 789 012 345 678 901 234 567 890 123 456 789 012 345 678 901 SCEN16011 AGAGCTATTTACAGTTCATATCAGTGCTGCTTCCTCACCACA GAG GTT CCT GAG GTG ACT GTG TTT CCC AAG TCT CCT GTG ATG CTG SCEN16013 .......................................... ... ... ... ... ... ... ... ... ... ... ... ... ... ... ... KAT329 .......................................... ... ... ... ... ... ... ... ... ... ... ... ... ... ... ... KODA27629 .......................................... ... ... ... ... ... ... ... ... ... ... ... ... ... ... ... KODA27630 .......................................... ... ... ... ... ... ... ... ... ... ... ... ... ... ... ... KODA27631 .......................................... ... ... ... ... ... ... ... ... ... ... ... ... ... ... ... __________________________________________________________________________________________________________________
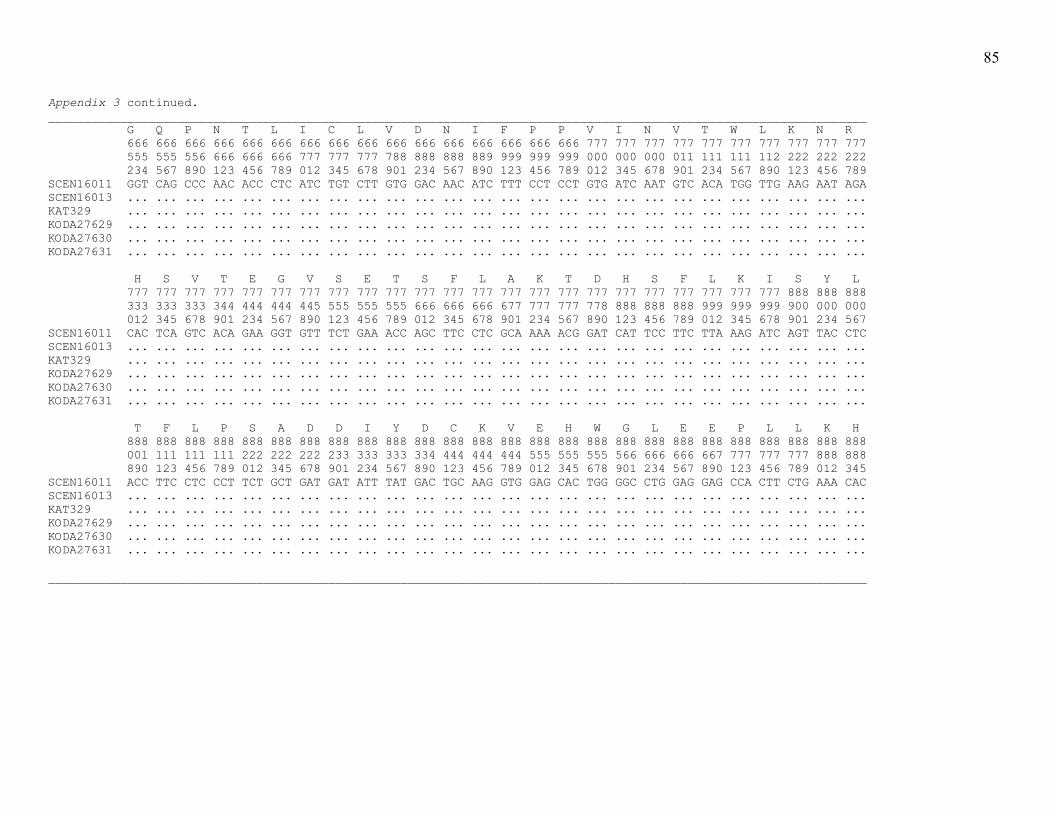
85
Appendix 3 continued. __________________________________________________________________________________________________________________ G Q P N T L I C L V D N I F P P V I N V T W L K N R 666 666 666 666 666 666 666 666 666 666 666 666 666 666 666 666 777 777 777 777 777 777 777 777 777 777 555 555 556 666 666 666 777 777 777 788 888 888 889 999 999 999 000 000 000 011 111 111 112 222 222 222 234 567 890 123 456 789 012 345 678 901 234 567 890 123 456 789 012 345 678 901 234 567 890 123 456 789 SCEN16011 GGT CAG CCC AAC ACC CTC ATC TGT CTT GTG GAC AAC ATC TTT CCT CCT GTG ATC AAT GTC ACA TGG TTG AAG AAT AGA SCEN16013 ... ... ... ... ... ... ... ... ... ... ... ... ... ... ... ... ... ... ... ... ... ... ... ... ... ... KAT329 ... ... ... ... ... ... ... ... ... ... ... ... ... ... ... ... ... ... ... ... ... ... ... ... ... ... KODA27629 ... ... ... ... ... ... ... ... ... ... ... ... ... ... ... ... ... ... ... ... ... ... ... ... ... ... KODA27630 ... ... ... ... ... ... ... ... ... ... ... ... ... ... ... ... ... ... ... ... ... ... ... ... ... ... KODA27631 ... ... ... ... ... ... ... ... ... ... ... ... ... ... ... ... ... ... ... ... ... ... ... ... ... ... H S V T E G V S E T S F L A K T D H S F L K I S Y L 777 777 777 777 777 777 777 777 777 777 777 777 777 777 777 777 777 777 777 777 777 777 777 888 888 888 333 333 333 344 444 444 445 555 555 555 666 666 666 677 777 777 778 888 888 888 999 999 999 900 000 000 012 345 678 901 234 567 890 123 456 789 012 345 678 901 234 567 890 123 456 789 012 345 678 901 234 567 SCEN16011 CAC TCA GTC ACA GAA GGT GTT TCT GAA ACC AGC TTC CTC GCA AAA ACG GAT CAT TCC TTC TTA AAG ATC AGT TAC CTC SCEN16013 ... ... ... ... ... ... ... ... ... ... ... ... ... ... ... ... ... ... ... ... ... ... ... ... ... ... KAT329 ... ... ... ... ... ... ... ... ... ... ... ... ... ... ... ... ... ... ... ... ... ... ... ... ... ... KODA27629 ... ... ... ... ... ... ... ... ... ... ... ... ... ... ... ... ... ... ... ... ... ... ... ... ... ... KODA27630 ... ... ... ... ... ... ... ... ... ... ... ... ... ... ... ... ... ... ... ... ... ... ... ... ... ... KODA27631 ... ... ... ... ... ... ... ... ... ... ... ... ... ... ... ... ... ... ... ... ... ... ... ... ... ... T F L P S A D D I Y D C K V E H W G L E E P L L K H 888 888 888 888 888 888 888 888 888 888 888 888 888 888 888 888 888 888 888 888 888 888 888 888 888 888 001 111 111 111 222 222 222 233 333 333 334 444 444 444 555 555 555 566 666 666 667 777 777 777 888 888 890 123 456 789 012 345 678 901 234 567 890 123 456 789 012 345 678 901 234 567 890 123 456 789 012 345 SCEN16011 ACC TTC CTC CCT TCT GCT GAT GAT ATT TAT GAC TGC AAG GTG GAG CAC TGG GGC CTG GAG GAG CCA CTT CTG AAA CAC SCEN16013 ... ... ... ... ... ... ... ... ... ... ... ... ... ... ... ... ... ... ... ... ... ... ... ... ... ... KAT329 ... ... ... ... ... ... ... ... ... ... ... ... ... ... ... ... ... ... ... ... ... ... ... ... ... ... KODA27629 ... ... ... ... ... ... ... ... ... ... ... ... ... ... ... ... ... ... ... ... ... ... ... ... ... ... KODA27630 ... ... ... ... ... ... ... ... ... ... ... ... ... ... ... ... ... ... ... ... ... ... ... ... ... ... KODA27631 ... ... ... ... ... ... ... ... ... ... ... ... ... ... ... ... ... ... ... ... ... ... ... ... ... ... __________________________________________________________________________________________________________________
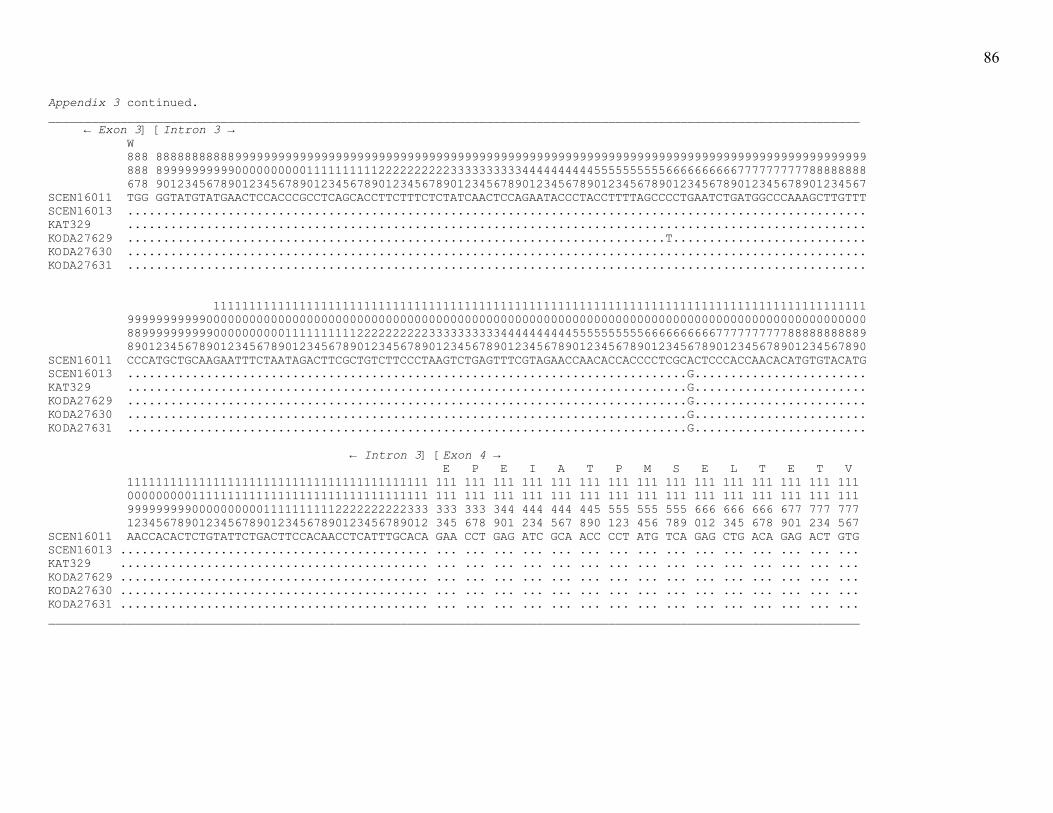
86
Appendix 3 continued. _________________________________________________________________________________________________________________ ← Exon 3] [Intron 3 → W 888 888888888889999999999999999999999999999999999999999999999999999999999999999999999999999999999999999 888 899999999990000000000111111111122222222223333333333444444444455555555556666666666777777777788888888 678 901234567890123456789012345678901234567890123456789012345678901234567890123456789012345678901234567 SCEN16011 TGG GGTATGTATGAACTCCACCCGCCTCAGCACCTTCTTTCTCTATCAACTCCAGAATACCCTACCTTTTAGCCCCTGAATCTGATGGCCCAAAGCTTGTTT SCEN16013 ....................................................................................................... KAT329 ....................................................................................................... KODA27629 ...........................................................................T........................... KODA27630 ....................................................................................................... KODA27631 ....................................................................................................... 1111111111111111111111111111111111111111111111111111111111111111111111111111111111111111111 9999999999900000000000000000000000000000000000000000000000000000000000000000000000000000000000000000000 8899999999990000000000111111111122222222223333333333444444444455555555556666666666777777777788888888889 8901234567890123456789012345678901234567890123456789012345678901234567890123456789012345678901234567890 SCEN16011 CCCATGCTGCAAGAATTTCTAATAGACTTCGCTGTCTTCCCTAAGTCTGAGTTTCGTAGAACCAACACCACCCCTCGCACTCCCACCAACACATGTGTACATG SCEN16013 ..............................................................................G........................ KAT329 ..............................................................................G........................ KODA27629 ..............................................................................G........................ KODA27630 ..............................................................................G........................ KODA27631 ..............................................................................G........................ ← Intron 3] [Exon 4 → E P E I A T P M S E L T E T V 111111111111111111111111111111111111111111 111 111 111 111 111 111 111 111 111 111 111 111 111 111 111 000000000111111111111111111111111111111111 111 111 111 111 111 111 111 111 111 111 111 111 111 111 111 999999999000000000011111111112222222222333 333 333 344 444 444 445 555 555 555 666 666 666 677 777 777 123456789012345678901234567890123456789012 345 678 901 234 567 890 123 456 789 012 345 678 901 234 567 SCEN16011 AACCACACTCTGTATTCTGACTTCCACAACCTCATTTGCACA GAA CCT GAG ATC GCA ACC CCT ATG TCA GAG CTG ACA GAG ACT GTG SCEN16013 ........................................... ... ... ... ... ... ... ... ... ... ... ... ... ... ... ... KAT329 ........................................... ... ... ... ... ... ... ... ... ... ... ... ... ... ... ... KODA27629 ........................................... ... ... ... ... ... ... ... ... ... ... ... ... ... ... ... KODA27630 ........................................... ... ... ... ... ... ... ... ... ... ... ... ... ... ... ... KODA27631 ........................................... ... ... ... ... ... ... ... ... ... ... ... ... ... ... ... _________________________________________________________________________________________________________________
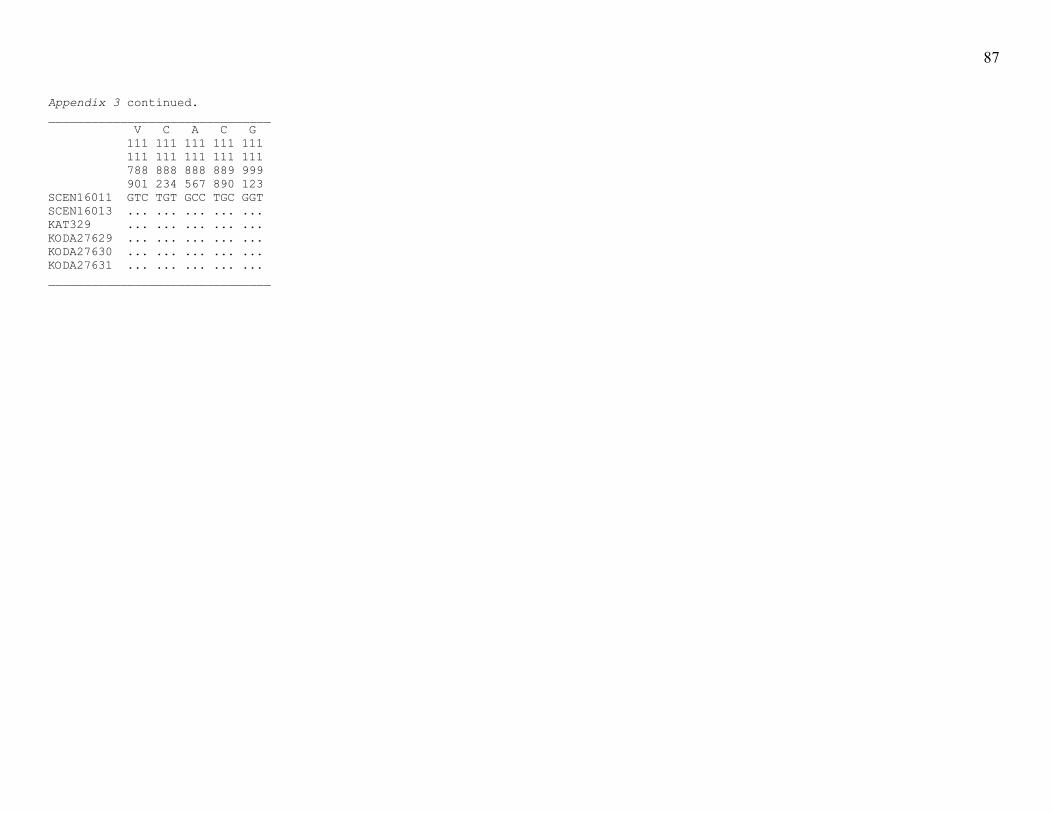
87
Appendix 3 continued. _______________________________ V C A C G 111 111 111 111 111 111 111 111 111 111 788 888 888 889 999 901 234 567 890 123 SCEN16011 GTC TGT GCC TGC GGT SCEN16013 ... ... ... ... ... KAT329 ... ... ... ... ... KODA27629 ... ... ... ... ... KODA27630 ... ... ... ... ... KODA27631 ... ... ... ... ... _______________________________