genetic divergence in the atlantic–mediterranean ... -...
TRANSCRIPT
Molecular Ecology (2007)
16
, 3592–3605 doi: 10.1111/j.1365-294X.2007.03405.x
© 2007 The AuthorsJournal compilation © 2007 Blackwell Publishing Ltd
Blackwell Publishing Ltd
Genetic divergence in the Atlantic–Mediterranean Montagu’s blenny,
Coryphoblennius galerita
(Linnaeus 1758) revealed by molecular and morphological characters
VERA S . DOMINGUES,
*†
CLÁUDIA FARIA,
*
SERGIO STEFANNI,
†
R ICARDO S . SANTOS,
†
ALBERTO BRITO
‡
and VITOR C. ALMADA
*
*
Instituto Superior de Psicologia Aplicada, Unidade de Investigação em Eco-Etologia, R. Jardim do Tabaco 34, 1149-041 Lisboa, Portugal
, †
Departamento de Oceanografia e Pescas, Universidade dos Açores, 9901-862 Horta, Acores, Portugal
, ‡
Universidad de La Laguna, Dpto. Biología Animal (Ciencias Marinas), Avenida Astrofísico Francisco Sánchez s/n, 38206 La Laguna, Tenerife, Islas Canarias, Spain
Abstract
Coryphoblennius galerita
is a small intertidal fish with a wide distribution and limiteddispersal ability, occurring in the northeastern Atlantic and Mediterranean. In this study,we examined Atlantic and Mediterranean populations of
C. galerita
to assess levels ofgenetic divergence across populations and to elucidate historical and contemporary factorsunderlying the distribution of the genetic variability. We analyse three mitochondrial andone nuclear marker and 18 morphological measurements. The combined dataset clearlysupports the existence of two groups of
C. galerita
: one in the Mediterranean and anotherin the northeastern Atlantic. The latter group is subdivided in two subgroups: Azores andthe remaining northeastern Atlantic locations. Divergence between the Atlantic and theMediterranean can be the result of historical isolation between the populations of the twobasins during the Pleistocene glaciations. Present-day barriers such as the Gibraltar Straitor the ‘Almeria-Oran jet’ are also suggested as responsible for this isolation. Our resultsshow no signs of local extinctions during the Pleistocene glaciations, namely at the Azores,and contrast with the biogeographical pattern that has been observed for Atlantic–Mediterranean warm-water species, in which two groups of populations exist, one includingthe Mediterranean and the Atlantic coast of western Europe, and another encompassing thewestern tropical coast of Africa and the Atlantic islands of the Azores, Madeira andCanaries. Species like
C. galerita
that tolerate cooler waters, may have persisted during thePleistocene glaciations in moderately affected locations, thus being able to accumulategenetic differences in the more isolated locations such as the Azores and the Mediterranean.This study is one of the first to combine morphological and molecular markers (mitochondrialand nuclear) with variable rates of molecular evolution to the study of the relationships ofthe Atlantic and Mediterranean populations of a cool-water species.
Keywords
:
Coryphoblennius galerita
, Mediterranean, morphology, mt/nDNA, northeastern Atlantic,population structure
Received 13 January 2007; revision accepted 27 April 2007
Introduction
The study of genetic divergence and speciation in themarine environment represents a great challenge. Marinepopulations tend to be large and marine species often
have high fecundity and larvae that can disperse over longdistances. Thus, marine species are usually expected toshow high levels of gene flow and low geographicaldifferentiation. However, increasing evidence indicatesthat at least partially isolated populations may occur quitecommonly in marine systems (e.g. Doherty
et al
. 1995;Shulman & Bermingham 1995; Bernardi 2000; Riginos &Nachman 2001; Stefanni & Thorley 2003; Taylor & Hellberg
Correspondence: Vera S. Domingues, Fax: +351 218860954; E-mail:[email protected]
G E N E T I C D I V E R G E N C E O F
C O R Y P H O B L E N N I U S G A L E R I T A
3593
© 2007 The AuthorsJournal compilation © 2007 Blackwell Publishing Ltd
2003; Baus
et al
. 2005). Several mechanisms have beenproposed by which marine species with high dispersalpotential can diverge genetically. These include vicarianceprocesses caused by past barriers; oceanographic currents;habitat discontinuities; local adaptation; larval behaviour;isolation by distance and limited dispersal to new areaspromoting genetic differentiation (Palumbi 1994; Riginos& Nachman 2001 and references therein).
In this regard, the northeastern Atlantic, including theMacaronesian islands, together with the Mediterraneanconstitute very interesting study cases. Different areaswithin these regions were differentially affected by dropsin sea surface temperature associated with the Pleistoceneglaciations. The shores of west Europe endured polarconditions during the glacial maxima, with very cold watersalso present along the northwestern African coast (Crowley1981; Dias
et al
. 1997) and, to some extent, the Canary Islands(Lamb 1977; Crowley 1981). At the Azores, temperaturedrops were moderate (about 2–3
°
C; Crowley 1981), whileMadeira, the tropical western coast of Africa and somesouthern Mediterranean areas were little affected (Thiede1978). These fluctuations led to local extinctions andlatitudinal shifts of many taxa, namely those that are onlycapable of living in warmer waters (Almada
et al
. 2001;Domingues
et al
. 2006). After warmer conditions wererestored, recolonization probably occurred from some lessaffected regions that may have acted as refugia. Thus,vicariance and dispersal have very likely played an importantrole in the evolutionary history of the marine fauna of thenortheastern Atlantic and the Mediterranean.
Oceanic currents should also be taken in considerationwhen identifying the factors that influence the distributionof the genetic variability in a particular region, especiallywhen studying coastal organisms whose dispersal capabilitiesare restricted to their planktonic larval phases. Thenortheastern Atlantic current system is dominated by amultibranch complex system that has its origin in the GulfStream (Stramma 1984). The circulation flows predominantlyto the east and northeast, bringing warm water to Europe.However, one branch of the system turns south originatingthe cold water Canaries current which runs parallel to theshores of southwest Europe and northwest Africa, reachingMadeira and the Canaries (Stramma 1984; Santos
et al
.1995) (Fig. 1). However, meanders and eddies also causesporadic transport of water and plankton from Madeira toAzores (Santos
et al
. 1995). The impact of currents in theCanary Islands also generates a complex system of eddiesthat promotes transport towards the north in the westernislands (Molina
et al
. 1996). These eddies make the con-nection between the Canaries and Madeira possible, withthe Salvage Islands possibly acting as a stepping-stone.Between the West African shore and the Canary Islands,upwelling filaments can also cause sporadic transporttowards the islands (Barton
et al
. 1998; Rodríguez
et al
. 1999;
Bécognée
et al
. 2006). The Atlantic and the Mediterraneancommunicate by the Gibraltar Strait, which is characterizedby a two-layer flow regime. Atlantic waters inflow in theupper layer and Mediterranean waters outflow in thelower layer (Malanotte-Rizzoli & Bergamasco 1989; Özgökmen
et al
. 2001). Close to the Gibraltar Strait, the water in theAlboran Sea describes a quasi-permanent anticyclonicgyre that generates another oceanographic barrier knownas the ‘Almerian-Oran jet’ (Millot 1999) (Fig. 1).
The effects of the Pleistocene glaciations together withthe circulation patterns described above for the Atlanticand the Mediterranean have been suggested to be responsiblefor a major biogeographical break between the tworegions. Results, however, are not conclusive since theextent of the differentiation varies across species. Indeed,some species such as the seabream
Diplodus puntazzo
(Bargelloni
et al
. 2005), the sea bass
Dicentrarchus labrax
(Lemaire
et al
. 2005), the cuttlefish
Sepia officinalis
(Pérez-Losada
et al
. 2002) and the sponge
Crambe crambe
(Duran
et al
. 2004) show high levels of genetic differentiationbetween Atlantic and Mediterranean populations, whileothers like the damselfish
Chromis chromis
(Domingues
et al
. 2005), the seabream
Diplodus sargus
(Bargelloni
et al
.2005; Domingues
et al
. 2007a), the wrasse
Thalassoma pavo
(Costagliola
et al
. 2004) and the Norway lobster
Nephropsnorvergicus
(Stamatis
et al
. 2004) show no genetic partitionbetween the Atlantic and the Mediterranean.
The phylogeographical patterns of Atlantic–Mediterraneanfishes described in recent studies have revealed geneticsignatures of the effects of Pleistocene glaciations on thedifferent populations. Incidentally, these patterns areconsistent with transport of eggs and larvae that arepossible with the current regime described for these watermasses. Warm-water species such as
Tripterygion delaisi
(Domingues
et al
. 2007b),
Chromis chromis/ Chromis limbata
(Domingues
et al
. 2006) and
Parablennius sanguinolentus/Parablennius parvicornis
(Almada
et al
. 2005) show twogroups of populations: one including the Mediterraneanand adjacent European Atlantic coast and another thatcomprises the western coast of Africa and the Macaronesianislands. According to the studies mentioned above, thisdual pattern can be explained by local extinctions at thetime of the glacial peaks in the more affected regions(Azores, Canaries and European Atlantic coast) followedby postglacial colonization from warmer refugia such asMadeira and the tropical coast of Africa, in the case of theAzores, and the southern regions of the Mediterranean, inthe case of the Atlantic Europe. The differentiation betweenthese two groups is not only supported by molecular diver-gences but also by differences in morphologic characters.
P. parvicornis
/
P. sanguinolentus
differ in the number ofspines in the dorsal fin, presence or absence of extra teethin the upper jaw and pigmentation (Almada
et al
. 2005 andreferences therein). Although the two groups of
T. delaisi
3594
V . S . D O M I N G U E S
E T A L .
© 2007 The AuthorsJournal compilation © 2007 Blackwell Publishing Ltd
have not been described as distinct species, differences inthe number of rays of the second dorsal, and in the numberof scales in the lateral line have been described, as well ascolour and behavioural variation between the two forms(Domingues
et al
. 2007b and references therein). Interest-ingly, cool-water species such as
Liphophrys pholis
(Stefanni
et al
. 2006) and
Parablennius ruber
(Almada
et al
. 2007) seemto have been able to survive the cooler periods in theAzores. In the case of
L. pholis
, the Azorean populationshows a strong genetic differentiation that is accompaniedby meristic differences in the number of rays of the dorsaland anal fins (Stefanni
et al
. 2006).
Coryphoblennius galerita
(Linnaeus 1758), the single memberof its genus, is a small benthic fish living in exposed rockyshores in the littoral zone (Zander 1986). The species is
present in the eastern Atlantic (from the southwesterncoast of Britain to Cape Juby in the Saharian coast, includingthe Azores, Madeira and Canary Islands) and in theMediterranean including the Black Sea (Zander 1986;Quéro
et al
. 1990; Falcón
et al
. 2002). This species breedsfrom spring to summer in the Atlantic, although the extentof the breeding season varies with latitude (Almada
et al
.1996). In the Mediterranean, breeding can also take place inwinter (Richtarski & Patzner 2000). Females spawn demersaleggs that are cared for by the males until hatching (Almada
et al
. 1983; Milton 1983). Dispersal is restricted to theplanktonic larval phase of about 26–27 days (Raventós &Macpherson 2001). The large distribution range of
C. galerita,
together with its limited dispersal ability, suggests theexistence of population structure for this species. Bath (1978),
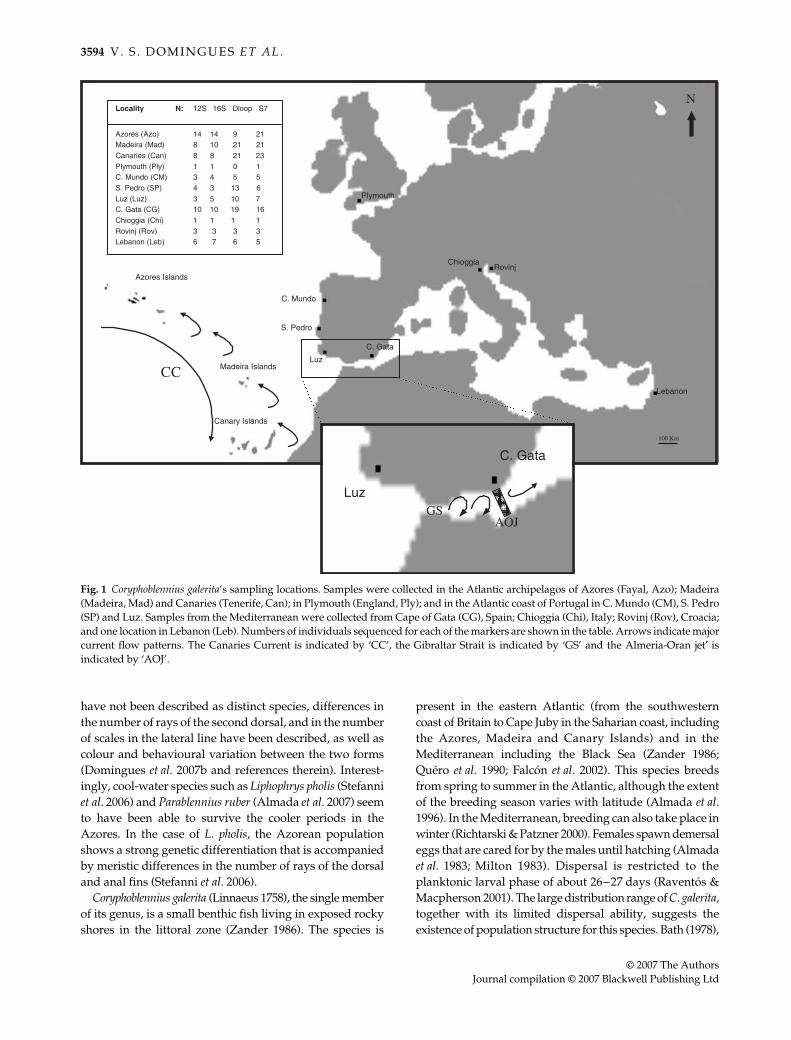
Fig. 1 Coryphoblennius galerita’s sampling locations. Samples were collected in the Atlantic archipelagos of Azores (Fayal, Azo); Madeira(Madeira, Mad) and Canaries (Tenerife, Can); in Plymouth (England, Ply); and in the Atlantic coast of Portugal in C. Mundo (CM), S. Pedro(SP) and Luz. Samples from the Mediterranean were collected from Cape of Gata (CG), Spain; Chioggia (Chi), Italy; Rovinj (Rov), Croacia;and one location in Lebanon (Leb). Numbers of individuals sequenced for each of the markers are shown in the table. Arrows indicate majorcurrent flow patterns. The Canaries Current is indicated by ‘CC’, the Gibraltar Strait is indicated by ‘GS’ and the Almeria-Oran jet′ isindicated by ‘AOJ’.
G E N E T I C D I V E R G E N C E O F
C O R Y P H O B L E N N I U S G A L E R I T A
3595
© 2007 The AuthorsJournal compilation © 2007 Blackwell Publishing Ltd
based on morphological data (fin rays and colouration),found differences in the Atlantic and Mediterraneanpopulations, and also between fishes from Madeira andCanaries. Indeed, Almada
et al
. (2005), in a study of thephylogeny of the northeastern Atlantic and Mediterraneanblenniids, found substantial divergence between conservedmitochondrial DNA (mtDNA) sequences of
C. galerita
fromthe Mediterranean and the Atlantic. The same authors alsofound that in the Atlantic there was a clear genetic diver-gence between mainland shores of Europe and Madeira onone hand and the Azores on the other. However, samplesizes were small and no definitive conclusions wereattempted on this issue.
Several factors make the study of
C. galerita
very promising.It inhabits areas that experienced very distinct glacial effectsand differ in present-day ecological and oceanographicconditions. In this study we examined Atlantic andMediterranean populations of
C. galerita
, including theeastern Atlantic archipelagos of the Azores, Madeira andCanaries, to assess the levels of genetic divergence of thiswidely distributed blenniid. Since it is well known that thecombined analysis of patterns seen in different loci is veryinformative when studying spatial and temporal geneticstructure (Slatkin & Maddison 1989), we employed threemitochondrial and one nuclear markers with differentrates of molecular evolution. Additionally, we combinedthe molecular survey with an analysis of morphologicalcharacters. Judging from the geographical distribution of
C. galerita
, which has its northern limit in the southwesterncoast of Britain, this species must have been able to survivethe cold temperatures of the Pleistocene glaciations inmoderately affected regions such as the Azores Islands. Wethus expect the distribution of
C. galerita
genetic diversity toconform to the scenario described for the cooler-waterspecies, where strong genetic differentiation betweenpopulations is found. This may also be accompanied bysome degree of morphological differentiation. This is oneof the first studies to apply a comparative analysis ofmolecular and morphological traits to a cool-water species.We believe that this approach will shed light on the evolu-tionary history of the species and will also contribute to theelucidation of the biogeographical scenarios that are nowemerging for the northeastern Atlantic and the Mediterranean.
Materials and methods
Sampling
A total of 132
Coryphoblennius galerita
were collected fromseven locations in the Atlantic and four locations in theMediterranean (Fig. 1). Samples were collected in tide-pools using hand nets. Fin clips were cut immediately aftercollection of the individuals and stored at ambienttemperature in 95% ethanol.
Molecular analysis
DNA extraction, amplification and sequencing.
Total genomicDNA was extracted by SDS proteinase K procedure andpurified by standard chloroform and isopropanol precipitation(Sambrook
et al
. 1989). Fragments of the conserved 12S and16S ribosomal DNA (rDNA) mitochondrial genes wereamplified for a subset of our samples using primers andpolymerase chain reaction (PCR) conditions described inAlmada
et al
. (2005). Amplification of the 5
′
hypervariableportion of the mitochondrial control region (also calledD-loop) was performed for a larger number of individuals,using primers and PCR conditions described in Ostellari
et al
. (1996). In addition, we amplified the first intron of theS7 ribosomal protein gene, using primers S7RPEX1F andS7RPEX2R (Chow & Hazama 1998), and an annealingtemperature of 56
°
C. After purification following themanufacturer’s protocol (Applied Biosystems), directsequencing was performed with an ABI 3100 automatedsequencer (Applied Biosystems).
For the first intron of the S7 ribosomal protein gene, thetwo strands of each individual were recovered using one oftwo methods. (i) For the individuals that showed hetero-zygous indels, we used double peaks in chromatogramsgenerated as artefacts in the vicinity of the heterozygousindels to identify the specific sequences present in individualstrands, following the approach described by Sousa-Santos
et al
. (2005). (ii) Both strands of the individuals thatdid not possess heterozygous indels, but that showedheterozygous positions, were recovered using a set ofspecific amplifications. Heterozygous positions wereidentified as double peaks in the chromatograms obtainedwith S7RPEX1F and S7RPEX2R primers, and specific primerswere designed for the amplification of only one of thesequences of each individual. The last base of each of theseprimers consisted of one of the bases in the first or lastheterozygous positions of the individual. Amplificationswere then made using the specific primer in combinationwith S7RPEX1F or S7RPEX2R under high annealingtemperatures in order to assure specificity. A total of 14primers were required to obtain the two strains of all theindividuals (primer sequences and PCR conditions availablefrom authors upon request). Direct sequencing was thenperformed using S7RPEX1F or S7RPEX2R primers.
DNA sequences and phylogenetic analyses.
Sequences werealigned using the program
clustal v
(Higgins
et al
. 1991)implemented by
sequence navigator
(Applied Biosystems).Diversity indexes were calculated using the softwarepackage
arlequin
(version 2.000; Schneider
et al
. 2000).The computer program
modeltest
version 3.7 (Posada &Crandall 1998) was used to determine a model of sequenceevolution that best fitted each gene. The Akaike InformationCriterion (AIC) was chosen since it yields more reliable

3596
V . S . D O M I N G U E S
E T A L .
© 2007 The AuthorsJournal compilation © 2007 Blackwell Publishing Ltd
results (Posada & Buckley 2004). Phylogenetic relationshipswithin
C. galerita
were assessed using Bayesian inference,performed in
mrbayes
3.0b4 (Huelsenbeck & Ronquist2001). The blenniid
Lipophrys trigloides
was used as outgroup.The data set was divided into four gene partitions (12S, 16S,D-loop and S7), which were assigned separate (unlinked)parameters to accommodate gene-specific differencesin evolutionary rate. The general model selected by
modeltest
was used for the analysis, allowing
mrbayes
toestimate the parameters in that model. The general-time-reversible (GTR) model with equal rates was chosen for12S and 16S and the GTR model with gamma rates wasused for D-loop and S7. Monte Carlo Markov chains wererun for 5000 000 generations saving a tree every 100generations. To help ensure that stationarity was reached,we discarded the first 15 000 generations (150 sampledtrees) as burn-in and used the remaining 4985 000 genera-tions (49 850 sampled trees) in all subsequent analysis. Amajority-rule consensus tree calculated from the 49 850remaining trees was constructed and used to determine theposterior probabilities of clades. Phylogenetic trees werealso obtained using the mitochondrial and the nuclearsequences separately.
Gene flow and population structure.
Individuals were groupedforming five samples (see Fig. 1): Azores, Madeira,Canaries, Portugal (including samples from C. Mundo,S. Pedro, Luz and also the sample from Plymouth) andwestern Mediterranean (C. Gata). Samples from the re-maining locations of the Mediterranean belonged to theeastern basin and were only included in the phylogeneticanalysis. Gene flow (
F
ST
) between the five locations wasestimated. Corrections for simultaneous multiple comparisonswere applied using sequential Bonferroni correction (Rice1989). Population structure was determined by an analysisof molecular variance (
amova
; Excoffier
et al
. 1997) usingthe program
arlequin
(version 2.000; Schneider
et al
. 2000).Population average pairwise differences were estimatedand results were visualized using a multidimensionalscaling analysis implemented by
statistica
(
version 7.0;Statsoft Inc.). These analyses were performed for a combineddataset including the two slow evolving mitochondrialgenes (12S and 16S rDNA) and for the D-loop and S7 intronseparately.
Historical demography.
Sequences were pooled formingthree groups of populations (Group 1, Azores; Group2, Madeira, Canaries and Portugal; Group 3, Mediterranean)according to the phylogeny results. The historical demo-graphy of the three populations was examined usingmismatch distributions analysis performed in
arlequin
2.0. Theoretical studies have shown that populations inlong stable demographic equilibrium show a chaoticmismatch distribution, while rapid population expansions
or bottlenecks are reflected in a unimodal (approximatelyPoisson) profile (Rogers & Harpending 1992; Rogers 1995).Mismatch distributions were established and their fitto Poisson distributions was assessed by Monte Carlosimulations of 1000 random samples. The sum of squaredeviations (SSD) between observed and expected mismatchdistributions was used as a test statistics, its
P
valuerepresenting the probability of obtaining a simulated SSDlarger or equal to the observed one (Schneider & Excoffier1999). The parameters of the expansion
θ
0
,
θ
1
, and
τ
wereestimated and the time of the expansion (
t
) was estimatedusing the formula
τ
= 2tµ, where µ is the mutation rate. Inthe absence of an estimate of µ for the mitochondrialcontrol region of blenniids, we used µ = 8.24 × 10⁻⁸ thatwas estimated using an internally calibrated molecularclock for two pomacentrid sister species separated by theclosure of the Isthmus of Panama (Domingues et al. 2005).We did not attempt to estimate the time of the expansionusing the S7 intron data, since there is not any estimationof the mutation rate of this intron.
In addition, Tajima’s D neutrality test (Tajima 1989) wasused to detect possible population expansions.
Morphological analysis
Measurements. A total of 84 fish were measured: 25 fromAzores; 11 from Madeira; 21 from Canaries; 11 fromC. Mundo (Portugal) and 16 from the Mediterranean. Atotal of 18 measurements were taken for each fish, usingcallipers to a precision of 0.1 mm: total length (TL);standard length (SL); head length (HL, from the tip of thesnout to the rear edge of the opercular bone); snout length(SnL, pre-orbital); pre-anal length (PreAL, from the tip ofthe snout to the base of the first ray of the anal fin);predorsal length (PreDL), ibidem to the base of the first rayof the dorsal (fin); length of the ventral fin (LV, from thebase to the end of the longest ray); length of the pectoral fin(LP, from the base to the end of the longest ray); headheight (HH, measured at the level of the opercular bone);pre-orbital width (PreOW); eye diameter (YD); body widthat the insertion of the pectoral fin (WIP); body width at thelevel of the anus (WA); body height at the insertion of thepectoral fin (HIP); mouth perimeter (MP); mouth width(MW); crest width (CW, measured at the base of the crest);crest height (CH). The number of rays of the different finswas also counted. Sex was determined by direct observationof the genital papilla.
Statistical analysis. To compare the populations discriminantanalysis was performed on the residuals obtained fromlog-log regressions of each continuous measure over thestandard length. upgma cluster analysis was used to builda phenogram based on the Squared Mahalanobis Distancesobtained in the discriminant analysis. upgma cluster

G E N E T I C D I V E R G E N C E O F C O R Y P H O B L E N N I U S G A L E R I T A 3597
© 2007 The AuthorsJournal compilation © 2007 Blackwell Publishing Ltd
analysis was conducted using the phylip software package(Felsenstein 1989). As crest width and height residualswere the features with the highest contribution to theseparation of populations, they were separately analysedusing anova with the Tukey HDS test for post hoccomparisons among populations. Differences on meristicdata were tested using actus (Estabrook & Estabrook1989), a simulation statistic procedure designed to analysecontingency tables that is not limited by the assumptions ofconventional χ2 tests and that apart from assessing theoverall significance of the table, allows assessment of thesignificance of deviations between observed and expectedfrequencies for each individual cell.
Results
Molecular analysis
DNA sequences and phylogenetics analyses. A total of 61 12SrDNA sequences, 66 16S rDNA sequences, 108 D-loopsequences and 218 S7 first intron sequences (correspondingto 109 individuals) were obtained (Fig. 1). Some of the 12Sand 16S sequences were available in GenBank (accessionnos: AY098816–AY098816 and AY098749–AY098755). Theremaining sequences were registered in GenBank (accessionnos: EF520774–EF520790, EF521602–EF521813 and EF527585–EF527802). The 12S and 16S rDNA sequences were 395-bpand 568-bp long, respectively, and no gaps were requiredfor their alignment. Ribosomal DNA (12S) sequences showeda total of eight polymorphic sites, while 32 polymorphicsites were found for 16S rDNA sequences. Sequences of themitochondrial control region showed a complex patterncomposed by sequence motifs of variable length, whichwere repeated several times. The motif TATATGTACTAwas found in every sequence. However, variations of thismotif were found to be characteristic of each geographical
region. Sequences from the Mediterranean were composedby a variable number of TATATGTACTAGG repeats,while the motif TATATGTACTATACAC was only foundin the Azores and the motif TATATGTACTATACAG-TATATGTATGGGTACA was characteristic of Portugal,Canaries and Madeira. These motifs occurred in the centralregion of the sequences and, because of the variable timesthat they are repeated, the alignment was very difficult.Thus, we opted to exclude the central region of thesequences and decided to base our analysis on theremaining 312 bp. For the first intron of the S7 ribosomalprotein gene, a fragment of 636 bp was obtained. Therewas one fixed difference between Mediterranean andAtlantic individuals and 76 heterozygous positions. Ofthese, 73 positions were only heterozygous in individualsfrom the Atlantic or the Mediterranean and the remainingthree showed heterozygosity in the two locations.
Diversity indexes based on the four genes sequences areshown in Table 1. The Bayesian phylogeny built using thecombined dataset of the four genes shows the existence oftwo strongly supported monophyletic groups, one includingthe Mediterranean samples and another comprehendingthe Atlantic haplotypes (Fig. 2). Within the Atlantic group,Azores haplotypes cluster together in a strongly supportedmonophyletic clade, while another very well-supportedclade groups fish from mainland Portugal, England,Madeira and Canaries. Phylogenetic reconstructions basedon the mitochondrial genes only showed the same pattern(Fig. S1, Supplementary material). The tree based on thenuclear intron groups the Atlantic haplotypes in a mono-phyletic clade, which includes the Azorean haplotypes.The haplotypes from the Mediterranean did not form amonophyletic clade (Fig. S2, Supplementary material).
Gene flow and population structure. Gene flow (FST) betweenCoryphoblennius galerita locations was determined (Table 2).
Table 1 Collection localities of Coryphoblennius galerita used in the present study and diversity indexes for 12srDNA, 16SrDNA, D-loop andS7 intro sequences. Number of haplotypes (Hn), haplotype/gene diversity (Hd/Gd), and nucleotide diversity (π) for each population areshown
12SrDNA 16SrDNA D-loop S7
Hn Hd π Hn Hd π Hn Hd π Hn Gd π
Azores 2 0.143 0.000 2 0.143 0.000 5 0.556 0.005 26 0.959 0.005Madeira 1 0.000 0.000 1 0.000 0.000 8 0.381 0.055 21 0.928 0.002Canaries 3 0.464 0.001 1 0.000 0.000 7 0.333 0.003 28 0.936 0.004Portugal 1 0.000 0.000 4 0.421 0.000 15 0.536 0.010 21 0.944 0.001Total Atlantic 5 0.539 0.005 6 0.539 0.014 35 0.443 0.009 73 0.949 0.003Cape of Gata, Spain 2 0.556 0.001 4 0.644 0.001 19 1 0.016 29 0.994 0.010Chioggia, Italy 1 0.000 0.000 1 — — 1 — — 2 — —Rovinj, Croacia 1 0.000 0.000 2 0.556 0.001 3 1 0.013 5 9.933 0.006Lebanon 1 0.000 0.000 5 0.857 0.004 6 1 0.027 9 0.978 0.011Total Mediterranean 2 0.395 0.001 8 0.676 0.002 18 0.621 0.036 45 0.996 0.010

3598 V . S . D O M I N G U E S E T A L .
© 2007 The AuthorsJournal compilation © 2007 Blackwell Publishing Ltd
Gene flow between the Mediterranean and all the otherlocations was very restricted for all the molecular markers.FST values between the Azores and the other locationswere high for the mitochondrial markers, but not for theS7 intron.
The amova based on the mitochondrial markers showedthat a high percentage of the total genetic variance wasexplained by the variance among populations (96.67%, P =0.000 and 85.06%, P = 0.000 for 12S +16SrDNA and D-loop,respectively) pointing to the existence of population structure
Fig. 2 Bayesian phylogeny of Coryphoblennius galerita populations based on sequences from the four genes fragments (12SrDNA, 16SrDNA,D-loop and S7 intron). The dataset was divided into four gene partitions to accommodate gene-specific differences in evolutionary rate.Numbers on branches are posterior probabilities from a consensus tree of all post burn-in topologies visited by the Markov chain. Labelsare described in Fig. 1.
G E N E T I C D I V E R G E N C E O F C O R Y P H O B L E N N I U S G A L E R I T A 3599
© 2007 The AuthorsJournal compilation © 2007 Blackwell Publishing Ltd
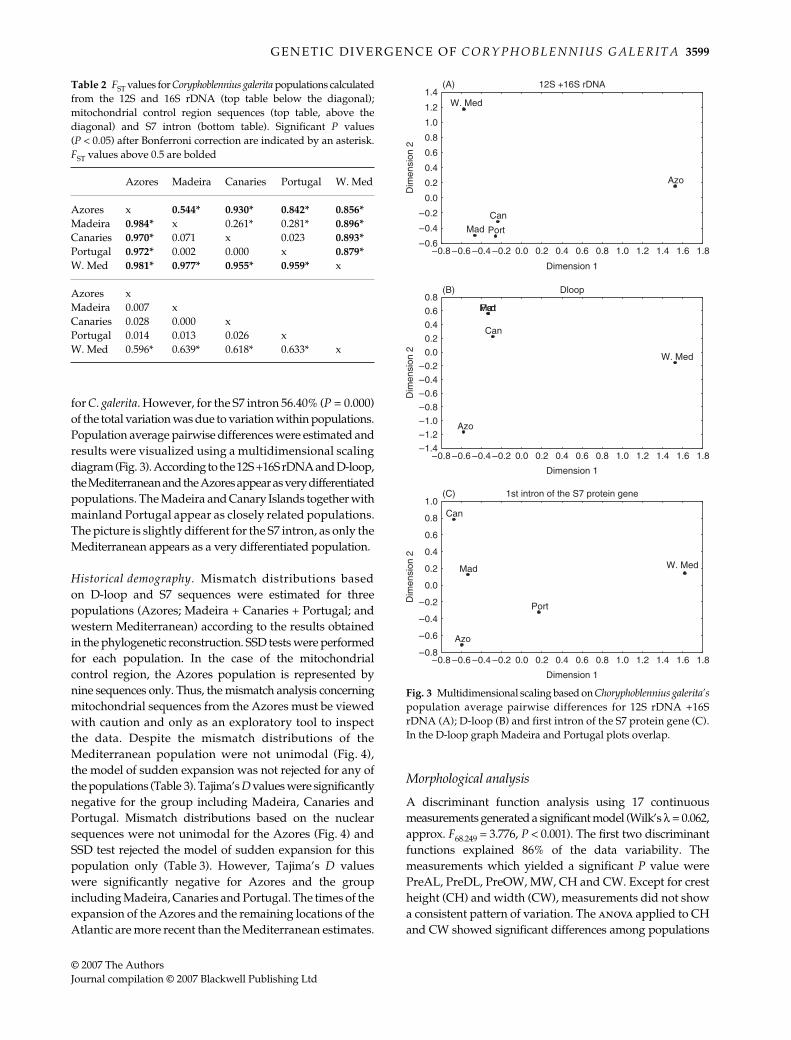
for C. galerita. However, for the S7 intron 56.40% (P = 0.000)of the total variation was due to variation within populations.Population average pairwise differences were estimated andresults were visualized using a multidimensional scalingdiagram (Fig. 3). According to the 12S +16S rDNA and D-loop,the Mediterranean and the Azores appear as very differentiatedpopulations. The Madeira and Canary Islands together withmainland Portugal appear as closely related populations.The picture is slightly different for the S7 intron, as only theMediterranean appears as a very differentiated population.
Historical demography. Mismatch distributions basedon D-loop and S7 sequences were estimated for threepopulations (Azores; Madeira + Canaries + Portugal; andwestern Mediterranean) according to the results obtainedin the phylogenetic reconstruction. SSD tests were performedfor each population. In the case of the mitochondrialcontrol region, the Azores population is represented bynine sequences only. Thus, the mismatch analysis concerningmitochondrial sequences from the Azores must be viewedwith caution and only as an exploratory tool to inspectthe data. Despite the mismatch distributions of theMediterranean population were not unimodal (Fig. 4),the model of sudden expansion was not rejected for any ofthe populations (Table 3). Tajima’s D values were significantlynegative for the group including Madeira, Canaries andPortugal. Mismatch distributions based on the nuclearsequences were not unimodal for the Azores (Fig. 4) andSSD test rejected the model of sudden expansion for thispopulation only (Table 3). However, Tajima’s D valueswere significantly negative for Azores and the groupincluding Madeira, Canaries and Portugal. The times of theexpansion of the Azores and the remaining locations of theAtlantic are more recent than the Mediterranean estimates.
Morphological analysis
A discriminant function analysis using 17 continuousmeasurements generated a significant model (Wilk’s λ = 0.062,approx. F68.249 = 3.776, P < 0.001). The first two discriminantfunctions explained 86% of the data variability. Themeasurements which yielded a significant P value werePreAL, PreDL, PreOW, MW, CH and CW. Except for crestheight (CH) and width (CW), measurements did not showa consistent pattern of variation. The anova applied to CHand CW showed significant differences among populations
Table 2 FST values for Coryphoblennius galerita populations calculatedfrom the 12S and 16S rDNA (top table below the diagonal);mitochondrial control region sequences (top table, above thediagonal) and S7 intron (bottom table). Significant P values(P < 0.05) after Bonferroni correction are indicated by an asterisk.FST values above 0.5 are bolded
Azores Madeira Canaries Portugal W. Med
Azores x 0.544* 0.930* 0.842* 0.856*Madeira 0.984* x 0.261* 0.281* 0.896*Canaries 0.970* 0.071 x 0.023 0.893*Portugal 0.972* 0.002 0.000 x 0.879*W. Med 0.981* 0.977* 0.955* 0.959* x
Azores xMadeira 0.007 xCanaries 0.028 0.000 xPortugal 0.014 0.013 0.026 xW. Med 0.596* 0.639* 0.618* 0.633* x
Fig. 3 Multidimensional scaling based on Choryphoblennius galerita’spopulation average pairwise differences for 12S rDNA +16SrDNA (A); D-loop (B) and first intron of the S7 protein gene (C).In the D-loop graph Madeira and Portugal plots overlap.

3600 V . S . D O M I N G U E S E T A L .
© 2007 The AuthorsJournal compilation © 2007 Blackwell Publishing Ltd
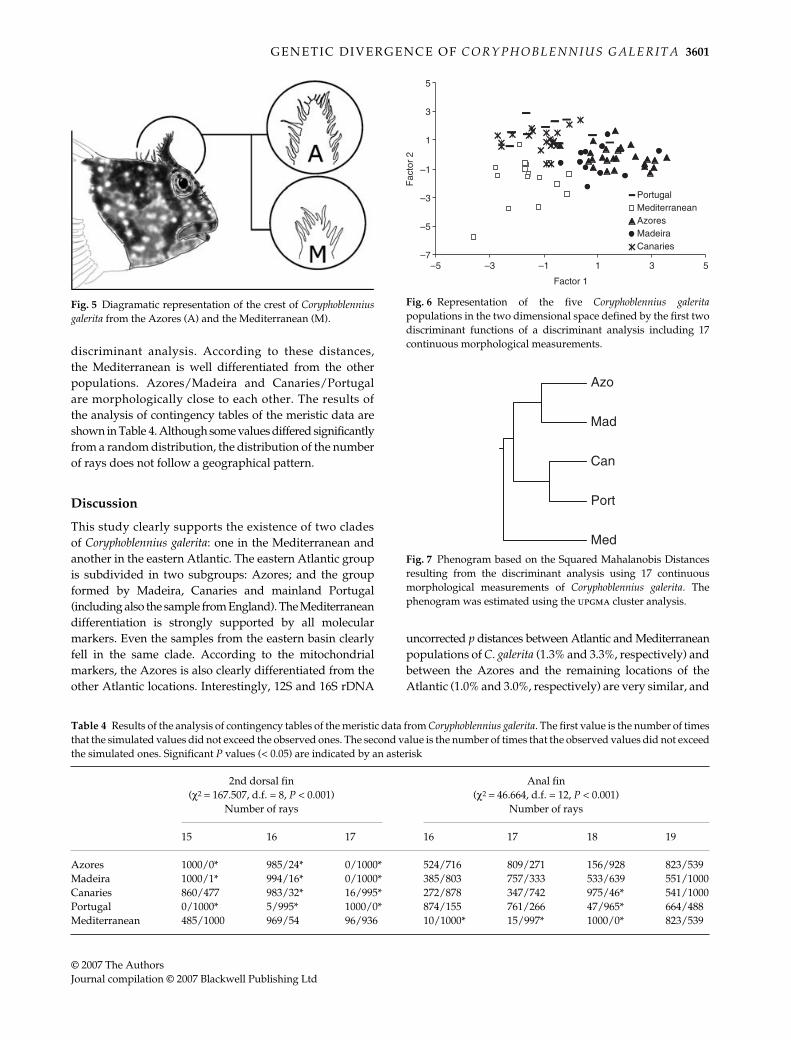
for both morphological characteristics [HC: F(1,2) = 16.947;P < 0.001 and WC: F(1,2) = 18.835; P < 0.001]. Tukey HDStest for post hoc comparisons based on CW yieldedsignificant results for comparisons of the Mediterraneanwith all other populations. The same test based on CHyielded significant results for comparisons of Azoresagainst all the populations and also for comparisons ofMadeira against all the populations. Crest width differentiatesthe Mediterranean individuals from all the others, whilecrest height separates the Azorean and Madeiran individualsfrom the ones in the remaining locations. Fish from theAzores show a high and wide crest, while Mediterraneanrepresentatives possess a low and narrow crest (Fig. 5). In
addition, the Mediterranean fish present filaments onlyon the upper edge of the crest, while in the Atlantic thefilaments occur around the entire crest (Fig. 5). Overallclassification success was approximately 86%, with theAzores and the Mediterranean showing values above 90%.Figure 6 depicts the placement of the five populationsin the two dimensional space defined by the first twodiscriminant functions. The Mediterranean is separatedfrom the other populations. The Azores is somehowdifferentiated, being closer to Madeira than to the otherlocations. The Canary Islands and Portugal show a closeconnection. Figure 7 shows the phenogram based onthe Squared Mahalanobis Distances resulting from the
Fig. 4 Mismatch distributions ofCoryphoblennius galerita D-loop and S7intron haplotypes. The bars represent theobserved frequency of the pairwise differencesamong haplotypes, while the line shows theexpected curve predicted for a populationthat has undergone a demographic expansionin the past.
Table 3 Estimated values for the expansion model for each population: SSD (sum of square deviations) and its probability P; θ0 and θ1(compound parameter representing the mutation rate and the female effective population size before and after expansion, respectively);and τ (time in generations). The time of the expansion (t, in thousand years) is also presented. Tajima’s D neutrality test and its probabilityP. Significant P values (P < 0.05) are indicated by an asterisk
D-loop SSD P θ0 θ1 τ t (thousand years) D P
Azores 0.007 0.758 0.000 821.2 1.759 0–22.5 –0.843 0.232MadeiraCanaries 0.001 0.620 0.000 467.6 0.872 1.18–8.64 –2.150 0.000*PortugalW. Mediterranean 0.026 0.260 0.000 9.709 4.560 13.4–52.5 –0.317 0.404S7Azores 0.014 0.020* — — — — –1.486 0.038*MadeiraCanaries 0.001 0.920 0.246 7.676 1.841 — –1.958 0.002*PortugalW. Mediterranean 0.004 0.500 1.168 45.922 5.607 — 0.099 0.500
G E N E T I C D I V E R G E N C E O F C O R Y P H O B L E N N I U S G A L E R I T A 3601
© 2007 The AuthorsJournal compilation © 2007 Blackwell Publishing Ltd
discriminant analysis. According to these distances,the Mediterranean is well differentiated from the otherpopulations. Azores/Madeira and Canaries/Portugalare morphologically close to each other. The results ofthe analysis of contingency tables of the meristic data areshown in Table 4. Although some values differed significantlyfrom a random distribution, the distribution of the numberof rays does not follow a geographical pattern.
Discussion
This study clearly supports the existence of two cladesof Coryphoblennius galerita: one in the Mediterranean andanother in the eastern Atlantic. The eastern Atlantic groupis subdivided in two subgroups: Azores; and the groupformed by Madeira, Canaries and mainland Portugal(including also the sample from England). The Mediterraneandifferentiation is strongly supported by all molecularmarkers. Even the samples from the eastern basin clearlyfell in the same clade. According to the mitochondrialmarkers, the Azores is also clearly differentiated from theother Atlantic locations. Interestingly, 12S and 16S rDNA
uncorrected p distances between Atlantic and Mediterraneanpopulations of C. galerita (1.3% and 3.3%, respectively) andbetween the Azores and the remaining locations of theAtlantic (1.0% and 3.0%, respectively) are very similar, and
Fig. 5 Diagramatic representation of the crest of Coryphoblenniusgalerita from the Azores (A) and the Mediterranean (M).
Table 4 Results of the analysis of contingency tables of the meristic data from Coryphoblennius galerita. The first value is the number of timesthat the simulated values did not exceed the observed ones. The second value is the number of times that the observed values did not exceedthe simulated ones. Significant P values (< 0.05) are indicated by an asterisk
2nd dorsal fin(χ2 = 167.507, d.f. = 8, P < 0.001)
Number of rays
Anal fin(χ2 = 46.664, d.f. = 12, P < 0.001)
Number of rays
15 16 17 16 17 18 19
Azores 1000/0* 985/24* 0/1000* 524/716 809/271 156/928 823/539Madeira 1000/1* 994/16* 0/1000* 385/803 757/333 533/639 551/1000Canaries 860/477 983/32* 16/995* 272/878 347/742 975/46* 541/1000Portugal 0/1000* 5/995* 1000/0* 874/155 761/266 47/965* 664/488Mediterranean 485/1000 969/54 96/936 10/1000* 15/997* 1000/0* 823/539
Fig. 6 Representation of the five Coryphoblennius galeritapopulations in the two dimensional space defined by the first twodiscriminant functions of a discriminant analysis including 17continuous morphological measurements.
Fig. 7 Phenogram based on the Squared Mahalanobis Distancesresulting from the discriminant analysis using 17 continuousmorphological measurements of Coryphoblennius galerita. Thephenogram was estimated using the upgma cluster analysis.

3602 V . S . D O M I N G U E S E T A L .
© 2007 The AuthorsJournal compilation © 2007 Blackwell Publishing Ltd
in some cases even higher, than the distances betweenseveral closely related blenniid species pairs (Almada et al.2005; Carreras-Carbonell et al. 2005; Stefanni et al. 2006).Although the genetic differentiation of the Azores populationwas very clear according to the three mitochondrialmarkers, this differentiation was not detected withthe nuclear intron. This is not surprising since lack ofrecombination in the mitochondrial DNA makes the wholegenome a single genetic entity. Moreover, since mtDNA ishaploid and only maternally inherited, mitochondrialgenes have a fourfold lower effective population size thanthe nuclear ones, which makes fixation of mutations muchslower in the nuclear genes.
The amova analysis also reveals a major barrier betweenMediterranean and Atlantic populations of C. galerita.Indeed, individuals from Cape of Gata, in the westernMediterranean, and those from the western coast of Portugal,despite being geographically close, show distinct mito-chondrial and nuclear genotypes and a very restrictedgene flow. When the patterns derived from the nuclear andmitochondrial markers are combined, the picture thatemerges is one that involves a major split betweenMediterranean and Atlantic populations, with some separation,although less marked, between the Azores and the groupformed by mainland Portugal, Madeira and Canaries.Interestingly, this is also supported by the analysis ofmorphological characters (crest height and width). Whilecrest width distinguishes two groups (Mediterranean fromall the Atlantic fish) with a minimum in the Mediterraneanand a maximum at Azores, crest height separates fish fromAzores and Madeira from all the others, showing a minimumin the Mediterranean and a maximum at Azores. Bath(1978), using meristic characters and colour patterns, hadalready noted a clinal variation in C. galerita from theeastern end of the Mediterranean to the oceanic islands.
Taken together, the results presented above suggest theexistence of an effective barrier that prevents gene flowbetween Mediterranean and Atlantic populations of C. galerita.Several studies have proposed the Gibraltar Strait or/andthe ‘Almerian-Oran jet’ as barriers to gene flow in differentmarine organisms (e.g. Pérez-Losada et al. 2002; Duranet al. 2004; Bargelloni et al. 2005; Lemaire et al. 2005). Theconnection between the Atlantic and the Mediterranean isknown to has been severely reduced or even closed inthe region of the Gibraltar Strait during the Quaternarybecause of sea-level fluctuations (Bianco 1990). Thiscould have promoted the isolation of the two basins withsubsequent genetic divergence. On a shorter timescale, thecomplex pattern of gyres and eddies of the Alboran sea canconstitute an effective physical barrier to small coastal fishlike C. galerita, whose dispersal is restricted to the planktoniclarval phase. On the other extreme, high levels of gene flowwere found between the western coast of Portugal and thearchipelagos of Madeira and Canaries. The Canaries
current can assure the transport of larvae between theselocations. It is interesting to note that the breeding seasonof C. galerita along the Portuguese coast lasts from Marchto September (Almada et al. 1996), which coincides withupwelling events in the Atlantic coast. This phenomenon isdue to strong northwestern winds that, once reaching thecoast, create offshore currents flowing to southwest.Larvae from the Atlantic coast of Portugal can then beeasily pushed offshore joining the Canaries current thatmight promote their mixing with larvae from the islands.Thus, the population of Madeira is likely to have contribu-tions from sources more to the north, namely southwesternEurope, together with fish persisting locally. It is wellknown that there are transport mechanisms capable ofcarrying fish larvae from Madeira to the Azores (Santoset al. 1995). This transport, even if sporadic, would preventa complete isolation of the Azorean populations, explainingwhy, despite the great geographical isolation of thearchipelago, the differentiation of the Azorean fish fromthose of the remaining Atlantic sites is less marked than thatbetween the Cape of Gata and Portuguese fish, which areseparated by a much shorter distance. Another explanationfor this discrepant levels of genetic differentiation can bethat gene flow between Atlantic and the Mediterranean popu-lations has been reduced for a longer period than gene flowbetween Azores and the remaining locations in the Atlantic.
The Pleistocene glaciations have been shown to have agreat effect in the geographical distribution of the geneticdiversity of the Atlantic warm-water species. Coolingduring glacial peaks has been thought to have caused localextinctions and latitudinal shifts of the marine fauna of theregion (Almada et al. 2001; Schiebel et al. 2002; Domingueset al. 2006, 2007). Our data reveal no signs of regionalextinctions, since genetic diversity is high in all populationsstudied. The Azorean population in particular shows astrong degree of genetic differentiation, at least for themitochondrial markers, showing the long-term persistenceof the population. Although not drastic, the effects of Pleis-tocene glaciations on the demographic history of C. galeritapopulations were felt, at least in some regions. The historicaldemography of the species reveals that the Azores and theremaining populations of the Atlantic experienced anexpansion at about the same time (between 0 and 22 500years in the case of the Azorean population and 1180–8640years in the case of Madeira, Canaries and Portugal).This time frame roughly coincides with the Younger Dryas(YD) at about 12 000 years, when, although already afterthe last glacial maximum (LGM), a large-scale coolingoccurred (Lambeck et al. 2002).
It is interesting to note the emergence of two biogeo-graphical patterns when considering Atlantic/Mediterraneanmarine fauna. Warm-water species, such as Tripterygiondelaisi (Domingues et al. 2007b), Chromis limbata/Chromischromis (Domingues et al. 2006) and Parablennius parvicornis/
G E N E T I C D I V E R G E N C E O F C O R Y P H O B L E N N I U S G A L E R I T A 3603
© 2007 The AuthorsJournal compilation © 2007 Blackwell Publishing Ltd
Parablennius sanguinolentus (Almada et al. 2005) show twogroups of populations: one including the Mediterraneanand the Atlantic coast of western Europe and anotherencompassing the western tropical coast of Africa and theAtlantic islands of the Azores, Madeira and Canaries. Onthe other hand, cold resistant species such as C. galerita andLipophrys pholis (Stefanni et al. 2006) show an accentuateddifferentiation of the Azorean population, and, in the case ofC. galerita, a clear divergence between Mediterranean andwestern European individuals (L. pholis does not formstable populations in the Mediterranean; Zander 1986).Similarly, the clade Symphodus trutta and Symphodus caeruleus,which belongs to a temperate genus, shows that theAzorean population acquired enough distinctive charactersto be placed in a different species (S. caeruleus) whencompared to fish from Madeira and Canaries (S. trutta;Almada et al. 2002). It is very likely that S. caeruleusancestors persisted in the Azores during the glaciations,being able to diverge and accumulate substantial differences.This pattern may reflect the different effects of the Pleistoceneglaciations on fishes with different thermal tolerances. Lesstolerant species must have become extinct in some regionswhere sea-surface temperatures were seriously reduced.These regions include the western coast of Portugal, theeastern islands of the Canary archipelago, and, to a lesserextent, the Azores. Recolonization of these locations mayhave been possible in the last 10 000 years, from lessaffected regions, namely the western tropical coast ofAfrica and Madeira Islands in the case of the Azores andthe western Canaries and the southwestern Mediterraneanin the case of the Atlantic shores of Iberia (Almada et al.2001; Domingues et al. 2006; Domingues et al. 2007b). Thisdifferent postglacial colonization routes would explainthe lack of differentiation between Portuguese andwestern Mediterranean populations on one hand and alsothe homogeneity among Azorean, Canarian and Madeiranpopulations and their affinities with western Africa, on theother. The scenario outlined above fits well all the availabledata for warm-water species but is unlikely to hold forspecies that tolerate cooler waters, like C. galerita. Populationsof these species might have persisted during the Pleistocenecooling episodes at the less affected areas, including theAzores. Thus, it is not surprising that these species showclear signs of population differentiation in the moreisolated locations such as the Azores archipelago and theMediterranean Sea. Although the shores of southwestEurope were seriously affected at the glacial maxima,causing a likely local extinction of C. galerita, the toleranceof the species to relatively cold waters may have allowedits survival in the shores of northwest Africa, from whichthey could have easily re-invaded Europe.
Our study is one of the first to combine morphologicaland molecular markers, and to apply molecular markers ofdifferent natures (mitochondrial and nuclear) and with
variable rates of molecular evolution to the study of therelationships of the Atlantic and Mediterranean populationsof a cool-water species. It is well known that an accurateinvestigation of spatial and temporal genetic structureshould consider the variety of patterns seen in differentloci, because of the stochastic effect of genetic drift in genefrequencies of each locus (Slatkin & Maddison 1989).Moreover, because the phylogenetic tree derived from asingle locus may not accurately reflect the history of aspecies or population (Ball et al. 1990), population structurecan only be accurately viewed by the concordance ofphylogenetic patterns across several loci (Avise 2000).
More studies on these cool-water species are needed totest the hypothesis that fishes of tropical and temperateaffinities differ in their response to the glacial changes thataffected the Atlantic–Mediterranean area.
Acknowledgements
We are grateful to several people for providing samples andhelping in field work: R. Beldade, A. Frias, J. Robalo, C. Santos,N. Serpa, P. Sordino, R. Patzner and S. Francisco. S. Franciscoprovided sequences from Portugal. We also thank EstaçãoMarítima do Funchal and Parque Natural de Cabo de Gata-Nijarfor field work support. We thank G. Bernardi for helpful suggestionson procedures to recover the two nuclear gene strands of eachindividual. C. Santos was a great help in analysing chromatogramswith double peaks. We are gratefull to N. Monteiro for provid-ing Fig. 5. Vera S. Domingues has a doctoral fellowship fromthe Portuguese Foundation for Science and Technology (FCT)(SFRH/BD/13069/2003). Sergio Stefanni is a postdoctoral fellowfunded by FCT (SFRH/BPD/14981/2004). Research at ISPA-UIE(UI & D #331/94) and IMAR-DOP/UAz (UI & D #531 and LA#9)are funded by FCT through pluri-annual and programmatic fundingschemes (FEDER). IMAR-DOP/UAz research is also granted byDRCT. This study was also funded by the FCT research grantPNAT/BIA/15017/99. This paper is also a contribution to MarBEF(Network of Excellence: ‘Marine Biodiversity and EcosystemFunctioning’ — contract nr. GOCE-CT-2003–505446).
References
Almada VC, Dores J, Pinheiro A, Pinheiro M, Santos RS (1983)Contribuição para o estudo do comportamento de Coryphoblenniusgalerita (L.) (Pisces, Blennidae). Memórias do Museu Bocage,Série Zoológica 2. Museu Bocage, Lisboa, 1–165.
Almada VC, Carreiro H, Faria C, Gonçalves EJ (1996) The breedingseason of Coryphoblennius galerita in Portuguese waters. Journalof Fish Biology, 48, 295–297.
Almada VC, Oliveira RF, Gonçalves EJ, Almeida AJ, Santos RS,Wirtz P (2001) Patterns of diversity of the northeastern Atlanticblennid fish fauna (Pisces: Blenniidae). Global Ecology andBiogeography, 10, 411–422.
Almada VC, Almada F, Henriques M, Santos RS, Brito A (2002) Onthe phylogenetic affinities of Centrolabrus trutta and Centrolabruscaeruleus (Perciforms: Labridae) to the genus Symphodus: mole-cular, meristic and behavioural evidences. Archipelago, 19A,85–92.

3604 V . S . D O M I N G U E S E T A L .
© 2007 The AuthorsJournal compilation © 2007 Blackwell Publishing Ltd
Almada F, Almada VC, Guillemaud T, Wirtz P (2005) Phylogeneticrelationships of the north-eastern Atlantic and Mediterraneanblenniids. Biological Journal of the Linnean Society, 86, 283–295.
Almada VC, Domingues VS, Monteiro NM, Almada F, Santos RS(2007) Molecular data confirm the validity of the Portugueseblenny (Parablennius ruber, Valenciennes, 1836) and its presencein Western Europe. Journal of Fish Biology, 70B, 248–254.
Avise JC (2000) Phylogeography. The History and Formation of Species.Harvard University Press, Cambridge, Massachusetts.
Ball RM, Neigel JE, Avise JC (1990) Gene genealogies within theorganismal pedigrees of random-mating populations. Evolution,44, 360–370.
Bargelloni L, Alarcon JA, Alvarez MC et al. (2005) The Atlantic–Mediterranean transition: discordant genetic patterns in twoseabream species, Diplodus puntazzo (Cetti) and Diplodus sargus(L.). Molecular Phylogenetics and Evolution, 36, 523–535.
Barton ED, Arístegui J, Tett P et al. (1998) The transition zone of theCanary Current upwelling region. Progress in Oceanography, 41,455–504.
Bath H (1978) Geographische variation der körperfärbung undflossenformel von Coryphoblennius galerita (Linnaeus 1758)(Pisces: Blenniidae). Senckenbergiana Biology, 59 (5/6), 317–324.
Baus E, Darrock DJ, Bruford MW (2005) Gene-flow patterns inAtlantic and Mediterranean populations of the Lusitanian seastar Asterina gibbosa. Molecular Ecology, 14, 3373–3382.
Bécognée P, Almeida C, Barrera A, Hernández-Guerra A, Hernández-León S (2006) Annual cycle of clupeiform larvae around GranCanaria Island, Canary Islands. Fisheries Oceanography, 15, 293–300.
Bernardi G (2000) Barriers to gene flow in Embiotoca jacksoni, amarine fish lacking a pelagic larval stage. Evolution, 54 (1), 226–237.
Bianco PG (1990) Potential role of the palaeohistory of theMediterranean and Paratethys basins on the early dispersal ofEuro-Mediterranean freshwater fishes. Ichthyological Explorationof Freshwaters, 1, 167–184.
Carreras-Carbonell J, MacPherson E, Pascual M (2005) Rapidradiation and cryptic speciation in mediterranean triplefinblennies (Pisces: Tripterygiidae) combining multiple genes.Molecular Phylogenetics and Evolution, 37, 751–761.
Chow S, Hazama K (1998) Universal PCR primers for S7 ribosomalprotein gene introns in fish. Molecular Ecology, 7, 1247–1263.
Costagliola D, Robertson DR, Guidetti P et al. (2004) Evolution ofcoral reef fish Thalassoma pavo spp. (Labridae). 2. Evolution ofthe eastern Atlantic species. Marine Biology, 144, 377–383.
Crowley TJ (1981) Temperature and circulation changes in theeastern north Atlantic during the last 150 000 years: evidence fromthe planktonic foraminiferal record. Marine Micropaleontology, 6,97–129.
Dias JA, Rodrigues A, Magalhães F (1997) Evolução da linha de costaem Portugal, desde o último máximo glaciário até à actualidade:síntese dos conhecimentos. Estudos Do Quaternário, 1, 53–66.
Doherty PJ, Planes S, Mather P (1995) Gene flow and larval durationin seven species of fish from the Great Barrier Reef. Ecology, 76,2373–2391.
Domingues VS, Bucciarelli G, Almada VC, Bernardi G (2005)Historical colonization and demography of the Mediterraneandamselfish, Chromis chromis. Molecular Ecology, 14, 4051–4063.
Domingues VS, Santos RS, Brito A, Almada VC (2006) Historicalpopulation dynamics and demography of the eastern Atlanticpomacentrid Chromis limbata (Valenciennes, 1833). MolecularPhylogenetics and Evolution, 40, 139–147.
Domingues VS, Almada VC, Santos RS, Brito A, Bernardi G (2007b)Phylogeography and evolution of the triplefin Tripterygion delaisi(Pisces, Blennioidei). Marine Biology, 150, 509–519.
Domingues VS, Santos RS, Brito A, Alexandrou M, Almada VC(2007a) Mitochondrial and nuclear markers reveal isolation bydistance and effects of Pleistocene glaciations in the northeasternAtlantic and Mediterranean populations of the white seabream(Diplodus sargus, L.). Journal of Experimental Marine Biology andEcology, 346, 102–143.
Duran S, Giribet G, Turon X (2004) Phylogeographical historyof the sponge Crambe crambe (Porifera, Poecilosclerida): rangeexpansion and recent invasion of the Macaronesian islandsfrom the Mediterranean sea. Molecular Ecology, 13, 109–122.
Estabrook CB, Estabrook GF (1989) actus: a solution to the problemof small samples in the analysis of two-way contingency tables.Historical Method, 22, 5–8.
Excoffier L, Smouse PE, Quattro JM (1997) Analysis of molecularvariance inferred from metric distances among DNA haplotypes:application to human mitochondrial DNA restriction data.Genetics, 131, 479–491.
Falcón JM, Brito A, González G (2002) Peces de la laguna deKhnifiss (Sahara, NW África) y de los sectores costeros próximos.Revista Academia Canaria Ciencias, 14, 139–152.
Felsenstein J (1989) phylip: phylogeny inference package (version3.2). Cladistics, 5, 164–166.
Higgins DG, Bleasby AJ, Fuchs R (1991) clustal v: improvedsoftware for multiple sequence alignment. Cabios, 8, 189–191.
Huelsenbeck JP, Ronquist FR (2001) mrbayes: Bayesian inferenceof phylogenetic trees. Bioinformatics, 17, 754–755.
Lamb HH (1977) Climate: Present, Past and Future. 2. Climate Historyand the Future. Methuen, London.
Lambeck K, Esat TM, Potter E-K (2002) Links between climate andsea levels for the past three million years. Nature, 419, 199–206.
Lemaire C, Versini J-J, Bonhomme F (2005) Maintenance of geneticdifferentiation across a transition zone in the sea: discordancebetween nuclear and cytoplasmic markers. Journal of EvolutionaryBiology, 18, 70–80.
Malanotte-Rizzoli P, Bergamasco A (1989) The circulation of theEastern Mediterranean. Part I. Oceanologica Acta, 12, 335–351.
Millot C (1999) Circulation in the western Mediterranean Sea.Journal of Marine Systems, 20, 423–442.
Milton P (1983) Biology of littoral blenniid fishes on the coast ofsouth-west England. Journal of the Marine Biological Association ofthe United Kingdom, 51, 247–265.
Molina R, Cabanas JM, Laatzen FL (1996) Corrientes e hidrografíaen la región canaria. Campaña Canarias 9205. Boletín InstitutoEspañological Oceanografía, 12, 43–51.
Ostellari L, Bargelloni L, Penzo E, Patarnello P, Patarnello T (1996)Optimization of single-strand conformation polymorphism andsequence analysis of the mitochondrial control region inPagellus bogaraveo (Sparidae, Teleostei): rationalized tools in fishpopulation biology. Animal Genetics, 27, 423–427.
Özgökmen TM, Chassignet EP, Rooth CGH (2001) On the connectionbetween the Mediterranean outflow and the Azores current.Journal of Physical Oceanography, 31, 461–480.
Palumbi RS (1994) Genetic divergence, reproductive isolation,and marine speciation. Annual Review of Ecology and Systematics,25, 547–572.
Pérez-Losada M, Guerra A, Carvalho GR, Sanjuan A, Shaw PW (2002)Extensive population subdivision of the cuttlefish Sepia officialis(Mollusca: Cepahlopoda) around the Iberian Peninsula indicatedby microsatellite DNA variation. Heredity, 89, 417–424.
G E N E T I C D I V E R G E N C E O F C O R Y P H O B L E N N I U S G A L E R I T A 3605
© 2007 The AuthorsJournal compilation © 2007 Blackwell Publishing Ltd
Posada D, Buckley TR (2004) Model selection and model averagingin phylogenetics: advantages of Akaike Information Criterionand Bayesian approaches over likelihood ratio tests. SystematicBiology, 53 (5), 793–808.
Posada D, Crandall KA (1998) modeltest: testing the model ofDNA substitution. Bioinformatics, 14 (9), 817–818.
Quéro JC, Hureau JC, Karrer C, Post A, Saldanha L (1990) Check-Listof the Fishes of the Eastern Tropical Atlantic. JNICT, Lisbon, Portugal.
Raventós N, Macpherson E (2001) Planktonic larval duration andsettlement marks on the otoliths of Mediterranean littoral fishes.Marine Biology, 138, 1115–1120.
Rice (1989) Analyzing tables of statistical tests. Evolution, 43, 223–225.
Richtarski U, Patzner RA (2000) Comparative morphology of malereproductive systems in Mediterranean blennies (Blenniidae).Journal of Fish Biology, 56, 22–36.
Riginos C, Nachman MW (2001) Population subdivision in marineenvironments: the contributions of biogeography, geographicaldistance and discontinuous habitat to genetic differentiation ina blennioid fish, Axoclinus nigricaudus. Molecular Ecology, 10,1439–1453.
Rodríguez JM, Hernández-León S, Barton ED (1999) Mesoescaledistribution of fish larvae in relation to an upwelling filamentoff Northwest Africa. Deep-Sea Research, I (46), 1969–1984.
Rogers AR (1995) Genetic evidence for a Pleistocene populationexplosion. Evolution, 49, 608–615.
Rogers AR, Harpending H (1992) Population growth makeswaves in the distribution of pairwise genetic differences.Molecular Biology and Evolution, 93, 552–569.
Sambrook J, Fritsch EF, Maniatis T (1989) Molecular Cloning: ALaboratory Manual, 2nd edn. Cold Spring Harbor LaboratoryPress, New York.
Santos RS, Hawkins S, Monteiro LR, Alves M, Isidro EJ (1995)Marine research, resources and conservation in the Azores. AquaticConservation: Marine and Freshwater Ecosystems, 5, 311–354.
Schiebel R, Schmuker B, Alves M, Hemleben C (2002) Tracking therecent and late Pleistocene Azores front by the distribution ofplanktic foraminifers. Journal of Marine Systems, 37, 213–227.
Schneider S, Excoffier L (1999) Estimation of past demographicparameters from the distribution of pairwise differences whenthe mutation rates vary among sites: application to humanmitochondrial DNA. Genetics, 152, 1079–1089.
Schneider S, Roessli D, Excoffier L (2000) ARLEQUIN, Version 2.000: ASoftware for Population Genetics Data Analysis. University of Geneva,Switzerland.
Shulman MJ, Bermingham E (1995) Early live histories, oceancurrents, and the population genetics of Caribbean reef fishes.Evolution, 49, 897–910.
Slatkin M, Maddison WP (1989) A cladistic measure of gene flowinferred from the phylogenies of alleles. Genetics, 123, 603–613.
Sousa-Santos C, Robalo IJ, Collares-Pereira MJ, Almada VC (2005)Heterozygous indels as useful tools in the reconstruction of DNAsequences and in the assessment of ploidy level and genomicconstitution of hybrid organisms. DNA Sequence, 16, 462–467.
Stamatis C, Trianfylidis A, Moutou KA, Mamuris Z (2004)Mitochondrial DNA variation in Northeast Atlantic and Medi-terranean populations of Norway lobster, Nephrops norvegicus.Molecular Ecology, 13, 1377–1390.
Stefanni S, Thorley JL (2003) Mitochondrial DNA phylogeographyreveals the existence of an evolutionary significant unit of the sandgoby Pomatoschistus minutus in the Adriatic (eastern Mediter-ranean). Molecular Phylogenetics and Evolution, 28, 601–609.
Stefanni S, Domingues V, Bouton N, Santos RS, Almada F,Almada V (2006) Phylogeny of the shanny, Lipophrys pholis,from the NE Atlantic using mitochondrial DNA markers.Molecular Phylogenetics and Evolution, 39, 282–287.
Stramma L (1984) Geostrophic transport in the warm water sphereof the eastern subtropical North Atlantic. Journal of MarineResearch, 42, 537–558.
Tajima F (1989) The effect of change in population size on DNApolymorphism. Genetics, 123, 597–660.
Taylor MS, Hellberg ME (2003) Genetic evidence for localretention of pelagic larvae in a Caribbean reef fish. Science, 299,107–109.
Thiede J (1978) A glacial Mediterranean. Nature, 276, 680–668.Zander CD (1986) Blenniidae. In: Fishes of the North-Eastern Atlantic
and the Mediterranean (eds Whitehead PJP, Bauchot M-L, Hureau J-C,Nielsen J, Tortonese E), pp. 1096–1112. UNESCO, Paris.
Vera Domingues is a PhD student working on the phylogeo-graphy and historical population dynamics of coastal fishes fromthe Eastern Atlantic and the Mediterranean. Cláudia Faria is apostdoctoral researcher studying ecology, community structureand dynamics of littoral fish. Sergio Stefanni is a postdoctoralresearcher studying evolution in fish, focusing on phylogeneticpatterns and underlying genetic processes. Alberto Brito is aProfessor of Marine Biology and Zoology interested in the Canarianmarine biodiversity and conservation. Ricardo S. Santos is aPrincipal Researcher interested in marine conservation of habitatsand biodiversity of both shallow and deep-sea ecosystems of thenortheastern Atlantic. Vitor Almada is an Associate professorinterested in phylogeography of North Atlantic fishes and Iberianfreshwater fishes, as well as in behavioural evolution.
Supplementary material
The following supplementary material is available for this article:
Fig. S1 Bayesian phylogeny of Coryphoblennius galerita populationsbased on sequences from the mitochondrial fragments (12SrDNA,16SrDNA and D-loop). The dataset was divided into four genepartitions to accommodate gene-specific differences in evolutionaryrate. Numbers on branches are posterior probabilities from aconsensus tree of all post burn-in topologies visited by the Markovchain. Labels are described in Fig. 1.
Fig. S2 Bayesian phylogeny of Coryphoblennius galerita populationsbased on sequences from the first intron of the S7 ribosomalprotein gene. Numbers on branches are posterior probabilitiesfrom a consensus tree of all post burn-in topologies visited by theMarkov chain. Labels are described in Fig. 1.
This material is available as part of the online article from:http://www.blackwell-synergy.com/doi/abs/10.1111/j.1365-294X.2007.03405.x(This link will take you to the article abstract).
Please note: Blackwell Publishing are not responsible for thecontent or functionality of any supplementary materials suppliedby the authors. Any queries (other than missing material) shouldbe directed to the corresponding author for the article.