genetic diversity analysis in sesame … roja.pdf · s.l kiranmayi, v roja, k padmalatha, n sivaraj...
TRANSCRIPT
Volume-7, Issue-1, Jan-Mar-2016 Coden IJABFP-CAS-USA Copyrights@2016 Received: 6th Nov-2015 Revised: 15th Dec-2015 Accepted: 20th Dec-2015
Research article
GENETIC DIVERSITY ANALYSIS IN SESAME (Sesamum indicum) USING MORPHOLOGICAL, BIOCHEMICAL AND MOLECULAR TECHNIQUES
S.L Kiranmayi, V Roja, K Padmalatha, N Sivaraj and S Sivaramakrishnan
Institute of Biotechnology, Acharya N.G Ranga Agricultural University, Rajendranagar, Andhra Pradesh - 500 030, India.
ABSTRACT: Genetic diversity of Sesame germplasm was estimated with morphological, biochemical and molecular approaches using 23 accessions collected from local areas of Andhra Pradesh, India. Correlation studies were conducted for 13 quantitative and 2 qualitative morphological parameters. Euclidian similarity matrix for morphological data was computed between observable distances and dendrogram (r = 0.79). Cluster analysis revealed two major clusters. Biochemical analysis through Nuclear Magnetic Resonance obtained 37-47% of oil content. Fatty acid estimation with Gas Chromatography revealed four principle fatty acids, palmitic, steric, oleic and linoleic acids with highest linoleic acid content was reported. Molecular analysis using SSR markers revealed 4 polymorphic primers. A total of 14 alleles were detected at four loci with an average of 3.5 alleles per locus. The pair wise similarity based on Dice coefficient ranged from 0 to 1. The correlation coefficient (r) computed between observed distances and dendrogram was 0.77 which indicates a good fit. Their genetic distance ranged from 0.1-0.9 which is wider than their phenotypic distance ranged from 0.2-0.7. MXCOMP between phenotypic and genotypic data gave the correlation coefficient value (r) = 0.12 which was showing less congruency. For sesame germplasm improvement, characterization and breeding programs these results have an important implication. Keywords: Nuclear Magnetic Resonance; Gas Chromatography; Dendrogram; Diversity; Polymorphism *Corresponding author: V Roja, Institute of Biotechnology, Acharya N.G Ranga Agricultural University, Rajendranagar, Andhra Pradesh - 500 030, India E-mail: [email protected] Copyright: ©2016 V Roja. This is an open-access article distributed under the terms of the Creative Commons Attribution License , which permits unrestricted use, distribution, and reproduction in any medium, provided the original author and source are credited. INTRODUCTION Sesame (Sesamum indicum), one of the oldest oilseed crops in the world known to humans and is valued for its high quality seed oil (Ashri, 1998). It belongs to the family Pedaliaceae with approximately 38 species in the genus Sesamum and most of them are wild (Kobayashi, 1991). The chromosome number of the cultivated sesame was reported as 2n = 26 (Toan et al., 2009). Sesame is found in tropical, subtropical, and southern temperate areas of the world, particularly in India, China, South America and Africa (Chakraborthy et al., 2008). Though Kobayashi (1986) suggested that sesame originated in Africa, but the reports of Bedigian et al. (1985) and the ancient scriptures of India agree with the fact that sesame originated in the Indian subcontinent. It is grown in tropical and subtropical areas on 164.1 million hectares (mha) worldwide, producing more than 18 million tons of seed. Sesame (Sesamum indicum) has lots of demand owing to high and quality oil, protein and antioxidants (Erbas et al., 2009). Comparatively, low seed yield is one of the most important reasons that sesame needs breeding to provide more yield (Furat and Uzun, 2010). Thus evaluation of genetic variability is necessary not only in selecting elite parents of high yielding but also for utilizing disease and pest resistant varieties in breeding and Marker assisted selection studies. Sesame oil is highly stable compared to other edible oils, mainly due to the presence of antioxidants like sesamin, sesaminol, sesamol, sesamolinol and squalene (Mohamed and Awatif, 1998). Sesame oil also contains a high level of polyunsaturated fatty acids (Wood, 1999). The economic part in sesame is seed which is rich in oil (50 to 52%), protein (17 to 19%), and carbohydrate (16 to 18%).
International Journal of Applied Biology and Pharmaceutical Technology Page: 95 Available online at www.ijabpt.com
Kiranmayi et al Copyrights@2016, ISSN: 0976-4550 The seeds have high unsaturated fat and methionine contents (Schilling and Catan, 1991; Uzoh, 1998). Sesame oil contains high percentages of linoleic and oleic acids. Several workers have studied the genetic diversity of seed oil content and fatty acid composition in cultivated species, S. indicum and these results have been reviewed by Kamal-Eldin et al., (1992). In cultivated sesame, seed oil content ranged from 40.0 to 50.0%. Fatty acids of sesame seed oil are mainly oleic (33 to 54%), linoleic (39 to 59%), palmitic (8 to 11%) and stearic (3 to 6%) acids (Yermanos et al., 1972). Sesame diversity centres have been identified as India, China, Central Asia, Near East and Abysinia in classical studies (Zeven and Zhukovsky, 1975., Hawkes, 1983). More recently, a high level of variability of morphological characters within different sesame collections was reported (Bedigian et al., 1986., Bisht et al., 1998). Among the recent methods developed apart from morphological markers for the study of genetic variability are the biochemical and molecular markers. Molecular markers dominate over the biochemical and phenotypic markers as they are not influenced by environmental or developmental changes. PCR-based techniques such as amplified fragment length polymorphism (AFLP), simple sequence repeats (SSR), inter simple sequence repeats (ISSR) and random amplified polymorphic DNA (RAPD) also have been widely used in genetic diversity studies in sesame (Pham et al., 2009). Genetic diversity in crop species can be determined by using the agro-morphological as well as biochemical and molecular markers (Geleta et al., 2008). Genotypic diversity is very important in selecting the parents for hybridization programmes for identifying heterotic crosses and obtaining desirable recombinants in the segregating generations. Diversity estimates in cultivated plants provide a rationale for conservation strategies and support the careful selection of starting material for breeding programs. Diversity measures applied to crops usually have been limited to the assessment of genome polymorphism at the DNA level (Tiwari et al., 2011). A number of DNA based techniques have been developed to identify genetic variability within species. One of the most recent advances in molecular genetics is the introduction of Microsatellite markers to investigate the genetic diversity of natural and hybrid population of crops. These markers are used today to address many questions related to genetic conservation. Sequence analysis and DNA fingerprinting sample genome diversity, which is independent of environmental conditions and the developmental stage of the organism (Ovesna et al., 2002). Thus, the study was undertaken to identify genetic diversity using morphological, biochemical and molecular approaches in 23 sesame accessions collected from different districts of Andhra Pradesh, India. MATERIAL AND METHODS: Germplasm of Sesamum indicum L. (23 accessions) collected from different districts of Andhra Pradesh (A.P), were selected for the study (Table i). Among the accessions, twenty were provided by National Bureau of Plant Genetic Resource, (NBPGR) Regional station, Rajendranagar, Hyderabad and five accessions are sesame varieties released by Acharya N. G. Ranga Agricultural University (ANGRAU) which are indicated with an asterisk. Seed materials of the accessions were sown in 2007 in simple Random Block Design in the field at NBPGR field experimental site. Total genomic DNA was extracted from leaf samples. 10 SSR primers reported by Dixit et al., (2005) were used for this study (Table ii). PCR reactions were performed with the reaction mixture of 10ng template DNA, 10pmol of both forward and reverse primers, 2.5 µl of 10X PCR buffer (10mM Tris-HCl (pH-8.0); 50mM KCl, 1.5mM MgCl2), 1.0U of Taq DNA polymerase, 0.2mM dNTPs. The thermal profile used for PCR amplification comprised an initial denaturation step at 94ºC for 2 minutes; denaturation step at 94ºC for 45 seconds followed by primer annealing at 55ºC for 45 seconds and elongation at 72 ºC for 45 seconds. After29 cycles, the profile profile is terminated with final extension step at 72 ºC for 1 minute. The temperature profile is same for all primers used under this study including primer annealing temperatures.3% Agarose gel is used and once the amplification is ensured on agarose gel the samples were then loaded on 10% Native PAGE gels and 6% sequencing PAGE gels for better separation of the different alleles. Native PAGE gels were stained with ethidium bromide whereas sequencing PAGE gels were silver stained to get the results. Morphological variations among the accessions of S. indicum was accounted for 13 quantitative characters, capsules (per leaf axil, per plant and length), leaf length and width, plant height, branches per plant, internode length, nodes per main stem, leaves per plant, flowers per plant, seed weight, seed yield and 2 qualitative characters (seed color and flower color). Diversity study has been conducted using Euclidian similarity matrix and matrix comparison plot. Inter accession phenotypic variations The accessions were assessed using the above mentioned 13 quantitative traits. Data on these traits was noted at the level of mean values of field observations from NBPGR field experimental site. Phenotypic relationships were assessed using Euclidean distance for continuous quantitative traits.
International Journal of Applied Biology and Pharmaceutical Technology Page: 96 Available online at www.ijabpt.com

Kiranmayi et al Copyrights@2016, ISSN: 0976-4550 A phenotypic distance matrix P = {Puv}was computed for the accessions using Gower’s (1971); method and subjected to Sequential Agglomerative Hierarchial Non overlapping (SAHN) cluster analysis using the average linkage (UPGMA) clustering algorithym and matrix comparision plot (MXCOMP). Cophenetic correlation coefficients were estimated to assess the degree of agreement between the observed proximity matrices and the resultant dendrograms. Biochemical methods used to analyze oil content and fatty acid composition in the accessions Percentage of oil content in the accessions was estimated using Nuclear Magnetic Resonance (Oxford NMR, 6500). Fatty acid composition is estimated with the help of Gas Chromatography (GC) (Thermo FOCUSS-6500). Initially seeds (3-5g) were grinded and 15 ml of solvent (hexane) is added to the sample. Then the content is filtered and 2-3 drops of methanolic KOH is added to it and subjected for heating. The obtained supernatant after heating is subjected to GC analysis. Iodine value (IV) of oils was calculated for the accessions from the obtained fatty acid compositions of oil with the help of the equation;
IV=∑(254 X D X Ai)/MWi
expressed as I2/100g oil where, Ai is the percentage, D is the number of double bonds and molecular weight of the fatty acid.
Inter accession genotypic variations The amplified products were scored for the presence or absence of alleles. The presence of allele was scored as 1 and the absence of allele was scored as 0 from higher to lower molecular size products. Approximate molecular size of the DNA fragments was determined based on the molecular size marker. Average number of alleles per primer was calculated based on the total number of bands scored among the accessions. Polymorphic information content (PIC) was calculated:
n PICi = 1-Σ Pij2 j=1 where, PICi is the polymorphic information content of a marker i; Pij is the frequency of the jth pattern for marker i and the summation extends over n patterns. Estimates of the similarity for the SSRs were based on the Nei and Li’s (1979); definition of the similarity : Sij = 2a/ (2a+b+c) where, Sij is the similarity between two individuals, i and j, a is the number of bands present in both i and j, b is the number of bands present in i and absent in j, c is the number of bands present in j and absent in i. This is also called Dice similarity co-efficient (Dice, 1945). Using NTSYS PC software version 2.1 (Rolf, 2002) SAHN clustering was performed by the UPGMA (Unweighted Pair-Group Average) method. The dendrogram was created with the TREE option of NTSYS. The goodness of fit of clustering to the data was calculated using COPH and MXCOMP options. The phenotypic and genotypic data was compared by using MXCOMP through NTSYS software. RESULTS AND DISCUSSION In the present study, 23 germplasm accessions of Sesamum indicum representing diverse origins using morphological, biochemical and molecular techniques were analyzed. The details of germplasm collected for the study are listed in Table i. Variations were observed for the 13 quantitative and 2 qualitative characters. Among the qualitative characters flower color and seed color showed variations and among the quantitative characters capsule bearing capacity exhibited a lot of variation. Flower color in Swetha variety, Swetha til, Rajeshwari, YLM 17 and Chandana was white with a yellow tinge at corolla tip. Brown seed color was seen in NSKMS-92, 73,221 and Chandana. Mixed seed color ie., reddish brown color was seen in NSKMS-260, 246, and 97. The mean values of individual morphological characters among the accessions under five replications are shown in Table iii. The morphological variations depicting flower colour and nature of branching among the accessions are given in figures i and ii. The phenotypic character of capsules per plant was found to be highest for YLM-17 (53.0) and the lowest for YLM-11 (1) and the other accessions were in the range between the two values. NSKMS-55 had the highest capsule length of 3.26 cm and YLM-11 the least value of 0.5 cm. Plant height was more in Chandana (93.6cm) and least in NSKMS-92 (56.6 cm). Leaf length was highest in NSKMS-260 (14.02 cm) and lowest in SKN-64 (8.56 cm). Leaf width was highest in the accession NSKMS 260 (8.84 cm) and lowest in NSKMS 123 (2.4 cm). Largest number of branches were observed in NSKMS – 267 (16.0) and smallest in accession NSKMS 97 (4.0). Internodal length was highest in NSKMS 246 (9.18 cm) and least in IC-426466 (4.5cm).
International Journal of Applied Biology and Pharmaceutical Technology Page: 97 Available online at www.ijabpt.com
Kiranmayi et al Copyrights@2016, ISSN: 0976-4550 The highest number of nodes per main stem was observed in the accession NSKMS 221 (22.0) and least in NSKMS 246 (7.0). The largest number of leaves per plant was observed in NSKMS 267 (135) and smallest in NSJB 6704 (64.0). The number of flowers per plant was largest in NSKMS 73 (28) and smallest in NSKMS 92 (4.0). The maximum seed weight was observed in the accession Swetha (0.346 g) and the minimum in NSKMS 97 (0.20g). Seed yield was maximum in Swetha with 11.16g and minimum was seen in 3 accessions i.e., IC426465, YLM 11 and NSKMS 246 (0.15gm). Cluster analysis was carried out for the various morphological characters among the accessions based on Euclidian genetic identity (Fig iii). Two major clusters were observed with only one accession (NSKMS-97) in Cluster I and all the remaining accessions in Cluster II at 30 % similarity level. Cluster II was again divided into two sub-clusters in which five accessions (NSKMS-260, SKN-56, YLM-11, SKMS-246, and SKN-37) were placed in sub-cluster I and remaining in sub-cluster II at 50 % similarity level. Sub-cluster I was again subdivided into two groups and sub-cluster II was also sub-divided into two groups with a similarity of 60 %. The similarity coefficient value ranged from 0.2-0.7. Matrix comparison of the dendrogram gave a correlation coefficient value of r = 0.79 (Fig iv and Table iv). Generally in the Indian sesame collection the flower color is white with purple shading but variations in color were observed in Swetha variety, Swetha til, Rajeshwari, YLM 17 and Chandana (white with a yellow tinge at corolla tip). Seed colour is usually white or black, but variations were observed in few accessions. Brown seed color was seen in NSKMS-92, 73,221 and Chandana. Mixed seed color i.e., reddish brown color was seen in NSKMS-260, 246, and 97. This result is in agreement with the findings of Spandana et al., (2011). The accessions showed large differences in case of quantitative characters like capsule per plant, leaf width, branches per plant, internode length, nodes per main stem, leaves per plant, flowers per plant, seed yield and qualitative characters like flower and seed colours. Much variation is not seen in other quantitative characters like capsules per leaf axil, capsule length, plant height, leaf length and seed weight. The phenotypic differences may be due to genetic diversity which may in turn be due to allelic diversity. Morphological data indicated considerable phenotypic variations of S. indicum as the second cluster depicts lot of sub clusters which are in congruence with the visual observations too (Table iii; Fig iii). It was observed that the cluster analysis placed the accession NSKMS 97 into a group by itself separated from the other accessions. It could be mostly due to differences caused by environmental, geographical and edaphic factors. Some of them may be climatic conditions like rainfall, moisture levels and soil conditions. Except for the morphological difference of NSKMS 97 accession which was influenced with the geographical location rest all accessions were placed in one cluster as NSKMS 97 is collected from Ippapally (Medak District) which is distant from collection areas of remaining accessions. The cluster analysis based on agro-morphological characters partially separated the germplasm based on their geographical origins. This result is in partial agreement with the findings of Dixit and Swain (2000), Gupta et al., (2001) and Spandana et al., (2011). Characterization of Biochemical variations among the accessions The oil content of S. indicum accessions estimated by Nuclear Magnetic Resonance (Oxford NMR-6500) also showed large variations among the accessions. Maximum percentage of oil content was seen in IC-426465 (47.54%) and minimum in NSKMS-55 (37.68%) (Table v). All the other accessions exhibited optimum oil content. NMR technique is not only useful for protein and oil content estimation (Kumar and Andy, 2012) but also used for studying oil oxidation processes (Maria et al., 2004). The fatty acid composition in each accession estimated by gas chromatography showed large variations (Fig v). Among the accessions highest palmitic acid (10.57%) and oleic acid (44.47%) were present in Rajeswari (Jagityal) and the lowest palmitic acid in the accession YLM-11 (9.18%) and lowest oleic acid in SKN-37 (35%). The highest steric acid (6.28%) was present in SKN-56 and the lowest in NSKMS-92 (4.87%). The highest linoleic acid (49.91%) was observed in SKN-37and the lowest in S. swetha (40.94%). Among the accessions the highest oleic/linoleic (O/L) ratio was found to be 1.137 in Rajeswari and lowest was 0.701 in SKN 37, the highest Iodine value of 113.26 was found in the accession Swetha til and the lowest value of 89.86 in the accession Rajeswari (Table vi). High linoleic acid was present in SKN 37 (50%).
Correlation study has been done among the morphological (quantitative) and biochemical (oil content and fatty acid composition) parameters among all the accessions of S. indicum. This study showed good correlation between capsule per plant and seed yield (0.907); capsule length (0.509) and plant height (0.703) and nodes per main stem (0.628); plant height and nodes per main stem (0.724), flowers per plant (0.476), and seed yield (0.722); nodes per main stem and flowers per plant (0.498) and seed yield (0.481); seed yield and seed weight (0.676). The results of correlation analysis are given in Table vii. In correlation analysis degrees of freedom is (n-2), hence the table value at 5% level and 1% level of significance was 0.468 and 0.590 respectively.
International Journal of Applied Biology and Pharmaceutical Technology Page: 98 Available online at www.ijabpt.com
Kiranmayi et al Copyrights@2016, ISSN: 0976-4550
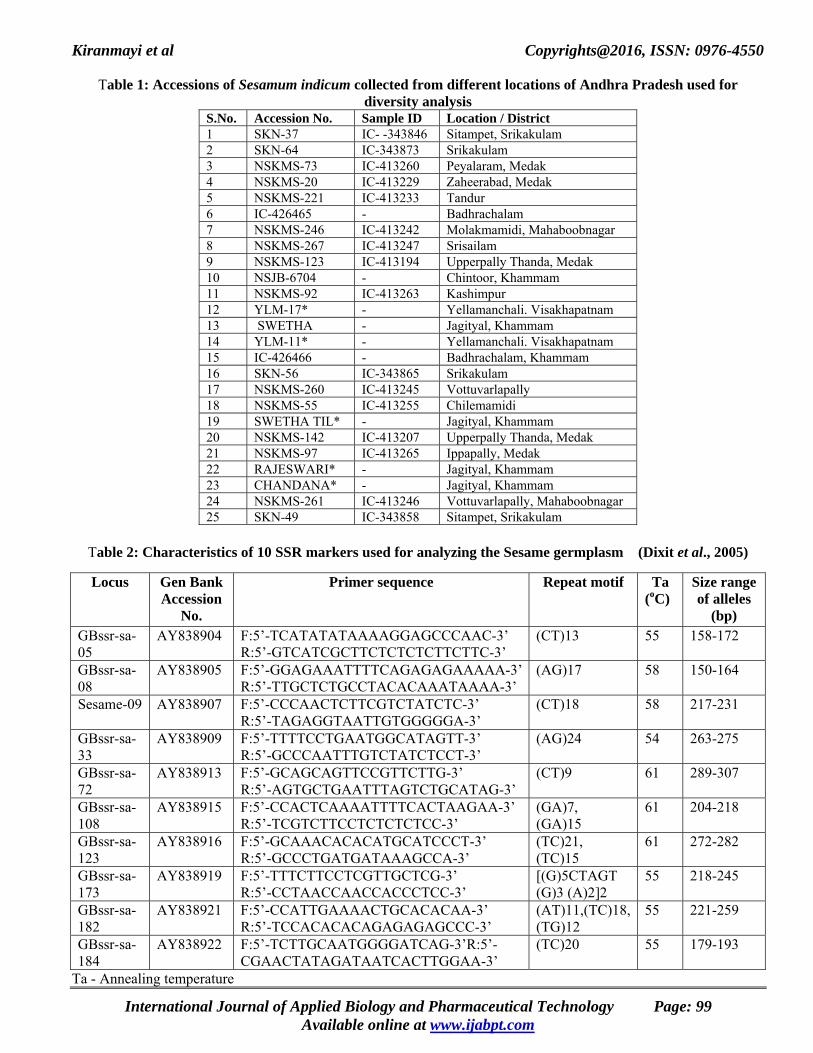
Table 1: Accessions of Sesamum indicum collected from different locations of Andhra Pradesh used for
diversity analysis S.No. Accession No. Sample ID Location / District 1 SKN-37 IC- -343846 Sitampet, Srikakulam 2 SKN-64 IC-343873 Srikakulam 3 NSKMS-73 IC-413260 Peyalaram, Medak 4 NSKMS-20 IC-413229 Zaheerabad, Medak 5 NSKMS-221 IC-413233 Tandur 6 IC-426465 - Badhrachalam 7 NSKMS-246 IC-413242 Molakmamidi, Mahaboobnagar 8 NSKMS-267 IC-413247 Srisailam 9 NSKMS-123 IC-413194 Upperpally Thanda, Medak 10 NSJB-6704 - Chintoor, Khammam 11 NSKMS-92 IC-413263 Kashimpur 12 YLM-17* - Yellamanchali. Visakhapatnam 13 SWETHA - Jagityal, Khammam 14 YLM-11* - Yellamanchali. Visakhapatnam 15 IC-426466 - Badhrachalam, Khammam 16 SKN-56 IC-343865 Srikakulam 17 NSKMS-260 IC-413245 Vottuvarlapally 18 NSKMS-55 IC-413255 Chilemamidi 19 SWETHA TIL* - Jagityal, Khammam 20 NSKMS-142 IC-413207 Upperpally Thanda, Medak 21 NSKMS-97 IC-413265 Ippapally, Medak 22 RAJESWARI* - Jagityal, Khammam 23 CHANDANA* - Jagityal, Khammam 24 NSKMS-261 IC-413246 Vottuvarlapally, Mahaboobnagar 25 SKN-49 IC-343858 Sitampet, Srikakulam
Table 2: Characteristics of 10 SSR markers used for analyzing the Sesame germplasm (Dixit et al., 2005)
Locus Gen Bank
Accession No.
Primer sequence Repeat motif Ta (oC)
Size range of alleles
(bp) GBssr-sa-05
AY838904 F:5’-TCATATATAAAAGGAGCCCAAC-3’ R:5’-GTCATCGCTTCTCTCTCTTCTTC-3’
(CT)13 55 158-172
GBssr-sa-08
AY838905 F:5’-GGAGAAATTTTCAGAGAGAAAAA-3’R:5’-TTGCTCTGCCTACACAAATAAAA-3’
(AG)17 58 150-164
Sesame-09 AY838907 F:5’-CCCAACTCTTCGTCTATCTC-3’ R:5’-TAGAGGTAATTGTGGGGGA-3’
(CT)18 58 217-231
GBssr-sa-33
AY838909 F:5’-TTTTCCTGAATGGCATAGTT-3’ R:5’-GCCCAATTTGTCTATCTCCT-3’
(AG)24 54 263-275
GBssr-sa-72
AY838913 F:5’-GCAGCAGTTCCGTTCTTG-3’ R:5’-AGTGCTGAATTTAGTCTGCATAG-3’
(CT)9 61 289-307
GBssr-sa-108
AY838915 F:5’-CCACTCAAAATTTTCACTAAGAA-3’ R:5’-TCGTCTTCCTCTCTCTCC-3’
(GA)7, (GA)15
61 204-218
GBssr-sa-123
AY838916 F:5’-GCAAACACACATGCATCCCT-3’ R:5’-GCCCTGATGATAAAGCCA-3’
(TC)21, (TC)15
61 272-282
GBssr-sa-173
AY838919 F:5’-TTTCTTCCTCGTTGCTCG-3’ R:5’-CCTAACCAACCACCCTCC-3’
[(G)5CTAGT (G)3 (A)2]2
55 218-245
GBssr-sa-182
AY838921 F:5’-CCATTGAAAACTGCACACAA-3’ R:5’-TCCACACACAGAGAGAGCCC-3’
(AT)11,(TC)18,(TG)12
55 221-259
GBssr-sa-184
AY838922 F:5’-TCTTGCAATGGGGATCAG-3’R:5’-CGAACTATAGATAATCACTTGGAA-3’
(TC)20 55 179-193
Ta - Annealing temperature
International Journal of Applied Biology and Pharmaceutical Technology Page: 99 Available online at www.ijabpt.com

Kiranmayi et al Copyrights@2016, ISSN: 0976-4550
Table 3: Phenotypic data of 23 accessions of Sesamum indicum L.
Accession no. No. C/L
No. C/P C L PH LL LW
No. B/P I L N/MS
No. L/P
No. F/P S W SY Flower color
Seed color
NSKMS-142 1 14.8 2.96 75.2 12.14 4 6 5.06 18.4 108.2 7.6 0.238 2.2 White+purple white NSKMS-260 1 1.8 2.06 63.3 14.02 8.84 11.4 5.76 12.8 112 5 0.238 0.25 White+purple mixed IC-426465 1 1.4 2.08 69.8 10.3 4.62 14 5.48 11.6 110.8 17.4 0.205 0.15 White+purple black YLM-11 1 1 0.5 60.1 10.6 5.92 7.6 4.6 12.2 102.8 10.2 0.245 0.15 White+purple black NSKMS-92 1 6.4 3.22 56.6 10.54 4.3 4.6 4.9 16.6 81.6 3.6 0.283 1.02 White+purple brown NSKMS-55 1 8.8 3.26 67.6 12.82 2.44 11.2 5.82 13.8 117.8 11.6 0.22 1.32 White+purple white NSKMS-267 1 11.6 2.2 71.22 10.4 7.74 15.6 5.6 19 135.4 28 0.257 1.62 White+purple black SKN-56 1 12 2.28 65.84 11.84 8.1 5.6 5.4 11.4 79.6 14.6 0.255 1.44 White+purple black NSKMS-246 1 1.4 2.06 63 14 7.18 11.8 9.18 6.8 45.8 4.6 0.205 0.15 White+purple mixed SKN-37 1 1.4 2.04 57.2 10.38 5.1 15.12 6.44 9 55.8 9 0.3 0.299 White+purple black NSKMS-73 1 23 2.6 75.2 10.42 3.68 9.8 4.6 16.4 74.2 28.2 0.227 2.99 White+purple brown NSKMS-20 1 25.8 2.68 76 11.44 2.98 8.4 4.6 17.8 70.2 23.8 0.263 5.16 White+purple white SKN-64 1 17.82 2.54 68.6 8.56 2.96 12.2 4.64 15.2 128 27.4 0.275 3.38 White+purple black
YLM-17 1 52.4 2.9 76.6 11.34 3.88 8.2 4.92 17.2 103.2 20 0.248 10.48 White+purple+ yellow tinge black
CHANDANA 1 40.6 3.1 93.6 13.4 3.26 8.4 5.14 24 129 27.8 0.318 10.96 White+light purple brown
NSKMS-221 1 28.6 2.72 88.2 12.92 3.76 11.2 5.82 22.4 120.8 21.2 0.245 4.86 White+yellow tinge brown
IC-426466 1 38.2 2.6 63.4 9.56 2.7 7.6 4.56 16.6 79 10 0.234 5.35 White+light purple black
NSKMS-97 1.2 28 3.16 87.4 13.6 3.68 3.6 6.18 22.8 72.8 19.6 0.202 3.92 White+light purple mixed
NSJB-6704 1 13.8 2.68 61.4 11.22 3.14 8 4.96 16.8 64.4 14.2 0.225 2.35 White+purple white RAJESWARI 1 23.2 2.88 84.4 12.8 3.24 7 6.82 22.4 118.6 14 0.314 5.1 White+yellow white NSKMS-123 1 32.6 2.9 80.2 10.34 2.4 5.4 5.48 19 81.8 12.6 0.247 4.56 White+purple white Swetha 1 36 2.52 84.1 12.5 3.3 9.2 5.1 15.6 111.2 10.4 0.346 11.16 White white Swetha til 1 31.6 2.64 86.2 12.7 3.8 10.6 5 14.6 114.2 11.4 0.341 9.16 White white
C/L: Capsules per leaf axil, C/P: Capsules per plant, CL: Capsule length PH: Plant height, LL: Leaf length, LW: Leaf width, B/P: Branches per plant IL: Internode length, N/MS: Nodes per main stem, L/P: Leaves per plant F/P: Flowers per plant, SW: Seed weight, SY: Seed yield.
Table 4: Morphological Similarity matrix of 23 accessions of S. Indicum
International Journal of Applied Biology and Pharmaceutical Technology Page: 100
Available online at www.ijabpt.com

Kiranmayi et al Copyrights@2016, ISSN: 0976-4550
Ecological factors become extremely important for the metabolic reactions apart from their growth conditions which may also aid in difference at the biochemical levels. Among the accessions the results of highest (1.137) and lowest (0.701) O/L ratios with the highest (113.26) and the lowest (89.86) iodine values (Table 6) are in agreement with the results reported by Borchani et al., (2010). Elsewhere, iodine values were reported in the range of 107.18-112.04 (Bahkali et al., 1998). Higher Iodine value was reported as 117.2 in some Indian cultivars (Dhawan et al., 1972). Seed color also appeared to be related to the oil content in S. indicum (Eldin, 1993). The accession with black colour i.e., IC426465 showed highest oil content (47.54 %) and least in white colour NSKMS55 (37.68%). This finding is on par with the findings of Alkahatani, (1989) and Bahkali et al., (1998). It also appeared that there was a substantial genetic diversity in fatty acid composition in different accessions of sesame. Saturated fatty acids have more industrial uses than human consumption and were not subjected to oxidative rancidity rapidly. The shelf life of the oil was very much dependent on the Iodine value and O/L ratio. Shelf life of these accessions was good due to the high O/L value and low Iodine value. High linoleic acid (LA) was present in SKN 37 (50%) which was reported to be the major fatty acid in sesame apart from palmitic, steric and oleic acids. LA and its derivative fatty acids are essential fatty acids for human health. High level of LA in the oil reduces the blood cholesterol level and plays an important role in preventing atherosclerosis (Ghafoorunissa, 1994). Thus edible oil with LA content is premium oil. Thus SKN 37 can be used in breeding among the other accessions to improve the LA content. When correlation analysis was carried out for seed yield and other morphological characters of the plant it was noted that seed yield was highly correlated with capsule /plant which in turn is correlated with capsule length, plant height, nodes per main stem. Capsules per plant is the most contributing character for seed yield of sesame (Ibrahim et al., 1983; Osman, 1989). Seed yield is also directly correlated with plant height which in turn is correlated with nodes per main stem and flowers per plant. Seed yield is also directly correlated with nodes / main stem which in turn were correlated with flowers per plant. It is also directly correlated with seed weight. All these characters appear to contribute directly or indirectly to crop yield.
Table 5: Percentage of oil content in S. indicum accessions
International Journal of Applied Biology and Pharmaceutical Technology Page: 101 Available online at www.ijabpt.com

Kiranmayi et al Copyrights@2016, ISSN: 0976-4550
Table 6: Biochemical characteristics of 23 accessions of S. indicum including fatty acid composition, Oleic/Linoleic acids ratio and Iodine values.
Table 7: Correlation values among the morphological and biochemical parameters of S. indicum 23 accessions
International Journal of Applied Biology and Pharmaceutical Technology Page: 102 Available online at www.ijabpt.com

Kiranmayi et al Copyrights@2016, ISSN: 0976-4550 Survey of SSR markers for polymorphism PCR using SSR markers was checked for amplification using a random selection of 8 accessions. Of the 10 SSR markers screened for polymorphism 4 markers (Table viii) were found to be polymorphic among the 23 germplasm accessions. The four polymorphic primers used for analysis revealed 14 alleles with an average of 3.5 alleles per locus. The maximum number of alleles detected was four, with two primer pairs GBssr-sa-08 (Fig 6), GBssr-sa-33 and the minimum number of alleles was three with the primer pair GBssr-sa-173 and GBssr-sa-72. Polymorphic information content (PIC) value of each of the primers is given in Table 8. The high level of polymorphism associated with SSRs is to be expected because of the unique mechanism responsible for generating SSR allelic diversity by replication slippage (Tautz and Renz, et al., 1984; Tautz et al., 1986) rather than only by single nucleotide mutations or insertions or deletions.
Table 8: SSR markers showing polymorphism among sesame germplasm accessions and their allelic
distribution
Table 9: Molecular Similarity matrix of 23 accessions of S. Indicum
Inter Accession genotypic Variation Pair wise similarity matrix based on DICE coefficient was carried out for 23 accessions and it ranged from 0.1-1.0 (Table ix). The dendrogram derived from UPGMA cluster analysis revealed two major clusters, cluster I and cluster II with a dissimilarity of 30 % and with several sub-clusters (Fig. 7). Cluster I consisted of two accessions (IC-426466 and Swetha til) which were genetically found to be very similar. Cluster II consisted of two sub clusters with a dissimilarity of 25% with one accession (SKN-37) in separate sub-cluster and the remaining accessions were present in other sub-cluster. The second sub-cluster was again divided into two groups with 16 % dissimilarity with IC-426465, NSKMS-97, NSKMS-123, NSJB-6704 and SKN-64 accessions in one cluster and among these NSKMS-97 and 123 were genetically found to be very similar. The second group was further divided into two sub groups with NSKMS-221 and Rajeswari in one cluster and remaining accessions in other cluster. The matrix comparison gave the correlation coefficient r = 0.77 (Fig viii). The 23 accessions were genetically and phenotypically found to be highly diverse, their phenotypic distance ranged from 0.2-0.7 and the genetic distance ranged from 0.1-0.9. When MXCOMP was carried out between phenotypic and genotypic data the correlation coefficient value (r) = 0.12 which was showing less congruency (Fig ix).
International Journal of Applied Biology and Pharmaceutical Technology Page: 103 Available online at www.ijabpt.com
Kiranmayi et al Copyrights@2016, ISSN: 0976-4550
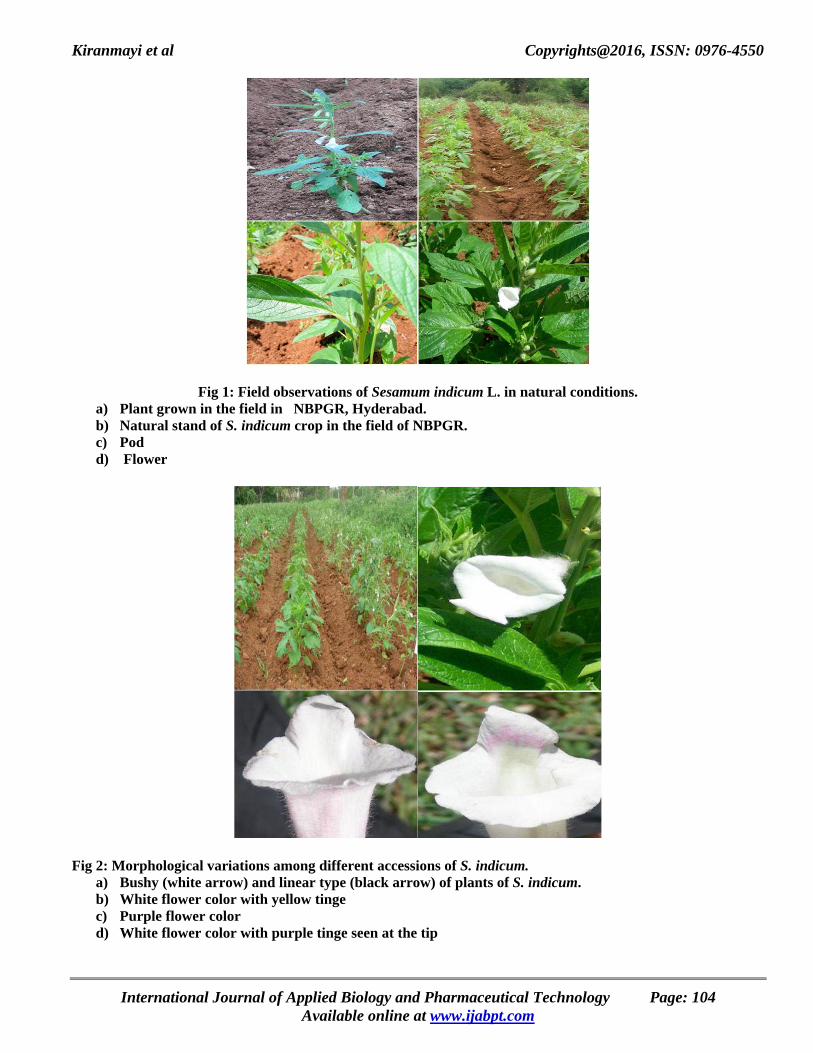
Fig 1: Field observations of Sesamum indicum L. in natural conditions. a) Plant grown in the field in NBPGR, Hyderabad. b) Natural stand of S. indicum crop in the field of NBPGR. c) Pod d) Flower
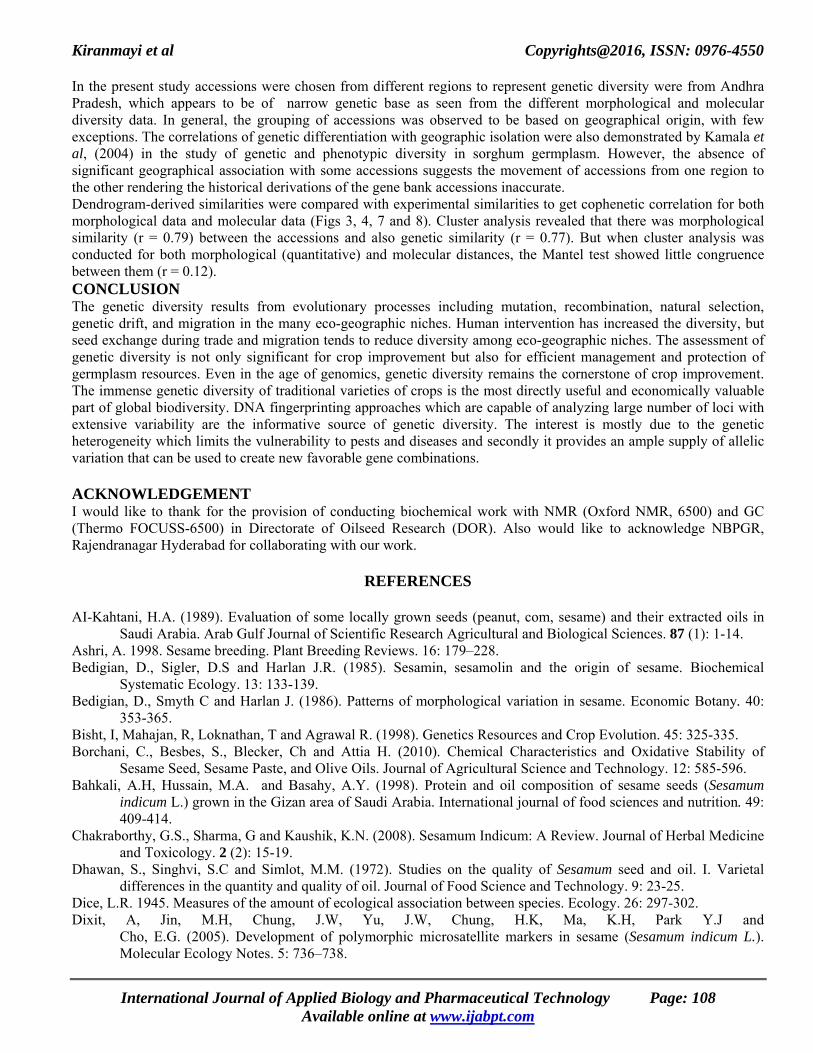
Fig 2: Morphological variations among different accessions of S. indicum. a) Bushy (white arrow) and linear type (black arrow) of plants of S. indicum. b) White flower color with yellow tinge c) Purple flower color d) White flower color with purple tinge seen at the tip
International Journal of Applied Biology and Pharmaceutical Technology Page: 104 Available online at www.ijabpt.com

Kiranmayi et al Copyrights@2016, ISSN: 0976-4550
Coefficient0.73 2.22 3.70 5.19 6.67
10MW
1 5 6
11 12 19 17 21 14 22 23 15 16 20 3
13 7 2 8 4 9
10 18
Fig 3: Cluster diagram of 23 accessions of S. indicum morphological data based on Euclidean genetic identity. The numbers 1-23 correspond to the accessions mentioned in Table 5
L111.NTS-0.16 -0.07 0.01 0.09 0.18
LV.NTS
-0.20
-0.12
-0.04
0.04
0.12
Fig 4: Matrix comparison plot of 23 accessions exhibiting morphological variations
(Cophenetic correlation r = 0.79)
International Journal of Applied Biology and Pharmaceutical Technology Page: 105 Available online at www.ijabpt.com

Kiranmayi et al Copyrights@2016, ISSN: 0976-4550
Fig 5: Chromatogram representing the four peaks of fatty acids of the accession Rajeswari (with highest
palmitic, linoleic acid contents and highest O/L ratio) mainly present in Sesamum indicum L. The first peak in the chromatogram represents the solvent peak followed by palmitic, stearic, oleic and linoleic acids
respectively
Fig. 6: PCR amplification of 23 accessions of S. indicum using SSR primer GBssr-sa-08 on sequencing gel 1-23
accessions are represented according to the Table-1
International Journal of Applied Biology and Pharmaceutical Technology Page: 106 Available online at www.ijabpt.com

Kiranmayi et al Copyrights@2016, ISSN: 0976-4550
Coefficient0.67 0.75 0.84 0.92 1.00
10MW
1
4
5
9
14
22
2
6
7
8
15
11
12
16
20
3
18
21
19
13
10
17
23
Figure 7: Cluster diagram of 23 accessions of S. indicum based on Dice similarity identity (1-23 represents accessions according to the order present in Table-5)
poly I.NTS-0.22 -0.13 -0.04 0.04 0.13
poly III.NTS
-0.10
-0.03
0.04
0.10
0.17
Figure 8: Matrix comparision of molecular data of 23 accessions of S. indicum
L111.NTS-0.16 -0.07 0.01 0.09 0.18
poly I.NTS
-0.22
-0.13
-0.04
0.04
0.13
Fig 9: Matrix comparision of phenotypic and genotypic data among 23 different accessions of S. indicum
International Journal of Applied Biology and Pharmaceutical Technology Page: 107 Available online at www.ijabpt.com
Kiranmayi et al Copyrights@2016, ISSN: 0976-4550 In the present study accessions were chosen from different regions to represent genetic diversity were from Andhra Pradesh, which appears to be of narrow genetic base as seen from the different morphological and molecular diversity data. In general, the grouping of accessions was observed to be based on geographical origin, with few exceptions. The correlations of genetic differentiation with geographic isolation were also demonstrated by Kamala et al, (2004) in the study of genetic and phenotypic diversity in sorghum germplasm. However, the absence of significant geographical association with some accessions suggests the movement of accessions from one region to the other rendering the historical derivations of the gene bank accessions inaccurate. Dendrogram-derived similarities were compared with experimental similarities to get cophenetic correlation for both morphological data and molecular data (Figs 3, 4, 7 and 8). Cluster analysis revealed that there was morphological similarity (r = 0.79) between the accessions and also genetic similarity (r = 0.77). But when cluster analysis was conducted for both morphological (quantitative) and molecular distances, the Mantel test showed little congruence between them (r = 0.12). CONCLUSION The genetic diversity results from evolutionary processes including mutation, recombination, natural selection, genetic drift, and migration in the many eco-geographic niches. Human intervention has increased the diversity, but seed exchange during trade and migration tends to reduce diversity among eco-geographic niches. The assessment of genetic diversity is not only significant for crop improvement but also for efficient management and protection of germplasm resources. Even in the age of genomics, genetic diversity remains the cornerstone of crop improvement. The immense genetic diversity of traditional varieties of crops is the most directly useful and economically valuable part of global biodiversity. DNA fingerprinting approaches which are capable of analyzing large number of loci with extensive variability are the informative source of genetic diversity. The interest is mostly due to the genetic heterogeneity which limits the vulnerability to pests and diseases and secondly it provides an ample supply of allelic variation that can be used to create new favorable gene combinations. ACKNOWLEDGEMENT I would like to thank for the provision of conducting biochemical work with NMR (Oxford NMR, 6500) and GC (Thermo FOCUSS-6500) in Directorate of Oilseed Research (DOR). Also would like to acknowledge NBPGR, Rajendranagar Hyderabad for collaborating with our work.
REFERENCES AI-Kahtani, H.A. (1989). Evaluation of some locally grown seeds (peanut, com, sesame) and their extracted oils in
Saudi Arabia. Arab Gulf Journal of Scientific Research Agricultural and Biological Sciences. 87 (1): 1-14. Ashri, A. 1998. Sesame breeding. Plant Breeding Reviews. 16: 179–228. Bedigian, D., Sigler, D.S and Harlan J.R. (1985). Sesamin, sesamolin and the origin of sesame. Biochemical
Systematic Ecology. 13: 133-139. Bedigian, D., Smyth C and Harlan J. (1986). Patterns of morphological variation in sesame. Economic Botany. 40:
353-365. Bisht, I, Mahajan, R, Loknathan, T and Agrawal R. (1998). Genetics Resources and Crop Evolution. 45: 325-335. Borchani, C., Besbes, S., Blecker, Ch and Attia H. (2010). Chemical Characteristics and Oxidative Stability of
Sesame Seed, Sesame Paste, and Olive Oils. Journal of Agricultural Science and Technology. 12: 585-596. Bahkali, A.H, Hussain, M.A. and Basahy, A.Y. (1998). Protein and oil composition of sesame seeds (Sesamum
indicum L.) grown in the Gizan area of Saudi Arabia. International journal of food sciences and nutrition. 49: 409-414.
Chakraborthy, G.S., Sharma, G and Kaushik, K.N. (2008). Sesamum Indicum: A Review. Journal of Herbal Medicine and Toxicology. 2 (2): 15-19.
Dhawan, S., Singhvi, S.C and Simlot, M.M. (1972). Studies on the quality of Sesamum seed and oil. I. Varietal differences in the quantity and quality of oil. Journal of Food Science and Technology. 9: 23-25.
Dice, L.R. 1945. Measures of the amount of ecological association between species. Ecology. 26: 297-302. Dixit, A, Jin, M.H, Chung, J.W, Yu, J.W, Chung, H.K, Ma, K.H, Park Y.J and
Cho, E.G. (2005). Development of polymorphic microsatellite markers in sesame (Sesamum indicum L.). Molecular Ecology Notes. 5: 736–738.
International Journal of Applied Biology and Pharmaceutical Technology Page: 108 Available online at www.ijabpt.com
Kiranmayi et al Copyrights@2016, ISSN: 0976-4550 Dixit, U.N and Swain, D. (2000). Genetic divergence and heterosis in sesame. Indian Journal of Genetics. 60: 213-
219. Eldin K.A., Yousif, G., Iskander G.M and Appelqvist, L.A. (1992). Seed lipids of Sesamum indicum and related wild
species in Sudan I: J. Fatty acids and triglycerols. Fattyacid Science and Technology. 94: 254-259. Eldin, K.A. (1993). Seed oils of Sesamum indicum L. and some wild relatives: A compositional study of the fatty
acids, acyl lipids, sterols, tocopherols and lignans. Ph.D. Thesis submitted to Swedish University of Agricultural Science.
Erbas, M, Sekerci, H, Gül, S, Furat, S, Yol, E and Uzun, B. (2009). Changes in total antioxidant capacity of sesame (Sesamum sp.) by variety. Asian Journal of Chemistry. 21: 5549-5555.
Furat, S and Uzun, B. (2010). The use of agro-morphological characters for the assessment of genetic diversity in sesame (Sesamum indicum L). Plant Omics Journal. 3: 85-91.
Geleta, M., Bryngelsson, T., Bekel E. (2008). Assessment of genetic diversity of Guizotia abyssinica (L.f.) Cass. (Asteraceae) from Ethiopia using amplified fragment length polymorphism. Plant Genetic Resources Characterization Utilization. 6: 41-51.
Ghafoorunissa. (1994). Dietary fats/oils and heart diseases. In: Prasad MVR (Ed.). Sustainability in Oil Seeds. Indian Society of Oil Seed Research. Hyderabad. pp. 486-490.
Gower, J.C. (1971). A general coefficient of similarity and some of its properties. Biometrics. 27: 623-637. Gupta, R.R., Parihar, B.M.S and Gupta, P.K. 2001. Genetic diversity for some metric characters in sesame (Sesamum
indicum L.). Crop Research. 21: 350-354. Hawkes, J. (1983). The diversity of crop plants Cambridge, Harvard University Press. Ibrahim, A.F., Ahmed, D.A.E and Sharief, S. A. (1983). Interrelationships and path-coefficient analysis for some
characters in sesame (Sesamum indicum L.). Journal of Agronomy Crop Science. 152: 454-459. Kamala, V., Bramel, P.J., Sivaramakrishnan, S., Chandra, S., Kannan, S., Harikrishna S and Rao, M.D. 2004. Genetic
and phenotypic diversity in downy-mildew-resistant sorghum (Sorghum bicolor (L.) Moench) germplasm. Genetic Resources and Crop Evolution. 53 (6): 1243-1253.
Kobayashi, T. (1991). Cytogenetics of sesame (Sesamum indicum). In: Chromosome engineering in plants: Genetics, breeding, evolution. Tsuchiya, T., Gupta, R.K. (Eds.). Elsevier Science Publishing Company Inc. Amesterdam. pp: 581-592.
Kumar, S and Andy, A. (2013). Fourier transform-near infrared reflectance spectroscopy calibration development for screening of oil content of intact safflower seeds. International Food Research Journal. 20 (2): 759-762.
Maria, D.G and Ainhoa, R. (2004). Formation of hydroperoxy- and hydroxyalkenals during thermal oxidative degradation of sesame oil monitored by proton NMR. European Journal of lipid science and technology. 106 (10): 680-687.
Mohamed H.M.A and Awatif, I.I. (1998). The use of sesame oil un-saponifiable matter as a natural antioxidant. Food Chemistry. 62: 269–276.
Murray, M.G and Thompson, W.F. (1980). Rapid isolation of high molecular weight plant DNA. Nucleic Acids Research. No. 8, vol 19.
Nei, M and Li, W.H. (1979). Mathematical model for studying genetic variation in terms of restriction endonucleases. Proceedings of National Academy of Science, USA. 76: 5269-5273.
Osman, H.E. (1989). Heterosis and path coefficient analysis in sesame (Sesamum indicum L.). Acta Agronomy Hungry. 38: 105-112.
Ovesna, J, Polakova, K and Leisova, L. (2002). DNA analyses and their applications in plant breeding. Czech J Genet Plant Breed. 38: 29-40.
Pham, D.T., Bui, M.T and Werlemark, G. (2009). A study of genetic diversity of sesame (Sesamum indicum L.) in Vietnam and Cambodia estimated by RAPD markers. Genetic Resources and Crop Evolution. 56: 679-690.
Rholf, F.J. (2002). Numerical taxonomy and multivariate analysis system. Applied Biostatistics Inc; New York. Schilling, R and Cattan, P. (1991). Sesame cultivation in tropical Africa. Oleaginenx. 46: 129-131. Spandana, B., Anuradha, G., Sivaraj, N., Sivaramakrishnan S and Subramoniam. (2011). Determination of Genetic
Variation in Indian Sesame (Sesamum indicum) Genotypes for Agro-Morphological Traits. Journal of Research in Agricultural Science. 7 (2): 88-99.
Tautz, D and Renz, M. (1984). Simple sequences are ubiquitous repetitive components of eukaryotic genomes. Nucleic Acids Research. 12: 4127-4137.
Tautz, D, Trick, M and Dover, G.A. (1986). Cryptic simplicity in DNA is a major source of genetic variation. Nature. 322: 652-656.
International Journal of Applied Biology and Pharmaceutical Technology Page: 109 Available online at www.ijabpt.com

Kiranmayi et al Copyrights@2016, ISSN: 0976-4550 Tiwari, S., Kumar, S and Gontia, I. (2011). Biotechnological approaches for sesame (Sesamum indicum L.) and niger
(Guzotia abyssinica L. f. Cass.). Asia-Pacific Journal of Molecular Biology and Biotechnology. 19 (1): 2-9. Toan, D.P, Tri, M.B, Gun, W, Tuyen, C.B, Arnulf, M. and Anders, S.C. (2009). A study of genetic diversity of
sesame (Sesamum indicum L.) in Vietnam and Cambodia estimated by RAPD makers. Genetic Resources and Crop Evolution. 56: 679-690.
Uzoh, J.O. (1998). Beniseed- a neglected oil wealth of Nigeria. In: L.D. Busari, A.A. Idowu and S.M. Misari (eds). Proc. 1st National Workshop on Beniseed. 3-5 March 1998, NCRI, Badeggi, pp: 1-2.
Wood, R. (1999). The New Whole Foods Encyclopedia: A Comprehensive Resource for Healthy Eating. Penguin Putnam Inc., New York.
Yeramanos D.M., Hemstreet, S., Saleeb, W and Huszar, C.K. (1972). Oil content and composition of the seed in the world collection of Sesame introductions. Journal of American Oil Chemical Society. 49: 20-23.
Zeven, A and Zhukovsky, P. (1975). Dictionary of cultivated plants and their centres of diversity Wageningen, PUDOC.
International Journal of Applied Biology and Pharmaceutical Technology Page: 110 Available online at www.ijabpt.com
