genetic diversity of dolly varden populations in norton ... · genetic diversity of dolly varden...
TRANSCRIPT
Genetic Diversity of Dolly Varden Populations in Norton and Kotzebue SoundsAlaska Fisheries Technical Report Number 80
Conservation Genetics LaboratoryMarch 2005
U.S. Fish and Wildlife Service

The Alaska Region Fisheries Program of the U.S. Fish and Wildlife Service conducts fi sheries monitoring and population assessment studies throughout many areas of Alaska. Dedicated professional staff located in Anchorage, Juneau, Fairbanks, Kenai, and King Salmon Fish and Wildlife Offi ces and the Anchorage Conservation Genetics Laboratory serve as the core of the Program’s fi sheries management study efforts. Administrative and technical support is provided by staff in the Anchorage Regional Offi ce. Our program works closely with the Alaska Depart-ment of Fish and Game and other partners to conserve and restore Alaska’s fi sh populations and aquatic habitats. Additional information about the Fisheries Program and work conducted by our fi eld offi ces can be obtained at:
http://alaska.fws.gov/fi sheries/index.htm
The Alaska Region Fisheries Program reports its study fi ndings through two regional publication series. The Alaska Fisheries Data Series was established to provide timely dissemination of data to local managers and for inclusion in agency databases. The Alaska Fisheries Techni-cal Reports publishes scientifi c fi ndings from single and multi-year studies that have undergone more extensive peer review and statistical testing. Additionally, some study results are published in a variety of professional fi sheries journals.
Disclaimer: The use of trade names of commercial products in this report does not constitute endorsement or recommendation for use by the federal government.
1
Alaska Fisheries Technical Report Number 80. March 2005U.S. Fish and Wildlife Service
Authors: 1 USFWS, Conservation Genetics Laboratory, 1011 E. Tudor Rd., Anchorage, Alaska 99503; 2 Alaska Department of Fish and Game, Sportfi sh Division, 1300 College Road, Fairbanks, AK 99701.
Genetic Diversity of Dolly Varden Populations in Norton and Kotzebue Sounds
Penny Crane1, Fred DeCicco2, Bill Spearman1, and John Wenburg1
Abstract
We describe the genetic stock structure of Dolly Varden, Salvelinus malma, in Norton and Kotzebue Sounds to develop a method to quantify contributions of Dolly Varden stocks harvested in subsistence fi sheries in the Wulik River. We surveyed genetic variation at seven microsatellite loci in 12 population sam-ples from Norton and Kotzebue Sounds and four additional populations from the North Slope and the Togiak River. Signifi cant differences in allele fre-quencies were detected among all pairwise combinations of populations and evidence of a closer genetic similarity was detected between Dolly Varden in the Imuruk Basin and Norton Sound, despite the size distribution and life his-tory similarities Imuruk Basin Dolly Varden share with Kotzebue Sound Dolly Varden. Mean contribution estimates from analysis of simulated mixtures from individual tributaries ranged from 82% to 98%, suggesting that robust stock composition estimates for regional groups, and in some cases, individual tributaries can be obtained. Dolly Varden were sampled from the Wulik River subsistence fi shery in October 2001. Two hundred individuals were randomly selected from the fi shery samples with size information and Bayesian Markov chain Monte Carlo estimates of regional stock proportions were made: North Slope 0.0369 (SD 0.0357), Kotzebue Sound 0.6726 (SD 0.0597), Cobblestone River 0.0035 (SD 0.0097), Norton Sound 0.2785 (SD 0.0571), and Togiak River 0.0085 (SD 0.015). The majority of Dolly Varden used in the mixture analysis was less than 325 mm fork length (FL), suggesting that at least some Dolly Varden are migrating into the Chukchi Sea basin during their fi rst or second seaward migrations.
Introduction
Anadromous Dolly Varden, Salvelinus malma, overwintering in the Wulik River are the most important subsistence resource for the residents of Kivalina, comprising over 90% of the subsistence catch (Burch 1985). Dolly Varden are harvested in subsistence fi sheries during the fall migration into freshwater and during the spring migration into saltwater. Harvests estimated through annual household surveys (ADFG 2001) or counts of catches (Bernard and DeCicco 1987) are generally between 15,000 and 25,000 (DeCicco 2001a) and have ranged from 7,436 fi sh in 1986 to 64,970 in 1969. Aerial surveys of the Wulik River are fl own annu-ally in the fall to monitor abundance of the overwintering population of Dolly Varden (De-
2
Alaska Fisheries Technical Report Number 80. March 2005U.S. Fish and Wildlife Service
Cicco 2001a); counts have ranged from 30,932 in 1984 to 297,257 in 1969. Mark-recapture experiments have estimated overwintering populations at 76,892 (SE=16,811) for fi sh greater than 400 mm FL in1988/1989 (DeCicco 1990) and 361,599 (SE=62,306) in 1994/1995 (De-Cicco 1996).
Dolly Varden home to their natal streams to spawn, but tagging studies have shown that overwintering fi sh are from multiple river systems (DeCicco 1997; Armstrong and Morrow 1980). For example, Dolly Varden tagged while overwintering in the Wulik River have been recovered in the Pilgrim, Kobuk, Noatak, Wulik, and Kivalina Rivers (DeCicco 1996). Tag recoveries have also been made on the Seward Peninsula, on Saint Lawrence Island, and in Russia, demonstrating the long distance movements of northwestern Dolly Varden (DeCicco 1997). However, the relative proportions of contributing populations to the overwintering aggregates of Dolly Varden in the Wulik River remain unknown. A method to identify the origin of Dolly Varden harvested in subsistence fi sheries in the Wulik River is needed to as-sess the impact of harvests on Dolly Varden populations.
Genetic differences have been detected both on large and small spatial and evolutionary time scales in Dolly Varden. In North America, two forms of Dolly Varden have been described based on genetic (Phillips et al. 1999), morphological, meristic, and behavioral traits (Mor-row 1980; Armstrong and Morrow 1980; Behnke 1980). The northern form, S. m. malma, is distributed from the Mackenzie River to the north side of the Alaska Peninsula, while the southern form, S. m. lordi, is distributed from the south side of the Alaska Peninsula to Puget Sound. Northern form Dolly Varden also occur in the upper Susitna drainage (Morrow 1980), and their southern distribution has recently been noted to include the south side of the Alaska Peninsula (Behnke 2002). Genetic differences have been detected both between (e.g., Reist et al. 1997; Leder 2001) and within forms (e.g., southern form: Griswold 2002; Redenbach and Taylor 2000; northern form: Everett et al. 1997; Crane et al. 2003). Genetic data have also been used in mixed-stock analysis (MSA) to estimate the origin of Dolly Varden sam-pled from mixtures in the Beaufort Sea and to document transboundary movements of U.S. and Canadian origin Dolly Varden along the North Slope (Everett et al. 1997; Krueger et al. 1999).
Anadromous Dolly Varden spawning in rivers of Norton and Kotzebue Sounds show varia-tion in spawning timing and other life history attributes. Most Kotzebue Sound fi sh spawn in summer (DeCicco 1989; DeCicco and Reist 1999). Summer spawners may overwinter in their natal stream, move upstream to spawning areas in summer, and move back downstream to overwintering areas until the following spring when they migrate to sea; or may over-winter in non-natal streams, migrate out to sea in the spring and move directly to their natal streams to spawn. Some Kotzebue Sound fi sh and most Norton Sound fi sh are fall spawners, entering freshwater in the fall, typically spawning in headwater springs, and remaining near spawning areas to overwinter (DeCicco 1997).
Further, DeCicco and Reist (1999) described two geographic groups of Dolly Varden in west-ern Alaska, based on size and life history information. Those spawning in the Imuruk Basin and in Chukchi and Beaufort Sea drainages reach larger sizes than populations to the south in Norton Sound. In addition, movement patterns differ between fi sh from Norton and Kotze-
3
Alaska Fisheries Technical Report Number 80. March 2005U.S. Fish and Wildlife Service
bue Sounds. In Norton Sound, they tend to closely follow the movement patterns of salmon. Dolly Varden may delay migration into saltwater in the spring to allow feeding on salmon fry, and may enter freshwater multiple times in the summer to feed on salmon eggs. Reist and DeCicco (1999) speculated that these forms may have evolved during periods of allopatry during periodic rising of the Bering Land Bridge and may warrant division of northern form Dolly Varden into two forms: the nominal, northern form, distributed in Alaska from the Im-uruk Basin to the McKenzie River, and a Bering Sea or Beringian form, distributed from the Alaska Peninsula to Norton Sound. Alternatively, size differences may be due to an increas-ing latitudinal trend in Dolly Varden to food availability (Maekawa and Nakano 2002) and movement patterns may refl ect relatively recent adaptation to available resources. Gudkov (1999) suggested that the latitudinal life history and size variation in Bering and Chukchi Sea Dolly Varden are related to smolt age and number of seaward migrations prior to maturity, and that the populations share population dynamic characteristics.
In this project, we collected genetic data on 12 populations of Dolly Varden from Norton Sound and Kotzebue Sound. Using variation at seven microsatellite loci, we describe the genetic population structure of Dolly Varden in northwestern Alaska, and test if there is a transition in genetic diversity patterns at the Imuruk Basin corresponding to changes in size distributions and life history patterns. We also test the applicability of genetic data for use in MSA to estimate the origin of Dolly Varden sampled from subsistence catches in the Wulik River in fall 2001.
Methods
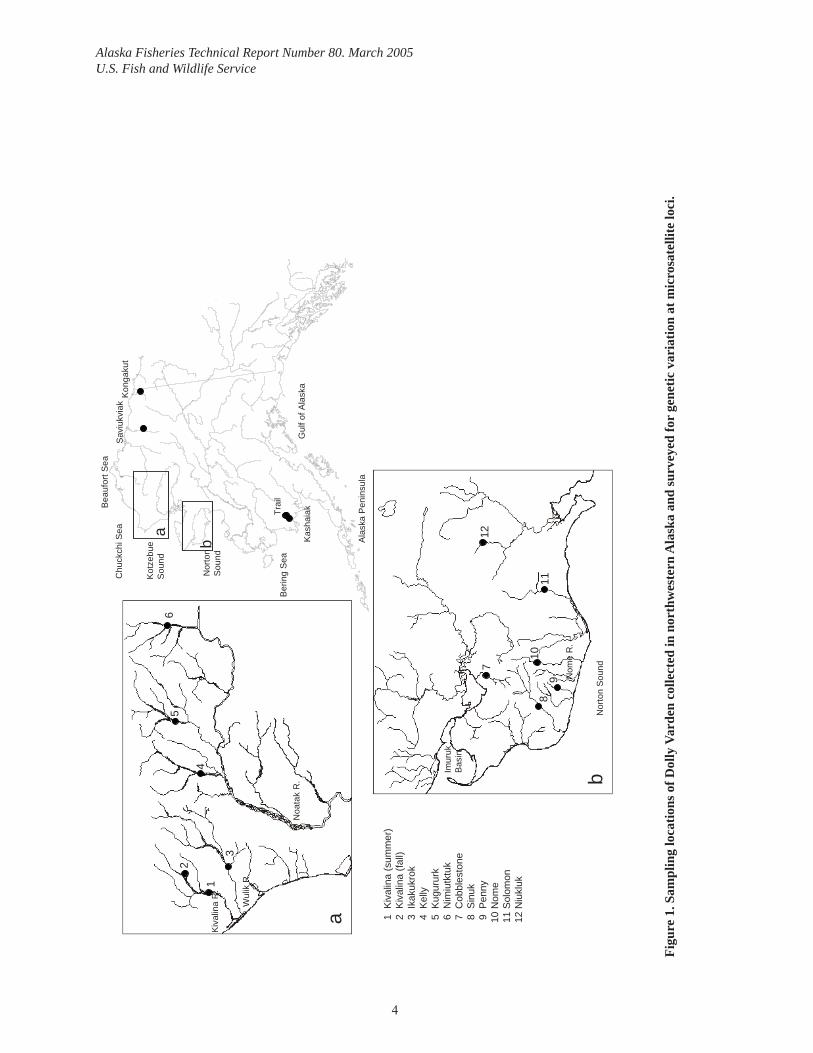
Sample CollectionFin tissue was collected from Dolly Varden at a total of 12 locations in Norton and Kotzebue Sounds (Figure 1, Table 1). Fin tissue was taken from prespawning adults, recently emerged young-of-the-year, and juveniles. Prespawning adults were collected by hook and line at or near spawning areas. Gender was determined by examination of external characteristics and fork length was measured to the nearest mm. Young-of-the-year and juvenile fi sh were cap-tured using baited minnow traps or small dip nets. Possible family effects of sampling juve-niles (Allendorf and Phelps 1981) were minimized by setting minnow traps at multiple loca-tions at sampling sites and by collecting juveniles from several locations over the area used for rearing within a given stream. Fin clips, or whole fi sh, in the case of recently emerged young-of-the-year, were stored in individually labeled vials with 90% ethanol.
We included adult samples from the Kongakut and Saviukviak Rivers on the North Slope, and from the Kashaiak River and Trail Creek in Bristol Bay (tributaries to the Togiak River) for comparison at a larger spatial scale (Table 1, Figure 1).
Fin clips were also taken from fi sh in the mixed-stock subsistence fi shery in the Wulik River at Kivalina in October 2001. Subsistence fi shers in Kivalina were visited after they had com-pleted their fall fi shing, and after receiving permission, fi sh were measured and fi n clips were taken. The catches of three subsistence fi shers were inspected and sampled. A total of 576 tissue samples were obtained along with 319 fork length (FL) measurements. Further infor-
4
Alaska Fisheries Technical Report Number 80. March 2005U.S. Fish and Wildlife Service
Figu
re 1
. Sam
plin
g lo
catio
ns o
f Dol
ly V
arde
n co
llect
ed in
nor
thw
este
rn A
lask
a an
d su
rvey
ed fo
r ge
netic
var
iatio
n at
mic
rosa
telli
te lo
ci.
a
Kiv
alin
aR
.
Noa
tak
R.
Wul
ikR
.
1
2
3
4
56
1 K
ival
ina
(sum
mer
)2
Kiv
alin
a(fa
ll)3
Ikak
ukro
k4
Kel
ly5
Kug
urur
k6
Nim
iutk
tuk
7 C
obbl
esto
ne8
Sin
uk9
Pen
ny10
Nom
e11
Sol
omon
12 N
iukl
uk
bN
ome
R.
7
89
1011
12
Imur
ukB
asin
Nor
ton
Sou
nd
a
bN
orto
nS
ound
Kot
zebu
eS
ound
Kon
gaku
tS
aviu
kvia
k
Kas
haia
kTrai
l
Ala
ska
Pen
insu
la
Chu
ckch
iSea
Bea
ufor
t Sea
Ber
ing
Sea
Gul
f of A
lask
a
5
Alaska Fisheries Technical Report Number 80. March 2005U.S. Fish and Wildlife Service
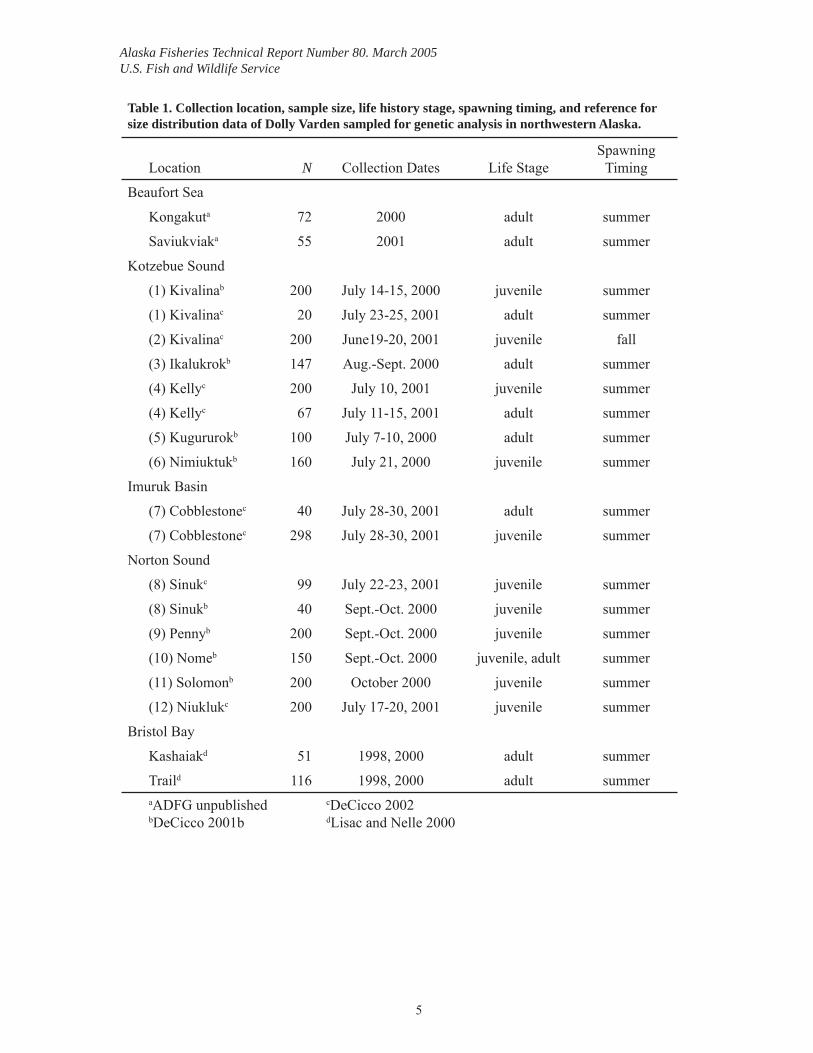
Table 1. Collection location, sample size, life history stage, spawning timing, and reference for size distribution data of Dolly Varden sampled for genetic analysis in northwestern Alaska.
Location N Collection Dates Life StageSpawning
Timing
Beaufort Sea
Kongakuta 72 2000 adult summer
Saviukviaka 55 2001 adult summer
Kotzebue Sound
(1) Kivalinab 200 July 14-15, 2000 juvenile summer
(1) Kivalinac 20 July 23-25, 2001 adult summer
(2) Kivalinac 200 June19-20, 2001 juvenile fall
(3) Ikalukrokb 147 Aug.-Sept. 2000 adult summer
(4) Kellyc 200 July 10, 2001 juvenile summer
(4) Kellyc 67 July 11-15, 2001 adult summer
(5) Kugururokb 100 July 7-10, 2000 adult summer
(6) Nimiuktukb 160 July 21, 2000 juvenile summer
Imuruk Basin
(7) Cobblestonec 40 July 28-30, 2001 adult summer
(7) Cobblestonec 298 July 28-30, 2001 juvenile summer
Norton Sound
(8) Sinukc 99 July 22-23, 2001 juvenile summer
(8) Sinukb 40 Sept.-Oct. 2000 juvenile summer
(9) Pennyb 200 Sept.-Oct. 2000 juvenile summer
(10) Nomeb 150 Sept.-Oct. 2000 juvenile, adult summer
(11) Solomonb 200 October 2000 juvenile summer
(12) Niuklukc 200 July 17-20, 2001 juvenile summer
Bristol Bay
Kashaiakd 51 1998, 2000 adult summer
Traild 116 1998, 2000 adult summeraADFG unpublishedbDeCicco 2001b
cDeCicco 2002dLisac and Nelle 2000
6
Alaska Fisheries Technical Report Number 80. March 2005U.S. Fish and Wildlife Service
mation on sampling locations, methods, and gender and size of fi sh sampled can be found in DeCicco (2001b) and DeCicco (2002).
Laboratory AnalysisTotal genomic DNA was isolated from fi n tissue using a quick lysis procedure. Individuals were assayed for genetic variation at seven microsatellite loci developed for Dolly Varden: Sma-3, -5, -10, -17, -21, -22, -24 (Crane et al. 2004). PCR amplifi cation of microsatellite loci was carried out in 10μl reaction volumes: approximately 100ng DNA, 1.5 mM MgCl2, 8 mM dNTPs, 0.5 U Taq DNA polymerase (Promega), 0.4μM unlabeled/labeled forward primer, and 0.4μM reverse primer, using an MJResearch™ DNA Engine™ PCT-200. Cycling con-ditions were 2 min at 92º; 30 cycles of 15 sec at 92º, 15 sec at Ta, and 30 sec at 72º; with a fi nal extension for 10 min at 72º. Annealing temperatures (Ta) were 55º for Sma-5, -10, and -22; 56º for Sma-17 and -21; and 58º for Sma-3. Microsatellites were separated on 64-well denaturing polyacrylamide gels and visualized and scored using a Li-Cor IR2® scanner with Li-Cor Saga™ GT ver 2.0 software (Lincoln, NE). Li-Cor 50–350bp or 50–500bp size stan-dards were loaded in the fi rst and last lanes and at intervals of 14 lanes or less across each gel. Positive controls, consisting of 2–10 alleles of predetermined size, were loaded in three lanes distributed evenly across the gels to ensure consistency of allele scores. Two research-ers scored alleles independently. Samples with score discrepancies between researchers were re-amplifi ed at the loci in question and rescored.
Statistical AnalysisPopulation Analysis—Unless otherwise noted, all calculations were made using FSTAT ver-sion 2.9.3 (Goudet 2001). Allele frequencies were calculated for each collection. Homogene-ity of allele frequencies between samples collected in the same tributary in different years were compared using likelihood ratio statistics and the signifi cance of the likelihood ratio statistic was evaluated using a randomization test through 4,620 permutations of genotypes between samples. Samples were pooled if no signifi cant differences were detected after ad-justing for four multiple tests using the sequential Bonferroni technique (Rice 1989).
Observed and expected heterozygosities and allele richness (number alleles observed per locus corrected for sample size) were used to describe within-sample diversity. For each lo-cus in each collection, deviation of genotypic frequencies from Hardy-Weinberg expectation was evaluated by testing for a defi cit of heterozygotes, FIS>0. Signifi cance was assessed by 2,240 permutations of alleles among individuals within samples; P-values over all loci were calculated according to Goudet (2001). Conformation to Hardy-Weinberg expectation was evaluated by adjusting the table-wide α=0.05 for 16 multiple tests using the sequential Bon-ferroni technique (Rice 1989). Homogeneity of allele frequencies among collections, includ-ing the Kivalina summer and fall spawning collections to determine if gene fl ow is restricted due to timing of spawning, were tested using likelihood ratio statistics, and the signifi cance was evaluated using a randomization test through 2,400 permutations of genotypes between samples. We adjusted P-values for the four multiple comparisons using the sequential Bon-ferroni technique.
Cavalli-Sforza & Edwards (CSE; 1967) chord distances were calculated from allele frequen-cies between all pairwise combinations using GENDIST in Phylip version 3.57c (Felsenstein
7
Alaska Fisheries Technical Report Number 80. March 2005U.S. Fish and Wildlife Service
1995). Genetic similarity among collections was visualized using multidimensional scaling in S-Plus 6.0 (Insightful, Inc.; Seattle, WA), where genetic distances were plotted in three dimensions such that the observed distances matched as closely as possible the distances in multidimensional space.
We computed FST to quantify the amount of population subdivision following the method of Weir and Cockheram (1984). A randomization-based test was used to determine if FST was greater than zero with the null distribution created through 1,000 permutations of genotypes among populations.
Randomization tests were used to test for differences in expected heterozygosity, allele richness, and FST between Norton Sound and Kotzebue Sound populations. If genetic differ-ences evolved during isolation due to lowered sea levels and the exposure of the land bridge, population size reductions may have led to a corresponding decrease of within-population variability. In addition, FST may be greater in the population samples from Kotzebue Sound because of the greater size and complexity of the river systems in this region, and the pres-ence of summer and fall spawning populations.
We used two methods to determine whether genetic structure corresponded more with life history variation (i.e., Cobblestone River grouped with Kotzebue Sound populations) or geographic proximity (i.e., Cobblestone River grouped with Norton Sound populations). For the fi rst method, we used pairwise CSE chord distances to build a tree that minimizes the sum of squared differences between the observed distances and the branch lengths in the tree (Fitch and Margoliash 1967) using the FITCH routine with the global rearrangement and randomization of taxon input order options in Phylip version 3.57c (Felsenstein 1995). Stability of the tree nodes, specifi cally the node linking Cobblestone River with either Norton or Kotzebue Sound populations, was assessed by 100 bootstrap resamples over loci using the SEQBOOT and CONSENSE routines of Phylip. We also used analysis of molecular variation for diploid data (AMOVA, Michalakis and Excoffi er 1996) to evaluate structuring of genetic variation using ARLEQUIN version 2.0 (Schneider et al. 2000). Two population hierarchies were used, one grouping Cobblestone River with Norton Sound (geographic proximity), and one grouping Cobblestone River with Kotzebue Sound (life history). For each analysis, ge-netic variation was partitioned into between region, within within-region, and within popula-tion components. Randomization tests were used to evaluate the signifi cance of the variance components.
Mixed Stock Analysis—Maximum likelihood estimation of artifi cial mixtures was used to determine population groupings of Dolly Varden from the Bering Sea region that can be iden-tifi ed in mixtures. Prior to the simulation analysis, alleles in the baseline populations were binned using the program OptiBin (Bromaghin and Crane In press) to reduce the effects of sampling error and rare alleles. For each locus, exact tests of homogeneity were used to test if allele pairs were similarly distributed across populations, with Monte Carlo simulation to estimate signifi cance, to determine the binning strategy. Log-likelihood ratios were used as the test statistic and the binning procedure executed until P<0.25.
We used the program SPAM version 3.7 (Debevec et al. 2000; Alaska Department of Fish and Game, Gene Conservation Laboratory, http://www.cf.adfg.state.ak.us/geninfo/research/
8
Alaska Fisheries Technical Report Number 80. March 2005U.S. Fish and Wildlife Service
genetics/software) for the simulation analysis. For each population, 1,000 artifi cial mixtures of 200 genotypes were randomly constructed using Hardy-Weinberg expectations from the baseline allele frequencies. Conditional maximum likelihood estimates and 90% symmet-ric confi dence intervals of the mixture compositions were estimated for the mixtures using randomly resampled baseline allele frequencies to account for sampling error in the baseline; a Bayesian estimate of baseline allele proportions (Rannala and Mountain 1997) was used to further reduce the effects of sampling error in the baseline allele frequencies. Mean contribu-tion estimate for the population under study should approximate 100% and estimates of about 90% are generally considered robust for mixture analysis (Teel et al. 1999; Kondzela et al. 2002).
Two hundred Dolly Varden were randomly subsampled from subsistence catch samples with corresponding size information (N=317). Stock composition estimates for these 200 fi sh were computed using a Bayesian procedure as implemented in BAYES (Pella and Masuda 2001). This approach was used over conditional maximum likelihood because some popula-tions likely to be contributing to mixtures sampled from the Wulik River are missing from the baseline. Conditional maximum likelihood assumes that there are no stocks missing from the baseline. BAYES uses information in the stock mixture and genetic similarities among the baseline samples to update the baseline, providing more accurate estimates for regional groups (Pella and Masuda 2001). For this analysis, we used unbinned baseline information because we did not want to lose information from rare alleles present in the mixture that could be used to update the baseline.
Markov chain Monte Carlo samples of stock proportions were generated for fi ve regional groups: North Slope, Kotzebue Sound, Cobblestone River, Norton Sound, and Togiak River. The initial proportion for the chain (N=5,000) for a given regional group was 95%, with the 5% distributed evenly among the remaining four groups. Values for genetic prior parameters were determined as described in Pella and Masuda (2001). The Rafferty and Lewis (1996) diagnostic was used to verify that chain lengths were suffi ciently long. Convergence was determined using the Gelman and Rubin (1992) diagnostic. The mean, standard deviation, and posterior quantiles of sample stock composition estimates were generated after a burn-in of 2,500 samples.
Results
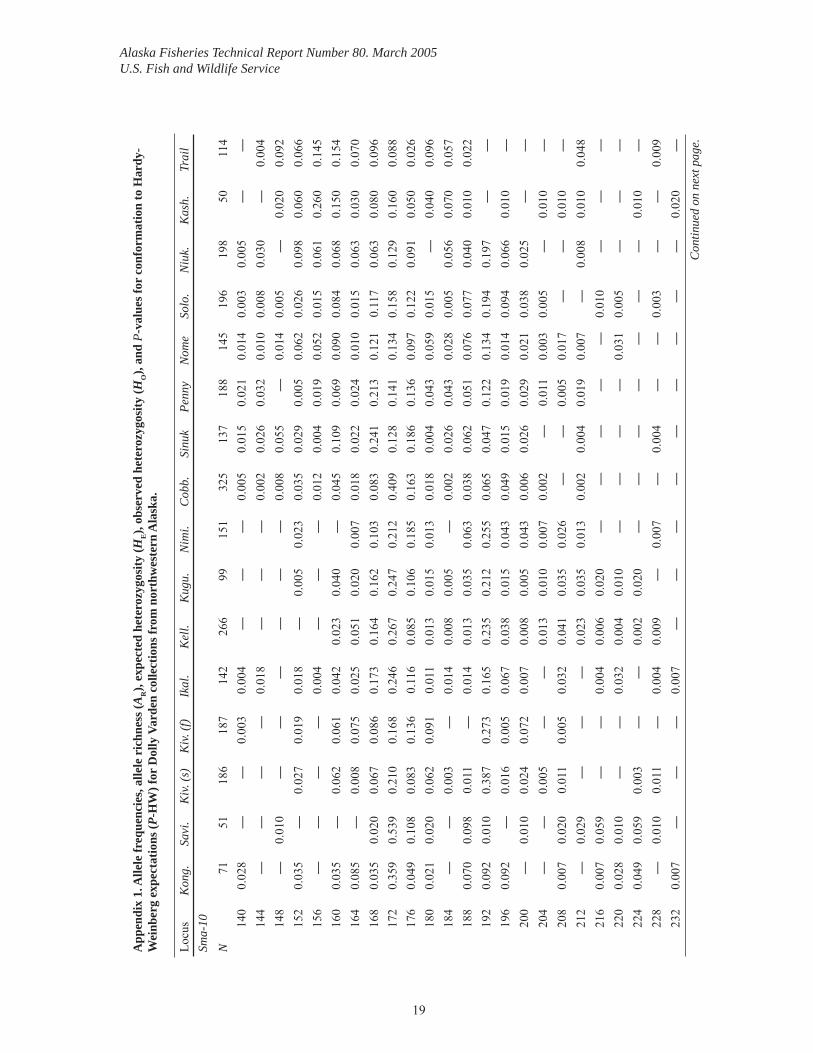
Population Subdivision All seven loci were polymorphic in all collections with the exception of Sma-5, which was polymorphic in only two collections from Norton Sound (Appendix 1). The number of al-leles observed at each variable locus ranged from 2 to 44 (Appendix 1). After adjusting for four multiple tests, no allele frequency heterogeneity was detected between collections made in different years from the Sinuk and Kelly Rivers (2000 and 2001; P=0.1773 and 0.0478, respectively) or between the Cobblestone River adult and juvenile collections (P=0.1262). Therefore, duplicate collections at these sites were pooled for subsequent analyses. Signifi -cant allele frequency heterogeneity was detected for the two samples of summer spawners in the Kivalina River in 2000 and 2001 (P=0.002). The juvenile sample was taken from near the mouth of Grayling Creek, and spawners were taken in the mainstem, up and downstream
9
Alaska Fisheries Technical Report Number 80. March 2005U.S. Fish and Wildlife Service
from Grayling Creek. However, because of the small sample size of the 2001 collection, we also pooled these two collections for further analysis.
Mean expected heterozygosities ranged from 0.604 in the Saviukviak River to 0.712 in the Nome River and averaged 0.941 over all loci (Appendix 1). Allele richness ranged from 9.42 in Kivalina River fall population to 13.04 in the Nome River (Appendix 1). When adjusted for multiple tests, one signifi cant deviation of genotypic frequencies from Hardy-Weinberg expectation was detected for Sma-10* (Kongakut River, P=0.0004), and four were detected locus Sma-24* (Kongakut River, Kivalina River summer, Ikalukrok River, and Kelly River P=0.004). When tested over all loci, three collections had signifi cant deviations from Hardy-Weinberg expectations: Kongakut River (P=0.0004), Kivalina River summer (P=0.0031), and Kashaiak River (P=0.0027). Allele frequency differences were detected among all popu-lation pairs in tests of homogeneity of allele frequencies, including between Kivalina summer and fall spawning populations (P<0.00042).
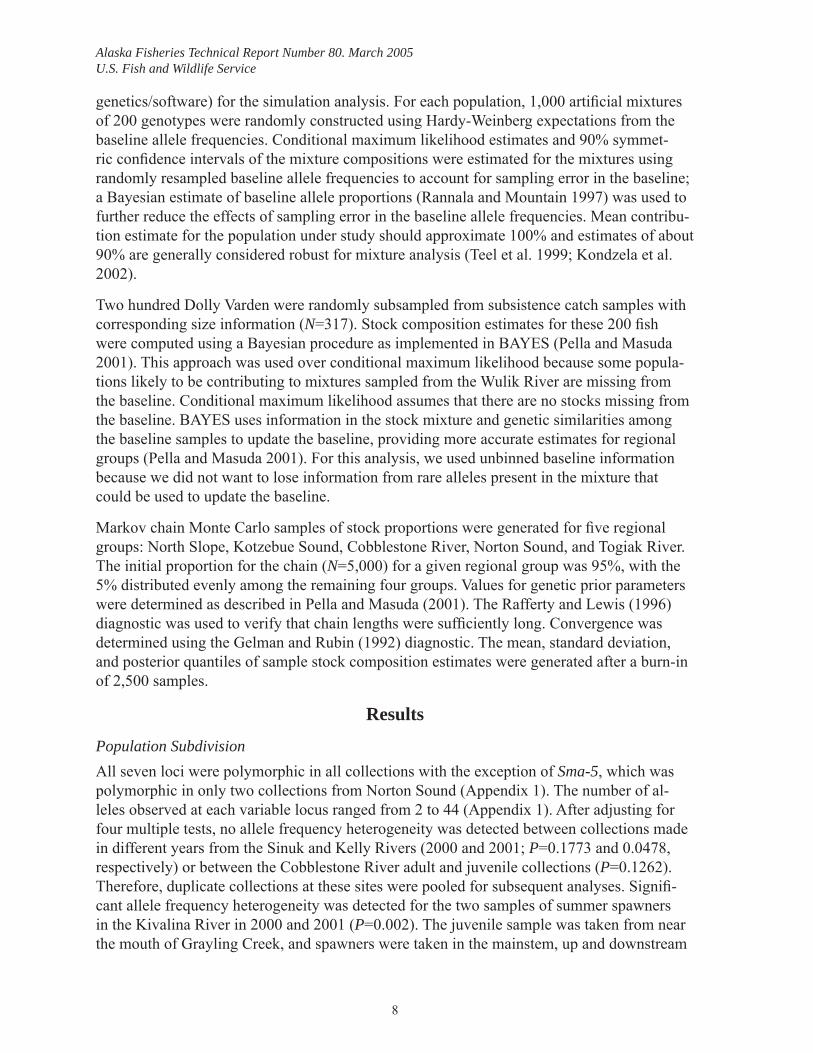
Multidimensional scaling showed that geographically proximate populations were the most genetically similar. Populations from Northwestern Alaska were spatially arranged in two groups, one composed of populations from the Kivalina, Wulik, and Noatak Rivers, and one composed of populations from Cobblestone River south and east to the Niukluk River. Within the Kotzebue Sound group, summer and fall spawning populations from the Kivalina River were genetically distinct from the other populations (Figure 2). Within the Noatak Riv-er, the Nimiuktuk River (the farthest upstream population sampled) was genetically distinct from the Kugururok and Kelly Rivers.
The global FST among all populations was 0.036 (P<0.0001). We detected signifi cant regional differences in expected heterozygosities (P=0.0046) but no differences in allele richness (P=0.1526). There were no signifi cant differences in regional FST (P=0.9582).
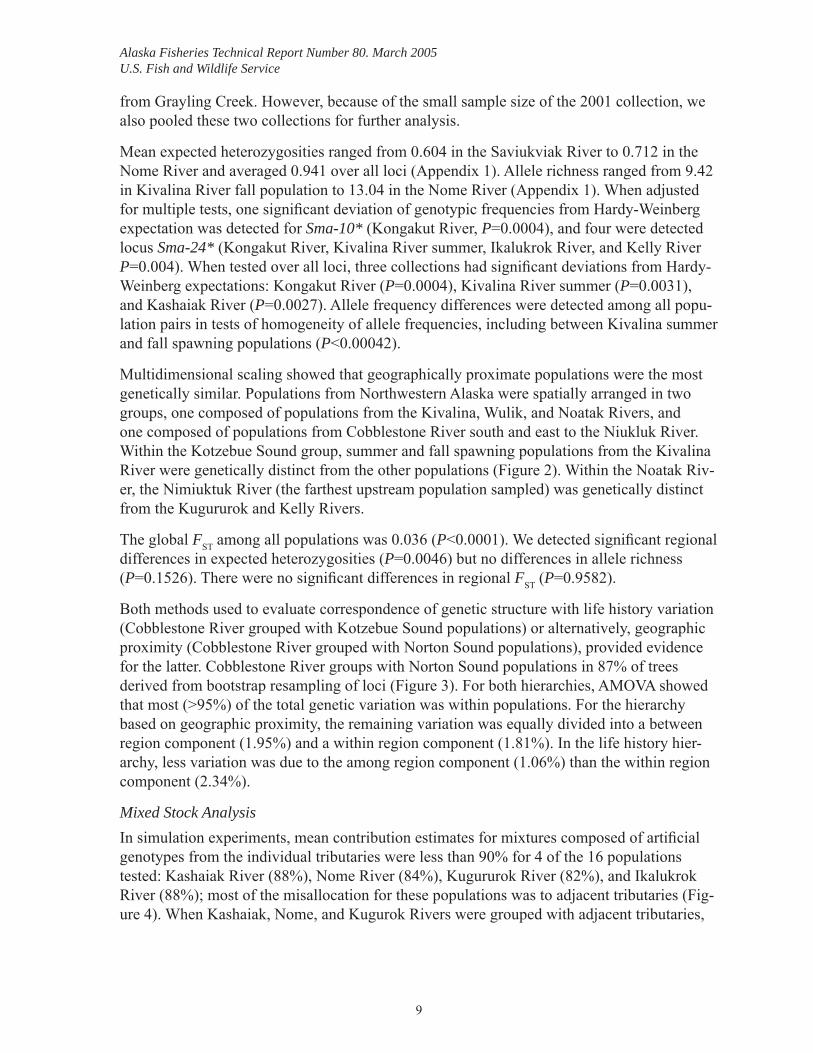
Both methods used to evaluate correspondence of genetic structure with life history variation (Cobblestone River grouped with Kotzebue Sound populations) or alternatively, geographic proximity (Cobblestone River grouped with Norton Sound populations), provided evidence for the latter. Cobblestone River groups with Norton Sound populations in 87% of trees derived from bootstrap resampling of loci (Figure 3). For both hierarchies, AMOVA showed that most (>95%) of the total genetic variation was within populations. For the hierarchy based on geographic proximity, the remaining variation was equally divided into a between region component (1.95%) and a within region component (1.81%). In the life history hier-archy, less variation was due to the among region component (1.06%) than the within region component (2.34%).
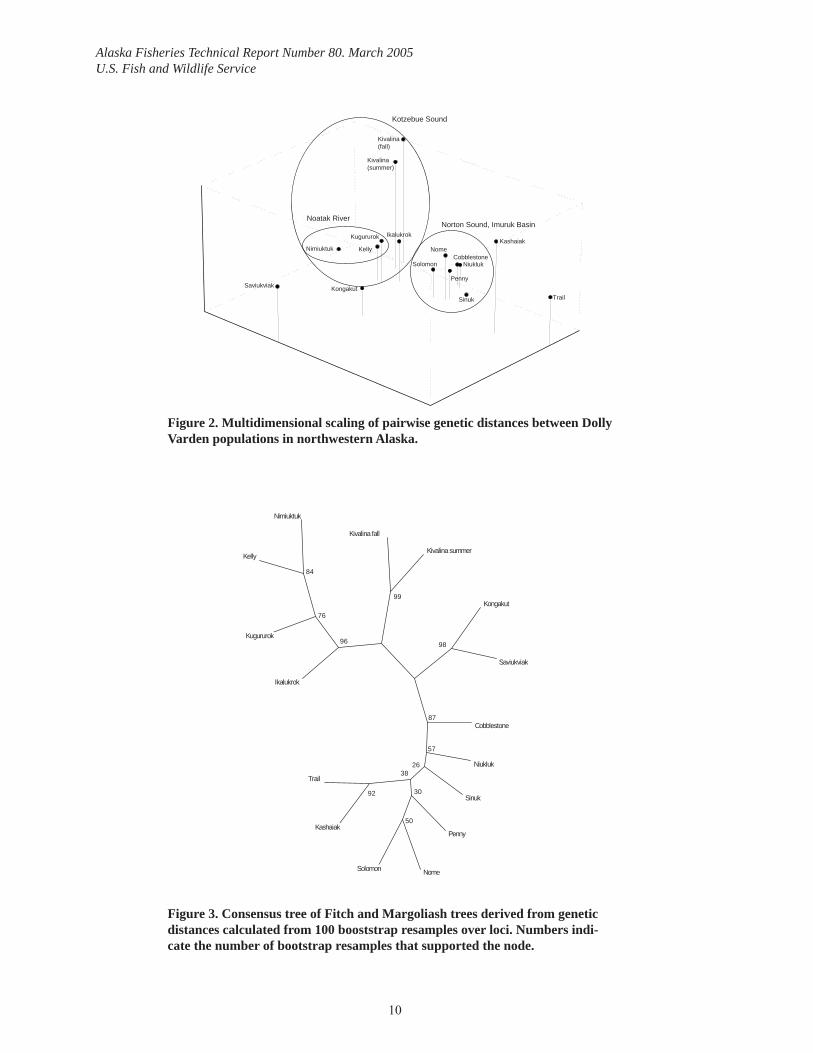
Mixed Stock Analysis In simulation experiments, mean contribution estimates for mixtures composed of artifi cial genotypes from the individual tributaries were less than 90% for 4 of the 16 populations tested: Kashaiak River (88%), Nome River (84%), Kugururok River (82%), and Ikalukrok River (88%); most of the misallocation for these populations was to adjacent tributaries (Fig-ure 4). When Kashaiak, Nome, and Kugurok Rivers were grouped with adjacent tributaries,
10
Alaska Fisheries Technical Report Number 80. March 2005U.S. Fish and Wildlife Service
Figure 2. Multidimensional scaling of pairwise genetic distances between Dolly Varden populations in northwestern Alaska.
Figure 3. Consensus tree of Fitch and Margoliash trees derived from genetic distances calculated from 100 booststrap resamples over loci. Numbers indi-cate the number of bootstrap resamples that supported the node.
Cobblestone
Kugururok
Kelly
Trail
Kashaiak
Kivalina(summer)
Kongakut
Nimiuktuk
SaviukviakPenny
Nome
Niukluk
Ikalukrok
Solomon
Sinuk
Kivalina(fall)
Norton Sound, Imuruk BasinNoatak River
Kotzebue Sound
Cobblestone
Niukluk
Sinuk
Penny
NomeSolomon
Kashaiak
Trail
Ikalukrok
Kugururok
Kelly
Nimiuktuk
Kivalina fall
Kivalina summer
Kongakut
Saviukviak
50
98
57
26
92
38
30
99
96
76
84
87
11
Alaska Fisheries Technical Report Number 80. March 2005U.S. Fish and Wildlife Service
Figure 4. Mean conditional maximum likelihood estimates and 90% sym-metric confi dence intervals of stock contributions to mixtures comprised of randomly generated genotypes from individual populations of Dolly Varden in northwestern Alaska. Mean estimates should equal 100%. Mean estimates of approximately 90% (vertical line) are generally considered robust for mix-ture analysis.
0.70 0.75 0.80 0.85 0.90 0.95 1.00
Kongakut
Saviukviak
Kivalana Summer
Kivalina Fall
Ikalukrok
Kelly
Kugururok
Nimiuktuk
Cobblestone
Sinuk
Penny
Nome
Solomon
Niukluk
Kashaiak
Trail
Mean Contribution Estimate
mean contribution estimates exceeded or were very close to 90%: Kashaiak/Trail River 94%, Nome/Solomon 89%, and Kelly/Kuguruok River 91%.
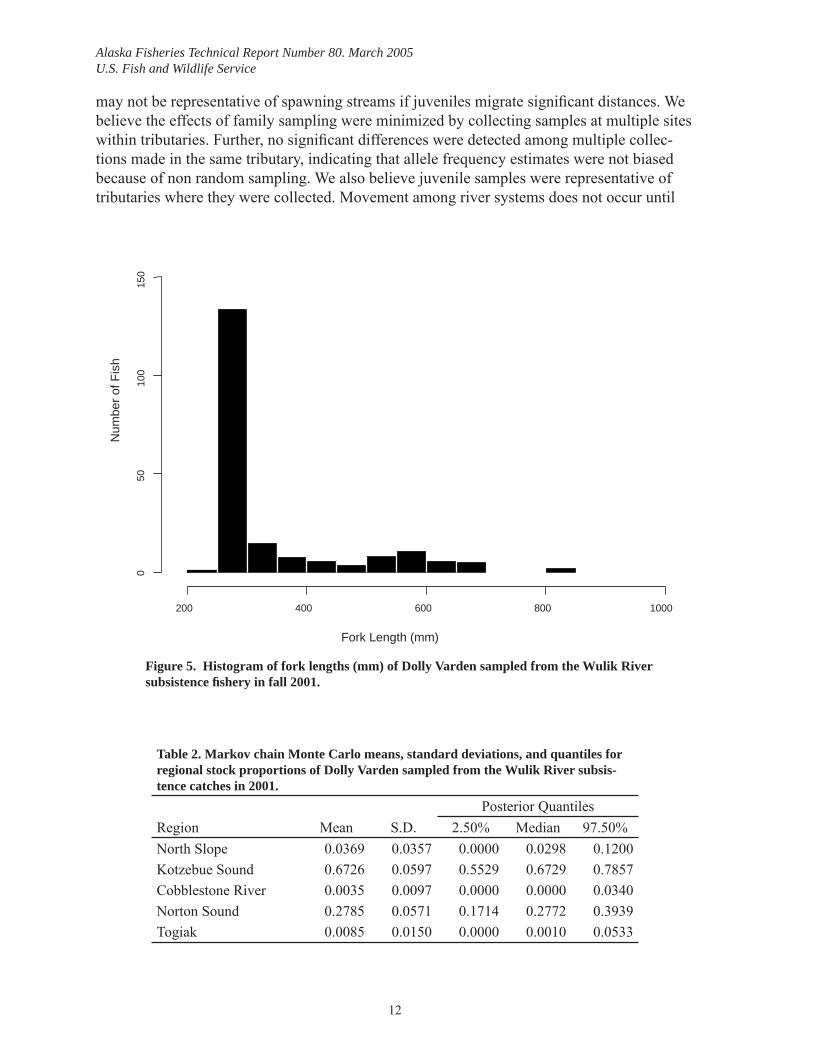
Mean FL of 200 Dolly Varden randomly sampled for stock composition estimates was 344 mm (range: 245–829 mm) (Figure 5). Markov chain Monte Carlo estimates of stock con-tributions indicated that approximately 95% of the subsistence samples from the Wulik River were from Kotzebue Sound (0.6726, SD 0.0597) and Norton Sound (0.2785, SD 0.0571) (Table 2). The remainder was from the North Slope (0.0369, SD 0.0357), Cobblestone River 0.0035 (SD 0.0097), and Togiak River 0.0085 (SD 0.015).
Discussion
Population SubdivisionTwo sources of error may have been introduced into this analysis by including samples of juvenile Dolly Varden. First, non-random sampling may have occurred if family groups were collected, infl ating the chance of signifi cant differences between populations (Allendorf and Phelps 1981). Second, multiple spawning aggregates may have been sampled, or samples
12
Alaska Fisheries Technical Report Number 80. March 2005U.S. Fish and Wildlife Service
Table 2. Markov chain Monte Carlo means, standard deviations, and quantiles for regional stock proportions of Dolly Varden sampled from the Wulik River subsis-tence catches in 2001.
Posterior QuantilesRegion Mean S.D. 2.50% Median 97.50%North Slope 0.0369 0.0357 0.0000 0.0298 0.1200Kotzebue Sound 0.6726 0.0597 0.5529 0.6729 0.7857Cobblestone River 0.0035 0.0097 0.0000 0.0000 0.0340Norton Sound 0.2785 0.0571 0.1714 0.2772 0.3939Togiak 0.0085 0.0150 0.0000 0.0010 0.0533
Figure 5. Histogram of fork lengths (mm) of Dolly Varden sampled from the Wulik River subsistence fi shery in fall 2001.
1000200 400 600 800
050
100
150
Fork Length (mm)
Num
ber o
f Fis
hmay not be representative of spawning streams if juveniles migrate signifi cant distances. We believe the effects of family sampling were minimized by collecting samples at multiple sites within tributaries. Further, no signifi cant differences were detected among multiple collec-tions made in the same tributary, indicating that allele frequency estimates were not biased because of non random sampling. We also believe juvenile samples were representative of tributaries where they were collected. Movement among river systems does not occur until
13
Alaska Fisheries Technical Report Number 80. March 2005U.S. Fish and Wildlife Service
smoltifi cation at ages 2–5. Within the Noatak River, the Nimiuktuk River was represented by juvenile samples, and this was the farthest upstream collection, minimizing the chances of mixing between tributaries. The Kelly River was represented by both juvenile and adult collections, but no allele frequency differences were detected between collections. However, further sampling of summer run spawning aggregates in the Kivalina River is warranted because Hardy-Weinberg conformation statistics indicate that multiple spawning aggregates may have been sampled.
Population subdivision in northwestern Alaska Dolly Varden is similar to the pattern ob-served by Everett et al. (1997) for North Slope drainages. Using allozyme data, they found highly signifi cant allele frequency differences among 11 North Slope drainages, and sig-nifi cant heterogeneity within three of seven drainages in which multiple tributaries were sampled, suggesting that population subdivision is occurring on a relatively fi ne scale. Simi-larly, in this study, signifi cant allele frequency differences were detected among all tributaries sampled, and within the Kivalina and Noatak Rivers. These studies suggest that natal homing by Dolly Varden is fairly precise, even though migratory behavior is complex. Similar genet-ic structuring of river system within region has also been documented for anadromous brook trout, S. fontinalis, (Castric and Bernatchez 2003) and Arctic char, S. alpinus, (Bernatchez et al. 1998).
Analyses based on genetic distance (MDS, Fitch tree) and FST (AMOVA) indicate a closer genetic similarity between Norton Sound and Imuruk Basin Dolly Varden, though Imuruk Basin Dolly Varden share life history attributes with Kotzebue Sound Dolly Varden. This suggests that natural selection is maintaining life history differences in Imuruk Basin Dolly Varden despite greater gene fl ow and/or more recent ancestry with Norton Sound Dolly Var-den.
Phenotypic diversity and genetic diversity at neutral loci can both be infl uenced by biogeo-graphical events. During the Wisconsin Glaciation ~18,000 ya, drainages on the north and south sides of the Seward Peninsula and Kotzebue Sound were the headwaters of the an-cient Chukchi River draining into the Chukchi Sea (Lindsey and McPhail 1986). This would suggest that present day populations in Norton and Kotzebue Sounds should be part of the same genetic lineage and that life history variation has evolved within about the last 18,000 years. Alternatively, present day populations in Norton Sound may be derived from a sec-ondary invasion of Dolly Varden from the south. In this case, Dolly Varden in Norton Sound would share a closer genetic relationship with populations in drainages to the south than with populations in Kotzebue Sound. Additional sampling of Dolly Varden in Bering Sea drain-ages south of Norton Sound would allow further examination of these alternative scenarios, and provide a better understanding of the infl uence of biogeography on observed life history variation.
Mixed Stock Analysis The level and pattern of genetic differences detected among populations surveyed in this study provide a powerful and cost effective method for estimating relative contributions of populations, or groups of populations, to overwintering aggregations in the Wulik River. The simulation analysis demonstrates that the contributions of individual river systems may be
14
Alaska Fisheries Technical Report Number 80. March 2005U.S. Fish and Wildlife Service
estimated in most cases. Krueger et al. (1999) were also able to estimate stock proportions of Dolly Varden sampled from the Beaufort Sea for individual river systems on the North Slope, as well as for individual tributaries in the Sagavanirktok River.
We estimated regional stock contributions to the mixture sample from the Wulik River rather than river system contributions because our baseline is not exhaustive. Populations in this study appear to be structured geographically; therefore, contributions of populations miss-ing from the baseline are likely to be misallocated to geographically proximate populations (Shaklee and Phelps 1990). However, representative samples from all potential geographic regions contributing to Wulik River mixtures are not included here. Potential bias in mixture estimates using the present baseline may be the exclusion of populations from Asia. Over-wintering Dolly Varden tagged in the Wulik River have been recaptured in the Anadyr River in Russia, suggesting that Dolly Varden may not always overwinter in their continent of origin (DeCicco 1992). Ideally, population samples from the Chukotsk Peninsula should be obtained.
The histogram of fork lengths of Dolly Varden sampled from the 2001 Wulik River subsis-tence fi shery indicates that most individuals sampled were less than 325 mm. These Dolly Varden are likely returning to freshwater after their fi rst or second seaward migration (DeCic-co 1996) and may be less likely to have traveled as extensively as individuals in larger size classes that have not previously spawned. Larger Dolly Varden that have already spawned once are also less likely to travel long distances because they have only one season at sea be-fore they will return to their natal stream to spawn again. The mixture composition was 67% Kotzebue Sound fi sh and 28% Norton Sound fi sh, providing some indication that Norton Sound Dolly Varden are migrating into the Chukchi Sea during their fi rst or second seaward migration.
Recommendations
Dolly Varden overwintering in the Wulik River are an important subsistence resource for the residents of Kivalina. While no immediate conservation concerns have been identifi ed for this fi shery resource, residents of Kivalina are concerned about contamination of fi sh and the potential for fi sh kills from pollution from Red Dog Mine, a zinc mine located upstream of the overwintering areas (DeCicco 2001; Susan Georgette, ADFG, Subsistence Division, Kotzebue, personal communication). Also, global warming may have profound effects upon Dolly Varden, including changes in marine movements patterns resulting from alterations in ocean productivity and fi sh metabolism, and shifts in the location and usage of overwintering areas resulting from alterations in stream discharge and freeze cycles. We recommend collec-tion of additional baseline data for Dolly Varden, particularly from populations in the Russian Far East, the Noatak River, and the Imuruk Basin. MSA using genetic data provide an accu-rate and cost effective method for estimating the stock composition of Dolly Varden aggrega-tions in overwintering areas and fi shery harvests. MSA can be used to obtain stock-specifi c information to assess impacts of subsistence fi shing, and habitat change due to pollution events or global warming.
15
Alaska Fisheries Technical Report Number 80. March 2005U.S. Fish and Wildlife Service
Acknowledgements
The U.S. Fish and Wildlife Service, Offi ce of Subsistence Management provided funding support for this project through the Fisheries Resource Monitoring Program, under project number 01-136. Michael Cartusciello served admirably as a fi eld assistant during the collec-tion of most genetic samples. Cara Lewis conducted the laboratory analysis. The people of Kivalina cooperated in allowing for sample collection from their subsistence harvest. The Alaska Department of Fish and Game, Sport Fish Division, Research and Technical Services provided assistance in planning this project. Editing and formatting services were provided by Andrea Medeiros, Publications Specialist, with the Offi ce of Subsistence Management.
References
ADFG. 2001. Alaska subsistence fi sheries, 1999 annual report. Division of Subsistence, Alaska Department of Fish and Game, Juneau.
Allendorf, F. W. and Phelps, S. R. 1981. Use of allelic frequencies to describe population structure. Canadian Journal of Fisheries and Aquatic Sciences 38:1507–1514.
Armstrong, R. H., and Morrow, J. E. 1980. The Dolly Varden char, Salvelinus malma. Pages 99–140 in Balon, E. (editor). Charrs: Salmonid fi shes of the genus Salvelinus, Perspec-tives in Vertebrate ScienceVol. 1. The Hague, Netherlands, Dr. W. Junk.
Behnke, R. J. 1980. A systematic review of the genus Salvelinus. Pages 441–479 in Balon E. (editor. Charrs: Salmonid fi shes of the genus Salvelinus, Perspectives in Vertebrate Sci-ence Vol. 1. The Hague, Netherlands, Dr. W. Junk.
Behnke, R. J. 2002. Trout and salmon of North America. The Free Press, A Division of Si-mon & Shuster Inc., New York.
Bernard, D. R. and DeCicco, A. L. 1987. Stock assessment of the Dolly Varden char of Kot-zebue Sound. Fishery Data Series No. 19, Division of Sport Fish, Alaska Department of Fish and Game, Juneau.
Bromaghin, J. F., and Crane, P. A. In Press. A new method to bin alleles of genetic loci that maintains population heterogeneity. Canadian Journal of Fisheries and Aquatic Sciences.
Bernatchez, L., Dempson, J. B., and Marin, S. 1998. Microsatellite gene diversity analysis in anadromous arctic char, Salvelinus alpinus, from Labrador, Canada. Canadian Journal of Fisheries and Aquatic Sciences 55:1264–1272.
Burch, E. S. Jr. 1985. Subsistence production in Kivalina, Alaska: a twenty-year perspective. Technical Paper No. 128. Division of Subsistence, Alaska Department of Fish and Game, Juneau, Alaska.
Castric, V. and Bernatchez, L. 2003. The rise and fall of isolation by distance in the anadro-mous brook charr (Salvelinus fontinalis Mitchill). Genetics 163:983–996.
Cavalli-Sforza, L. L. and Edwards, A. W. F. 1967. Phylogenetic analysis: Models and estima-tion procedures. 550–570.
Crane, P. A., Lewis, C. J., Kretschmer, E. J., Miller, S. J., Spearman, W. J., DeCicco, A. L., Lisac, M. J., and Wenburg, J. K. 2004. Characterization and inheritance of seven mic-
16
Alaska Fisheries Technical Report Number 80. March 2005U.S. Fish and Wildlife Service
rosatellite loci from Dolly Varden, Salvelinus malma, and cross-species amplifi cation in Arctic char, S. alpinus. Conservation Genetics 5:737–741.
Crane, P.A., Lisac, M., Spearman, B., Kretschmer, E., Lewis, C., Miller, S., and Wenburg, J. 2003. Development and application of microsatellites to population structure and mixed-stock analyses of Dolly Varden from the Togiak River drainage. U.S. Fish and Wildlife Service, Offi ce of Subsistence Management, Fisheries Resource Monitoring Program, Final Report for Study 00-011, Anchorage, Alaska.
Debevec, E. M., Gates, R. B., Masuda, M., Pella, J., Reynolds, J., and Seeb, L. 2000. SPAM (Version 3.2): Statistical program for analyzing mixtures. Journal of Heredity. 1:509–510.
DeCicco, A. L. 2002. Genetic diversity of Dolly Varden populations in Norton and Kotzebue Sounds, and of Arctic char populations on the Noatak National Preserve. U.S. Fish and Wildlife Service, Offi ce of Subsistence Management, Fisheries Resource Monitoring Program, Annual Report for Study 01-136, Anchorage, Alaska.
DeCicco, A. L. 2001a. Fishery management report for sport fi sheries in the Northwest Alaska Management Area, 1999–2000. Fishery Management Report No. 01-1, Alaska Depart-ment of Fish and Game, Anchorage.
DeCicco, A. L. 2001b. Genetic diversity of Dolly Varden populations in Norton and Kotze-bue Sounds, and of Arctic char populations on the Noatak National Preserve. U.S. Fish and Wildlife Service, Offi ce of Subsistence Management, Fisheries Resource Monitoring Program, Final Report for Study 00-01, Anchorage, Alaska.
DeCicco, A. L. 1997. Movements of postsmolt anadromous Dolly Varden in Northwestern Alaska. American Fisheries Society Symposium 19:175–183.
DeCicco, A. L. 1996. Abundance of Dolly Varden overwintering in the Wulik River, North-western Alaska, during 1994/1995. Fishery Data Series No. 96-3, Alaska Department of Fish and Game, Anchorage.
DeCicco, A. L. 1992. Long distance movements of anadromous Dolly Varden between Alaska and the U.S.S.R. Arctic 45:120–123.
DeCicco, A. L. 1990. Northwest Alaska Dolly Varden study 1989. Fishery Data Series No. 90-8, Alaska Department of Fish and Game, Anchorage.
DeCicco, A. L. 1989. Movements of spawning adult Dolly Varden char (S. malma) in Chuk-chi Sea drainages of northwestern Alaska: evidence for summer and fall spawning popu-lations. Pages 229–238 in Kawanabe, Yamazaki, and Noakes (editors) Biology of Charrs and Masu Salmon, Physiology and Ecology Japan, Special Volume 1.
DeCicco, A. and Reist, J. 1999. Distribution of Dolly Varden in northern Bering and Chukchi Sea drainages, a provisional organization. ISACF Information Series 7:13–18.
Everett, R. J.,Wilmot, R. L., and Krueger, C. C. 1997. Population genetic structure of Dolly Varden from Beaufort Sea drainages of northern Alaska and Canada. American Fisheries Society Symposium 19:240–249.
Felsenstein, J. 1995. PHYLIP version 3.57c. Department of Genetics, University of Washing-ton, Seattle.
17
Alaska Fisheries Technical Report Number 80. March 2005U.S. Fish and Wildlife Service
Fitch, W. M., and Margoliash, E. 1967. Construction of phylogenetic trees. Science 155:279–284.
Gelman, A. and Rubin, D. B. 1992. Inference from iterative simulation using multiple se-quences. Statistical Science 7:457–511.
Goudet, J. 2001. FSTAT, a program to estimate and test gene diversities and fi xation indices (version 2.9.3). Available from http://www.unil.ch/izea/softwares/fstat.html.
Griswold, K. E. 2002. Genetic and meristic relationships of coastal cutthroat trout and Dolly Varden in Prince William Sound, Alaska. Ph.D. Dissertation. Oregon State University, Corvallis, Oregon.
Gudkov, P. K. 1999. New data on the geographic variation of Dolly Varden, S. malma in Northeast Asia. ISACF Information Series 7: 13–18.
Kondzela, C. M., Crane, P. A., Urawa, S., Varnavskaya, N.V., Efremov, V., Luan, X., Tem-plin, W. B., Hayashizaki, K., Wilmot, R. L., and Seeb, L. W. 2002. Development of a comprehensive allozyme baseline for Pacifi c Rim chum salmon (NPAFC Doc. 629) Alaska Department of Fish and Game, 333 Raspberry Road, Anchorage, AK, USA 99518.
Krueger, C. C., Wilmot, L. L., and Everett, R. J. 1999. Stock origins of Dolly Varden col-lected from Beaufort Sea coastal sites of Arctic Alaska and Canada. Transactions of the American Fisheries Society 128:49–57.
Leder, E. H. 2001. Phylogenetic analysis of the arctic char-Dolly Varden species complex. PhD dissertation, University of Wisconsin, Milwaukee.
Lindsey, C. C. and McPhail, J. D. 1986. Zoogeography of fi shes of the Yukon and Mackenzie basins. Pages 639–674 in C. H. Hocutt E. O. Wiley (editors). The zoogeography of North American freshwater fi shes. Wiley, New York.
Lisac, M. J. and Nelle, R. D. 2000. Migratory behavior and seasonal distribution of Dolly Varden Salvelinus malma in the Togiak River watershed, Togiak National Wildlife Ref-uge. Final Report. U.S. Fish and Wildlife Service. Dillingham, Alaska.
Maekawa, K. and Nakano, S. 2002. Latitudinal trends in adult body size of Dolly Varden, with special reference to the food availability hypothesis. Population Ecology 44:17–22.
Michalakis, Y. and Excoffi er, L. 1996. A generic estimation of population subdivision us-ing distances between alleles with special reference for microsatellite loci. Genetics 142:1061–1064.
Morrow, J. E. 1980. Analysis of the Dolly Varden charr, Salvelinus malma, of northwestern North America and northeastern Siberia. Pages 323–338 in E. K. Balon (editor). Charrs: salmonid fi shes of the genus Salvelinus. Dr. W. Junk, the Hague, Netherlands.
Pella, J., and Masuda, M. 2001. Bayesian methods for analysis of stock mixtures from ge-netic characters. Fishery Bulletin 99:151–167.
Phillips, R. B., Gudex, L. I., Westrich, K. M., and DeCicco, A L., 1999. Combined phyloge-netic analysis of ribosomal ITS1 sequences and new chromosome data supports three subgroups of Dolly Varden char (Salvelinus malma). Canadian Journal of Fisheries and Aquatic Sciences 56:1504–1511.
18
Alaska Fisheries Technical Report Number 80. March 2005U.S. Fish and Wildlife Service
Rafferty, A. E. and Lewis, S. M. 1996. Implementing MCMC. Pages 115–130 in Gilks, W. R., Richardson, S., and Spiegelhalter, D. J. (editors). In Markov chain Monte Carlo in practice. Chapman and Hall, London.
Rannala, B. and Mountain, J. L. 1997. Detecting immigration by using multilocus genotypes. Proceedings of the National Academy of Sciences 94:9197–9201.
Redenbach, Z., and Taylor, E. B. 2002. Evidence of historical introgression along a contact zone between two species of char (Pisces: Salmonidae) in northwestern North America. Evolution 56:1021–1035.
Reist, J. D., Johnson, J. D., and Carmichael, T. J. 1997. Variation and specifi c identity of char from northwestern Arctic Canada and Alaska. American Fisheries Society Symposium 19:250–261.
Rice, W. R. 1989. Analyzing tables of statistical tests. Evolution 43:223–225.Schneider, S., Roessli, D., and Excoffi er, L. 2000. ARLEQUIN version 2.0: A software for
population genetics data analysis. Genetics and Biometry Laboratory, Dept. of Anthro-pology and Ecology, University of Geneva, CP 511, 1211 Geneva 24, Switzerland.
Shaklee, J. B. and Phelps, S. R. 1990. Operation of a large-scale, multiagency program for genetic stock identifi cation. American Fisheries Society Symposium 7:817–830.
Teel, D. J., Crane, P. A., Guthrie, C. M., Marshall, A. R., VanDoornik, D. M., Templin, W. D., Varnavskaya, N. V., and Seeb, L. W. 1999. Comprehensive allozyme database dis-criminates chinook salmon around the Pacifi c Rim. (NPAFC document 440). Alaska Department of Fish and Game, Division of Commercial Fisheries, 333 Raspberry Road, Anchorage, Alaska USA 99518.
Weir, B. S. and Cockerham, C. C. 1984. Estimating F-statistics for the analysis of population structure. Evolution 38:1358–1370.
19
Alaska Fisheries Technical Report Number 80. March 2005U.S. Fish and Wildlife Service
Locu
sK
ong.
Savi
.K
iv. (s
)K
iv. (f
)Ik
al.
Kel
l.K
ugu.
Nim
i.C
obb.
Sinu
kPe
nny
Nom
eSo
lo.
Niu
k.K
ash.
Trai
lSm
a-10
N71
5118
618
714
226
699
151
325
137
188
145
196
198
5011
414
00.
028
——
0.00
30.
004
——
—0.
005
0.01
50.
021
0.01
40.
003
0.00
5—
—14
4—
——
—0.
018
——
—0.
002
0.02
60.
032
0.01
00.
008
0.03
0—
0.00
414
8—
0.01
0—
——
——
—0.
008
0.05
5—
0.01
40.
005
—0.
020
0.09
215
20.
035
—0.
027
0.01
90.
018
—0.
005
0.02
30.
035
0.02
90.
005
0.06
20.
026
0.09
80.
060
0.06
615
6—
——
—0.
004
——
—0.
012
0.00
40.
019
0.05
20.
015
0.06
10.
260
0.14
516
00.
035
—0.
062
0.06
10.
042
0.02
30.
040
—0.
045
0.10
90.
069
0.09
00.
084
0.06
80.
150
0.15
416
40.
085
—0.
008
0.07
50.
025
0.05
10.
020
0.00
70.
018
0.02
20.
024
0.01
00.
015
0.06
30.
030
0.07
016
80.
035
0.02
00.
067
0.08
60.
173
0.16
40.
162
0.10
30.
083
0.24
10.
213
0.12
10.
117
0.06
30.
080
0.09
617
20.
359
0.53
90.
210
0.16
80.
246
0.26
70.
247
0.21
20.
409
0.12
80.
141
0.13
40.
158
0.12
90.
160
0.08
817
60.
049
0.10
80.
083
0.13
60.
116
0.08
50.
106
0.18
50.
163
0.18
60.
136
0.09
70.
122
0.09
10.
050
0.02
618
00.
021
0.02
00.
062
0.09
10.
011
0.01
30.
015
0.01
30.
018
0.00
40.
043
0.05
90.
015
—0.
040
0.09
618
4—
—0.
003
—0.
014
0.00
80.
005
—0.
002
0.02
60.
043
0.02
80.
005
0.05
60.
070
0.05
718
80.
070
0.09
80.
011
—0.
014
0.01
30.
035
0.06
30.
038
0.06
20.
051
0.07
60.
077
0.04
00.
010
0.02
219
20.
092
0.01
00.
387
0.27
30.
165
0.23
50.
212
0.25
50.
065
0.04
70.
122
0.13
40.
194
0.19
7—
—19
60.
092
—0.
016
0.00
50.
067
0.03
80.
015
0.04
30.
049
0.01
50.
019
0.01
40.
094
0.06
60.
010
—20
0—
0.01
00.
024
0.07
20.
007
0.00
80.
005
0.04
30.
006
0.02
60.
029
0.02
10.
038
0.02
5—
—20
4—
—0.
005
——
0.01
30.
010
0.00
70.
002
—0.
011
0.00
30.
005
—0.
010
—20
80.
007
0.02
00.
011
0.00
50.
032
0.04
10.
035
0.02
6—
—0.
005
0.01
7—
—0.
010
—21
2—
0.02
9—
——
0.02
30.
035
0.01
30.
002
0.00
40.
019
0.00
7—
0.00
80.
010
0.04
821
60.
007
0.05
9—
—0.
004
0.00
60.
020
——
——
—0.
010
——
—22
00.
028
0.01
0—
—0.
032
0.00
40.
010
——
——
0.03
10.
005
——
—22
40.
049
0.05
90.
003
——
0.00
20.
020
——
——
——
—0.
010
—22
8—
0.01
00.
011
—0.
004
0.00
9—
0.00
7—
0.00
4—
—0.
003
——
0.00
923
20.
007
——
—0.
007
——
——
——
——
—0.
020
—C
ontin
ued
on n
ext p
age.
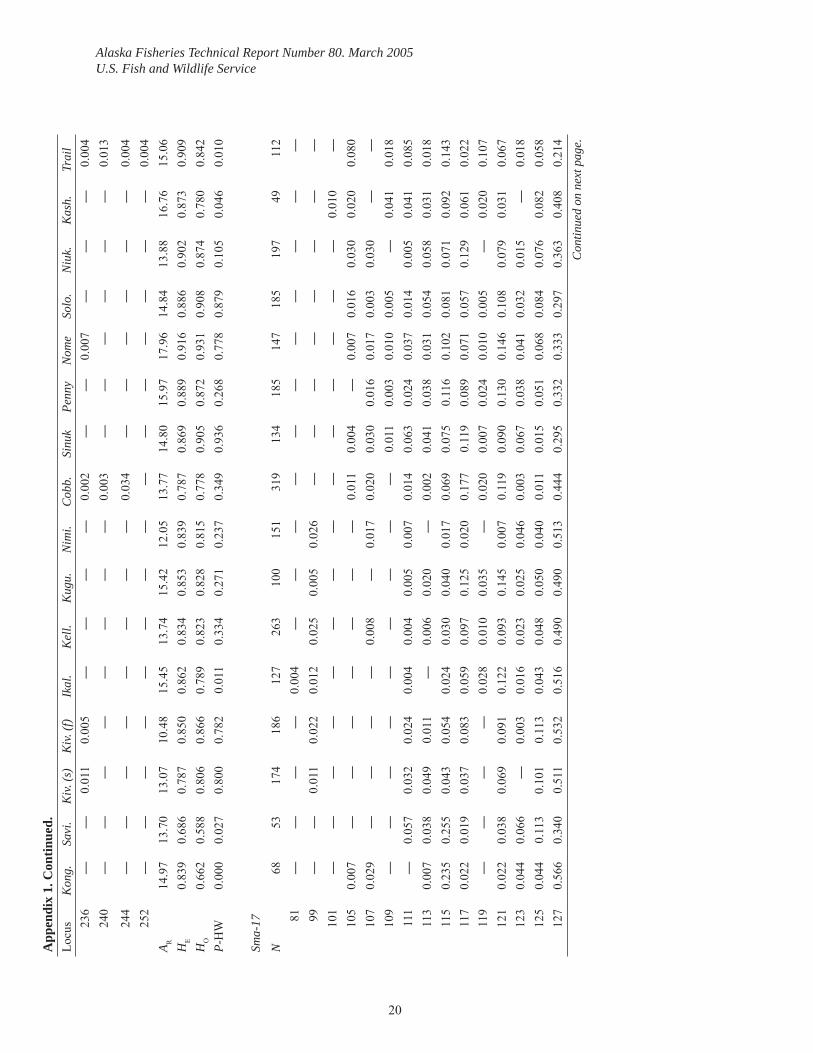
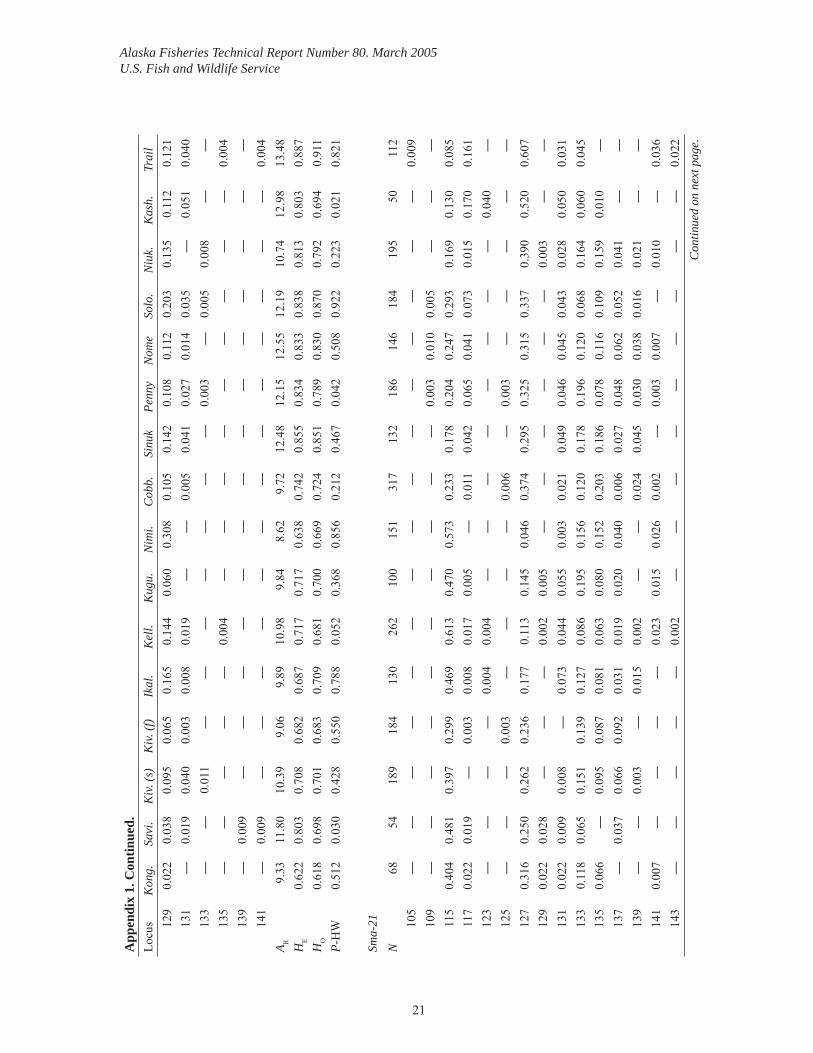
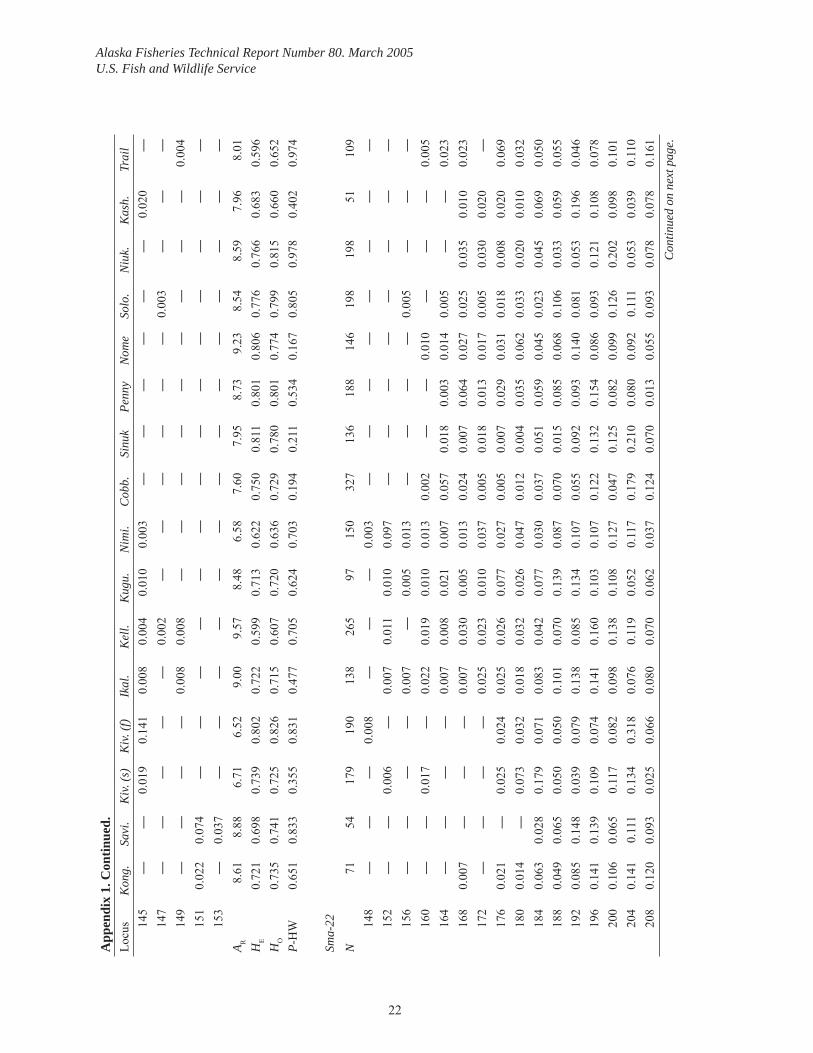
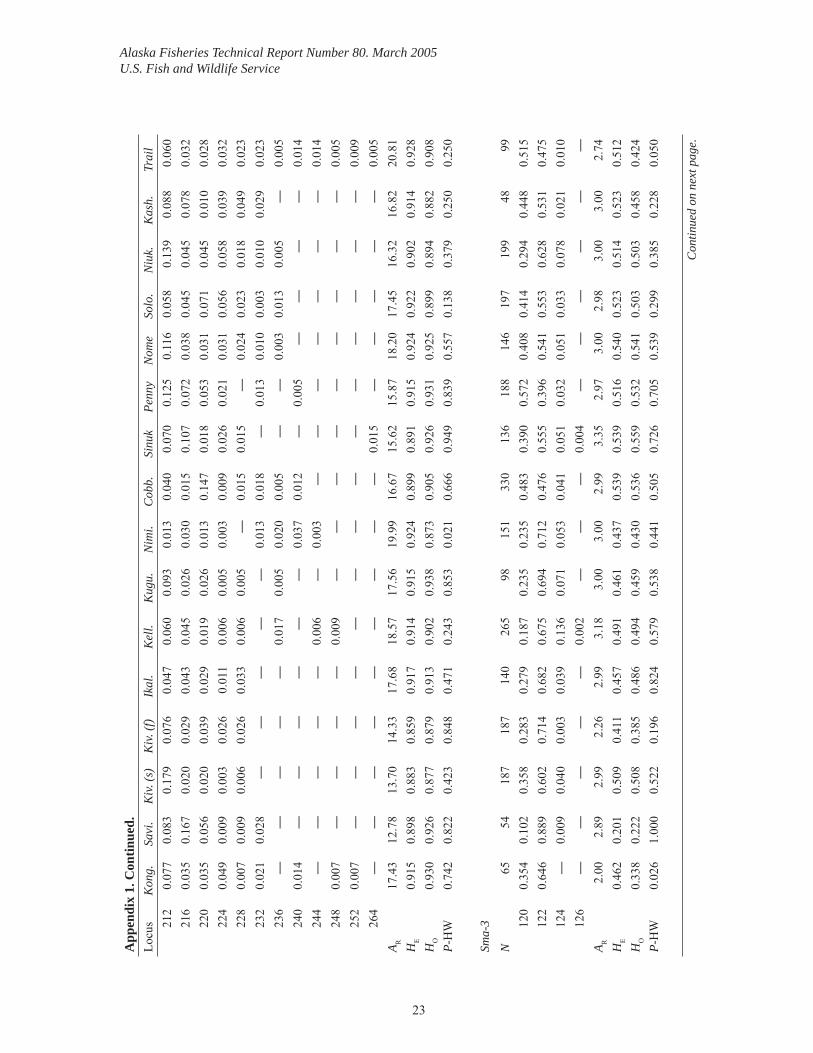
App
endi
x 1.
Alle
le fr
eque
ncie
s, al
lele
ric
hnes
s (A
R),
expe
cted
het
eroz
ygos
ity (H
E),
obse
rved
het
eroz
ygos
ity (H
O),
and
P-va
lues
for
conf
orm
atio
n to
Har
dy-
Wei
nber
g ex
pect
atio
ns (P
-HW
) for
Dol
ly V
arde
n co
llect
ions
from
nor
thw
este
rn A
lask
a.
20
Alaska Fisheries Technical Report Number 80. March 2005U.S. Fish and Wildlife ServiceA
ppen
dix
1. C
ontin
ued.
Locu
sK
ong.
Savi
.K
iv. (s
)K
iv. (f
)Ik
al.
Kel
l.K
ugu.
Nim
i.C
obb.
Sinu
kPe
nny
Nom
eSo
lo.
Niu
k.K
ash.
Trai
l23
6—
—0.
011
0.00
5—
——
—0.
002
——
0.00
7—
——
0.00
424
0—
——
——
——
—0.
003
——
——
——
0.01
3
244
——
——
——
——
0.03
4—
——
——
—0.
004
252
——
——
——
——
——
——
——
—0.
004
A R14
.97
13.7
013
.07
10.4
815
.45
13.7
415
.42
12.0
513
.77
14.8
015
.97
17.9
614
.84
13.8
816
.76
15.0
6H
E0.
839
0.68
60.
787
0.85
00.
862
0.83
40.
853
0.83
90.
787
0.86
90.
889
0.91
60.
886
0.90
20.
873
0.90
9H
O0.
662
0.58
80.
806
0.86
60.
789
0.82
30.
828
0.81
50.
778
0.90
50.
872
0.93
10.
908
0.87
40.
780
0.84
2P-
HW
0.00
00.
027
0.80
00.
782
0.01
10.
334
0.27
10.
237
0.34
90.
936
0.26
80.
778
0.87
90.
105
0.04
60.
010
Sma-
17N
6853
174
186
127
263
100
151
319
134
185
147
185
197
4911
281
——
——
0.00
4—
——
——
——
——
——
99—
—0.
011
0.02
20.
012
0.02
50.
005
0.02
6—
——
——
——
—10
1—
——
——
——
——
——
——
—0.
010
—10
50.
007
——
——
——
—0.
011
0.00
4—
0.00
70.
016
0.03
00.
020
0.08
010
70.
029
——
——
0.00
8—
0.01
70.
020
0.03
00.
016
0.01
70.
003
0.03
0—
—10
9—
——
——
——
——
0.01
10.
003
0.01
00.
005
—0.
041
0.01
811
1—
0.05
70.
032
0.02
40.
004
0.00
40.
005
0.00
70.
014
0.06
30.
024
0.03
70.
014
0.00
50.
041
0.08
511
30.
007
0.03
80.
049
0.01
1—
0.00
60.
020
—0.
002
0.04
10.
038
0.03
10.
054
0.05
80.
031
0.01
811
50.
235
0.25
50.
043
0.05
40.
024
0.03
00.
040
0.01
70.
069
0.07
50.
116
0.10
20.
081
0.07
10.
092
0.14
311
70.
022
0.01
90.
037
0.08
30.
059
0.09
70.
125
0.02
00.
177
0.11
90.
089
0.07
10.
057
0.12
90.
061
0.02
211
9—
——
—0.
028
0.01
00.
035
—0.
020
0.00
70.
024
0.01
00.
005
—0.
020
0.10
712
10.
022
0.03
80.
069
0.09
10.
122
0.09
30.
145
0.00
70.
119
0.09
00.
130
0.14
60.
108
0.07
90.
031
0.06
712
30.
044
0.06
6—
0.00
30.
016
0.02
30.
025
0.04
60.
003
0.06
70.
038
0.04
10.
032
0.01
5—
0.01
812
50.
044
0.11
30.
101
0.11
30.
043
0.04
80.
050
0.04
00.
011
0.01
50.
051
0.06
80.
084
0.07
60.
082
0.05
812
70.
566
0.34
00.
511
0.53
20.
516
0.49
00.
490
0.51
30.
444
0.29
50.
332
0.33
30.
297
0.36
30.
408
0.21
4C
ontin
ued
on n
ext p
age.
21
Alaska Fisheries Technical Report Number 80. March 2005U.S. Fish and Wildlife Service
App
endi
x 1.
Con
tinue
d.Lo
cus
Kon
g.Sa
vi.
Kiv.
(s)
Kiv.
(f)
Ikal
.K
ell.
Kug
u.N
imi.
Cob
b.Si
nuk
Penn
yN
ome
Solo
.N
iuk.
Kas
h.Tr
ail
129
0.02
20.
038
0.09
50.
065
0.16
50.
144
0.06
00.
308
0.10
50.
142
0.10
80.
112
0.20
30.
135
0.11
20.
121
131
—0.
019
0.04
00.
003
0.00
80.
019
——
0.00
50.
041
0.02
70.
014
0.03
5—
0.05
10.
040
133
——
0.01
1—
——
——
——
0.00
3—
0.00
50.
008
——
135
——
——
—0.
004
——
——
——
——
—0.
004
139
—0.
009
——
——
——
——
——
——
——
141
—0.
009
——
——
——
——
——
——
—0.
004
A R9.
3311
.80
10.3
99.
069.
8910
.98
9.84
8.62
9.72
12.4
812
.15
12.5
512
.19
10.7
412
.98
13.4
8H
E0.
622
0.80
30.
708
0.68
20.
687
0.71
70.
717
0.63
80.
742
0.85
50.
834
0.83
30.
838
0.81
30.
803
0.88
7H
O0.
618
0.69
80.
701
0.68
30.
709
0.68
10.
700
0.66
90.
724
0.85
10.
789
0.83
00.
870
0.79
20.
694
0.91
1P-
HW
0.51
20.
030
0.42
80.
550
0.78
80.
052
0.36
80.
856
0.21
20.
467
0.04
20.
508
0.92
20.
223
0.02
10.
821
Sma-
21N
6854
189
184
130
262
100
151
317
132
186
146
184
195
5011
210
5—
——
——
——
——
——
——
——
0.00
910
9—
——
——
——
——
—0.
003
0.01
00.
005
——
—11
50.
404
0.48
10.
397
0.29
90.
469
0.61
30.
470
0.57
30.
233
0.17
80.
204
0.24
70.
293
0.16
90.
130
0.08
511
70.
022
0.01
9—
0.00
30.
008
0.01
70.
005
—0.
011
0.04
20.
065
0.04
10.
073
0.01
50.
170
0.16
112
3—
——
—0.
004
0.00
4—
——
——
——
—0.
040
—12
5—
——
0.00
3—
——
—0.
006
—0.
003
——
——
—12
70.
316
0.25
00.
262
0.23
60.
177
0.11
30.
145
0.04
60.
374
0.29
50.
325
0.31
50.
337
0.39
00.
520
0.60
712
90.
022
0.02
8—
——
0.00
20.
005
——
——
——
0.00
3—
—13
10.
022
0.00
90.
008
—0.
073
0.04
40.
055
0.00
30.
021
0.04
90.
046
0.04
50.
043
0.02
80.
050
0.03
113
30.
118
0.06
50.
151
0.13
90.
127
0.08
60.
195
0.15
60.
120
0.17
80.
196
0.12
00.
068
0.16
40.
060
0.04
513
50.
066
—0.
095
0.08
70.
081
0.06
30.
080
0.15
20.
203
0.18
60.
078
0.11
60.
109
0.15
90.
010
—13
7—
0.03
70.
066
0.09
20.
031
0.01
90.
020
0.04
00.
006
0.02
70.
048
0.06
20.
052
0.04
1—
—13
9—
—0.
003
—0.
015
0.00
2—
—0.
024
0.04
50.
030
0.03
80.
016
0.02
1—
—14
10.
007
——
——
0.02
30.
015
0.02
60.
002
—0.
003
0.00
7—
0.01
0—
0.03
614
3—
——
——
0.00
2—
——
——
——
——
0.02
2C
ontin
ued
on n
ext p
age.
22
Alaska Fisheries Technical Report Number 80. March 2005U.S. Fish and Wildlife Service
App
endi
x 1.
Con
tinue
d.Lo
cus
Kon
g.Sa
vi.
Kiv.
(s)
Kiv.
(f)
Ikal
.K
ell.
Kug
u.N
imi.
Cob
b.Si
nuk
Penn
yN
ome
Solo
.N
iuk.
Kas
h.Tr
ail
145
——
0.01
90.
141
0.00
80.
004
0.01
00.
003
——
——
——
0.02
0—
147
——
——
—0.
002
——
——
——
0.00
3—
——
149
——
——
0.00
80.
008
——
——
——
——
—0.
004
151
0.02
20.
074
——
——
——
——
——
——
——
153
—0.
037
——
——
——
——
——
——
——
A R8.
618.
886.
716.
529.
009.
578.
486.
587.
607.
958.
739.
238.
548.
597.
968.
01H
E0.
721
0.69
80.
739
0.80
20.
722
0.59
90.
713
0.62
20.
750
0.81
10.
801
0.80
60.
776
0.76
60.
683
0.59
6H
O0.
735
0.74
10.
725
0.82
60.
715
0.60
70.
720
0.63
60.
729
0.78
00.
801
0.77
40.
799
0.81
50.
660
0.65
2P-
HW
0.65
10.
833
0.35
50.
831
0.47
70.
705
0.62
40.
703
0.19
40.
211
0.53
40.
167
0.80
50.
978
0.40
20.
974
Sma-
22N
7154
179
190
138
265
9715
032
713
618
814
619
819
851
109
148
——
—0.
008
——
—0.
003
——
——
——
——
152
——
0.00
6—
0.00
70.
011
0.01
00.
097
——
——
——
——
156
——
——
0.00
7—
0.00
50.
013
——
——
0.00
5—
——
160
——
0.01
7—
0.02
20.
019
0.01
00.
013
0.00
2—
—0.
010
——
—0.
005
164
——
——
0.00
70.
008
0.02
10.
007
0.05
70.
018
0.00
30.
014
0.00
5—
—0.
023
168
0.00
7—
——
0.00
70.
030
0.00
50.
013
0.02
40.
007
0.06
40.
027
0.02
50.
035
0.01
00.
023
172
——
——
0.02
50.
023
0.01
00.
037
0.00
50.
018
0.01
30.
017
0.00
50.
030
0.02
0—
176
0.02
1—
0.02
50.
024
0.02
50.
026
0.07
70.
027
0.00
50.
007
0.02
90.
031
0.01
80.
008
0.02
00.
069
180
0.01
4—
0.07
30.
032
0.01
80.
032
0.02
60.
047
0.01
20.
004
0.03
50.
062
0.03
30.
020
0.01
00.
032
184
0.06
30.
028
0.17
90.
071
0.08
30.
042
0.07
70.
030
0.03
70.
051
0.05
90.
045
0.02
30.
045
0.06
90.
050
188
0.04
90.
065
0.05
00.
050
0.10
10.
070
0.13
90.
087
0.07
00.
015
0.08
50.
068
0.10
60.
033
0.05
90.
055
192
0.08
50.
148
0.03
90.
079
0.13
80.
085
0.13
40.
107
0.05
50.
092
0.09
30.
140
0.08
10.
053
0.19
60.
046
196
0.14
10.
139
0.10
90.
074
0.14
10.
160
0.10
30.
107
0.12
20.
132
0.15
40.
086
0.09
30.
121
0.10
80.
078
200
0.10
60.
065
0.11
70.
082
0.09
80.
138
0.10
80.
127
0.04
70.
125
0.08
20.
099
0.12
60.
202
0.09
80.
101
204
0.14
10.
111
0.13
40.
318
0.07
60.
119
0.05
20.
117
0.17
90.
210
0.08
00.
092
0.11
10.
053
0.03
90.
110
208
0.12
00.
093
0.02
50.
066
0.08
00.
070
0.06
20.
037
0.12
40.
070
0.01
30.
055
0.09
30.
078
0.07
80.
161
Con
tinue
d on
nex
t pag
e.
23
Alaska Fisheries Technical Report Number 80. March 2005U.S. Fish and Wildlife Service
App
endi
x 1.
Con
tinue
d.Lo
cus
Kon
g.Sa
vi.
Kiv.
(s)
Kiv.
(f)
Ikal
.K
ell.
Kug
u.N
imi.
Cob
b.Si
nuk
Penn
yN
ome
Solo
.N
iuk.
Kas
h.Tr
ail
212
0.07
70.
083
0.17
90.
076
0.04
70.
060
0.09
30.
013
0.04
00.
070
0.12
50.
116
0.05
80.
139
0.08
80.
060
216
0.03
50.
167
0.02
00.
029
0.04
30.
045
0.02
60.
030
0.01
50.
107
0.07
20.
038
0.04
50.
045
0.07
80.
032
220
0.03
50.
056
0.02
00.
039
0.02
90.
019
0.02
60.
013
0.14
70.
018
0.05
30.
031
0.07
10.
045
0.01
00.
028
224
0.04
90.
009
0.00
30.
026
0.01
10.
006
0.00
50.
003
0.00
90.
026
0.02
10.
031
0.05
60.
058
0.03
90.
032
228
0.00
70.
009
0.00
60.
026
0.03
30.
006
0.00
5—
0.01
50.
015
—0.
024
0.02
30.
018
0.04
90.
023
232
0.02
10.
028
——
——
—0.
013
0.01
8—
0.01
30.
010
0.00
30.
010
0.02
90.
023
236
——
——
—0.
017
0.00
50.
020
0.00
5—
—0.
003
0.01
30.
005
—0.
005
240
0.01
4—
——
——
—0.
037
0.01
2—
0.00
5—
——
—0.
014
244
——
——
—0.
006
—0.
003
——
——
——
—0.
014
248
0.00
7—
——
—0.
009
——
——
——
——
—0.
005
252
0.00
7—
——
——
——
——
——
——
—0.
009
264
——
——
——
——
—0.
015
——
——
—0.
005
A R17
.43
12.7
813
.70
14.3
317
.68
18.5
717
.56
19.9
916
.67
15.6
215
.87
18.2
017
.45
16.3
216
.82
20.8
1H
E0.
915
0.89
80.
883
0.85
90.
917
0.91
40.
915
0.92
40.
899
0.89
10.
915
0.92
40.
922
0.90
20.
914
0.92
8H
O0.
930
0.92
60.
877
0.87
90.
913
0.90
20.
938
0.87
30.
905
0.92
60.
931
0.92
50.
899
0.89
40.
882
0.90
8P-
HW
0.74
20.
822
0.42
30.
848
0.47
10.
243
0.85
30.
021
0.66
60.
949
0.83
90.
557
0.13
80.
379
0.25
00.
250
Sma-
3N
6554
187
187
140
265
9815
133
013
618
814
619
719
948
9912
00.
354
0.10
20.
358
0.28
30.
279
0.18
70.
235
0.23
50.
483
0.39
00.
572
0.40
80.
414
0.29
40.
448
0.51
512
20.
646
0.88
90.
602
0.71
40.
682
0.67
50.
694
0.71
20.
476
0.55
50.
396
0.54
10.
553
0.62
80.
531
0.47
512
4—
0.00
90.
040
0.00
30.
039
0.13
60.
071
0.05
30.
041
0.05
10.
032
0.05
10.
033
0.07
80.
021
0.01
012
6—
——
——
0.00
2—
——
0.00
4—
——
——
—A R
2.00
2.89
2.99
2.26
2.99
3.18
3.00
3.00
2.99
3.35
2.97
3.00
2.98
3.00
3.00
2.74
HE
0.46
20.
201
0.50
90.
411
0.45
70.
491
0.46
10.
437
0.53
90.
539
0.51
60.
540
0.52
30.
514
0.52
30.
512
HO
0.33
80.
222
0.50
80.
385
0.48
60.
494
0.45
90.
430
0.53
60.
559
0.53
20.
541
0.50
30.
503
0.45
80.
424
P-H
W0.
026
1.00
00.
522
0.19
60.
824
0.57
90.
538
0.44
10.
505
0.72
60.
705
0.53
90.
299
0.38
50.
228
0.05
0
Con
tinue
d on
nex
t pag
e.
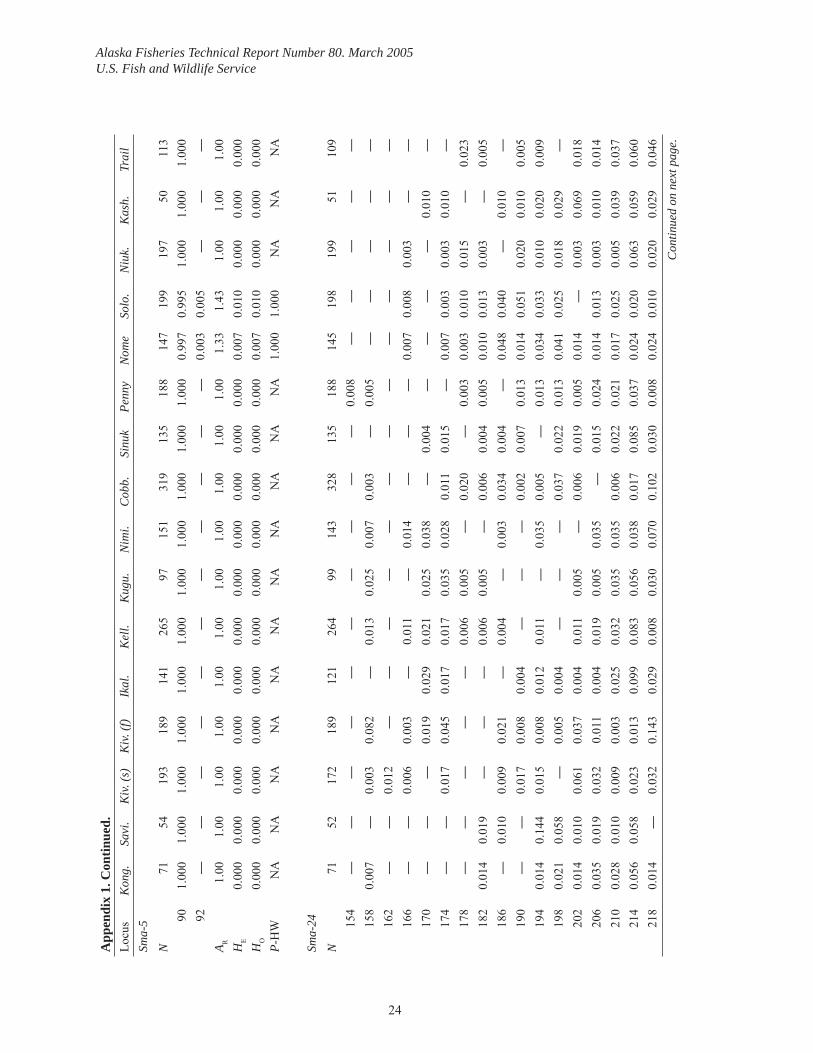
24
Alaska Fisheries Technical Report Number 80. March 2005U.S. Fish and Wildlife Service
App
endi
x 1.
Con
tinue
d.Lo
cus
Kon
g.Sa
vi.
Kiv.
(s)
Kiv.
(f)
Ikal
.K
ell.
Kug
u.N
imi.
Cob
b.Si
nuk
Penn
yN
ome
Solo
.N
iuk.
Kas
h.Tr
ail
Sma-
5N
7154
193
189
141
265
9715
131
913
518
814
719
919
750
113
901.
000
1.00
01.
000
1.00
01.
000
1.00
01.
000
1.00
01.
000
1.00
01.
000
0.99
70.
995
1.00
01.
000
1.00
092
——
——
——
——
——
—0.
003
0.00
5—
——
A R1.
001.
001.
001.
001.
001.
001.
001.
001.
001.
001.
001.
331.
431.
001.
001.
00H
E0.
000
0.00
00.
000
0.00
00.
000
0.00
00.
000
0.00
00.
000
0.00
00.
000
0.00
70.
010
0.00
00.
000
0.00
0H
O0.
000
0.00
00.
000
0.00
00.
000
0.00
00.
000
0.00
00.
000
0.00
00.
000
0.00
70.
010
0.00
00.
000
0.00
0P-
HW
NA
NA
NA
NA
NA
NA
NA
NA
NA
NA
NA
1.00
01.
000
NA
NA
NA
Sma-
24N
7152
172
189
121
264
9914
332
813
518
814
519
819
951
109
154
——
——
——
——
——
0.00
8—
——
——
158
0.00
7—
0.00
30.
082
—0.
013
0.02
50.
007
0.00
3—
0.00
5—
——
——
162
——
0.01
2—
——
——
——
——
——
——
166
——
0.00
60.
003
—0.
011
—0.
014
——
—0.
007
0.00
80.
003
——
170
——
—0.
019
0.02
90.
021
0.02
50.
038
—0.
004
——
——
0.01
0—
174
——
0.01
70.
045
0.01
70.
017
0.03
50.
028
0.01
10.
015
—0.
007
0.00
30.
003
0.01
0—
178
——
——
—0.
006
0.00
5—
0.02
0—
0.00
30.
003
0.01
00.
015
—0.
023
182
0.01
40.
019
——
—0.
006
0.00
5—
0.00
60.
004
0.00
50.
010
0.01
30.
003
—0.
005
186
—0.
010
0.00
90.
021
—0.
004
—0.
003
0.03
40.
004
—0.
048
0.04
0—
0.01
0—
190
——
0.01
70.
008
0.00
4—
——
0.00
20.
007
0.01
30.
014
0.05
10.
020
0.01
00.
005
194
0.01
40.
144
0.01
50.
008
0.01
20.
011
—0.
035
0.00
5—
0.01
30.
034
0.03
30.
010
0.02
00.
009
198
0.02
10.
058
—0.
005
0.00
4—
——
0.03
70.
022
0.01
30.
041
0.02
50.
018
0.02
9—
202
0.01
40.
010
0.06
10.
037
0.00
40.
011
0.00
5—
0.00
60.
019
0.00
50.
014
—0.
003
0.06
90.
018
206
0.03
50.
019
0.03
20.
011
0.00
40.
019
0.00
50.
035
—0.
015
0.02
40.
014
0.01
30.
003
0.01
00.
014
210
0.02
80.
010
0.00
90.
003
0.02
50.
032
0.03
50.
035
0.00
60.
022
0.02
10.
017
0.02
50.
005
0.03
90.
037
214
0.05
60.
058
0.02
30.
013
0.09
90.
083
0.05
60.
038
0.01
70.
085
0.03
70.
024
0.02
00.
063
0.05
90.
060
218
0.01
4—
0.03
20.
143
0.02
90.
008
0.03
00.
070
0.10
20.
030
0.00
80.
024
0.01
00.
020
0.02
90.
046
Con
tinue
d on
nex
t pag
e.
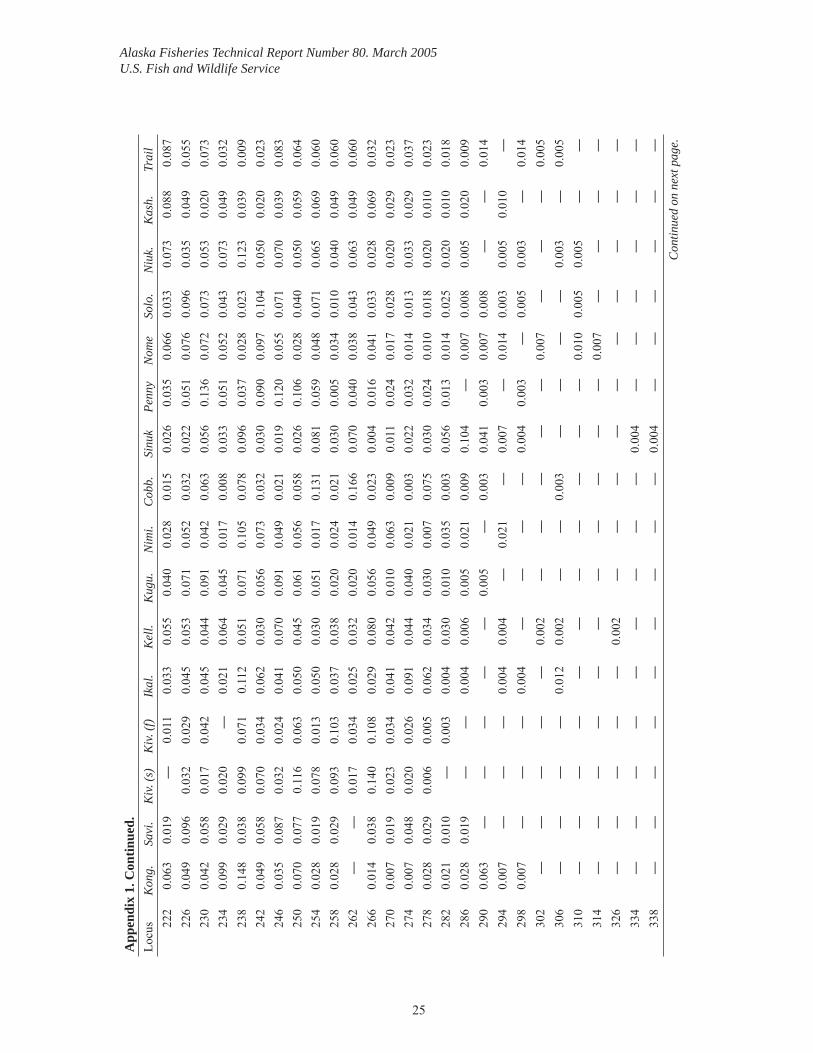
25
Alaska Fisheries Technical Report Number 80. March 2005U.S. Fish and Wildlife Service
App
endi
x 1.
Con
tinue
d.Lo
cus
Kon
g.Sa
vi.
Kiv.
(s)
Kiv.
(f)
Ikal
.K
ell.
Kug
u.N
imi.
Cob
b.Si
nuk
Penn
yN
ome
Solo
.N
iuk.
Kas
h.Tr
ail
222
0.06
30.
019
—0.
011
0.03
30.
055
0.04
00.
028
0.01
50.
026
0.03
50.
066
0.03
30.
073
0.08
80.
087
226
0.04
90.
096
0.03
20.
029
0.04
50.
053
0.07
10.
052
0.03
20.
022
0.05
10.
076
0.09
60.
035
0.04
90.
055
230
0.04
20.
058
0.01
70.
042
0.04
50.
044
0.09
10.
042
0.06
30.
056
0.13
60.
072
0.07
30.
053
0.02
00.
073
234
0.09
90.
029
0.02
0—
0.02
10.
064
0.04
50.
017
0.00
80.
033
0.05
10.
052
0.04
30.
073
0.04
90.
032
238
0.14
80.
038
0.09
90.
071
0.11
20.
051
0.07
10.
105
0.07
80.
096
0.03
70.
028
0.02
30.
123
0.03
90.
009
242
0.04
90.
058
0.07
00.
034
0.06
20.
030
0.05
60.
073
0.03
20.
030
0.09
00.
097
0.10
40.
050
0.02
00.
023
246
0.03
50.
087
0.03
20.
024
0.04
10.
070
0.09
10.
049
0.02
10.
019
0.12
00.
055
0.07
10.
070
0.03
90.
083
250
0.07
00.
077
0.11
60.
063
0.05
00.
045
0.06
10.
056
0.05
80.
026
0.10
60.
028
0.04
00.
050
0.05
90.
064
254
0.02
80.
019
0.07
80.
013
0.05
00.
030
0.05
10.
017
0.13
10.
081
0.05
90.
048
0.07
10.
065
0.06
90.
060
258
0.02
80.
029
0.09
30.
103
0.03
70.
038
0.02
00.
024
0.02
10.
030
0.00
50.
034
0.01
00.
040
0.04
90.
060
262
——
0.01
70.
034
0.02
50.
032
0.02
00.
014
0.16
60.
070
0.04
00.
038
0.04
30.
063
0.04
90.
060
266
0.01
40.
038
0.14
00.
108
0.02
90.
080
0.05
60.
049
0.02
30.
004
0.01
60.
041
0.03
30.
028
0.06
90.
032
270
0.00
70.
019
0.02
30.
034
0.04
10.
042
0.01
00.
063
0.00
90.
011
0.02
40.
017
0.02
80.
020
0.02
90.
023
274
0.00
70.
048
0.02
00.
026
0.09
10.
044
0.04
00.
021
0.00
30.
022
0.03
20.
014
0.01
30.
033
0.02
90.
037
278
0.02
80.
029
0.00
60.
005
0.06
20.
034
0.03
00.
007
0.07
50.
030
0.02
40.
010
0.01
80.
020
0.01
00.
023
282
0.02
10.
010
—0.
003
0.00
40.
030
0.01
00.
035
0.00
30.
056
0.01
30.
014
0.02
50.
020
0.01
00.
018
286
0.02
80.
019
——
0.00
40.
006
0.00
50.
021
0.00
90.
104
—0.
007
0.00
80.
005
0.02
00.
009
290
0.06
3—
——
——
0.00
5—
0.00
30.
041
0.00
30.
007
0.00
8—
—0.
014
294
0.00
7—
——
0.00
40.
004
—0.
021
—0.
007
—0.
014
0.00
30.
005
0.01
0—
298
0.00
7—
——
0.00
4—
——
—0.
004
0.00
3—
0.00
50.
003
—0.
014
302
——
——
—0.
002
——
——
—0.
007
——
—0.
005
306
——
——
0.01
20.
002
——
0.00
3—
——
—0.
003
—0.
005
310
——
——
——
——
——
—0.
010
0.00
50.
005
——
314
——
——
——
——
——
—0.
007
——
——
326
——
——
—0.
002
——
——
——
——
——
334
——
——
——
——
—0.
004
——
——
——
338
——
——
——
——
—0.
004
——
——
——
Con
tinue
d on
nex
t pag
e.
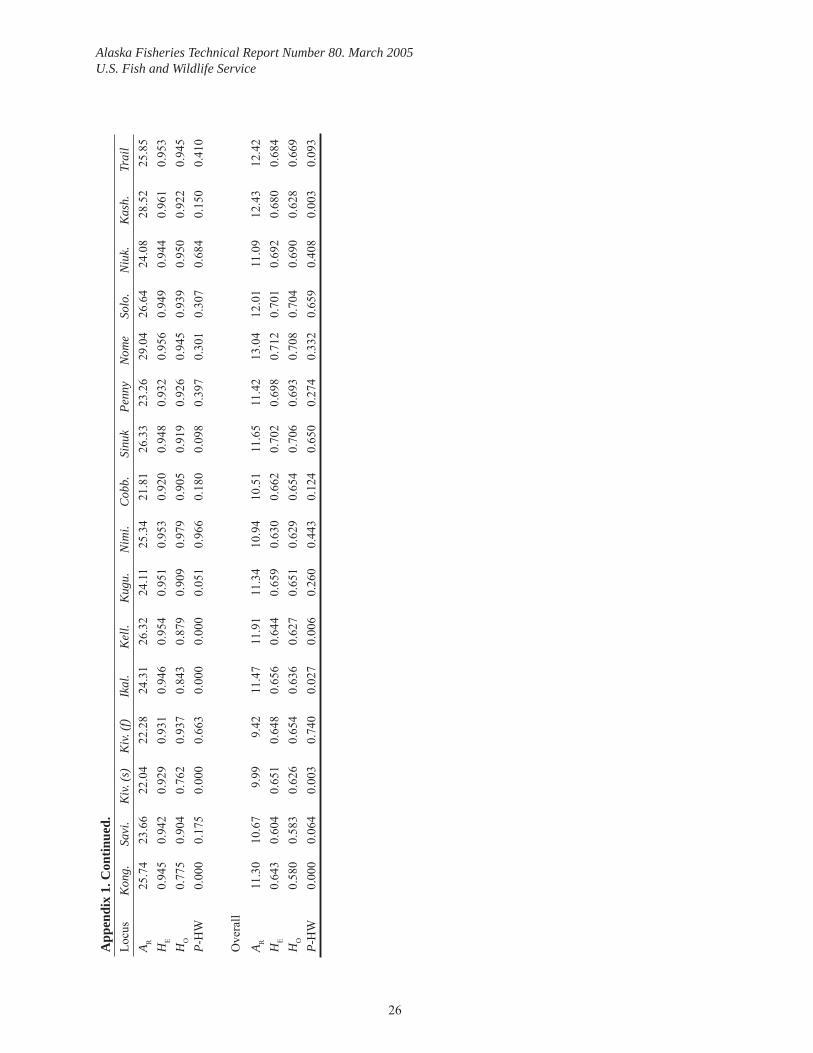
26
Alaska Fisheries Technical Report Number 80. March 2005U.S. Fish and Wildlife Service
App
endi
x 1.
Con
tinue
d.Lo
cus
Kon
g.Sa
vi.
Kiv.
(s)
Kiv.
(f)
Ikal
.K
ell.
Kug
u.N
imi.
Cob
b.Si
nuk
Penn
yN
ome
Solo
.N
iuk.
Kas
h.Tr
ail
A R25
.74
23.6
622
.04
22.2
824
.31
26.3
224
.11
25.3
421
.81
26.3
323
.26
29.0
426
.64
24.0
828
.52
25.8
5H
E0.
945
0.94
20.
929
0.93
10.
946
0.95
40.
951
0.95
30.
920
0.94
80.
932
0.95
60.
949
0.94
40.
961
0.95
3H
O0.
775
0.90
40.
762
0.93
70.
843
0.87
90.
909
0.97
90.
905
0.91
90.
926
0.94
50.
939
0.95
00.
922
0.94
5P-
HW
0.00
00.
175
0.00
00.
663
0.00
00.
000
0.05
10.
966
0.18
00.
098
0.39
70.
301
0.30
70.
684
0.15
00.
410
Ove
rall
A R11
.30
10.6
79.
999.
4211
.47
11.9
111
.34
10.9
410
.51
11.6
511
.42
13.0
412
.01
11.0
912
.43
12.4
2H
E0.
643
0.60
40.
651
0.64
80.
656
0.64
40.
659
0.63
00.
662
0.70
20.
698
0.71
20.
701
0.69
20.
680
0.68
4H
O0.
580
0.58
30.
626
0.65
40.
636
0.62
70.
651
0.62
90.
654
0.70
60.
693
0.70
80.
704
0.69
00.
628
0.66
9P-
HW
0.00
00.
064
0.00
30.
740
0.02
70.
006
0.26
00.
443
0.12
40.
650
0.27
40.
332
0.65
90.
408
0.00
30.
093