genetic influences on pubertal development and links to
TRANSCRIPT
Genetic Influences on Pubertal Development and Links to Behavior Problems
Robin P. Corley1, Adriene M. Beltz2, Sally J. Wadsworth1, and Sheri A. Berenbaum3
Robin P. Corley: [email protected] for Behavioral Genetics, University of Colorado, Boulder, Campus Box 447, Boulder, CO 80309-0447, USA
2Departments of Psychology and Human Development and Family Studies, The Pennsylvania State University, University Park, State College, PA 16802, USA
3Departments of Psychology and Pediatrics, The Pennsylvania State University, University Park, State College, PA 16802, USA
Abstract
Genetic influences on adolescent psychological development are likely to be mediated and
moderated by pubertal hormones. Combining genetic analyses with advanced models of pubertal
development, we extended work on the measurement and psychological significance of puberty.
We examined how genetic and environmental influences on puberty vary by the way that
development is described (logistic versus linear models versus traditional methods) and the
different aspects of puberty (adrenarche vs. gonadarche), and how genes and environment
contribute to the covariation between different descriptions and aspects of puberty, and between
pubertal development and behavior problems (substance use, age at sexual initiation). We also
considered how puberty moderated the heritability of psychological outcomes (internalizing and
externalizing problems), and sex differences. Participants from the Colorado Longitudinal Twin
Study (403 girls, 395 boys) reported their pubertal development annually from ages 9 through 15;
they and their parents reported their behavior in mid-to-late adolescence. There was a large genetic
contribution to pubertal timing for both sexes no matter how it was measured, but findings for
pubertal tempo varied by method. Genetic covariation accounted for most of the phenotypic
correlations among different indicators of pubertal timing, and between pubertal timing and
psychological outcome. We consider the implications of our results for understanding how
pubertal hormones mediate or moderate genetic and environmental influences on psychological
development.
Correspondence to: Robin P. Corley, [email protected].
Electronic supplementary material The online version of this article (doi:10.1007/s10519-015-9719-5) contains supplementary material, which is available to authorized users.
Conflict of Interest Robin Corley, Adriene Beltz, Sally Wadsworth, and Sheri Berenbaum declare that they have no conflict of interest.
Human and Animal Rights and Informed Consent All procedures followed were in accordance with the ethical standards of the responsible committee on human experimentation (institutional and national) and with the Helsinki Declaration of 1975, as revised in 2000. Assent was obtained from all youth under age 18, informed consent was obtained from participants aged 18 and older, and informed consent was obtained from parents for participants to be included in the study.
HHS Public AccessAuthor manuscriptBehav Genet. Author manuscript; available in PMC 2016 July 27.
Published in final edited form as:Behav Genet. 2015 May ; 45(3): 294–312. doi:10.1007/s10519-015-9719-5.
Author M
anuscriptA
uthor Manuscript
Author M
anuscriptA
uthor Manuscript
Keywords
Pubertal timing; Pubertal tempo; Gonadarche; Adrenarche; Behavior problems
Introduction
Psychological development in adolescence is a prime example of the importance of gene-
hormone interplay.1 Pubertal hormones play a significant role in psychological change in
adolescence: Extreme variations in the onset (timing) of pubertal development are linked to
risks for depression and externalizing behavior problems (for reviews, see Ge and Natsuaki
2009; Graber 2013; Negriff and Susman 2011); attainment of midpubertal status appears to
increase normative changes in risky behavior and to trigger psychopathology in vulnerable
individuals (e.g., Gunnar et al. 2009; Trotman et al. 2013). These changes are hypothesized
to reflect effects of social responses to youths’ changing bodies, and sex hormones and
social experiences acting on the developing brain and stress systems.
The physical changes of puberty reflect an integration of processes influenced by hormones
(Styne and Grumbach 2011). Hormone levels (measured in saliva or blood) provide an
incomplete picture; they reflect genetic variation and environmental exposures as well as
pubertal maturation. The psychological and physiological effects of hormones are not simply
related to circulating levels, but also depend on tissue sensitivity and hormone modulators
(genetic, physiological, and environmental). Thus, the role of gene-hormone interplay in
adolescent psychological development may profitably be studied by examining genetic
influences on the physical changes of puberty and their links to behavior at that time.
It is clear that pubertal development itself is influenced by both genes and the environment.
The KISS1 gene and its GPR54 receptor appear to play a role in the normal initiation of
puberty (Navarro et al. 2007). Variations in the timing of pubertal onset are highly heritable
(Eaves et al. 2004; Mustanski et al. 2004; van den Berg et al. 2006), although pubertal
timing may be altered by environmental factors, both physical (such as endocrine-disrupting
chemicals, Lee and Styne 2013) and social (such as father absence, Belsky et al. 1991;
Webster et al. 2014).
Behavior genetic studies have begun to identify how genes and environment transact with
pubertal hormones to produce psychological changes in adolescence. Such studies have
shown that (a) puberty affects expression of genes involved in some behavior problems, such
as disordered eating (Culbert et al. 2009; Klump et al. 2007); (b) early puberty increases risk
for behavior problems through a variety of mechanisms, including shared environmental
influences on the association between internalizing problems and early puberty in girls
(Marceau et al. 2012), genetic and environmental influences on the link between dieting and
early puberty in girls (with the source of variation depending on the index of puberty,
1Our paper is intended for readers interested in behavior genetics or adolescent development who might not be familiar with concepts in the other field. Therefore, we clarify concepts that might otherwise be familiar to some readers. For example, we include discussion of aspects of pubertal development that will be familiar to those who study puberty but not necessarily to those who are behavior geneticists, and we provide details about our modeling results for readers who do not have much experience with interpreting behavior genetic analyses but will be unnecessary for typical readers of the journal.
Corley et al. Page 2
Behav Genet. Author manuscript; available in PMC 2016 July 27.
Author M
anuscriptA
uthor Manuscript
Author M
anuscriptA
uthor Manuscript
Harden et al. 2012), and gene-environment interactions accounting for the association
between early puberty and delinquency in girls (Harden and Mendle 2012); (c) causes of
behavior problems may depend on pubertal development; for example, risk for conduct
disorder is mediated by environmental mechanisms for early maturers, but by genetic
mechanisms for youth who develop on time (Burt et al. 2006).
But, many behavior genetic studies of puberty and behavior—and, indeed, many
developmental studies in general—have not included clear conceptualization or
measurement of puberty, or have conflated different aspects of puberty (Dorn and Biro 2010;
Dorn et al. 2006; Mendle 2014). Puberty is not a single process but includes adrenarche
(maturation of the adrenal glands), gonadarche (development of the hypothalamic–pituitary–
gonadal axis), and growth. The three systems do not develop together, and show a different
pattern of sex differences: adrenarche occurs earlier than gonadarche, with adrenarche
occurring close to the same age in both sexes, but gonadarche occurring earlier in girls than
in boys. The hormones involved have differential effects on physical development; for
example, body hair is influenced by adrenal hormones in both sexes, testes and voice
changes by testosterone in boys, breast development and menarche by estrogens in girls, and
height by sex steroids and growth hormone (reviewed in Styne and Grumbach 2011).
These multiple processes are rarely considered in psychological studies. Instead, most
studies include a total summary score of pubertal development (typically measured by a self-
report questionnaire) or age at menarche in girls (a traditional measure often used to index a
girl’s current pubertal development or the timing of her development in relation to others;
see distinction below). But summary scores lose information about pubertal features that
develop on different timetables (Tanner 1978), are differentially apparent to others (so have
differential social signaling), and may have different psychological significance for the
youth him/herself. For girls, breast development is typically the first sign of puberty and
visible to others, whereas menarche occurs late in puberty and can be concealed; it is unclear
which event has the most significance for the girl herself. For boys, testicular enlargement is
typically the first sign of puberty and is generally not apparent to others, whereas the height
spurt (visible to others) does not occur until midpuberty; again, it is unclear which event is
most important. The focus on summary scores has begun to change, with some studies
separating indices of adrenarche and gonadarche (e.g., Marceau et al. 2011), and calls to
consider synchrony of development (relation among different pubertal features; Mendle
2014). In a related vein, there have been renewed calls to differentiate objective and
subjective (youth self-perceived) indicators of pubertal development, and to consider their
different associations with behavior (Dorn et al. 2006; Harden et al. 2012; Mendle 2014).
Another issue that has complicated understanding of the psychological significance of
puberty is the confounding of two key aspects of development in children who are not yet
mature: pubertal timing, which reflects an individual’s development relative to peers, and
pubertal status, which reflects the current stage of an individual’s development. Timing has
significance during puberty; for example, girls who have started to develop earlier than their
peers are more likely to have problems because of involvement with older peers (usually
boys) (Caspi and Moffitt 1991; Ge et al. 1996). Timing also has long-term significance for
some aspects of psychological function; for example, adult women who were early maturers
Corley et al. Page 3
Behav Genet. Author manuscript; available in PMC 2016 July 27.
Author M
anuscriptA
uthor Manuscript
Author M
anuscriptA
uthor Manuscript
have higher rates of depression than women who matured on time (Copeland et al. 2010;
Graber et al. 2004). Pubertal status is thought to have psychological significance by marking
changing hormones and social roles. For example, the sex difference in depression that
emerges in adolescence has been interpreted to reflect gender intensification (Hill and Lynch
1983; Wichstrøm, 1999); pubertal onset (whenever it occurs) is hypothesized to trigger
diverging trajectories in boys and girls, because the onset of sexual maturity and anticipation
of adult roles leads to reactions from social agents and youth themselves that exaggerate
gender-stereotypical behavior.
Individuals who have completed puberty all have the same pubertal status (attained adult
development), but they differed in timing (relative to peers, some started early, some started
the same, and some started late). Individuals who are in the midst of puberty differ in both
timing and status; for example, a 10-year-old White girl who has moderate breast
development is both midpubertal and an early maturer, whereas a similar age girl who has
not started development is prepubertal and may mature on time or late (her timing cannot be
known until she starts development). This means that a typical study of youth will
necessarily confound pubertal timing and status for at least some of the sample, and fail to
obtain useful information on others.
Finally, pubertal variations extend beyond current pubertal status and timing of pubertal
onset (both of which may vary by feature) to include tempo of development (the rate at
which youth proceed through the stages of puberty). Tempo has not been well-studied, in
part because of the difficulty measuring it (see below). There is some suggestion that fast-
maturing boys are at greatest risk for adjustment problems (Mendle et al. 2010), but findings
are not consistent (e.g., Marceau et al. 2011), and significant questions remain concerning
sex differences in tempo and the ways that tempo is linked to timing and to behavior (Beltz
et al. 2014; Mendle 2014).
Recent advances in methods for describing puberty have helped to clarify in several ways
what is measured, and the different processes captured by different indices. The work has
also raised questions that can profitably be studied from a behavior genetic perspective.
Thus, longitudinal data on puberty (measured by physical exam or self report) have been
used to model trajectories of development using both a simple linear model and a logistic
model (discussed in Beltz et al. 2014). A linear model represents constant development, and
a logistic model represents S-shaped development that is symmetric at midpuberty. A
logistic model fits better than a linear one (Beltz et al. 2014; Marceau et al. 2011), but
estimates of timing derived from linear and logistic models correlate highly with each other
and similarly with psychological outcome assessed a few years later (Beltz et al. 2014). A
behavior genetic approach can address questions about the value of the different methods, by
identifying sources of variation in the different measures, and in the covariations among
them and with behavior.
Statistical modeling has the benefit of providing a direct estimate of tempo. Such estimates
have enabled researchers to ask about the psychological significance of tempo as well as
timing (Castellanos-Ryan et al. 2013; Marceau et al. 2011; Mendle et al. 2010). But tempo is
conceptualized and estimated differently in linear and logistic models: A linear model
Corley et al. Page 4
Behav Genet. Author manuscript; available in PMC 2016 July 27.
Author M
anuscriptA
uthor Manuscript
Author M
anuscriptA
uthor Manuscript
represents uniform development across time, with tempo estimated as rate of change per
year (in PDS or Tanner stages); a logistic model represents non-uniform development,
starting slowly, increasing to maximum growth at the midpoint, and then decreasing in rate,
with tempo estimated as instantaneous change at midpuberty, representing the maximum
speed of development. Further, both linear and logistic estimates of tempo differ from
traditional pediatric measures, which reflect the interval between two stages of puberty
(usually time from the onset of breast development to menarche). Not surprisingly, linear,
logistic, and traditional estimates of tempo do not correlate highly with each other, and are
differently related to corresponding estimates of timing, and to psychological outcome; this
is seen when studies using different methods are compared (Castellanos-Ryan et al. 2013;
Marceau et al. 2011; Mendle et al. 2010), and when different methods are used with the
same sample in a single study (Beltz et al. 2014). A behavior genetic approach can address
questions about tempo, by identifying sources of variation in the different estimates, in the
co-variation among them, and in the links between tempo and timing, and tempo and
behavior.
Statistical modeling has also drawn renewed attention to the multiple processes of puberty,
particularly the relative importance of adrenal versus gonadal hormones; this work has been
facilitated by procedures for using ratings of physical features to measure separately
adrenarche and gonadarche (Shirtcliff et al. 2009). But, data using physical features to
estimate timing of adrenarche and gonadarche are at odds with endocrine data: physical
features produce estimates of adrenarche occurring later than gonadarche (Beltz et al. 2014;
Marceau et al. 2011; Paus et al. 2010; Shirtcliff et al. 2009), but adrenal hormones rise
earlier than gonadal hormones (reviewed in Styne and Grumbach 2011). This suggests that
physical features alone are insufficient to separate adrenarche from gonadarche, perhaps
because adrenal hormone levels are insufficient to produce physical changes until
gonadarche (Dorn et al. 2006; Wan et al. 2012). A behavior genetic approach can address
questions about the link between adrenarche and gonadarche as measured by physical
features, by identifying sources of variation in each and in the covariation among them, and
with behavior.
Throughout all the work on puberty, there has been recognition of the importance of sex
differences. Girls achieve gonadarche earlier than boys, but there is little sex difference in
timing of adrenarche. Pubertal timing has different consequences for the two sexes: early-
maturing girls but both early- and late-maturing boys show increased depression or
adjustment problems compared to on-time peers (Graber 2013; Mendle and Ferrero 2012).
There is limited and inconsistent evidence regarding sex differences in pubertal tempo (e.g.,
Beltz et al. 2014; Marceau et al. 2011). Typical development is also likely influenced by
different pubertal processes in the sexes. For example, risk taking is likely to be influenced
by hormones that are higher in boys than in girls (e.g., testosterone) (Paus et al. 2010),
whereas disordered eating and depression appear to depend on hormones that are higher in
girls than boys (e.g., estradiol) (Angold et al. 1998; Klump et al. 2010); this means that
midpubertal status should be associated with increased risk taking in boys and increased
disordered eating and depression in girls. The lack of a simple measure of pubertal
development in boys analogous to menarche in girls means that boys are studied less often
than are girls. A behavior genetic approach combined with advanced modeling of pubertal
Corley et al. Page 5
Behav Genet. Author manuscript; available in PMC 2016 July 27.
Author M
anuscriptA
uthor Manuscript
Author M
anuscriptA
uthor Manuscript
data can address questions about sex differences in influences on pubertal development and
links to behavior.
We applied genetic analyses to longitudinal self-report data on pubertal development to
answer questions about the nature and significance of pubertal development. We considered
(a) how genetic and environmental influences on puberty vary by the way that development
is described (logistic vs. linear models versus traditional method) and by aspects of puberty
(adrenarche vs. gonadarche), (b) how genes and environment contribute to the covariation
between different pubertal indicators, and between pubertal development and behavior
problems, (c) how puberty moderates the heritability of behavior problems, and (d) how the
answers to all three sets of questions vary by sex. These questions are central to
understanding the interplay of genes and sex hormones on adolescent psychological
development. Secondary sex characteristics reflect an integration of hormonal processes,
whereas direct hormone assays have limitations (see “Discussion” section).
Method
This study is an extension of work on modeling timing and tempo of pubertal development,
and their links to behavior (Beltz et al. 2014). We focus here on genetic analyses to further
address questions about the measurement and meaning of pubertal development.
Participants
Participants were members of the Colorado Longitudinal Twin Study (LTS), a project
examining genetic and environmental contributors to variations in cognition, personality, and
behavior problems (Rhea et al. 2006). Of the original sample of 966 individuals from 483
twin pairs recruited around age 1 year, 84 % provided sufficient data to enable calculation of
trajectories of pubertal development (two assessments showing change); those who provided
sufficient pubertal data were similar to those who did not on the outcome measures of
interest. The current sample (total N = 808) included 222 monozygotic (MZ) and 181
dizygotic (DZ) girls, 199 MZ and 204 DZ boys, and 2 boys of unknown zygosity. Most
participants were White (92 %) and not Hispanic (91 %).
Participants (born between 1984 and 1990) were assessed on multiple occasions from
infancy through young adulthood; we focused on assessments of puberty throughout
adolescence and behavioral outcomes in mid-to-late adolescence (conducted between 1994
and 2008). Puberty was assessed annually from the end of grade 3 [average age (SD in
parentheses): 9.44 (.37) years, range 8.25–10.67) to the end of grade 9 (average age: 15.34 (.
31) years, range 14.25–16.17], with an in-person visit after grade 6, and telephone
interviews at other ages. We considered two types of behavioral outcomes: (a) behavior
measured during puberty to examine whether pubertal status moderated heritability of
behaviors that change in adolescence; this included measures of internalizing and
externalizing behavior problems; (b) behaviors measured later in adolescence to examine
longer-term effects of pubertal timing; this included measures of substance use and age at
sexual initiation assessed between ages 16 and 18. Other psychological and health data not
reported here were also collected during interviews. Parents provided informed consent for
Corley et al. Page 6
Behav Genet. Author manuscript; available in PMC 2016 July 27.
Author M
anuscriptA
uthor Manuscript
Author M
anuscriptA
uthor Manuscript
their child to participate in the study, and youth provided assent (under age 18) or informed
consent (age 18 and older) for their participation in the study.
Measures
Pubertal development—Puberty was assessed by self report on the Pubertal
Development Scale (PDS; Petersen et al. 1988). Each year, participants answered five
questions about the development of secondary sexual characteristics: body hair, skin
changes, and growth spurt in both sexes, facial hair and deepening voice in boys, and breast
development and menarche in girls. All items except menarche were rated on a 4-point
scale: 1 = “no development,” 2 = “yes, barely,” 3 = “yes, definitely,” 4 = “development
completed.” Menarche was rated as absent (1) or completed (4); age at menarche was
recorded for those who had reached it. Items were averaged to produce a summary PDS
score at each age. PDS scores correlate about .70 with pubertal stage rated by health
professionals (Schmitz et al. 2004; Shirtcliff et al. 2009), and from .20 to .60 with salivary
hormone levels, similar to correlations between those hormones and physical exam ratings
(Shirtcliff et al. 2009). The PDS is widely used and considered “most appropriate for broad
estimates of development, or for use in longitudinal studies” (Coleman and Coleman, 2002),
but still subject to debate (e.g., Dorn et al. 2006; Shirtcliff et al. 2009), a topic to which we
return in the Discussion.
Linear and logistic estimates of overall pubertal timing and tempo in both sexes—Pubertal timing and tempo were estimated from group trajectories of development,
calculated separately by sex from the longitudinal PDS data (average PDS score at each of
seven waves of assessment), allowing individual deviations (for details, see Beltz et al.
2014). Development was represented and estimated separately by linear and logistic models.
Pubertal timing was defined at the midpoint of puberty (PDS score of 2.5, corresponding to
Tanner stage 3) for both models. Neither model permits independent estimation of pubertal
onset (PDS 1.5) and midpuberty (PDS 2.5). Pubertal tempo was estimated as rate of change
per year for the linear model, and as peak rate of change at midpuberty for the logistic
model.
Trajectories were calculated previously, with participants from this LTS sample and from
another sample, the Colorado Adoption Project (CAP) (for details, see Beltz et al. 2014). All
analyses were performed with two separate replicates, with one member of a family in each;
results were consistent across replicates. Results for LTS participants alone paralleled those
reported for the full sample. Genetic analyses reported below are based only on the LTS
sample.
Logistic estimates of adrenarche and gonadarche timing and tempo in girls—In addition to trajectories for “total” pubertal development (average PDS score at each
age), separate trajectories were calculated for the processes of adrenarche and gonadarche,
providing estimates of timing and tempo for both aspects of puberty. These analyses were
restricted to logistic models, because a logistic model has been seen to fit both processes
better than a linear model (Marceau et al. 2011), and to girls who were more likely than boys
to have completed development over the course of assessment, and thus to show meaningful
Corley et al. Page 7
Behav Genet. Author manuscript; available in PMC 2016 July 27.
Author M
anuscriptA
uthor Manuscript
Author M
anuscriptA
uthor Manuscript
variability in both processes. Pubertal development is typically described in terms of Tanner
(1978) stages, so the procedures for separating gonadarche and adrenarche also involved
converting PDS scores into Tanner scores. Longitudinal PDS scores were converted into
Tanner scores for adrenarche and gonadarche using an algorithm developed by others in
another sample from PDS scores, circulating hormone levels, and Tanner staging from
physical exams (Shirtcliff et al. 2009); adrenarche was estimated from PDS ratings of skin
changes and body hair, and gonadarche from PDS ratings of menarche, breast development,
and growth spurt.
Procedures for modeling trajectories of adrenarche and gonadarche development using
Tanner scores paralleled those outlined for modeling development using PDS scores (Beltz
et al. 2014). Briefly, a logistic growth curve model is represented as:
where β0 is 1 (lower bound for Tanner scores); β1 is 5 (upper bound for Tanner scores); e is
the exponential function; λi is the age at midpuberty (Tanner 3); αi is the slope of the
function at the midpubertal age; rit is the normally-distributed residual for an individual i at
assessment t. Longitudinal Tanner scores were entered into logistic models to calculate
group trajectories of development and individual deviations from the group, that is, person-
specific estimates of pubertal timing (λi) and tempo (αi).
Models were compared using the Akaike Information Criterion (AIC). The models for
gonadarche (AICs of 5178 and 5070 for replicates 1 and 2, respectively) fit better than those
for adrenarche (AICs of 5278 and 5141, respectively). Group mean trajectories are displayed
in Fig. 1. Note that (a) results for replicates 1 (black lines) and 2 (gray lines) were nearly
identical, (b) mean age at Tanner 3 (midpoint of the curve) was greater for adrenarche
(dashed lines) than gonadarche (solid lines), and (c) mean tempo (slope of the curve at
Tanner 3) was greater for gonadarche than adrenarche.
Linear and logistic estimates of pubertal status in both sexes—Pubertal status
was estimated at each age as prepubertal or pubertal based on the logistic pubertal timing
parameter (given previous results cited above that a logistic model describes development
better than a linear model). For example, a child whose pubertal timing (age at midpuberty)
was estimated to be 13.2 years would be prepubertal at all assessments before age 13.2, and
pubertal at all subsequent assessments.
Traditional measures of pubertal development in girls—Pubertal timing was
measured by age at menarche (assessed close in time to the event). Pubertal tempo was
measured by the difference between age at pubertal onset (PDS 1.5 estimated from linear
models) and menarche. Note that tempo is conceptualized and represented differently by the
models versus the traditional approach: model parameters reflect rate of change, whereas the
traditional measure reflects time between pubertal events, making the measures inversely
related. Pubertal status was measured by whether the girl had achieved menarche.
Corley et al. Page 8
Behav Genet. Author manuscript; available in PMC 2016 July 27.
Author M
anuscriptA
uthor Manuscript
Author M
anuscriptA
uthor Manuscript
Behavior problems—The Child Behavior Checklist (CBCL; Achenbach 1991) was
used to obtain parent reports of child behavior problems at all ages. We focused on
unstandardized scores for higher-order scales of internalizing and externalizing problems;
these are reliable and have been shown to relate to a variety of clinical conditions. We
considered whether pubertal status moderated the heritability of these behavior problems,
indexing pubertal status by menarche in girls and by estimates from logistic trajectory
analyses in both sexes. We used CBCL assessments at age 13 in girls and age 15 in boys
because these ages show the most variability in pubertal status and are close to the average
ages of midpuberty in this sample (with boys later than girls), and thus are the best ages for
examining the question.
Substance use—The Composite International Diagnostic Interview-Substance Abuse
Module (CIDI-SAM; Cottler and Keating 1990) was used at ages 16–18 to assess
participants’ involvement with substances, including alcohol, cannabis, amphetamines,
opiates, cocaine, sedatives, inhalants, PCP, and hallucinogens. Participants retrospectively
recalled whether they had any of seven dependence symptoms for each substance.
Psychometric properties are good, with discriminative and convergent validity (Crowley et
al. 2001). We used the average lifetime number of symptoms experienced through
adolescence across all substances, corrected for age at assessment (Button et al. 2010;
Stallings et al. 2003). This measure was related to pubertal timing in the combined LTS/CAP
sample (Beltz et al. 2014).
Age at sexual initiation—At age 17, all participants provided information on the age
of their first sexual experience if it had occurred (Bricker et al. 2006). Participants were first
asked “Have you ever had sex (‘gone all the way’) with someone?” If they indicated they
had, they were asked “How old were you the first time you had sex?” Repeated assessment
of a sub-sample of participants in CAP showed very high test–retest reliability for reported
age at first sexual experience (Bricker et al. 2006). Some participants had not yet had sex by
this assessment, and the primary value of this measure is to capture early sexual activity, so
we used a categorical measure to maximize the number of participants with data. The
categorical score was based on actual age for participants who reported this information
(<age 15, age 15 or 16) or the last age of assessment for those who did not (≥age 17). This
measure was related to pubertal timing in the combined LTS/CAP sample (Beltz et al. 2014).
Data analyses
We applied traditional behavior genetic analyses to address our questions (footnote 1). First,
we conducted univariate genetic analyses to examine genetic (additive, A, and nonadditive,
e.g., dominance, D) and environmental (common, C, and nonshared, E) sources of variation
in pubertal timing and tempo, using estimates from linear and logistic modeling of the
average PDS score at each age for both sexes, the traditional methods in girls, and logistic
estimates of adrenarche and gonadarche in girls. Second, we conducted bivariate genetic
analyses to examine sources of covariation between different estimates of the same aspect of
puberty (e.g., linear and logistic timing) and between timing and tempo estimated from the
same method. Third, we conducted bivariate genetic analyses to examine sources of
covariation between pubertal timing and behavior; we focused on the logistic measure of
Corley et al. Page 9
Behav Genet. Author manuscript; available in PMC 2016 July 27.
Author M
anuscriptA
uthor Manuscript
Author M
anuscriptA
uthor Manuscript
timing given that the logistic model best fit the data, and two behaviors that showed the
strongest correlations with pubertal timing in the sample, substance use and age at sexual
initiation (Beltz et al. 2014). We did not conduct genetic analyses of links between pubertal
tempo and behavior because of difficulties in interpreting logistic tempo (see below and
Beltz et al. 2014) and the high correlations between linear timing and tempo (Beltz et al.
2014). Finally, we examined how puberty moderated the heritability of Internalizing and
Externalizing Behavior Problems at age 13 for girls and age 15 for boys, defining pubertal
status by estimates from logistic trajectory analyses in both sexes and by menarche in girls.
Genetic models—Univariate and bivariate models were tested in classic Mx (version
1.63 for Linux, Neale et al. 2002) with four groups: MZ and DZ male and female pairs.
Mean sex differences were estimated, and tests for equality of means and variances across
twins and groups were conducted prior to genetic modeling. We considered submodels to
determine which parameters could be dropped. Alternate acceptable models were compared
using the AIC to arrive at a final model, from which parameter estimates and confidence
intervals were derived.
We examined sex differences by determining whether the acceptable and most parsimonious
models were the same for the two sexes and whether the standardized model parameters
(e.g., genetic and environmental correlations) had overlapping confidence intervals. We also
conducted a more stringent test for sex differences: equating the A, C/D, and E covariance
matrices across sex. If differences are trivial, moderation by sex can be ignored. Note that
testing sex differences is complex because of sex differences in pubertal development.
Missing data—Calculation of trajectories of pubertal development required that a
participant have at least two different PDS scores; as noted above, 84 % of the original
sample met this criterion. Approximately 20 % of girls did not have data on traditional
measures, primarily because they had not yet reached menarche. (For additional information,
see Beltz et al. 2014) The maximum-likelihood (ML) approach used in Mx with raw data
provides unbiased estimates of parameters when the usual assumptions of ML are met and
data are either missing at random conditional on an observed variable (e.g., cotwin scores or
other nonmissing variables), or completely at random (Little and Rubin, 1987). This
approach is thus superior to estimation procedures which require complete twin pairs and
complete data for individuals.
Results
Pubertal development: phenotypic correlations
For completeness, we present (Table 1) the phenotypic correlations among the measures of
pubertal development. They confirm that the pattern of results seen in the combined LTS and
CAP sample (Beltz et al. 2014) was apparent in the LTS sample alone, and help to frame the
genetic analyses. Measures of pubertal timing were highly correlated with each other,
measures of pubertal tempo were generally not strongly associated with each other, and
within-method links between timing and tempo varied across methods.
Corley et al. Page 10
Behav Genet. Author manuscript; available in PMC 2016 July 27.
Author M
anuscriptA
uthor Manuscript
Author M
anuscriptA
uthor Manuscript
Pubertal timing and tempo: univariate genetic analyses
We conducted univariate genetic analyses of the linear and logistic estimates of timing and
tempo for both sexes. For girls, we also examined the traditional measures of timing and
tempo, and separate logistic estimates of timing and tempo for adrenarche and gonadarche.
The results of univariate analyses for pubertal timing and tempo are shown in Tables 2 and 3,
respectively; each table includes MZ and DZ twin correlations, a baseline model that
describes the pattern of twin correlation differences, a reduced model with the statistics that
support model simplification, and the standardized estimates for sources of variation under
this best-fitting model. The model-fit statistics for alternative reduced models are shown in
supplementary Table S.1. Results are shown separately for girls and boys, and for a direct
sex comparison.
Results were consistent across the different measures of pubertal timing (as shown in Table
2), but not across the measures of pubertal tempo (as shown in Table 3), as indicated by the
best-fitting (most parsimonious) models. Variations in pubertal timing (Table 2) were largely
attributable to genes in both sexes, no matter how timing was measured, as shown by the
standardized estimates for additive genetic variance (A). This was the case for both linear
and logistic estimates based on the total PDS score, and for the logistic estimates for
adrenarche and gonadarche, although there was more nonshared environmental influence (E)
on adrenarche than on gonadarche, as shown (in the last two columns in panel 2A) by the
non-overlapping 95 % confidence intervals (CIs) for E. Note that the standardized variance
estimates in the reduced models sum to 100 % (i.e., in AE models, variance not attributed to
genes is attributed to nonshared environment), while the 95 % CIs indicate how precisely
each source of variance is estimated within this sample.
Sex comparisons for univariate genetic analyses of pubertal timing and tempo
We compared models for boys and girls, although the PDS trajectories are not derived from
exactly the same indicators, and there are no opposite-sex twin pairs to test sex-limitation
models. Sex differences were tested by determining whether: (a) a single, common reduced
model adequately fits the data for both sexes (although the best-fitting model for each sex
separately might differ from each other and from the common model, as shown in panel A
for girls and in panel B for boys); (b) the standardized estimates for parameters have
overlapping CIs; and (c) the unstandardized variance components can be equated.
Sex comparisons for univariate models of pubertal timing (estimated for PDS total scores
using linear and logistic trajectories) are shown in panel 2C. For both linear and logistic
estimates, a common model is acceptable for both boys and girls, and the standardized
variance estimates have overlapping CIs. But, generally the raw variance components cannot
be equated. In sum, results shown in Table 2 indicate that pubertal timing in both sexes,
regardless of how it is measured, is consistently and primarily attributable to additive genetic
effects.
Variations in pubertal tempo (Table 3), however, were attributable to different sources in
boys and girls, and across methods of measurement. There were sex differences in the
preferred reduced models. Different models were also preferred for the different estimates of
Corley et al. Page 11
Behav Genet. Author manuscript; available in PMC 2016 July 27.
Author M
anuscriptA
uthor Manuscript
Author M
anuscriptA
uthor Manuscript
tempo; for example, among girls, genetic influences predominated for the linear estimate of
tempo, but common environmental influences (C) predominated for the logistic estimate of
tempo. The logistic estimate of tempo in girls is notable for showing no genetic influence,
although there were genetic influences on logistic estimates of tempo measures for
adrenarche and gonadarche; the discrepancy appears to reflect differing DZ correlations for
logistic estimates based on total PDS scores versus subscores of adrenarche and gonadarche.
Among both girls (panel 3A) and boys (panel 3B), nonshared environment, which includes
measurement error, appears to play a larger role in the logistic estimate of tempo than in the
linear estimate; this is seen in non-overlapping CIs. With respect to direct sex comparisons
(panel 3C), the best-fitting model common to pubertal tempo in both girls and boys differs
for the linear and logistic parameters. There are not simple correspondences between the
best-fitting common models and those for each sex separately. This is likely due to sources
of variation in the logistic estimates of tempo in girls, i.e., large shared environmental
influence on the total PDS score (due to high DZ correlations), but large genetic influences
on other measures. For the linear tempo measures, CIs overlap, although complete equality
is not achievable. In contrast, for the logistic tempo measures, the CIs for parameters in girls
and boys do not overlap, with a much higher estimate of the effect of the shared environment
in girls. In sum, results shown in Table 3 indicate that, in contrast with timing, no single
parsimonious model can adequately describe influences on tempo across both sexes and
alternative measures.
Covariations among pubertal indicators: bivariate genetic analyses
We next conducted bivariate genetic analyses to understand phenotypic correlations between
descriptors of pubertal development. This included examining sources of phenotypic
correlations across methods in estimates of timing (Table 4) and of tempo (Table S.3), and
within method in estimates of timing and tempo (Table S.4) in both sexes; and of the
correlations between adrenarche and gonadarche in girls. For all bivariate analyses, we show
a baseline model, a best-fitting reduced model, the phenotypic correlation between measures
from the baseline model, estimates for genetic (rA or rD), shared environmental (rC), and
nonshared environmental (rE) correlations between measures based on the reduced model,
and the proportion of the covariance between measures that can be attributed to genetic or
shared environmental sources. Model fit statistics for alternative bivariate reduced models
are shown in supplementary Table S.2 (Table S.6 for reduced models involving tempo in
Tables S.3 and S.4).
Pubertal timing across methods: bivariate genetic analyses—In accord with
results of univariate analyses, results of bivariate analyses were more consistent for pubertal
timing than for pubertal tempo. For pubertal timing (Table 4), phenotypic correlations
among the different indicators were largely due to genes, as shown by the consistent AE
reduced models, the high estimates for the genetic correlations between measures, and the
proportion of the phenotypic covariance that is attributable to additive genetic influences
acting on both measures. In addition, similar estimates of additive genetic correlations for
linear and logistic timing measures are found in both sexes. The correlation between timing
of adrenarche and gonadarche in girls was also attributable entirely to genetic covariation,
although there was some unique genetic variance in each measure: rA = 0.64, and 95 % CIs
Corley et al. Page 12
Behav Genet. Author manuscript; available in PMC 2016 July 27.
Author M
anuscriptA
uthor Manuscript
Author M
anuscriptA
uthor Manuscript
did not include 1.00. The nonshared environmental correlation between adrenarche and
gonadarche timing could be set to zero, reflecting the different PDS features comprising the
two measures. Moreover, pubertal timing in girls appears to reflect gonadarche more than
adrenarche for both genetic and nonshared environmental reasons: timing of total PDS score
has lower rE and rA with adrenarche than with gonadarche.
Sex comparisons for bivariate genetic analyses of links among measures of pubertal timing—The overlap between the estimates of (total PDS) timing from linear and
logistic models reflects effects of additive genes and nonshared environment for both sexes
to a similar extent: a common AE model fits with high rA and rE. But, the CIs do not overlap
for the standardized estimates, reflecting the higher phenotypic correlation in girls than in
boys and, as might be expected from the inability to equate variation in the univariate
models (panel 2C), it is not possible to equate the unstandardized covariance matrices. In
sum, results shown in Table 4 again indicate the high degree of overlap of genetic and
nonshared environmental influences across sexes and measures of pubertal timing.
Pubertal tempo across methods: bivariate genetic analyses—Results of
bivariate analyses of pubertal tempo (Table S.3) are similar to those for univariate analyses
in showing few clear patterns. For girls, all logistic estimates of overall tempo (PDS total
score measure) required a nongenetic (CE) model, but a genetic source of variation (AE or
ACE model) for the other tempo measure (panel S.3A); thus, overlap between measures can
only be attributed to environmental (C or E) covariance. For example, 55 % of the
covariation between logistic PDS and gonadarche tempo estimates was due to common
environmental influences, but covariation between logistic PDS and traditional measure
estimates was only due to nonshared environmental influences. There were genetic
influences, however, on covariation between adrenarche and gonadarche tempo estimates in
girls and between logistic and linear PDS tempo estimates in boys. The covariation in boys
was also partly attributable to the nonshared environment (panel S.3B). It is apparent that no
single reduced model explains the shared covariation among tempo measures across sex.
Sex comparisons for bivariate genetic analyses of links among measures of pubertal tempo—Direct comparison of boys and girls (panel S.3C) shows that the simple
common models (AE, CE, DE) do not adequately describe the covariation between linear
and logistic tempo parameters in either sex, but a complex model is acceptable: AE for the
linear estimate of tempo, and CE for the logistic estimate of tempo. Thus, nonshared
environment is the only common source of covariation between linear and logistic estimates
of tempo, since familial influences are attributed to different sources for the different
estimates (A for linear and C for logistic). The nonadditive genetic contribution to the
covariation in tempo in boys (panel 5B) is not present in the common model across sex. In
sum, results shown in Table S.3 again indicate the lack of consistency in influences on
pubertal tempo across sex and alternative measures.
Pubertal timing–tempo links: bivariate genetic analyses—Bivariate analyses of
links between timing and tempo within method (Table S.4) showed that genes were a major
source of covariation for most indicators, as seen in the AE best-fitting reduced models.
Corley et al. Page 13
Behav Genet. Author manuscript; available in PMC 2016 July 27.
Author M
anuscriptA
uthor Manuscript
Author M
anuscriptA
uthor Manuscript
Exceptions concerned the logistic estimates: For girls, the positive covariation between
timing and tempo was attributed primarily (77 %) to shared environmental influences; for
boys, the modest negative correlation (−.26) between timing and tempo was partially
attributed to nonadditive genes. Although phenotypic correlations between timing and tempo
differed between related measures (e.g., in girls, for adrenarche, r = −.39, for gonadarche, r = .50), genetic and environmental influences acted similarly within measure (as indicated by
the identical signs of rA and rE).
Sex comparisons for bivariate genetic analyses of pubertal timing–tempo links—Comparison of boys and girls (panel S.4C) showed a common AE model for the
linear timing–tempo link (although covariances cannot be equated; see supplementary Table
S.6), but no common model for the logistic timing–tempo link. The latter finding is
consistent with the sex difference in the direction of the phenotypic correlations between
logistic timing and tempo (positive in girls, negative in boys). Other aspects of the modeling
confirm the distinctness of the logistic estimate of tempo in girls (e.g., contrasting signs for
parameter estimates, lack of overlap of CIs). In sum, results shown in Table S.4 indicate that
bivariate relationships involving tempo cannot be described simply; sources of covariation
differ across sex and measures.
Puberty-behavior associations: bivariate genetic analyses
Phenotypic correlations between puberty and behavioral outcomes in this sample combined
with CAP reported previously (Beltz et al. 2014) are consistent with others in showing small
associations between early pubertal timing and behavior problems, especially early age at
sexual initiation and substance use (as noted above, analyses were restricted to the logistic
estimate of timing, because the logistic model fit the data better than a linear model).
Correlations were similar in the LTS sample alone: Pubertal timing (logistic estimate of the
trajectory for the total PDS score) correlated with age at sexual initiation (using the 3-
category measure) .14 in girls and .15 in boys, and with substance use .18 in girls and .08 in
boys; all correlations except the last were significantly greater than 0.
The results of bivariate genetic analyses examining sources of the phenotypic correlations
between pubertal timing and behavior are shown in Table 5. Pubertal timing was linked for
additive genetic reasons with age at sexual initiation and substance use in girls, and for
nonadditive (dominance) genetic reasons with age at sexual initiation in boys; there was no
evidence of shared or nonshared environmental influences (see results of alternative models
in Table S.2). Comparisons of boys and girls (panel 5C) show that reduced AE models with
rE set to zero are acceptable for both sexes for both behavioral measures. Results shown in
Table 5 between pubertal timing and behavioral outcomes assessed several years later
contrast with those across and within pubertal indicators (shown in Tables 4, S.3, and S.4) by
their lack of a significant nonshared environmental contribution to the phenotypic
correlations.
Moderated heritability
Finally, we considered the extent to which pubertal processes might change the expression
of genes important for behavior, by examining whether pubertal status predicted the
Corley et al. Page 14
Behav Genet. Author manuscript; available in PMC 2016 July 27.
Author M
anuscriptA
uthor Manuscript
Author M
anuscriptA
uthor Manuscript
magnitude of genetic and environmental influences on outcomes. Pubertal status was
defined as the age at midpuberty estimated from the logistic model in both sexes, and as the
age at menarche in girls. The behaviors likely to be relevant here are those that increase in
incidence or level during puberty. LTS was not designed to address this question, so the
measures available to explore the question were limited to parent-reported CBCL
Internalizing and Externalizing Behavior Problems collected at yearly intervals during
adolescence.
We used a twin moderation model (Klump et al. 2007; Purcell 2002) to test whether the
estimates for genetic and environmental influences on the CBCL measures varied linearly
with age of midpuberty in both sexes or with age at menarche in girls (our sample size
prevented testing for nonlinear effects). We examined CBCL scores collected at the age
closest to the average midpoint of pubertal development, which was age 13 for girls and age
15 for boys, and used log-transformed standardized scores to reduce skewness.
There was no compelling evidence that genetic influences on CBCL Internalizing or
Externalizing Behavior Problems varied with pubertal status. As shown in Table S.5, there
was only one outcome for which puberty (logistic timing) moderated estimates of genetic
and environmental influences, and this effect is opposite to expectation. For Internalizing
Problems in girls, early pubertal status (or delayed development relative to peers) was
associated with increased genetic influences and decreased nonshared environmental
influences (which includes measurement error). No significant moderation was detected for
internalizing problems in boys, or externalizing problems in either sex. Furthermore, mean
transformed CBCL scores did not differ significantly from 0, and the means did not vary
with pubertal status. Analyses using age at menarche (not shown) also failed to show
evidence of pubertal moderation of genetic and environmental influences on behavior
problems.
Discussion
We combined behavior genetic methods with advanced modeling of puberty to clarify the
measurement and psychological significance of pubertal development. Specifically, we
considered: (a) genetic and environmental influences on pubertal development described in
different ways; (b) genetic and environmental influences on the covariation between
different pubertal indicators, and between pubertal development and behavior problems; (c)
changing heritability of behavior problems with pubertal development; and (d) sex
differences in each of those three topics.
Variations in pubertal development
Variations in pubertal timing were found to be largely genetic in both boys and girls. There
was more nonshared environmental influence on pubertal timing in boys than in girls, and on
timing of adrenarche than on gonadarche, likely due to measurement, that is, better
measurement of gonadarche than adrenarche, and better measurement of gonadarche in girls
than in boys (Dorn et al. 2006; Dorn and Biro 2010). Results were similar across methods
for describing timing (logistic estimate, linear estimate, menarche in girls). Furthermore,
bivariate analyses revealed large genetic overlap among the measures of pubertal timing.
Corley et al. Page 15
Behav Genet. Author manuscript; available in PMC 2016 July 27.
Author M
anuscriptA
uthor Manuscript
Author M
anuscriptA
uthor Manuscript
These findings confirm results concerning large genetic and some nonshared environmental
contributions to puberty (Eaves et al. 2004; Mustanski et al. 2004; van den Berg et al. 2006)
and extend them to other methods; they also extend other findings from this sample that
different measures of timing correlate highly with each other and in similar ways with
behavioral outcome (Beltz et al. 2014).
Variations in pubertal tempo, however, were not consistently attributed to genetic or
environmental sources; estimates varied across methods. This is the first genetic analysis of
variations in pubertal tempo. But, the results are not surprising in light of other reports about
tempo, particularly inconsistent links with behavior, partly due to variations in definition and
measurement across studies (Castellanos-Ryan et al. 2013; Marceau et al. 2011; Mendle et
al. 2010).
How best to measure pubertal development?
Our results with self reports of pubertal development provide little evidence to prefer one
index of pubertal timing over another, and confirm the difficulties of measuring tempo. All
indexes of overall pubertal timing are highly heritable and reflect highly similar genetic
processes, as shown in the large genetic contribution to the (high) phenotypic correlations
among logistic and linear timing, and menarche. The different indexes of pubertal tempo,
however, are differently influenced by genes and do not appear to share genetic variation;
this is consistent with other information about the measures, that is, at the phenotypic level,
tempo measures are not highly correlated with each other, and not consistently correlated
with timing or with behavior (Beltz et al. 2014). It is notable that the logistic estimate of
tempo is probably the least meaningful from both genetic and endocrine perspectives. It is
conceptualized in an unusual way, as the instantaneous speed of development at the
midpoint of puberty. This likely explains why it shows little genetic influence or genetic
overlap with logistic timing, and why it is correlated with timing in a way that is inconsistent
with other methods.
Our results also suggest little value in separately examining timing of adrenarche, at least
when it is measured by self-reported physical features. Using the logistic model in girls,
timing of adrenarche showed large (but not complete) genetic overlap with timing of
gonadarche. The larger nonshared environmental contribution to adrenarche than to
gonadarche likely reflects measurement error associated with the relatively greater difficulty
in rating body hair than genital development. The difficulty of estimating adrenarche
separately from gonadarche extends beyond self reports: In several studies measuring
puberty with physical features (self report or exams by health professionals), adrenarche was
seen to occur later than go-nadarche (Beltz et al. 2014; Marceau et al. 2011; Paus et al. 2010;
Shirtcliff et al. 2009), but adrenal hormones rise earlier than gonadal hormones (reviewed in
Styne and Grumbach, 2011); adrenal hormone levels may be insufficient to produce physical
changes until gonadarche (Dorn et al. 2006; Wan et al. 2012).
Puberty-behavior associations
We focused on the link of pubertal timing to substance use and age at sexual initiation, given
that these are the strongest phenotypic correlations found in both sexes in our study and are
Corley et al. Page 16
Behav Genet. Author manuscript; available in PMC 2016 July 27.
Author M
anuscriptA
uthor Manuscript
Author M
anuscriptA
uthor Manuscript
consistently found in other studies (e.g., Ge and Natsuaki, 2009; Graber 2013). Results
suggest that covariations reflect additive genetic factors in girls, but are not as clear in boys.
There is relatively little other behavior genetic work examining sources of covariation
between pubertal development and these behaviors, especially in boys. Findings regarding
other characteristics have not produced a consistent picture on the ways that genes and
environment mediate associations between pubertal timing and behavior, and there is a need
for more work on the topic, with particular attention to the conceptualization and
measurement of puberty (see also Harden et al. 2012). We did not examine sources of
phenotypic correlations between tempo and behavioral outcome given the genetic results for
tempo, and that links between tempo and behavior are largely overlapping with timing
(Beltz et al. 2014).
Do genetic influences on behavior change at puberty?
In light of suggestions that pubertal hormones regulate the expression of genes underlying
behavior, and thus account for psychological changes at puberty (e.g., Klump et al. 2003,
2007), we studied whether puberty moderates genetic influences on some behavior
problems. We aimed to examine whether sex hormones contribute to the increased incidence
of behavior problems by modulating gene expression. We were limited by the LTS design to
using CBCL measures of internalizing and externalizing at age 13 for girls, and age 15 for
boys, ages which show expected variability in pubertal status and represent midpuberty in
this sample. We examined whether pubertal status affected estimates of genetic and
environmental influences on outcomes, indexing pubertal status with age at midpuberty
estimated from the logistic model in both sexes and with age at menarche in girls.
We found no evidence that advancing puberty was associated with increased genetic
influences for either internalizing or externalizing problems in girls or boys, but our study
was not designed to provide a strong test of such effects. The lack of significant moderation
should be considered in light of the relatively small sample size and the limited set of
behavioral outcomes available; the lack of significant change in mean CBCL scores with
advancing puberty suggests that these measures are probably not strong candidates for
moderation effects.
The optimal approach to studying moderated heritability should involve measures chosen to
test hypothesized mechanisms accounting for behavioral changes at puberty, e.g., the
importance of estradiol for triggering disordered eating and depression in girls, and
testosterone in facilitating risk taking (and associated externalizing problems) in boys.
Unfortunately, LTS was conducted before such focus on adolescent change so we were
limited to examining this issue with CBCL scores. Further limiting our ability to test our
hypotheses, these behavior problems did not increase at midpuberty in this sample.
Nevertheless, we presented these results to illustrate how trajectory analyses might be used
to study gene-hormone interplay.
Study strengths and limitations
This study is an example of gene-hormone interplay on behavior, and how combining a
behavior genetic perspective and advanced modeling of pubertal development can help to
Corley et al. Page 17
Behav Genet. Author manuscript; available in PMC 2016 July 27.
Author M
anuscriptA
uthor Manuscript
Author M
anuscriptA
uthor Manuscript
understand behavioral effects of hormones, using self-reported physical development as a
proxy for hormonal changes. We extended work (ours and others) regarding methods for
estimating pubertal timing and tempo, and their links to behavior.
There are several new findings that should guide studies of pubertal development. First,
there is little evidence for the superiority of one estimate of pubertal timing over others.
Although a logistic model may describe development better than a linear model (Beltz et al.
2014; Marceau et al. 2011), it is not clear that there are advantages of logistic estimates. The
different estimates of pubertal timing—linear, logistic, and traditional—are correlated with
each other and relate to behavior in similar ways—for genetic reasons. Second, pubertal
tempo is difficult to capture and is estimated idiosyncratically across method (Beltz et al.
2014; Marceau et al. 2011; Mendle et al. 2010)—with genetic analyses confirming that
different constructs are measured by each method. Thus, calls for studies of the
psychological significance of pubertal tempo (Mendle 2014) may be premature given the
need for more data on the reliability and validity of different measures. Third, there appears
to be little value to studying adrenarche alone, at least with the PDS and perhaps with
physical features generally. Fourth, consistency of findings across sex strengthens our
conclusions, and encourages the use of trajectories to study the psychological significance of
puberty in boys as well as girls. Fifth, our results highlight the importance of separating
pubertal status and timing, and methods for doing so.
Several factors should be considered in interpreting the results. First, we used physical
indicators of puberty as a proxy for hormones, but this is not necessarily a limitation.
Physical development reflects an integrated picture of the effect of adrenal and gonadal
hormones. Direct assays of hormones, particularly at a single point in time, may not provide
more accurate assessment of pubertal processes than do measures of physical features (even
by self report; Shirtcliff et al. 2009). Hormone levels reflect more than pubertal
development, including variations due to genes (Harris et al. 1998), circadian, monthly, and
seasonal rhythms, environmental factors (e.g., diet, exercise), and behavior itself (Carré
2009; Stanton et al. 2011); responses to hormones also depend on other hormones that are
present, and sensitivity of hormone receptors (Styne and Grumbach 2011). Furthermore,
hormone assays are not straightforward (Handelsman and Wartofsky 2013; van Anders
2010).
Second, there is concern about the value of self report, including imperfect correspondence
with physical exam by a health professional (e.g., Huang et al. 2012). But, self report has
been shown to correlate with hormone levels as well as physical exam does (Shirtcliff et al.
2009), and will continue to be the preferred method of many investigators because it is easy
and inexpensive to use, and is nonintrusive, so will enable data collection from
representative samples. And, as we showed, self reports of pubertal development can readily
be used to model trajectories of development in boys and girls and produce meaningful
results. Trajectories also overcome one of the limitations of repeated self-report assessments:
some youth report lower development from one time to the next.
Third, although sample size was sufficient for most analyses, it was not large enough for
robust analyses of moderated heritability. We retained these analyses, however, to
Corley et al. Page 18
Behav Genet. Author manuscript; available in PMC 2016 July 27.
Author M
anuscriptA
uthor Manuscript
Author M
anuscriptA
uthor Manuscript
demonstrate the value of the trajectories for studying the role of pubertal status as well as
timing and tempo.
Fourth, formal testing of sex-limitation models was not possible because PDS total scores
were not identical in girls and boys and there were no opposite-sex DZ twins in LTS. But
several sex comparisons were done, allowing us to determine whether sex-moderation could
be ignored. Future work should examine different ways in which genetic models can
incorporate the sex difference in pubertal timing.
Finally, there are some limitations to our behavioral measures, although all are widely-used
and psychometrically sound. Particular concerns relate to insensitivity to problem behaviors
in this sample, potentially reducing the size of links between pubertal timing and later
behavior, and to limited measurement of problems likely to increase in adolescence,
constraining our ability to examine pubertal status as a moderator of heritability of
problems.
Conclusions and future directions
Applying a behavior genetic perspective to advanced models, we showed the value and
limitations of different approaches to measuring pubertal development, and provided
evidence to guide future studies linking hormones to behavior. Our data confirm and extend
others in showing the value of youth self report of pubertal development, the importance of
genetic influences on pubertal timing no matter how it is measured, and the limitations of
current measures of pubertal tempo. Use of trajectories should also facilitate research on the
psychological significance of puberty in boys as well as girls.
We took a systems-level approach to understanding gene-hormone interplay at adolescence:
the physical changes of puberty reflect the integration of the developing adrenal glands and
hypothalamic–pituitary–gonadal axis. Thus, our study provides information on the interplay
between genes and the integrated effects of hormones. It also offers a road map to other
researchers in terms of methodology (how to maximize the value of data on physical
indicators) and conceptual framework (how to investigate understudied aspects of gene-
hormone interplay in adolescence, and recognize the value of studying physical
development).
Future work could profitably focus on a number of interesting questions regarding gene-
puberty interplay in psychological development. One set of questions, amenable to study in
several existing behavior genetic projects, concerns genetic and environmental contributors
to links between variations in pubertal development and behavior problems. The phenotypic
association between early puberty and behavioral risk is well-established in girls, but the
sources of the covariation have received surprisingly little attention, and both the nature and
causes of phenotypic associations in boys have not been well studied, in part because of
concerns about measurement of puberty (especially by self report) in boys. Our results
suggest that these questions can be addressed with measures that are already available, or
easily computed, in many typical developmental behavior genetic studies. Another set of
questions requires improvements in conceptualization and measurement of puberty. This
Corley et al. Page 19
Behav Genet. Author manuscript; available in PMC 2016 July 27.
Author M
anuscriptA
uthor Manuscript
Author M
anuscriptA
uthor Manuscript
includes refinement of measures of tempo, differentiation of aspects and processes of
puberty (e.g., importance of development of pubic hair versus genitalia versus menarche in
girls) and the synchrony of their development, and ability to measure the different pubertal
stages (e.g., onset versus midpuberty). Puberty is an important developmental period that
exemplifies gene-hormone interplay and thus represents an important research opportunity
for behavior geneticists.
Supplementary Material
Refer to Web version on PubMed Central for supplementary material.
Acknowledgments
The research reported here was supported by Grants from the National Institutes of Health, HD010333, HD036773, and DA011015. We thank Sally-Ann Rhea for overseeing the data collection and management, Brett Haberstick for assistance with genetic analyses, and Michael Stallings and Josh Bricker for input on assessment of psychological outcomes.
References
Achenbach, TM. Manual for the child behavior checklist: 4–18 and 1991 profile. University of Vermont Department of Psychiatry; Burlington: 1991.
Angold A, Costello EJ, Worthman CM. Puberty and depression: the roles of age, pubertal status and pubertal timing. Psychol Med. 1998; 28(1):51–61. DOI: 10.1017/s003329179700593x [PubMed: 9483683]
Belsky J, Steinberg L, Draper P. Childhood experience, interpersonal development, and reproductive strategy: an evolutionary theory of socialization. Child Dev. 1991; 62:647–670. [PubMed: 1935336]
Beltz AM, Corley RP, Wadsworth SJ, Bricker JB, Berenbaum SA. Modeling pubertal timing and tempo and examining links to behavior problems. Dev Psychol. 2014; 50(12):2715–2726. DOI: 10.1037/a0038096 [PubMed: 25437757]
Bricker JB, Stallings MC, Corley RP, Wadsworth SJ, Bryan A, Timberlake DS, DeFries JC. Genetic and environmental influences on age at sexual initiation in the Colorado Adoption Project. Behav Genet. 2006; 36(6):820–832. DOI: 10.1007/s10519-006-9079-2 [PubMed: 16710776]
Burt SA, McGue M, DeMarte JA, Krueger RF, Iacono WG. Timing of menarche and the origins of conduct disorder. Arch Gen Psychiatry. 2006; 63:890–896. [PubMed: 16894065]
Button TMM, Hewitt JK, Rhee SH, Corley RP, Stallings MC. The moderating effect of religiosity on the genetic variance of problem alcohol use. Alcohol Clin Exp Res. 2010; 34(9):1619–1624. DOI: 10.1111/j.1530-0277.2010.01247.x [PubMed: 20569244]
Carré JM. No place like home: testosterone responses to victory depend on game location. Am Jof Human Biol. 2009; 21(3):392–394. DOI: 10.1002/ajhb.20867
Caspi A, Moffitt TE. Individual differences are accentuated during periods of social change: the sample case of girls at puberty. J Pers Soc Psychol. 1991; 61:157–168. [PubMed: 1890586]
Castellanos-Ryan N, Parent S, Vitaro F, Tremblay RE, Seguin JR. Pubertal development, personality, and substance use: a 10-year longitudinal study from childhood to adolescence. J Abnormal Psychology. 2013; 122(3):782–796. DOI: 10.1037/a0033133
Coleman L, Coleman J. The measurement of puberty: a review. J Adolesc. 2002; 25:535–550. DOI: 10.1006/jado.2002.0494 [PubMed: 12234559]
Copeland W, Shanahan L, Miller S, Costello EJ, Angold A. Outcomes of early pubertal timing in young women: a prospective population-based study. Am J Psychiatry. 2010; 167(10):1218–1225. DOI: 10.1176/appi.ajp.2010.09081190 [PubMed: 20478880]
Cottler LB, Keating SK. Operationalization of alcohol and drug dependence criteria by means of a structured interview. Recent Dev Alcohol. 1990; 8:69–83. [PubMed: 2333396]
Corley et al. Page 20
Behav Genet. Author manuscript; available in PMC 2016 July 27.
Author M
anuscriptA
uthor Manuscript
Author M
anuscriptA
uthor Manuscript
Crowley TJ, Mikulich SK, Ehlers KM, Whitmore EA, MacDonald MJ. Validity of structured clinical evaluations in adolescents with conduct and substance problems. J Am Acad Child Adolesc Psychiatry. 2001; 40(3):265–273. DOI: 10.1097/00004583-200103000-00005 [PubMed: 11288767]
Culbert KM, Burt SA, McGue M, Iacono WG, Klump KL. Puberty and the genetic diathesis of disordered eating attitudes and behaviors. J Abnorm Psychol. 2009; 118(4):788–796. DOI: 10.1037/a0017207 [PubMed: 19899848]
Dorn LD, Biro F. Puberty and its measurement: a decade in review. J Res Adolesc. 2010; 21:180–195.
Dorn LD, Dahl RE, Biro F. Defining the boundaries of early adolescence: a user’s guide to assessing pubertal status and pubertal timing in research with adolescents. Appl Dev Sci. 2006; 10(1):30–56. DOI: 10.1207/s1532480xads1001_3
Eaves L, Silberg J, Foley D, Bulik C, Maes H, Erkanli A, Worthman CM. Genetic and environmental influences on the relative timing of pubertal change. Twin Res. 2004; 7(5):471–481. DOI: 10.1375/twin.7.5.471 [PubMed: 15527663]
Ge X, Natsuaki MN. In search of explanations for early pubertal timing effects on developmental psychopathology. Curr Dir Psychol Sci. 2009; 18(6):327–331. DOI: 10.1111/j.1467-8721.2009.01661.x
Ge X, Conger RD, Elder GH. Coming of age too early: pubertal influences on girls’ vulnerability to psychological distress. Child Dev. 1996; 67:386–400. DOI: 10.2307/1131784
Graber JA. Pubertal timing and the development of psychopathology in adolescence and beyond. Horm Behav. 2013; 64(2):262–269. DOI: 10.1016/j.yhbeh.2013.04.003 [PubMed: 23998670]
Graber JA, Seeley JR, Brooks-Gunn J, Lewinsohn PM. Is pubertal timing associated with psychopathology in young adulthood? J Am Acad Child Adolesc Psychiatry. 2004; 43(6):718–726. [PubMed: 15167088]
Gunnar MR, Wewerka S, Frenn K, Long JD, Griggs C. Developmental changes in hypothalamus-pituitary-adrenal activity over the transition to adolescence: normative changes and associations with puberty. Dev Psychopathol. 2009; 21(1):69–85. DOI: 10.1017/s0954579409000054 [PubMed: 19144223]
Handelsman DJ, Wartofsky L. Requirement for mass spectrometry sex steroid assays in the. J Clin Endocrinol Metab. 2013; 98(10):3971–3973. DOI: 10.1210/jc.2013-3375 [PubMed: 24098015]
Harden KP, Mendle J. Gene-environment interplay in the association between pubertal timing and delinquency in adolescent girls. J Abnorm Psychol. 2012; 121:73–87. [PubMed: 21668078]
Harden KP, Mendle J, Kretsch N. Environmental and genetic pathways between early pubertal timing and dieting in adolescence: distinguishing between objective and subjective timing. Psychol Med. 2012; 42:183–193. [PubMed: 21676282]
Harris JA, Vernon PA, Boomsma DI. The heritability of testosterone: a study of Dutch adolescent twins and their parents. Behav Genet. 1998; 28(3):165–171. DOI: 10.1023/a:1021466929053 [PubMed: 9670592]
Hill, JP.; Lynch, ME. The intensification of gender-related role expectations during early adolescence. In: Brooks-Gunn, J.; Petersen, AC., editors. Girls at puberty: biological and psychosocial perspectives. Plenum; New York: 1983. p. 201-228.
Huang B, Hillman J, Biro FM, Ding L, Dorn LD, Susman EJ. Correspondence between gonadal steroid hormone concentrations and secondary sexual characteristics assessed by clinicians, adolescents, and parents. J Res Adolesc. 2012; 22(2):381–391. DOI: 10.1111/j.1532-7795.2011.00773.x [PubMed: 23204809]
Klump KL, McGue M, Iacono WG. Differential heritability of eating attitudes and behaviors in prepubertal versus pubertal twins. Int J Eat Disord. 2003; 33(3):287–292. DOI: 10.1002/eat.10151 [PubMed: 12655625]
Klump KL, Perkins PS, Burt SA, McGue M, Iacono WG. Puberty moderates genetic influences on disordered eating. Psychol Med. 2007; 37:627–634. [PubMed: 17335640]
Klump KL, Keel PK, Sisk C, Burt SA. Preliminary evidence that estradiol moderates genetic influences on disordered eating attitudes and behaviors during puberty. Psychol Med. 2010; 40(10):1745–1753. DOI: 10.1017/s0033291709992236 [PubMed: 20059800]
Corley et al. Page 21
Behav Genet. Author manuscript; available in PMC 2016 July 27.
Author M
anuscriptA
uthor Manuscript
Author M
anuscriptA
uthor Manuscript
Lee Y, Styne D. Influences on the onset and tempo of puberty in human beings and implications for adolescent psychological development. Horm Behav. 2013; 64:250–261. [PubMed: 23998669]
Little, RJA.; Rubin, DB. Statistical Analysis With Missing Data. Wiley; New York: 1987.
Marceau K, Ram N, Houts RM, Grimm KJ, Susman EJ. Individual differences in boys’ and girls’ timing and tempo of puberty: modeling development with nonlinear growth models. Dev Psychol. 2011; 47(5):1389–1409. DOI: 10.1037/a0023838 [PubMed: 21639623]
Marceau K, Neiderhiser JM, Lichenstein P, Reiss D. Genetic and environmental influences on the association between pubertal maturation and internalizing symptoms. J Youth Adolesc. 2012; 41:1111–1126. [PubMed: 22476728]
Mendle J. Beyond pubertal timing: new directions for studying individual differences in development. Curr Dir Psychol Sci. 2014; 23:215–219.
Mendle J, Ferrero J. Detrimental psychological outcomes associated with pubertal timing in adolescent boys. Dev Rev. 2012; 32(1):49–66. DOI: 10.1016/j.dr.2011.11.001
Mendle J, Harden KP, Brooks-Gunn J, Graber JA. Development’s tortoise and hare: pubertal timing, pubertal tempo, and depressive symptoms in boys and girls. Dev Psychol. 2010; 46(5):1341–1353. DOI: 10.1037/a0020205 [PubMed: 20822243]
Mustanski BS, Viken RJ, Kaprio J, Pulkkinen L, Rose RJ. Genetic and environmental influences on pubertal development: longitudinal data from Finnish twins at ages 11 and 14. Dev Psychobiol. 2004; 40:1188–1198.
Navarro VM, Castellano JM, García-Galiano D, Tena-Sempere M. Neuroendocrine factors in the initiation of puberty: the emergent role of kisspeptin. Rev Endocrine Metab Disord. 2007; 8:11–20. [PubMed: 17340172]
Neale, MC.; Boker, SM.; Xie, G.; Maes, HH. Mx: Statistical Modeling. Richmond, VA: Department of Psychiatry, VCU Box 900126; 2002.
Negriff S, Susman EJ. Pubertal timing, depression, and externalizing problems: a framework, review, and examination of gender differences. J Res Adolesc. 2011; 21(3):717–746. DOI: 10.1111/j.1532-7795.2010.00708.x
Paus T, Nawaz-Khan I, Leonard G, Perron M, Pike GB, Pitiot A, Pausova Z. Sexual dimorphism in the adolescent brain: role of testosterone and androgen receptor in global and local volumes of grey and white matter. Horm Behav. 2010; 57(1):63–75. DOI: 10.1016/j.yhbeh.2009.08.004 [PubMed: 19703457]
Petersen AC, Crockett L, Richards M, Boxer A. A self-report measure of pubertal status: reliability, validity, and initial norms. J Youth Adolesc. 1988; 17:117–133. DOI: 10.1007/BF01537962 [PubMed: 24277579]
Purcell S. Variance components models for gene-environment interaction in twin analysis. Twin Res. 2002; 5:554–571. http://dx.doi.org/10.1375/twin.5.6.554. [PubMed: 12573187]
Rhea SA, Gross AA, Haberstick BC, Corley RP. Colorado Twin Registry. Twin Res Human Genet. 2006; 9(6):941–949. DOI: 10.1375/183242706779462895 [PubMed: 17254434]
Schmitz KE, Hovell MF, Nichols JF, Irvin VL, Keating K, Simon GM, Jones KL. A validation study of early adolescents’ pubertal self-assessments. J Early Adolesc. 2004; 24(4):357–384. DOI: 10.1177/0272431604268531
Shirtcliff EA, Dahl RE, Pollak SD. Pubertal development: correspondence between hormonal and physical development. Child Dev. 2009; 80(2):327–337. DOI: 10.1111/j.1467-8624.2009.01263.x [PubMed: 19466995]
Stallings MC, Corley RP, Hewitt JK, Krauter KS, Lessem JM, Mikulich SK, Crowley TJ. A genome-wide search for quantitative trait loci influencing substance dependence vulnerability in adolescence. Drug Alcohol Depend. 2003; 70(3):295–307. DOI: 10.1016/s0376-8716(03)00031-0 [PubMed: 12757967]
Stanton SJ, Mullette-Gillman ODA, Huettel SA. Seasonal variation of salivary testosterone in men, normally cycling women, and women using hormonal contraceptives. Physiol Behav. 2011; 104(5):804–808. DOI: 10.1016/j.physbeh.2011.07.009 [PubMed: 21802437]
Styne, DM.; Grumbach, MM. Puberty: Ontogeny, neuroendocrinology, physiology, and disorders. In: Kronenberg, HM.; Shlomo, M.; Polonsky, KS.; Larsen, PR., editors. Williams textbook of endocrinology. 12th. Saunders Elsevier; Philadelphia: 2011.
Corley et al. Page 22
Behav Genet. Author manuscript; available in PMC 2016 July 27.
Author M
anuscriptA
uthor Manuscript
Author M
anuscriptA
uthor Manuscript
Tanner, JM. Foetus into man: Physical growth from conception to maturity. Harvard University Press; Cambridge: 1978.
Trotman HD, Holtzman CW, Ryan AT, Shapiro DI, MacDonald AN, Goulding SM, Walker EF. The development of psychotic disorders in adolescence: a potential role for hormones. Horm Behav. 2013; 64:411–419. DOI: 10.1016/j.yhbeh.2013.02.018 [PubMed: 23998682]
van Anders SM. Chewing gum has large effects on salivary testosterone, estradiol, and secretory immunoglobulin A assays in women and men. Psychoneuroendocrinology. 2010; 35(2):305–309. DOI: 10.1016/j.psyneuen.2009.06.009 [PubMed: 19615825]
van den Berg SM, Setiawan A, Bartels M, Polderman TJ, van der Vaart AW, Boomsma DI. Individual differences in puberty onset in girls: bayesian estimation of heritabilities and genetic correlations. Behav Genet. 2006; 36:261–270. [PubMed: 16408250]
Wan W, Deng X, Archer KJ, Sun SS. Pubertal pathways and the relationship to anthropometric changes in childhood: the Fels longitudinal study. Open J Pediatr. 2012; 2:118–126. DOI: 10.4236/ojped.2012.22020
Webster GD, Graber JA, Gesselman AN, Crosier BS, Schember TO. A life history theory of father absence and menarche: a meta-analysis. Evol Psychol. 2014; 12:273–294. [PubMed: 25299880]
Wichstrøm L. The emergence of gender difference in depressed mood during adolescence: the role of intensified gender socialization. Dev Psychol. 1999; 35:232–245. [PubMed: 9923478]
Corley et al. Page 23
Behav Genet. Author manuscript; available in PMC 2016 July 27.
Author M
anuscriptA
uthor Manuscript
Author M
anuscriptA
uthor Manuscript
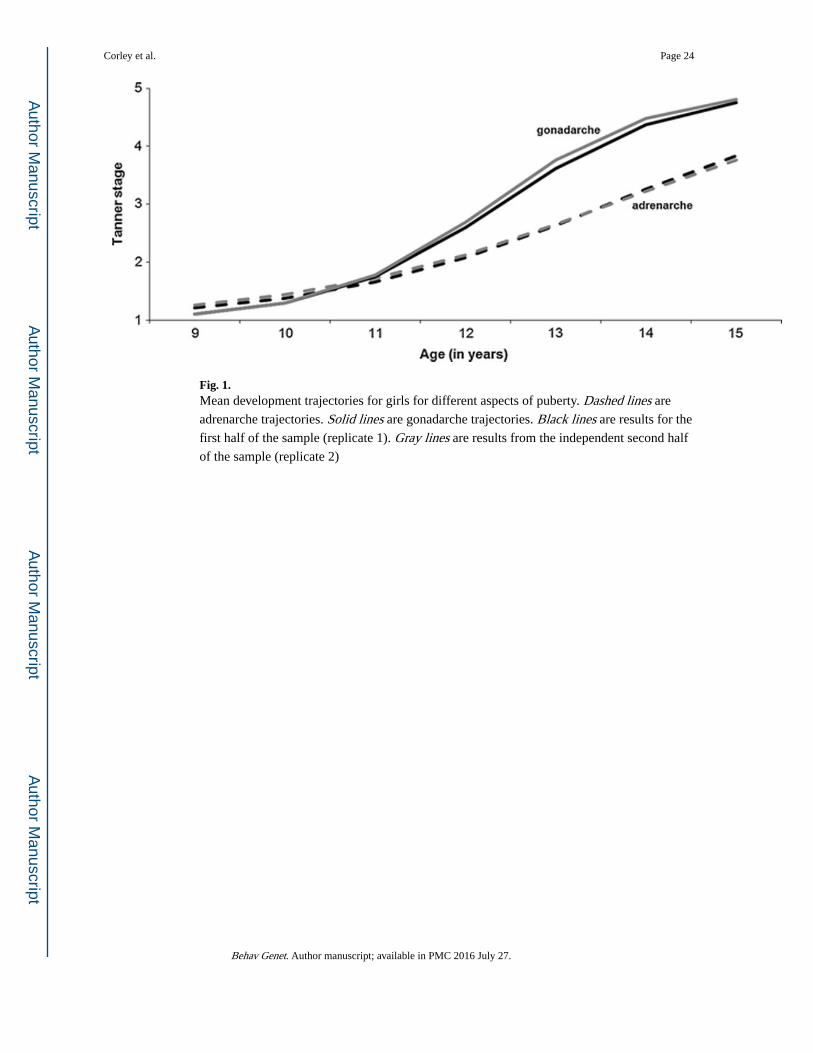
Fig. 1. Mean development trajectories for girls for different aspects of puberty. Dashed lines are
adrenarche trajectories. Solid lines are gonadarche trajectories. Black lines are results for the
first half of the sample (replicate 1). Gray lines are results from the independent second half
of the sample (replicate 2)
Corley et al. Page 24
Behav Genet. Author manuscript; available in PMC 2016 July 27.
Author M
anuscriptA
uthor Manuscript
Author M
anuscriptA
uthor Manuscript
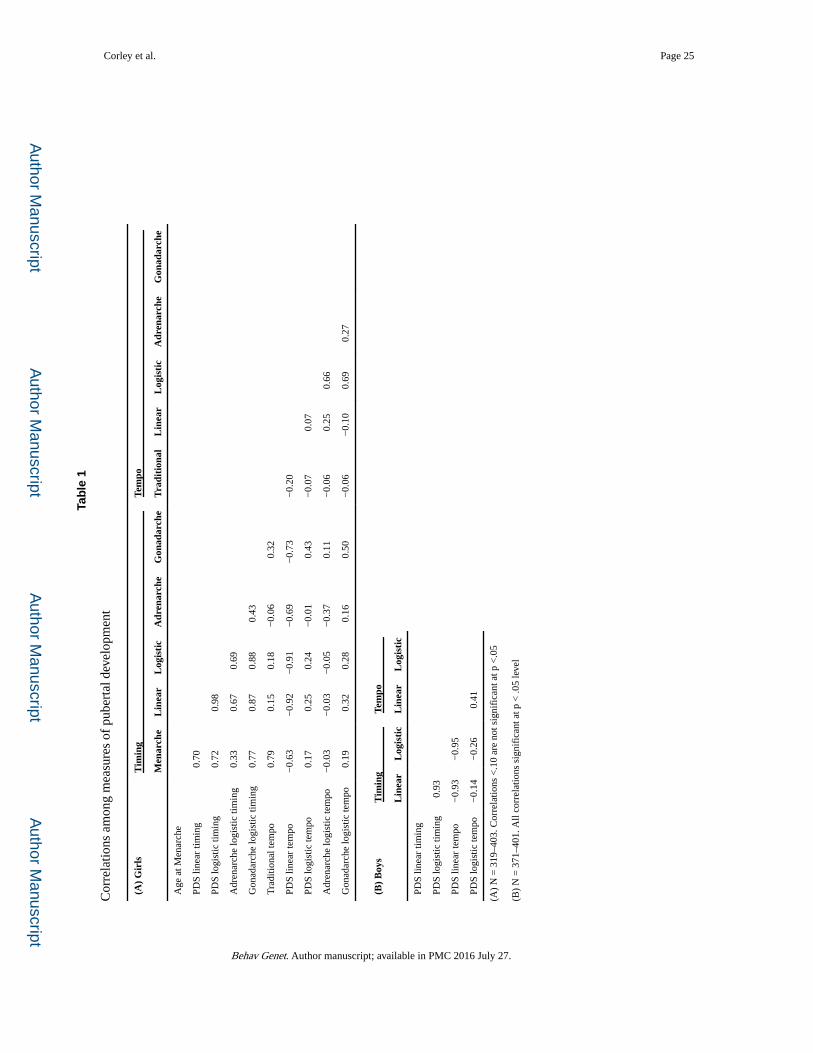
Author M
anuscriptA
uthor Manuscript
Author M
anuscriptA
uthor Manuscript
Corley et al. Page 25
Tab
le 1
Cor
rela
tions
am
ong
mea
sure
s of
pub
erta
l dev
elop
men
t
(A)
Gir
lsT
imin
gTe
mpo
Men
arch
eL
inea
rL
ogis
tic
Adr
enar
che
Gon
adar
che
Tra
diti
onal
Lin
ear
Log
isti
cA
dren
arch
eG
onad
arch
e
Age
at M
enar
che
PDS
linea
r tim
ing
0.7
0
PDS
logi
stic
tim
ing
0.7
2 0
.98
Adr
enar
che
logi
stic
tim
ing
0.3
3 0
.67
0.6
9
Gon
adar
che
logi
stic
tim
ing
0.7
7 0
.87
0.8
8 0
.43
Tra
ditio
nal t
empo
0.7
9 0
.15
0.1
8−
0.06
0.3
2
PDS
linea
r te
mpo
−0.
63−
0.92
−0.
91−
0.69
−0.
73−
0.20
PDS
logi
stic
tem
po 0
.17
0.2
5 0
.24
−0.
01 0
.43
−0.
07 0
.07
Adr
enar
che
logi
stic
tem
po−
0.03
−0.
03−
0.05
−0.
37 0
.11
−0.
06 0
.25
0.6
6
Gon
adar
che
logi
stic
tem
po 0
.19
0.3
2 0
.28
0.1
6 0
.50
−0.
06−
0.10
0.6
9 0
.27
(B)
Boy
sT
imin
gTe
mpo
Lin
ear
Log
isti
cL
inea
rL
ogis
tic
PDS
linea
r tim
ing
PDS
logi
stic
tim
ing
0.9
3
PDS
linea
r te
mpo
−0.
93−
0.95
PDS
logi
stic
tem
po−
0.14
−0.
26 0
.41
(A)
N =
319
–403
. Cor
rela
tions
<.1
0 ar
e no
t sig
nifi
cant
at p
<.0
5
(B)
N =
371
–401
. All
corr
elat
ions
sig
nifi
cant
at p
< .0
5 le
vel
Behav Genet. Author manuscript; available in PMC 2016 July 27.
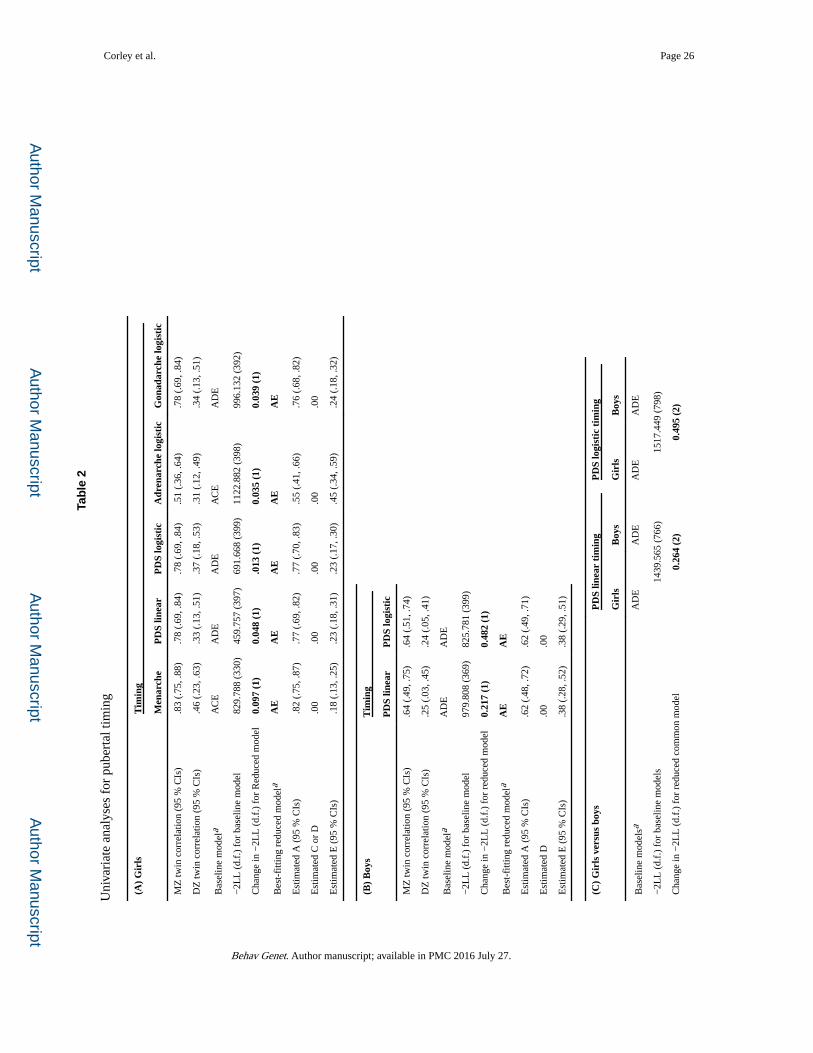
Author M
anuscriptA
uthor Manuscript
Author M
anuscriptA
uthor Manuscript
Corley et al. Page 26
Tab
le 2
Uni
vari
ate
anal
yses
for
pub
erta
l tim
ing
(A)
Gir
lsT
imin
g
Men
arch
eP
DS
linea
rP
DS
logi
stic
Adr
enar
che
logi
stic
Gon
adar
che
logi
stic
MZ
twin
cor
rela
tion
(95
% C
Is)
.83
(.75
, .88
).7
8 (.
69, .
84)
.78
(.69
, .84
).5
1 (.
36, .
64)
.78
(.69
, .84
)
DZ
twin
cor
rela
tion
(95
% C
Is)
.46
(.23
, .63
).3
3 (.
13, .
51)
.37
(.18
, .53
).3
1 (.
12, .
49)
.34
(.13
, .51
)
Bas
elin
e m
odel
aA
CE
AD
EA
DE
AC
EA
DE
−2L
L (
d.f.
) fo
r ba
selin
e m
odel
829.
788
(330
)45
9.75
7 (3
97)
691.
668
(399
)11
22.8
82 (
398)
996.
132
(392
)
Cha
nge
in −
2LL
(d.
f.)
for
Red
uced
mod
el0.
097
(1)
0.04
8 (1
).0
13 (
1)0.
035
(1)
0.03
9 (1
)
Bes
t-fi
tting
red
uced
mod
ela
AE
AE
AE
AE
AE
Est
imat
ed A
(95
% C
Is)
.82
(.75
, .87
).7
7 (.
69, .
82)
.77
(.70
, .83
).5
5 (.
41, .
66)
.76
(.68
, .82
)
Est
imat
ed C
or
D.0
0.0
0.0
0.0
0.0
0
Est
imat
ed E
(95
% C
Is)
.18
(.13
, .25
).2
3 (.
18, .
31)
.23
(.17
, .30
).4
5 (.
34, .
59)
.24
(.18
, .32
)
(B)
Boy
sT
imin
g
PD
S lin
ear
PD
S lo
gist
ic
MZ
twin
cor
rela
tion
(95
% C
Is)
.64
(.49
, .75
).6
4 (.
51, .
74)
DZ
twin
cor
rela
tion
(95
% C
Is)
.25
(.03
, .45
).2
4 (.
05, .
41)
Bas
elin
e m
odel
aA
DE
AD
E
−2L
L (
d.f.
) fo
r ba
selin
e m
odel
979.
808
(369
)82
5.78
1 (3
99)
Cha
nge
in −
2LL
(d.
f.)
for
redu
ced
mod
el0.
217
(1)
0.48
2 (1
)
Bes
t-fi
tting
red
uced
mod
ela
AE
AE
Est
imat
ed A
(95
% C
Is)
.62
(.48
, .72
).6
2 (.
49, .
71)
Est
imat
ed D
.00
.00
Est
imat
ed E
(95
% C
Is)
.38
(.28
, .52
).3
8 (.
29, .
51)
(C)
Gir
ls v
ersu
s bo
ysP
DS
linea
r ti
min
gP
DS
logi
stic
tim
ing
Gir
lsB
oys
Gir
lsB
oys
Bas
elin
e m
odel
saA
DE
AD
EA
DE
AD
E
−2L
L (
d.f.
) fo
r ba
selin
e m
odel
s14
39.5
65 (
766)
1517
.449
(79
8)
Cha
nge
in −
2LL
(d.
f.)
for
redu
ced
com
mon
mod
el0.
264
(2)
0.49
5 (2
)
Behav Genet. Author manuscript; available in PMC 2016 July 27.
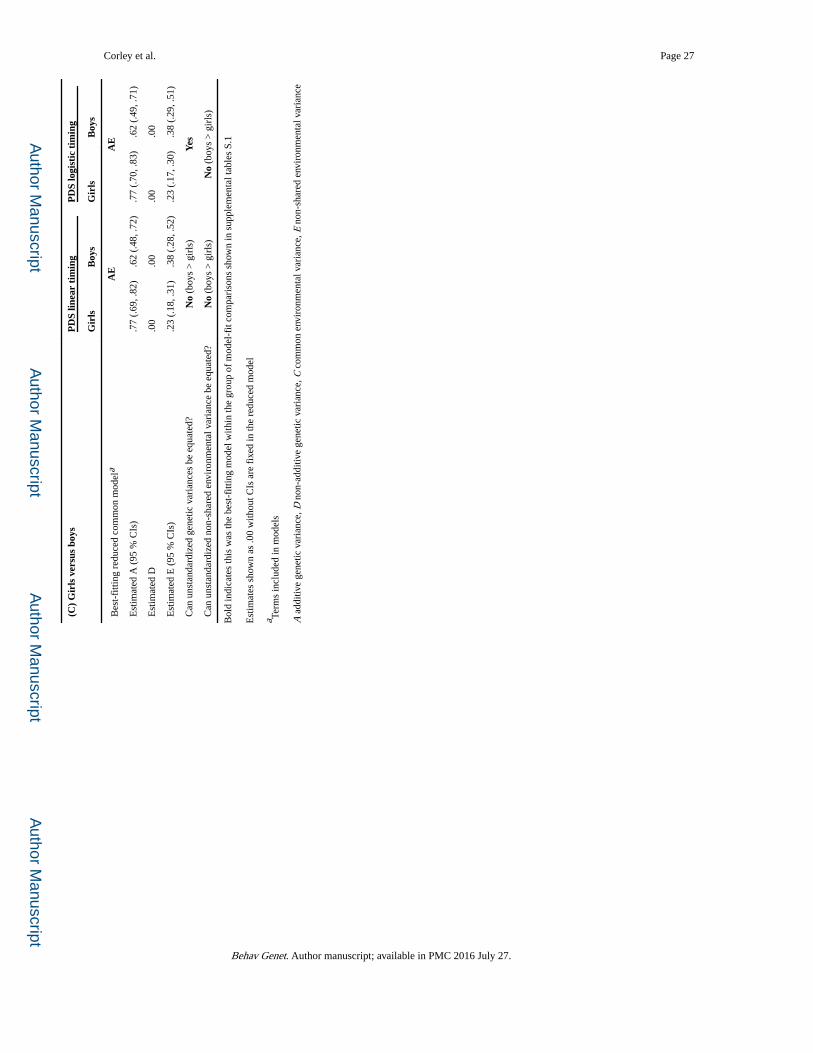
Author M
anuscriptA
uthor Manuscript
Author M
anuscriptA
uthor Manuscript
Corley et al. Page 27
(C)
Gir
ls v
ersu
s bo
ysP
DS
linea
r ti
min
gP
DS
logi
stic
tim
ing
Gir
lsB
oys
Gir
lsB
oys
Bes
t-fi
tting
red
uced
com
mon
mod
ela
AE
AE
Est
imat
ed A
(95
% C
Is)
.77
(.69
, .82
).6
2 (.
48, .
72)
.77
(.70
, .83
).6
2 (.
49, .
71)
Est
imat
ed D
.00
.00
.00
.00
Est
imat
ed E
(95
% C
Is)
.23
(.18
, .31
).3
8 (.
28, .
52)
.23
(.17
, .30
).3
8 (.
29, .
51)
Can
uns
tand
ardi
zed
gene
tic v
aria
nces
be
equa
ted?
No
(boy
s >
gir
ls)
Yes
Can
uns
tand
ardi
zed
non-
shar
ed e
nvir
onm
enta
l var
ianc
e be
equ
ated
?N
o (b
oys
> g
irls
)N
o (b
oys
> g
irls
)
Bol
d in
dica
tes
this
was
the
best
-fitt
ing
mod
el w
ithin
the
grou
p of
mod
el-f
it co
mpa
riso
ns s
how
n in
sup
plem
enta
l tab
les
S.1
Est
imat
es s
how
n as
.00
with
out C
Is a
re f
ixed
in th
e re
duce
d m
odel
a Term
s in
clud
ed in
mod
els
A a
dditi
ve g
enet
ic v
aria
nce,
D n
on-a
dditi
ve g
enet
ic v
aria
nce,
C c
omm
on e
nvir
onm
enta
l var
ianc
e, E
non
-sha
red
envi
ronm
enta
l var
ianc
e
Behav Genet. Author manuscript; available in PMC 2016 July 27.
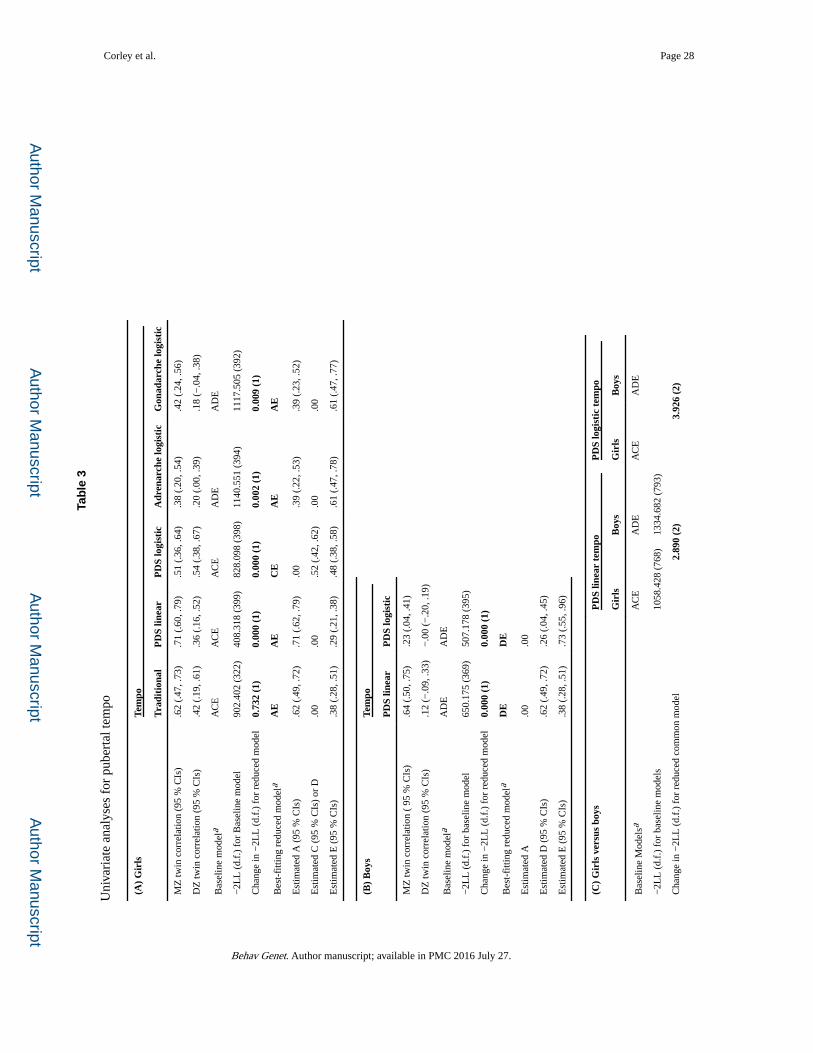
Author M
anuscriptA
uthor Manuscript
Author M
anuscriptA
uthor Manuscript
Corley et al. Page 28
Tab
le 3
Uni
vari
ate
anal
yses
for
pub
erta
l tem
po
(A)
Gir
lsTe
mpo
Tra
diti
onal
PD
S lin
ear
PD
S lo
gist
icA
dren
arch
e lo
gist
icG
onad
arch
e lo
gist
ic
MZ
twin
cor
rela
tion
(95
% C
Is)
.62
(.47
, .73
).7
1 (.
60, .
79)
.51
(.36
, .64
).3
8 (.
20, .
54)
.42
(.24
, .56
)
DZ
twin
cor
rela
tion
(95
% C
Is)
.42
(.19
, .61
).3
6 (.
16, .
52)
.54
(.38
, .67
).2
0 (.
00, .
39)
.18
(−.0
4, .3
8)
Bas
elin
e m
odel
aA
CE
AC
EA
CE
AD
EA
DE
−2L
L (
d.f.
) fo
r B
asel
ine
mod
el90
2.40
2 (3
22)
408.
318
(399
)82
8.09
8 (3
98)
1140
.551
(39
4)11
17.5
05 (
392)
Cha
nge
in −
2LL
(d.
f.)
for
redu
ced
mod
el0.
732
(1)
0.00
0 (1
)0.
000
(1)
0.00
2 (1
)0.
009
(1)
Bes
t-fi
tting
red
uced
mod
ela
AE
AE
CE
AE
AE
Est
imat
ed A
(95
% C
Is)
.62
(.49
, .72
).7
1 (.
62, .
79)
.00
.39
(.22
, .53
).3
9 (.
23, .
52)
Est
imat
ed C
(95
% C
Is)
or D
.00
.00
.52
(.42
, .62
).0
0.0
0
Est
imat
ed E
(95
% C
Is)
.38
(.28
, .51
).2
9 (.
21, .
38)
.48
(.38
, .58
).6
1 (.
47, .
78)
.61
(.47
, .77
)
(B)
Boy
sTe
mpo
PD
S lin
ear
PD
S lo
gist
ic
MZ
twin
cor
rela
tion
( 95
% C
Is)
.64
(.50
, .75
).2
3 (.
04, .
41)
DZ
twin
cor
rela
tion
(95
% C
Is)
.12
(−.0
9, .3
3)−
.00
(−.2
0, .1
9)
Bas
elin
e m
odel
aA
DE
AD
E
−2L
L (
d.f.
) fo
r ba
selin
e m
odel
650.
175
(369
)50
7.17
8 (3
95)
Cha
nge
in −
2LL
(d.
f.)
for
redu
ced
mod
el0.
000
(1)
0.00
0 (1
)
Bes
t-fi
tting
red
uced
mod
ela
DE
DE
Est
imat
ed A
.00
.00
Est
imat
ed D
(95
% C
Is)
.62
(.49
, .72
).2
6 (.
04, .
45)
Est
imat
ed E
(95
% C
Is)
.38
(.28
, .51
).7
3 (.
55, .
96)
(C)
Gir
ls v
ersu
s bo
ysP
DS
linea
r te
mpo
PD
S lo
gist
ic t
empo
Gir
lsB
oys
Gir
lsB
oys
Bas
elin
e M
odel
saA
CE
AD
EA
CE
AD
E
−2L
L (
d.f.
) fo
r ba
selin
e m
odel
s10
58.4
28 (
768)
1334
.682
(79
3)
Cha
nge
in −
2LL
(d.
f.)
for
redu
ced
com
mon
mod
el2.
890
(2)
3.92
6 (2
)
Behav Genet. Author manuscript; available in PMC 2016 July 27.
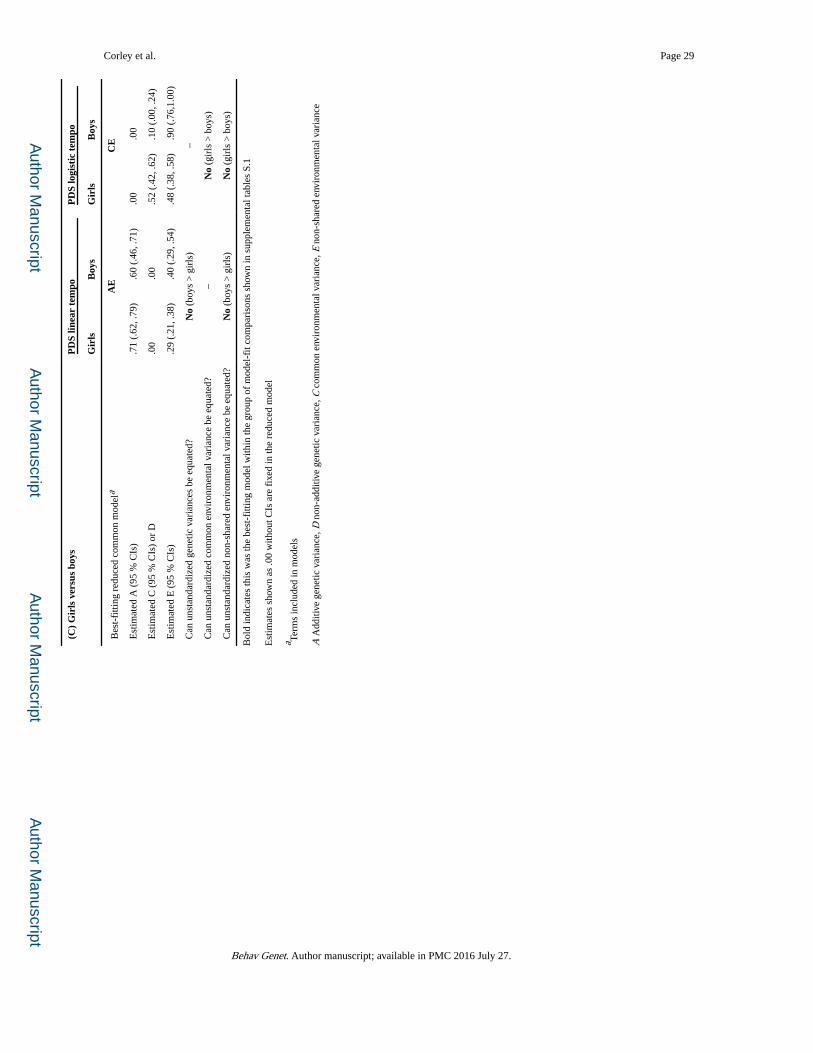
Author M
anuscriptA
uthor Manuscript
Author M
anuscriptA
uthor Manuscript
Corley et al. Page 29
(C)
Gir
ls v
ersu
s bo
ysP
DS
linea
r te
mpo
PD
S lo
gist
ic t
empo
Gir
lsB
oys
Gir
lsB
oys
Bes
t-fi
tting
red
uced
com
mon
mod
ela
AE
CE
Est
imat
ed A
(95
% C
Is)
.71
(.62
, .79
).6
0 (.
46, .
71)
.00
.00
Est
imat
ed C
(95
% C
Is)
or D
.00
.00
.52
(.42
, .62
).1
0 (.
00, .
24)
Est
imat
ed E
(95
% C
Is)
.29
(.21
, .38
).4
0 (.
29, .
54)
.48
(.38
, .58
).9
0 (.
76,1
.00)
Can
uns
tand
ardi
zed
gene
tic v
aria
nces
be
equa
ted?
No
(boy
s >
gir
ls)
–
Can
uns
tand
ardi
zed
com
mon
env
iron
men
tal v
aria
nce
be e
quat
ed?
–N
o (g
irls
> b
oys)
Can
uns
tand
ardi
zed
non-
shar
ed e
nvir
onm
enta
l var
ianc
e be
equ
ated
?N
o (b
oys
> g
irls
)N
o (g
irls
> b
oys)
Bol
d in
dica
tes
this
was
the
best
-fitt
ing
mod
el w
ithin
the
grou
p of
mod
el-f
it co
mpa
riso
ns s
how
n in
sup
plem
enta
l tab
les
S.1
Est
imat
es s
how
n as
.00
with
out C
Is a
re f
ixed
in th
e re
duce
d m
odel
a Term
s in
clud
ed in
mod
els
A A
dditi
ve g
enet
ic v
aria
nce,
D n
on-a
dditi
ve g
enet
ic v
aria
nce,
C c
omm
on e
nvir
onm
enta
l var
ianc
e, E
non
-sha
red
envi
ronm
enta
l var
ianc
e
Behav Genet. Author manuscript; available in PMC 2016 July 27.
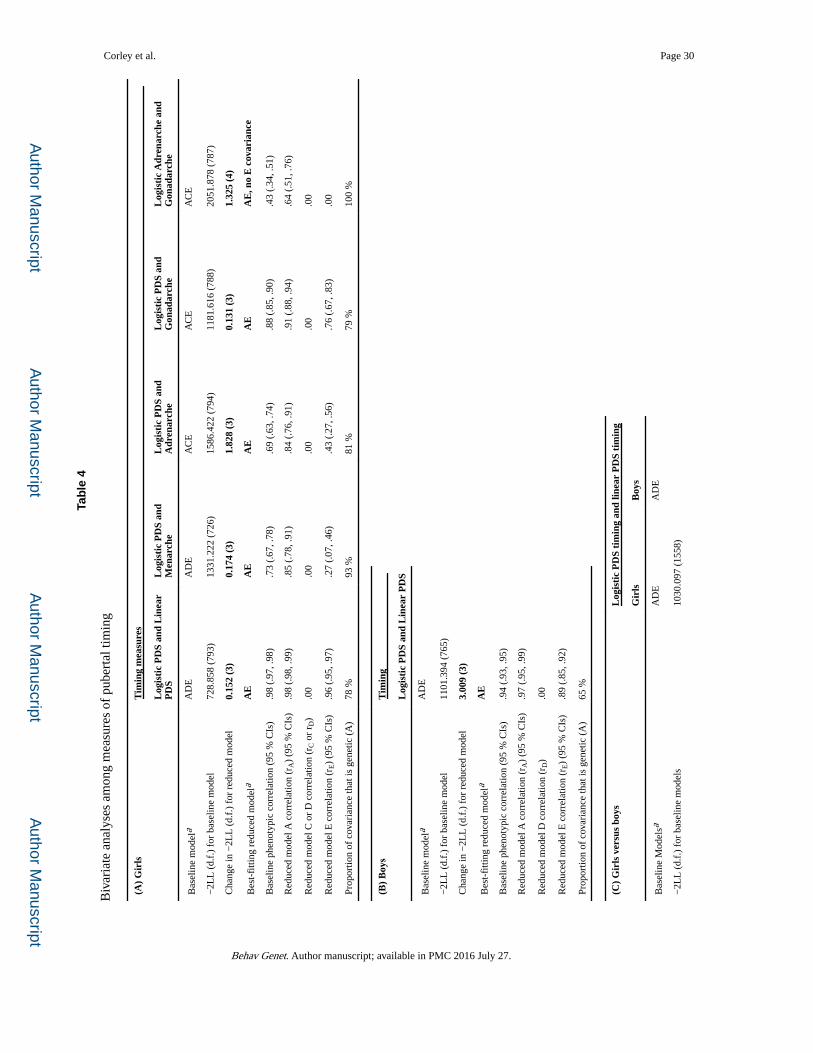
Author M
anuscriptA
uthor Manuscript
Author M
anuscriptA
uthor Manuscript
Corley et al. Page 30
Tab
le 4
Biv
aria
te a
naly
ses
amon
g m
easu
res
of p
uber
tal t
imin
g
(A)
Gir
lsT
imin
g m
easu
res
Log
isti
c P
DS
and
Lin
ear
PD
SL
ogis
tic
PD
S an
d M
enar
che
Log
isti
c P
DS
and
Adr
enar
che
Log
isti
c P
DS
and
Gon
adar
che
Log
isti
c A
dren
arch
e an
d G
onad
arch
e
Bas
elin
e m
odel
aA
DE
AD
EA
CE
AC
EA
CE
−2L
L (
d.f.
) fo
r ba
selin
e m
odel
728.
858
(793
)13
31.2
22 (
726)
1586
.422
(79
4)11
81.6
16 (
788)
2051
.878
(78
7)
Cha
nge
in −
2LL
(d.
f.)
for
redu
ced
mod
el0.
152
(3)
0.17
4 (3
)1.
828
(3)
0.13
1 (3
)1.
325
(4)
Bes
t-fi
tting
red
uced
mod
ela
AE
AE
AE
AE
AE
, no
E c
ovar
ianc
e
Bas
elin
e ph
enot
ypic
cor
rela
tion
(95
% C
Is)
.98
(.97
, .98
).7
3 (.
67, .
78)
.69
(.63
, .74
).8
8 (.
85, .
90)
.43
(.34
, .51
)
Red
uced
mod
el A
cor
rela
tion
(rA
) (9
5 %
CIs
).9
8 (.
98, .
99)
.85
(.78
, .91
).8
4 (.
76, .
91)
.91
(.88
, .94
).6
4 (.
51, .
76)
Red
uced
mod
el C
or
D c
orre
latio
n (r
C o
r r D
).0
0.0
0.0
0.0
0.0
0
Red
uced
mod
el E
cor
rela
tion
(rE)
(95
% C
Is)
.96
(.95
, .97
).2
7 (.
07, .
46)
.43
(.27
, .56
).7
6 (.
67, .
83)
.00
Prop
ortio
n of
cov
aria
nce
that
is g
enet
ic (
A)
78 %
93 %
81 %
79 %
100
%
(B)
Boy
sT
imin
g
Log
isti
c P
DS
and
Lin
ear
PD
S
Bas
elin
e m
odel
aA
DE
−2L
L (
d.f.
) fo
r ba
selin
e m
odel
1101
.394
(76
5)
Cha
nge
in −
2LL
(d.
f.)
for
redu
ced
mod
el3.
009
(3)
Bes
t-fi
tting
red
uced
mod
ela
AE
Bas
elin
e ph
enot
ypic
cor
rela
tion
(95
% C
Is)
.94
(.93
, .95
)
Red
uced
mod
el A
cor
rela
tion
(rA
) (9
5 %
CIs
).9
7 (.
95, .
99)
Red
uced
mod
el D
cor
rela
tion
(rD
).0
0
Red
uced
mod
el E
cor
rela
tion
(rE)
(95
% C
Is)
.89
(.85
, .92
)
Prop
ortio
n of
cov
aria
nce
that
is g
enet
ic (
A)
65 %
(C)
Gir
ls v
ersu
s bo
ysL
ogis
tic
PD
S ti
min
g an
d lin
ear
PD
S ti
min
g
Gir
lsB
oys
Bas
elin
e M
odel
saA
DE
AD
E
−2L
L (
d.f.
) fo
r ba
selin
e m
odel
s10
30.0
97 (
1558
)
Behav Genet. Author manuscript; available in PMC 2016 July 27.
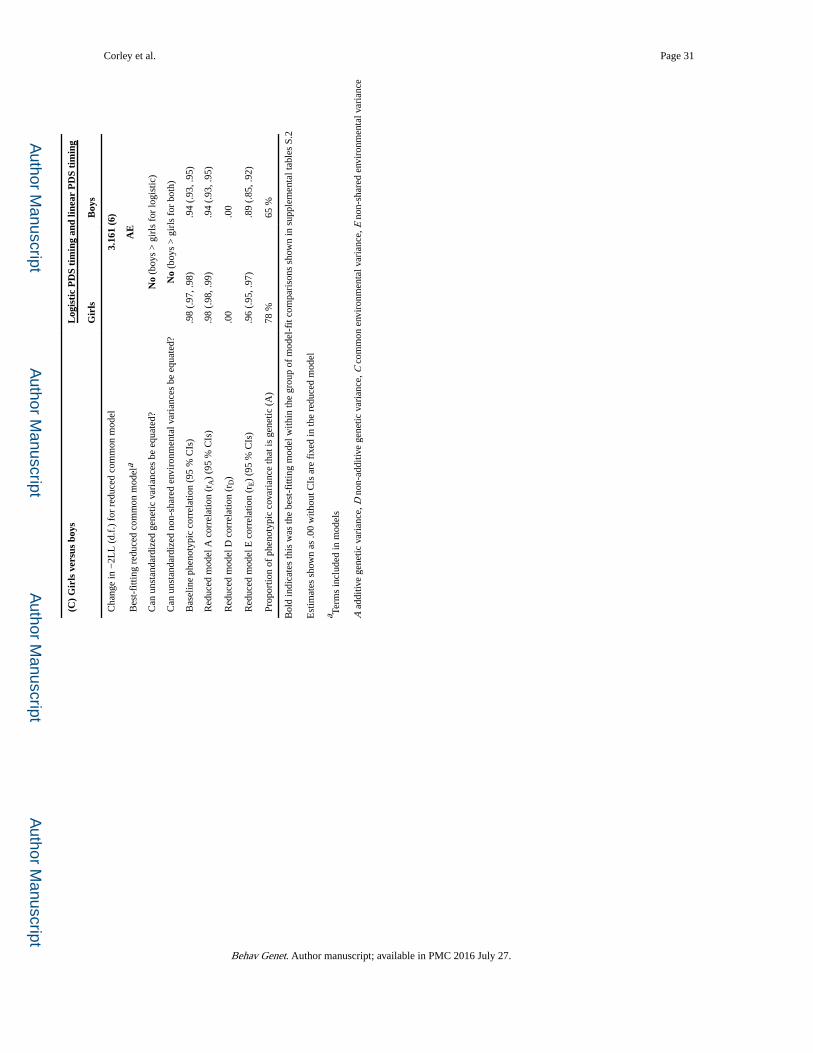
Author M
anuscriptA
uthor Manuscript
Author M
anuscriptA
uthor Manuscript
Corley et al. Page 31
(C)
Gir
ls v
ersu
s bo
ysL
ogis
tic
PD
S ti
min
g an
d lin
ear
PD
S ti
min
g
Gir
lsB
oys
Cha
nge
in −
2LL
(d.
f.)
for
redu
ced
com
mon
mod
el3.
161
(6)
Bes
t-fi
tting
red
uced
com
mon
mod
ela
AE
Can
uns
tand
ardi
zed
gene
tic v
aria
nces
be
equa
ted?
No
(boy
s >
gir
ls f
or lo
gist
ic)
Can
uns
tand
ardi
zed
non-
shar
ed e
nvir
onm
enta
l var
ianc
es b
e eq
uate
d?N
o (b
oys
> g
irls
for
bot
h)
Bas
elin
e ph
enot
ypic
cor
rela
tion
(95
% C
Is)
.98
(.97
, .98
).9
4 (.
93, .
95)
Red
uced
mod
el A
cor
rela
tion
(rA
) (9
5 %
CIs
).9
8 (.
98, .
99)
.94
(.93
, .95
)
Red
uced
mod
el D
cor
rela
tion
(rD
).0
0.0
0
Red
uced
mod
el E
cor
rela
tion
(rE)
(95
% C
Is)
.96
(.95
, .97
).8
9 (.
85, .
92)
Prop
ortio
n of
phe
noty
pic
cova
rian
ce th
at is
gen
etic
(A
)78
%65
%
Bol
d in
dica
tes
this
was
the
best
-fitt
ing
mod
el w
ithin
the
grou
p of
mod
el-f
it co
mpa
riso
ns s
how
n in
sup
plem
enta
l tab
les
S.2
Est
imat
es s
how
n as
.00
with
out C
Is a
re f
ixed
in th
e re
duce
d m
odel
a Term
s in
clud
ed in
mod
els
A a
dditi
ve g
enet
ic v
aria
nce,
D n
on-a
dditi
ve g
enet
ic v
aria
nce,
C c
omm
on e
nvir
onm
enta
l var
ianc
e, E
non
-sha
red
envi
ronm
enta
l var
ianc
e
Behav Genet. Author manuscript; available in PMC 2016 July 27.
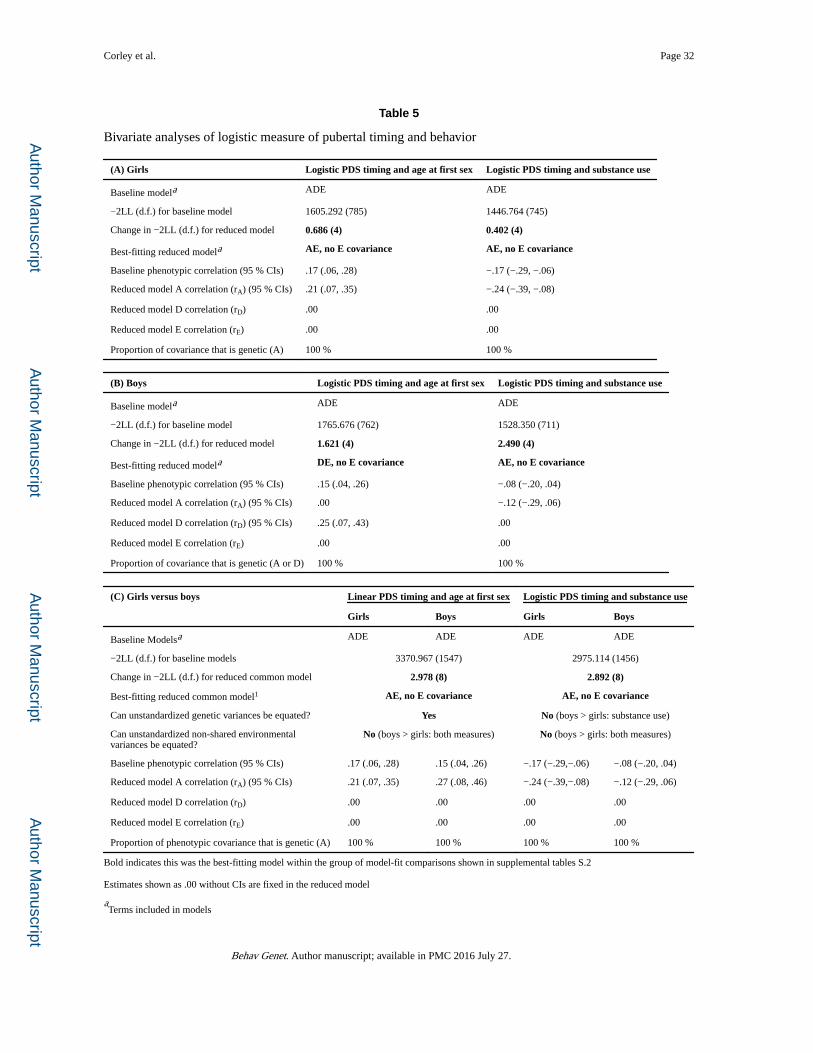
Author M
anuscriptA
uthor Manuscript
Author M
anuscriptA
uthor Manuscript
Corley et al. Page 32
Table 5
Bivariate analyses of logistic measure of pubertal timing and behavior
(A) Girls Logistic PDS timing and age at first sex Logistic PDS timing and substance use
Baseline modela ADE ADE
−2LL (d.f.) for baseline model 1605.292 (785) 1446.764 (745)
Change in −2LL (d.f.) for reduced model 0.686 (4) 0.402 (4)
Best-fitting reduced modela AE, no E covariance AE, no E covariance
Baseline phenotypic correlation (95 % CIs) .17 (.06, .28) −.17 (−.29, −.06)
Reduced model A correlation (rA) (95 % CIs) .21 (.07, .35) −.24 (−.39, −.08)
Reduced model D correlation (rD) .00 .00
Reduced model E correlation (rE) .00 .00
Proportion of covariance that is genetic (A) 100 % 100 %
(B) Boys Logistic PDS timing and age at first sex Logistic PDS timing and substance use
Baseline modela ADE ADE
−2LL (d.f.) for baseline model 1765.676 (762) 1528.350 (711)
Change in −2LL (d.f.) for reduced model 1.621 (4) 2.490 (4)
Best-fitting reduced modela DE, no E covariance AE, no E covariance
Baseline phenotypic correlation (95 % CIs) .15 (.04, .26) −.08 (−.20, .04)
Reduced model A correlation (rA) (95 % CIs) .00 −.12 (−.29, .06)
Reduced model D correlation (rD) (95 % CIs) .25 (.07, .43) .00
Reduced model E correlation (rE) .00 .00
Proportion of covariance that is genetic (A or D) 100 % 100 %
(C) Girls versus boys Linear PDS timing and age at first sex Logistic PDS timing and substance use
Girls Boys Girls Boys
Baseline Modelsa ADE ADE ADE ADE
−2LL (d.f.) for baseline models 3370.967 (1547) 2975.114 (1456)
Change in −2LL (d.f.) for reduced common model 2.978 (8) 2.892 (8)
Best-fitting reduced common model1 AE, no E covariance AE, no E covariance
Can unstandardized genetic variances be equated? Yes No (boys > girls: substance use)
Can unstandardized non-shared environmental variances be equated?
No (boys > girls: both measures) No (boys > girls: both measures)
Baseline phenotypic correlation (95 % CIs) .17 (.06, .28) .15 (.04, .26) −.17 (−.29,−.06) −.08 (−.20, .04)
Reduced model A correlation (rA) (95 % CIs) .21 (.07, .35) .27 (.08, .46) −.24 (−.39,−.08) −.12 (−.29, .06)
Reduced model D correlation (rD) .00 .00 .00 .00
Reduced model E correlation (rE) .00 .00 .00 .00
Proportion of phenotypic covariance that is genetic (A) 100 % 100 % 100 % 100 %
Bold indicates this was the best-fitting model within the group of model-fit comparisons shown in supplemental tables S.2
Estimates shown as .00 without CIs are fixed in the reduced model
aTerms included in models
Behav Genet. Author manuscript; available in PMC 2016 July 27.

Author M
anuscriptA
uthor Manuscript
Author M
anuscriptA
uthor Manuscript
Corley et al. Page 33
A additive genetic variance, D non-additive genetic variance, C common environmental variance, E non-shared environmental variance
Behav Genet. Author manuscript; available in PMC 2016 July 27.