genetic polymorphism of bovine growth hormone
TRANSCRIPT

i
Genetic polymorphism of bovine growth hormone
(somatotropin), kappa-casein and beta-
lactoglobulin genes
By
Muhammad Naeem Riaz
School of Biotechnology,
National Institute for Biotechnology and Genetic
Engineering (NIBGE), Faisalabad &
Quaid-I-Azam University, Islamabad, PAKISTAN
2013

ii
"In the name of Allah, most Gracious, most Compassionate"
iii
Genetic polymorphism of bovine growth hormone
(somatotropin), kappa-casein and beta-
lactoglobulin genes
A dissertation submitted for partial fulfillment of the degree of
DOCTOR OF PHILOSOPHY
IN
BIOTECHNOLOGY
By
Muhammad Naeem Riaz
School of Biotechnology,
National Institute for Biotechnology and Genetic
Engineering (NIBGE), Faisalabad &
Quaid-I-Azam University, Islamabad, PAKISTAN
2013

iv
Declaration
I hereby declare that the work presented in the following thesis is my own
effort, except where otherwise acknowledged, and that the thesis is my
own composition. No part of this thesis has been previously presented for
any other degree.
Muhammad Naeem Riaz
v
TO
My beloved parents
vi
CERTIFICATE
This thesis has been accepted in its present form submitted by Mr.
Muhammad Naeem Riaz (Registration no. 1446-NIBGE/Ph.D-2004) at
National Institute for Biotechnology and Genetic Engineering (NIBGE),
School of Biotechnology, Quaid-i-Azam University, Islamabad, for the final
requirement of the degree of “Doctor of Philosophy in Biotechnology”.
Supervisor _________________
Dr. Javed Anver Qureshi
External Examiner-I _________________
Prof. Dr. Abdul Rauf Shakoori
External Examiner-II _________________
Prof. Dr. Mahmood Ahmad
Director/ Chairman _________________
Dr. Sohail Hameed
Dated: _________________
vii
TABLE OF CONTENTS
Sr. No Contents Page No
CHAPTER 1 INTRODUCTION & REVIEW OF LITERATURE
1 Buffalo 3
1.1 Nili-Ravi buffalo 3
1.2
Cattle breeds 4
1.3
Genetic variability in the indigenous bovine breeds 8
1.4
Polymorphism 9
1.4.1
Polymorphism detection at protein level 10
1.4.2
Polymorphism detection at DNA level 11
1.5
Polymerase chain reaction (PCR) 14
1.6
Methods for analysis of genetic variations 15
1.6.1
Genotyping / polymorphism detection methods 17
1.6.2
Restriction fragment length polymorphism (RFLP) 17
1.6.3
Nucleotide sequencing 18
1.7
Bovine growth hormone 18
1.7.1
Organization of bovine growth hormone gene (bGH) 18
1.7.2
Polymorphism in bovine growth hormone gene 20
1.8
Milk Proteins 23
1.8.1
Casein genes 24

viii
1.8.2
Organization of kappa-casein gene 24
1.8.3
Polymorphism of kappa-casein gene 27
1.9
Beta-lactoglobulin 31
1.9.1
Organization of beta-lactoglobulin gene 32
1.9.2
Beta-lactoglobulin gene polymorphism 33
1.10
Aims / objectives 35
CHAPTER 2 MATERIALS AND METHODS
2
Chemicals and reagents 37
2.1
Animals 37
2.2
Collection of blood samples 38
2.2.1
DNA Extraction 38
2.2.1a
Phenol chloroform method 38
2.2.2
Concentration and quality of extracted DNA 39
2.3
Primers /oligonucleotides 39
2.4
Polymerase chain reaction (PCR) 40
2.4.1
Amplification of bovine growth hormone gene fragment 41
2.4.2
Amplification of -CN gene fragment 42
2.4.3
Amplification of beta-lactoglobulin gene fragment 43
2.4.4
Gel electrophoresis 44
2.4.5
Purification of amplified PCR products 44
2.5
PCR-RFLP Genotype assay 44

ix
2.5.1
Bovine growth hormone gene 45
2.5.2
Bovine kappa-casein gene 46
2.5.3
Bovine beta-lactoglobulin gene 47
2.6
Allele frequencies estimation 49
2.7
DNA sequencing 50
2.7.1
Distance tree analysis 50
CHAPTER 3 RESULTS
3.1
Purity of extracted DNA 51
3.2
Polymerase chain reaction analysis 52
3.2.1 Amplification of bovine growth hormone gene 52
3.2.2 Amplification of bovine kappa-casein gene 53
3.2.3
Amplification bovine beta-lactoglobulin gene 54
3.3
Genotyping studies by PCR-RFLP analysis 55
3.3.1
Bovine growth hormone gene polymorphism 55
3.3.2
Bovine kappa-casein gene polymorphism 59
3.3.3
Bovine beta-lactoglobulin gene polymorphism 67
3.3.3.1
Buffalo 67
3.3.3.2
Cattle breeds 69
3.3.3.3
Gene frequencies 69
3.4
DNA sequencing 72
3.4.1
Bovine growth hormone gene 72

x
3.4.2
Bovine kappa-casein gene 75
3.4.3
Bovine beta-lactoglobulin gene 79
CHAPTER 4 DISCUSSION
4.1
Genotyping / polymorphism of bovine growth hormone gene 84
4.2
Genotyping / polymorphism of bovine kappa-casein gene 89
4.3
Genotyping / polymorphism of bovine beta-lactoglobulin gene 93
4.4
Sequencing and BLAST analysis of bovine growth hormone
gene 96
4.5
Sequencing and BLAST analysis of bovine kappa-casein gene 98
4.6
Sequencing and BLAST analysis of bovine beta-lactoglobulin
gene 98
CONCLUSIONS 101
REFERENCES 103
APPENDICES 122
APPENDIX-I 122
APPENDIX-II 123
APPENDIX-III 126
APPENDIX-IV 129
APPENDIX-V 132
APPENDIX-VI 134
APPENDIX-VII 135
xi
ACKNOWLEDGEMENTS
All praise to almighty Allah, the creator, the dominant, the most supreme, the self-
existing and all sustaining, whose grace and mercy enabled me to accomplish this piece
of work by sacredness of Holly Prophet Muhammad (PBUH) who is forever, an entire
source of guidance and knowledge for humanity.
I gratefully acknowledge Director, NIBGE Dr. Sohail Hameed for providing me smooth
environment and all the research facilities.
I would like to pay ineffable gratitude and deepest thanks to my worthy supervisor Dr.
Javed Anver Qureshi, Ex. Deputy Chief Scientist, Health Biotechnology Division for
his inestimable counsel, captivating attitude in the procedural matters and suggestions
throughout my research work. I learned a lot of from him and no acknowledgement could
ever adequately express my obligation whose amicable behavior has been invaluable
throughout my PhD study.
I wish to express my deep debt of gratitude to Dr. Shahid Mahmood Baig (Head, Health
Biotechnology Division) for his skilful professional guidance and whose presence was
always a self-motivating factor for me. It is an opportunity for me to express my deepest
gratitude to all the respected members of Health Biotechnology Division, especially to
Dr. Rubina Tabassum (PS), Dr. Abdul Haque (PS), Dr. Fazle Rabbi (SS), Dr.
Aayesha Tariq (SMO).
Very special thanks to Mr. Naveed Altaf Malik (SS) for his motivational attitude,
supervision and valuable guidance throughout of my stay at NIBGE.
I feel immense pleasure to express my deepest gratitude and sincere thanks to all my lab
fellows, especially Ms. Fozia Nasreen, who always motivated me in a positive way to
complete this task. I would also like to thanks Mr. Imran riaz, Umar, Ghaffar and Ihsan
for their fantastic and memorable company during the whole period. My special thanks
are reserved for all other members of HBD, Dr. Aamir, Dr. Farooq, Dr. Mashkoor and
Aysha Azhar for their friendly behavior and technical assistance.

xii
I am thankful to Pakistan Atomic Energy Commission (PAEC); National Institute for
Biotechnology and Genetic Engineering (NIBGE), Livestock Research stations and
people from these institutions and Higher Education Commission (HEC) for providing
funding and space for the completion of this study.
There is a long list of my friends and colleagues Mian Muhammad Ajmal, Zafar, Abbas,
and Shakeel who helped and cooperated in various ways for and provided a lively
atmosphere to work, I wish to extend my sincere gratitude and appreciation to all of
them.
Lastly and most importantly, I would like to thank my parents who raised me with a love
and supported me during the entire pursuit. I am also thankful to my brother, sister and
off course my wife and sweat daughter and son for all their support, love and
encouragement throughout the period.
Muhammad Naeem Riaz

xiii
LIST OF FIGURES
Sr. No Title Page No
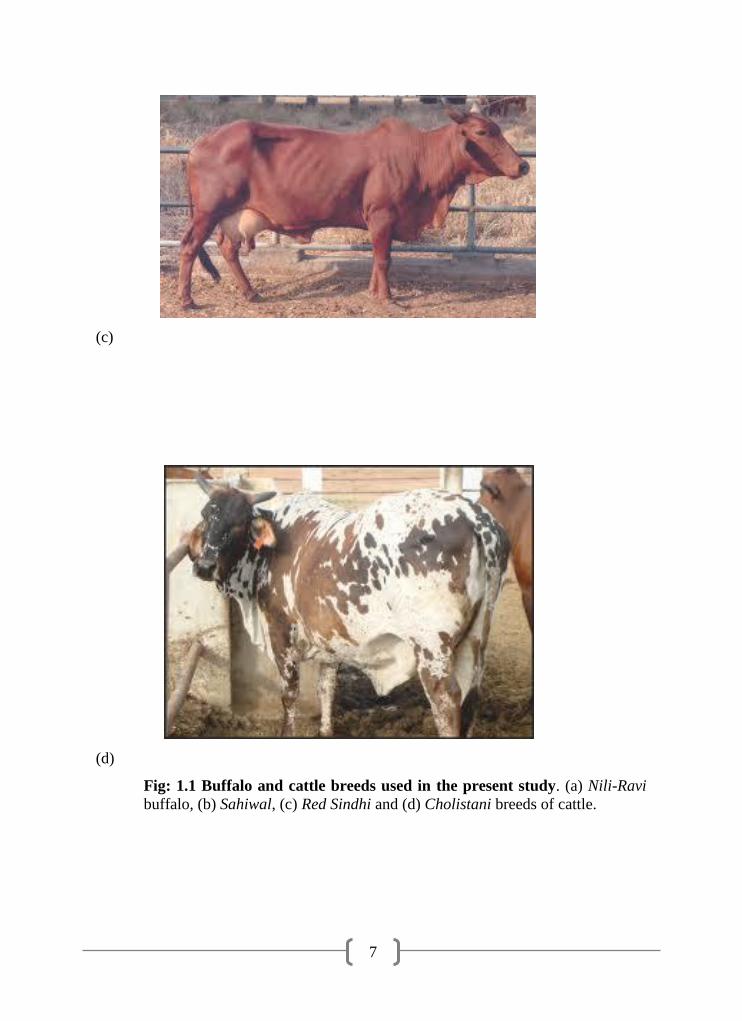
1.1 Buffalo and cattle breeds used in the present study. (a) Nili-Ravi
buffalo (b) Sahiwal (c) Red Sindhi and (d) Cholistani breeds of
cattle
7
1.2 Genomic organization of bGH gene and AluI restriction site (L-V) 20
1.3 Genomic organization of casein locus (boxes shows four casein
encoding genes)
26
1.4 Structure of κ-CN gene. Exons 1-5 are depicted as boxes green (5’
and 3’ untranslated regions) white (part of exons encoding the signal
peptide), dark green (part of exons encoding the mature protein).
26
1.5 Genomic organization of β-LG gene (showing exons I to VII) 33
3.1 Analysis of genomic DNA extracted from blood samples on 0.8 %
agarose gel
51
3.2 Analysis of amplified product of bGH (4th
intron & 5th
exon) on 1.8
% agarose gel
52
3.3 Analysis of amplified product of -CN gene (exon-IV) on 1.8 %
agarose gel
53
3.4 Analysis of amplified product of beta-lactoglobulin (β-LG) gene (4th
exon & 4th
intron) on 1.8 % agarose gel
54
3.5 Analysis of restricted product of bovine growth hormone (bGH)
gene (4th
intron & 5th
exon) of Nili-Ravi buffaloes using AluI
restriction endonuclease on 2.5 % agarose gel
55
3.6 Analysis of restricted product of bovine growth hormone (bGH)
gene (4th
intron & 5th
exon) of cattle breeds using AluI restriction
endonuclease on 2.5% agarose gel
56
3.7 Frequency distribution of bGH genotypes in Nili-Ravi buffaloes and
Sahiwal, Cholistani and Red Sindhi cattle
58
3.8 Analysis of restricted product of -CN gene (exon-IV) (Nili-Ravi
buffaloes) showing BB genotypes on 2.5 % agarose gel with HinfI
restriction endonuclease
60
3.9 Analysis of restricted product of -CN gene from cattle breeds
showing AA and AB genotypes (exon-IV) on 2 % agarose gel with
HinfI restriction endonuclease
62
3.10 Analysis of restricted product of -CN gene (exon-IV) with HaeIII
restriction endonuclease on 2 % agarose gel
63
xiv
3.11 Analysis of restricted product of -CN gene (exon-IV) with MaeII
restriction endonuclease on 2 % agarose gel
64
3.12 Frequency distribution of κ-CN genotypes in buffalo and cattle
breeds
66
3.13 Analysis of restricted product of beta-lactoglobulin (β-LG) gene (4th
exon & 4th
intron) of Nili-Ravi buffaloes showing AA genotype on 2
% agarose gel with HaeIII restriction endonuclease
68
3.14 Analysis of restricted product of beta-lactoglobulin (β-LG) gene (4th
exon & 4th
intron) of Nili-Ravi buffaloes showing BB genotype on
2% agarose gel with HaeIII restriction endonuclease
68
3.15 Analysis of restricted product of beta-lactoglobulin (β-LG) gene (4th
exon & 4th
intron) of cattle breeds indicating AB and BB genotypes
with HaeIII restriction endonuclease on 2 % agarose gel
69
3.16 Frequency distribution of β-LG genotypes in Pakistani buffalo and
cattle breeds
71
3.17 Nucleotide and amino acid sequence of DNA from growth hormone
gene; A: represents nucleotide sequence along with restriction
enzyme site B: alignment of DNA sequence to amino acids
sequence
72
3.18 The homology comparison of BLAST analysis of partial sequence
of bGH (Nili-Ravi buffaloes) gene with a) Bubalus bubalis and b)
Bos Taurus
73
3.19 Distance tree analysis of bovine growth hormone gene sequence
indicates their maximum closeness with the Bubalus bubalis growth
hormone gene
74
3.20 Nucleotide and amino acid sequence of DNA from kappa-casein
gene; A: represents nucleotide sequence alongwith restriction
enzyme site B: alignment of DNA sequence to amino acids
sequence
75
3.21 The homology comparison of BLAST analysis of partial sequence
of -CN (Nili-Ravi buffaloes) gene with a) Bubalus bubalis and b)
Bos taurus
77
3.22 Distance tree analysis of bovine kappa-casein gene sequence
indicates their maximum closeness with the Bubalus bubalis kappa-
casein gene
78
3.23 Nucleotide and amino acid sequence of DNA from beta-
lactoglobulin gene; A: represents nucleotide sequence alongwith
restriction enzyme site B: alignment of DNA sequence to amino
acids sequence
79
3.24 The homology comparison of BLAST analysis of partial sequence
of β-LG (Nili-Ravi buffaloes) gene with a) Bubalus bubalis and b)
Bos Taurus
81
3.25 Distance tree analysis of bovine beta-lactoglobulin gene indicates 82

xv
their maximum closeness
xvi
LIST OF TABLES
Sr. No Title Page No
1.1 Molecular markers / candidate genes for quantitative traits in
Livestock
13
1.2 Methods for analysis of genetic variations 16
1.3 Association of genetic variants of bGH and DGAT1 loci with milk
production traits
23
1.4 Association of beta-casein, kappa-casein and beta-lactoglobulin
genetic variants with milk production traits
30
2.1 Primer used for the amplification of target sequence of bGH (GF &
GR), κ-CN (KF & KR) and β-LG (LF & LR) genes fragments
40
2.2 Temperature profile used for bGH gene amplification. 42
2.3 Temperature profile used for bovine κ-CN gene amplification 42
2.4 Temperature profile used for bovine β-LG gene amplification 43
2.5 DNA fragment sizes corresponding to the different bGH genotypes
after digestion of PCR amplified products
46
2.6 DNA fragment sizes for each genotypes of -CN locus after
digestion with HinfI, HaeIII and MaeII restriction enzymes
47
2.7 DNA fragment sizes corresponding to the different β-LG genotypes
after digestion of PCR amplified products
48
3.1 Genotypic and allelic frequencies of bGH gene among Nili-Ravi
buffaloes, Sahiwal, Cholistani and Red Sindhi cattle
57
3.2 Genotypic and allelic frequencies for -CN gene among Nili-Ravi
buffaloes and Sahiwal, Cholistani and Red Sindhi cattle
65
3.3 Genotypic and allelic frequencies of β-LG gene among Nili-Ravi
buffaloes and Sahiwal, Cholistani and Red Sindhi cattle
70
3.4 Breeds /animals with certain genes / genotypes 82
4.1 Bovine growth hormone (L/V) gene frequencies in Pakistani and
other cattle breeds of the world
88
4.2 Kappa-casein allelic frequencies found in the present study and in
other cattle breeds of the world
93

xvii
4.3 Beta-lactoglobulin allelic frequencies in various cattle breeds of the
world
96
4.4 Value of the X2 distribution 134

xviii
List of Abbreviations bp Base pair
dNTPs Deoxyribose nucleotide triphosphates
DEPC Diethyl pyrocarbonate
DNA Deoxyribonucleic acid
ELISA Enzyme linked immuno sorbent assay
Gm Gram
MAS Marker assisted selection
IFN Interferon
MW Molecular weight
ml Milliliter
PCR Polymerase chain reaction
RPM Revolutions per minute
RFLP Restriction fragment length polymorphism
TBE Tris borate EDTA
TE Tris EDTA
Taq Thermus aquaticus
UV Ultra violet
WHO World Health Organization

xix
ABSTRACT
Several breeds of buffalo and cattle in Pakistan show mark differences in the milk yield.
These animals are in a range of high milk producer to low. A proportion of these
differences are explained by the animal genetic make up. In the earlier studies, a number
of DNA polymorphisms have been reported in candidate genes. Among these few of
candidate genes studied in the present study, are bovine growth hormone (bGH), kappa-
casein (k-CN) and beta-lactoglobulin (B-LG) genes using PCR-RFLP methodology. Two
genetic variants (A and B) and three genotypes AA, AB and BB have been identified.
The genotyping of bovine growth hormone (bGH), kappa casein (-CN) and beta-
lactoglobulin (β-LG) alleles is of practical importance since bGH L, -CN A & B and β-
LG B alleles were found to be correlated with commercially valuable parameters.
Genotype information on 366 animals from four breeds including one buffalo and three
cattle breeds of Pakistan regarding polymorphisms located in the candidate genes was
compared to literature reports. The results from frequency analysis revealed minor
deviations from previous reports. Allele frequencies were calculated by gene counting
methodology which shows the high prevalence of bGH genotype LL among cattle, while
few animals had the LV variant and there was no VV variant was found. A Chi-Square
test analysis of studied population of Pakistani cattle for bGH gene indicated that the
studied population was in Hardy Weinberg equilibrium. Among cattle two alleles A and
B in two genotypic forms AA and AB were found for κ-CN gene fragment. The
frequency of allele A was found to be significantly higher in cattle whereas AB genotype
was more frequent in Sahiwal cattle. No BB genotype was detected in any of these cattle.
The Chi-Square test revealed that observed frequencies and those expected under Hary-
Weinberg were not significant at (P< 0.05), suggesting that Cholistani and Red Sindhi
population was in equilibrium for -CN locus, while animals of Sahiwal cattle were not
in Hary-Weinberg equilibrium. Analysis of β-LG gene, genotypes AA and BB were
detected and no AB genotype was found in the tested animals of Nili-Ravi buffaloes
xx
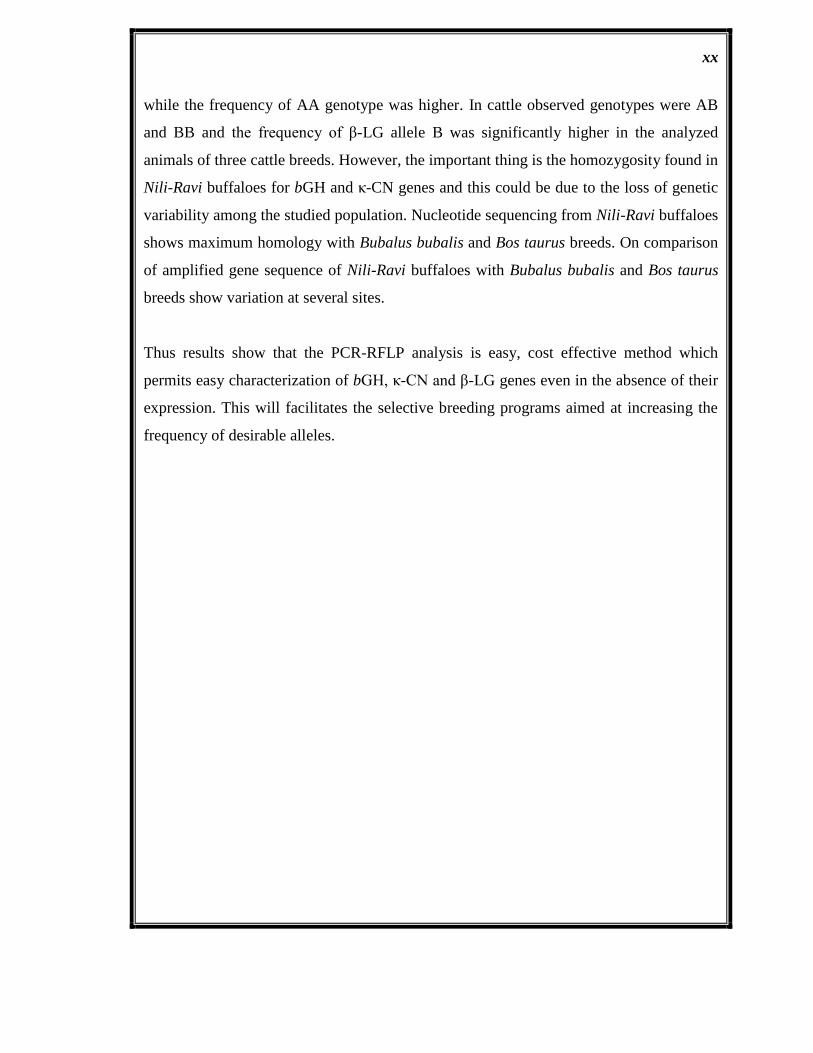
while the frequency of AA genotype was higher. In cattle observed genotypes were AB
and BB and the frequency of β-LG allele B was significantly higher in the analyzed
animals of three cattle breeds. However, the important thing is the homozygosity found in
Nili-Ravi buffaloes for bGH and κ-CN genes and this could be due to the loss of genetic
variability among the studied population. Nucleotide sequencing from Nili-Ravi buffaloes
shows maximum homology with Bubalus bubalis and Bos taurus breeds. On comparison
of amplified gene sequence of Nili-Ravi buffaloes with Bubalus bubalis and Bos taurus
breeds show variation at several sites.
Thus results show that the PCR-RFLP analysis is easy, cost effective method which
permits easy characterization of bGH, κ-CN and β-LG genes even in the absence of their
expression. This will facilitates the selective breeding programs aimed at increasing the
frequency of desirable alleles.
xxi
The work presented in this thesis is based on the following papers:
M. N. Riaz, N. A. Malik, F. Nasreen, J. A. Qureshi and S. U. Khan. Genetic
variability in the Kappa-casein gene in Sahiwal, Cholistani and Red Sindhi cattle
breeds. Int. J. dairy Technology, 64: 1471-0307.2011.00755.
M. N. RIAZ, M. THAIR, N. A. MALIK, F. NASREEN, S. SADAF and J. A.
QURESHI. Molecular analysis of bovine growth hormone gene polymorphism in
Nili-Ravi buffaloes of Pakistan. Pak. J. Zool. Suppl. ser., no.9, pp. 47-54, 2009.
M. N. Riaz, N. A. Malik, F. Nasreen and J. A. Qureshi. Molecular Marker
assisted study of -CN Gene in Nili-Ravi (Buffalo) breed of Pakistan. Pakistan
Vet. J. 2008, 28(3): 103-106.
Gene Bank Submissions
Bubalus bubalis breed Nili-Ravi growth hormone gene, exon 5 and partial cds
(FJ754322).
Bubalus bubalis breed Nili-Ravi kappa-casein gene, exon 4 and partial cds
(FJ770200).
1
CHAPTER 1
INTRODUCTION AND REVIEW OF LITERATURE
Economic return is a prime objective in any agriculture or dairy farming enterprise.
The ultimate goal to bring improvement in dairy segment is to identify an effective
and inexpensive ways of improving milk yield of a dairy herd. Genomic studies of
different candidate genes have raised significant research interest due to their
associations with economically valuable traits in dairy and beaf breeds.
At present, the Pakistan ranked number four in the world due to their annual milk
production, which is 47,951 million tons (GOP, 2011-12). Livestock is an important
part of Pakistan‟s economy that constitutes 55.1 % of agriculture value added and
having role about 11.5 % in the national GDP. Nearly 35-40 million people from the
rurual areas are involved in livestock rearing with a minimum number of 2-3 cattle/
buffaloes and 5-6 sheep/ goat in a family which help them to drive about 50 % of
their total income from these animals. Current economic gain from livestock sector
has significantly increased from 672 billion (GOP, 2010-11) to Rs. 700 billion (GOP,
2011-12); which is an overall increase of 4% than the previous year.
Buffalo and cattle are two important livestock species raised in current agricultural
systems in the country furnishing mankind with meat, milk and work power etc.
Despite some similarities with respect to morphologic and genetic characters, cattle
and buffalo are divergent evolutionarily and are classified as different genera within
the subfamily of Bovidae. The Nili-Ravi buffalo is recognized as an important breed
and an asset of country due to their good milk producing capability. The Nili-Ravi
buffaloes are popular not only as milk animal but also a source of beef production,
used for plowing paddy fields, transporting farm materials to market and lifting water
from wells etc. Among various cattle breeds of Pakistan, Sahiwal is also one of an

2
important dairy cattle breed. The breed is named after Sahiwal district which is part
of its home tract and famous for its good milk producing capacity, adaptability to
local environmental conditions and tick resistance etc (Ashfaq and Razzak, 2000).
The Cholistani and Red Sindhi cattle are also well recognized due to their good milk
producing potential and also used for meat and draught purposes etc.
Currently, selection of breeding stock involves the identification of candidate gene
variants and their subsequent incorporation into the breeding programs to produce the
future progeny. Biotechnology and genetic engineering tools have enabled scientists
to manipulate the genome of any organism for the sake of improvement. Now a days
polymorphic genes are being used as molecular markers for aimals selection.
Molecular markers can be used to identify the best alleles and the combination of best
alleles within a breed or among more than two breeds help in breeding programs will
favor the marker assisted selection.
Bovine and ovine genome is being analyzed internationaly to explore the genomic
variations in different breeds, so that these variations can be exploited for overall
improvement of productive traits in animals.
Since, Pakistan is blessed with diverse livestock genetic resources in the form of
buffalo, cattle, sheep and goat breeds. So, it is deemed important to trace out
indigenous buffalo and cattle genetic potential using molecular genetic approaches
and to characterize Pakistani bovine breeds at molecular level to improve milk yield
and quality. Thus, genomic information can be used to preserve the genetic material
of high yielding pure breeds, which could effectively be utilized in indigenous breed
improvement programs.
3
The literature on growth hormone and milk protein genes polymorphism in buffalo
and cattle breeds is extensive. Therefore related reviews articles are cited and the
pertinent literature is discussed in some details under the following headings.
1. Buffalo
Three types of buffalo, Cape buffalo of Africa, water buffalo of Middle East, and
swamp or marsh buffalo of Far East. All these buffaloes are different in thier
appearance, behaviors and temperament. But the buffalo found in the Indo-Pak
regions belongs to second type which is reverine or water buffalo. In Pakistan there
are two main types of buffalo breeds those are Nili-Ravi (Punjab) and Kundi (Sindh).
1.1 Nili-Ravi buffalo
The Nili-Ravi buffaloes constitute the main proportion of buffalo animals in Pakistan
and found mostly in canal-irrigated area of Punjab including Lahore, Faisalabad,
Okara, Sheikhupura, Sahiwal, Bahawalnagar, Multan and Bahawalpur districts of
Punjab. However, due to their well recognized dairy qualities, this breed is spread all
over the country. Historically, Nili and Ravi were considered two separate breeds as
described during 1941 by the Indian imperial council of agriculture. They have
derived their names from the blue (Nili) water of Satluj river and valley of Ravi river,
respectively.
With the passage of time and due to frequent movement of human and animals
resulting in the admixture of blood in varying proportions. Both the breeds therefore,
lost their unique characteristics and majority of animals of these breeds were
classified as neither as typical Nili nor as typical Ravi. During 1950s the Nili and Ravi
were considered one breed under the common name of Nili-Ravi.

4
The animals of Nili-Ravi buffaloes usually jet black in color and having white
colorations on forehead, face, muzzle, legs and tail switch. The body is massive and
barrel-shaped. The neck is long and thin in female while thick and powerful in male.
There is no dewlap and the umbilical fold is small. The legs are comparatively short.
The female is wedge-shaped. The average lactation yield is 2500-2700 liter per
lactation (Figure 1.1 a). The animals of Nili-Ravi buffaloes recognized as national
asset having major contribution regarding milk production in the country and
commonly named as the „balck gold‟ of the country.
1.2 Cattle breeds
The cattle breeds found in Pakistan and subcontinent belong to Zebu (humped) Bos
indicus type. While European cattle are non-humped type and belongs to the species
Bos taurus. Among various cattle breeds, the Sahiwal, Cholistani and Red Sindhi
breeds are well known internationally as tropical dairy breeds.
The Sahiwal is one of an important among cattle breeds found in various districts of
Punjab Sahiwal, Multan, Faisalabad and Okara etc. The sahiwal cattle is named after
the name of Sahiwal district, the part of its home tract. This is a medium size breed.
Females of sahiwal cattle have reddish dum colour while male are darker in colour.
Females are often dehorned. Skin is little bit loose and fine with a dewlap. The
animals of this breed has strong udder. Milk production is nearly 1500 to 2200 liter
per lactation. Due to its good milk producing potential and disease resistance i.e. the
animals of Sahiwal cattle is spread to many parts of world like Africa, Australia etc.
(FAO, 2007). The Sahiwal cattle is famous for its adaptability to local environment
particularly heat tolerance and tick resistance etc (Figure 1.1 b).

5
The Red Sindhi is another important cattle breed originated from hilly region called
“Mahal Kohistan” and spread in different arrears of Karachi, Thatta, and Dadu
districts of Sindh province and its home tract are also spread to other areas of Sindh
and Lasbela district in Balochistan. Due to its high milk yields and heat resistance,
this breed is also spread into many parts of world (Figure 1.1 c). The animals of Red
Sindhi cattle medium in size and having compact body structure. Head comparatively
larger in size with an occasional bulge in the forehead. The hump is well developed in
males. The hindquarters are curved and drooping, black tail switch and udder is
medium to larger in size. Milk yield is ranged from 1500-2000 liters per lactation.
Similarly, Cholistani is a multipurpose breed being used for milk, meat and draft
purposes. This breed is originated from Cholistan desert of Bahawalpur district. This
breed is also important due to tolerance of feed and water shortage (Figure 1.1 d).

6
(a)
(b)
7
(c)
(d)
Fig: 1.1 Buffalo and cattle breeds used in the present study. (a) Nili-Ravi
buffalo, (b) Sahiwal, (c) Red Sindhi and (d) Cholistani breeds of cattle.
8
1.3 Genetic variability in the indigenous bovine breeds
Genetic variability in the indigenous bovine breeds is an important subject bearing in
mind the necessity of preserving the actual raw material which perhaps a valuable
asset for future breeding requirements. It has always been remained a key issue, that
loss of genetic variability may be avoided or limitize because these resources may be
valuable for future breeding desires. Genetic variability at bovine growth hormone
and milk protein genes is important because variations in the genome lead to certain
genotypes affecting economic traits in animals and also serve as a tool for breed
characterization.
Quantitative traits loci (QTLs) are important due to their role in animal production.
Evaluation of these traits is based on the concepts of quantitative genetics (Bastos et
al., 2001). Both milk quality and quantity are being considered as an important for
any dairy enterprise especially the milk protein profile. Certain traits of economic
value like milk production, protein quality and reproductive traits are significantly
influenced by certain genetic as well as environmental factors. Genetic factors
involving many genes and their level of expression in certain physiological state of
body, while environmental factors includes farm environment, different feeding
management, calving season and stage of lactation infect the overall farm
management etc. makes it a multi factorial polygenic trait (Lara et al., 2002).
Different point mutations in the structural as well as regulatory regions are of
practical value due to their association with quantitative traits of economic
importance in animals. For example, certain single nucleotide polymorphisms (SNPs)
have been found to be linked with the changes in composition and processing
properties of milk from different breeds (Mclean, 1987).
9
1.4 Polymorphism
Polymorphism is the prescence of two or more alternative forms of DNA sequence
for a specific DNA stretch that are genetically distinct and structurally different.
These mutations ranging from a single nucleotide base change to variation in several
hundred bases. Two kinds of polymorphism, those due to replacement of DNA bases
and those due to insertion or deletion of base pair are mainly evident. The SNP is the
simplest type of polymorphism that can be located within the regulatory region of the
genes or throughout the genome. These mutations are present commonly at the rate of
one into 1300 bases in human genome and these are classified as bi, tri or tetra-allelic.
These are due to the transition or transversion of nucleotide bases. Transition
mutation is more common than transversion. These mutation are classified as
synonymous (cause no amino acid change) or non-synonymous (cause change in
amino acids) according to their effect on the resulting protein. Similarly, non-
synonymous type is further divided into missense (result in amino acid change due to
change in codon) and nonsense (result in termination codon) mutations (Duncan and
Miller, 1980).
Similarly, the existence of multiple alleles at a particular locus is generally known as
genetic polymorphism, which could be attributed that the two alleles present with the
frequencies of more than one percent. Similarily the polymorphisms at different
proteins level e.g i) Alpha-1-antitrypsin, ii) Blood group system, MNSs, Rh. factors,
iii) Galactosemia, galactose-1-phosphate uridyl transferase locus etc. The changes in
the DNA sequence either generates or eliminate a restriction site known by the
restriction digestion and which can be interpreted through gel electrophoresis. The
variations on the basis of changes in the restriction sites leading to change in DNA
fragment lengths are called restriction fragment length polymorphism (RFLP).
10
So, these polymorphisms are important for their use as a DNA marker to differentiate
various inherited forms of gene and have certain practical applications in the field of
molecular genetics for;
Gene mapping.
Genetic testing of inherited disorders and prenatal diagnosis.
Heterozygous carrier detection of heritable diseases in livestock species.
Indentification of individuals with high or low risk affinity to certain common
ailments (like heart diseases and diabetes etc).
Paternity testing and forensic use through DNA fingerprinting.
Matching of donor-recipient couples for tissue and organ transfer.
Genetic relationship determination among different livestock breeds, strain
and breeding lines.
Due to the recent advances in molecular genetic study, particularly DNA-based
markers, has influence on mapping, mutation detection and allowing identification of
the genes that control genetic variability (Habib et al., 2001). Improvement in the
recombinant DNA knowledge and molecular genetic has opened many venues of
genome investigation with better genetic resolution. Various polymorphic forms of a
DNA strech could be used as molecular markers for specific traits in animals.
1.4.1 Polymorphism detection at protein level
The research work on bovine milk protein polymorphism was started more than 50
year ago, it involves the identification of bovine beta-lactoglobulin genetic variants
by paper electrophoresis; depicting the existence of two bands of β-lactoglobulin
from bovine milk samples. While further analysis verified that these two types were
11
under genetic control of two autosomal co-dominant alleles (Aschaffenburg and
Drewry, 1955). The work on other milk related genes or genes controlling economic
traits in animal production have extensively accelerated in the recent years. The paper
electrophoresis technique was used for genetic analysis of other milk proteins like α-
lactoalbumin (Blumberg and Tombs, 1958), β-casein (Aschaffenburg, 1961), αS1 by
starch urea gel electrophoresis (Thompson et al., 1962) and reducing agent was used
for the characterization of two κ-CN genetic variants (Neelin, 1964; Woychik, 1964).
Initially, polymorphism detection based on the physiological and biochemical
variation at protein level that follow indirectly from variation in DNA sequence. The
introduction of analytical techniques with increased resolving power and sensitivity,
such as isoelectric focusing (IEF), polyacrylamide gel electrophoresis (PAGE),
chromatography and more recently capillary electrophoresis enhances the detection of
genetic variants in milk of different livestock species.
Limited expression of milk proteins during physiological state restricted the analysis
of milk protein polymorphism. Furthermore, protein electrophoretic mobility is also
affected by post-transcriptional modifications such as different degree of
phosphorylation and glycosylation of the protein. These limitations are overcome by
the discovery of DNA based methods which enable us to study genomic variations at
any stage despite of any physiological condition of animal.
1.4.2 Polymorphism detection at DNA level
Modern tools permit us detailed analysis regarding the genetic influence of different
genes on milk production traits and also make it possible to look for functional and
linked markers etc.
Single nucleotide polymorphisms (SNPs), i.e. single base variations now a day have
becomes an increasingly important type of molecular markers. The possible numbers
12
of these markers are very much high, these are present throughout the genome, and
more recently, microarray protocols have been established for automated scoring
thousands of SNPs at the same time for different loci. For marker assisted selection,
the DNA markers are supposed to be well recognized for their mark effect in the
target population. At present only a small number of markers have been identified to
have a functional influence (Kuhn et al., 2005). According to Dekkers (2004) the
success of MAS is subjected to the linkage between markers and the genes of interest.
The limitations of previous applications of QTL mapping results for MAS have been
overcome by the application of whole genome sequencing and SNPs markers etc.
combined with statistical methods for analysis of molecular data and this lead to
substantial changes in how genetic markers are used for prediction of breeding values
in animals. Genetic markers that may use in MAS are broadly three types 1) Direct
markers (DM) 2) Linkage disequilibrium (LD) and 3) Linkage equilibrium (LE). (1)
Direct markers, coding for a functional mutation. These are located within the gene of
interest and gene assisted selection (GAS) recommended in this situation. These are
more favorable but difficult to find these types of markers. (2) Linkage disequilibrium
(LD) shows the tendency of certain combination of alleles inherited together
collectively. Population wide linkage disequilibrium can be identified when markers
and genes are physically near to each other. (3) Linkage equilibrium (LE) markers are
in population-wide equilibrium, i.e. random arrangement of alleles at marker loci, but
adequately adjacent to the functional mutation to indicate low recombination rate.
Similarily, genome wide SNP genotyping methodology was also designed to
genotype an ancient species from very minute quantity of DNA. It also provides
methods to execute fast genomic studies among different species. Additionaly, it
enables conservational work, ancestral relationships and diversity. Bovine SNP 50
(single nucleotide polymorphism 50) Bead-chip was used to genotype animals
representing 61 different cattle breeds and 70 species, as divergent from Bos
13
Taurus and genotype validation results suggest that illumina Bovine SNP 50
genotype errors are unusual, are randomly disseminated, and are independent of call
rate in the outgroup species. SNP based genotyping (whole genome based) assays
developed for one species can be used for quick phylogenomic analysis across a wide
taxonomic range and are efficient for population and evolutionary work (Decker et
al., 2009).
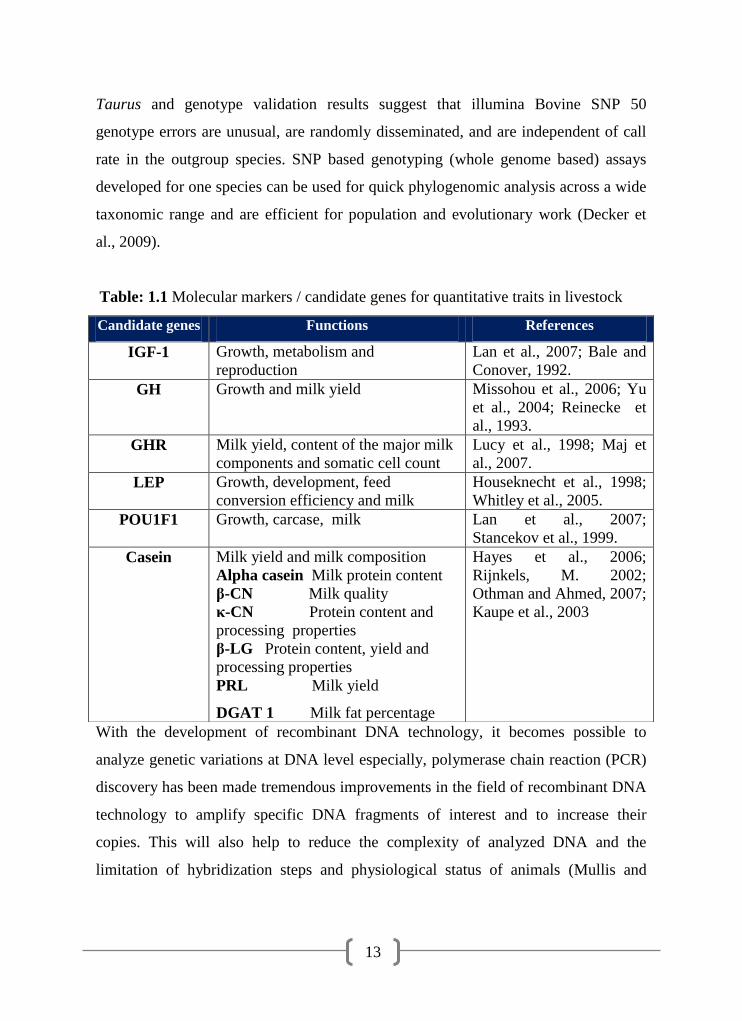
Table: 1.1 Molecular markers / candidate genes for quantitative traits in livestock
With the development of recombinant DNA technology, it becomes possible to
analyze genetic variations at DNA level especially, polymerase chain reaction (PCR)
discovery has been made tremendous improvements in the field of recombinant DNA
technology to amplify specific DNA fragments of interest and to increase their
copies. This will also help to reduce the complexity of analyzed DNA and the
limitation of hybridization steps and physiological status of animals (Mullis and
Candidate genes Functions References
IGF-1 Growth, metabolism and
reproduction
Lan et al., 2007; Bale and
Conover, 1992.
GH Growth and milk yield Missohou et al., 2006; Yu
et al., 2004; Reinecke et
al., 1993.
GHR Milk yield, content of the major milk
components and somatic cell count
Lucy et al., 1998; Maj et
al., 2007.
LEP Growth, development, feed
conversion efficiency and milk
Houseknecht et al., 1998;
Whitley et al., 2005.
POU1F1 Growth, carcase, milk Lan et al., 2007;
Stancekov et al., 1999.
Casein Milk yield and milk composition
Alpha casein Milk protein content
β-CN Milk quality
κ-CN Protein content and
processing properties
β-LG Protein content, yield and
processing properties
PRL Milk yield
DGAT 1 Milk fat percentage
Hayes et al., 2006;
Rijnkels, M. 2002;
Othman and Ahmed, 2007;
Kaupe et al., 2003

14
Faloona, 1987). Infect PCR revolutionariezed the world of molecular genetics.
Thermus aquaticus (Taq) DNA polymerase is widely used enzyme for the
amplification of specific DNA fragments.
Similarly, restriction analysis and DNA hybridization techniques, including more
specifically, the southern blotting (Southern, 1975) hybridization were used to
identify single base changes in DNA in that results in gain or loss of a restriction site.
These nucleotide genotypes were called restriction fragments length polymorphisms
and were used to early linkage studies etc (Botstein et al., 1980). At the moment,
varieties of mutation detection assays are available to study genomic variations
according to the type of mutations are being analyzed.
A number of genotyping tools are available now, but they are not commonly used, so
discussed briefly, but the commonly used methods of genotyping and to analyze
genetic polymorphism and their preliminary characterization of livestock breeds are
polymerase chain reaction-restriction fragment length polymorphism coupled with
DNA sequencing.
1.5 Polymerase chain reaction (PCR)
The discovery of PCR has completely changed the world of molecular biology. The
PCR is now playing a key role in analyzing the polymorphism in various genes
influencing milk production traits in animals (Table: 1.1). At present a number of
studies describing PCR based analysis of different milk related genes e.g. the kappa-
casein, β-casein and β-lactoglobulin genes (Medrano and Aguilar-Cordova, 1990;
Pinder et al., 1991). The use of PCR has also enhances the rapid identification of
various alleles carrying by animals such as B-allele of κ-CN gene which are directly
related to composition of milk (Marziali & Ng-Kwai-Hang, 1986; Ng-Kwai-Hang et
al., 1986). The PCR-RFLP is also now being employed for the diagnosis and
determination of carrier of various genetic diseases like BLAD etc (Shuster et al.,
15
1992). Genomic variations in the immune genes such as major histocompatibility
complex (MHC) etc. in bovine to study susceptibility to various diseases such as
mastitis (Aarestrup et al., 1995) etc. has also been investigated. The main idea behind
PCR is to aneal oligonucleotide primers covering the area of interest, one on each and
opposite end of the two pairs of homologous DNA strands. A repeated cycle of
denaturation followed by annealing and extension of the annealed primers by the
Thurmus aquaticus enzyme, which consequences in the exponential increase number
of copies of specific fragment, nearly doubling at every cycle and subsequent to 30
rounds of PCR yielded about a million-fold copies of amplified target DNA fragment.
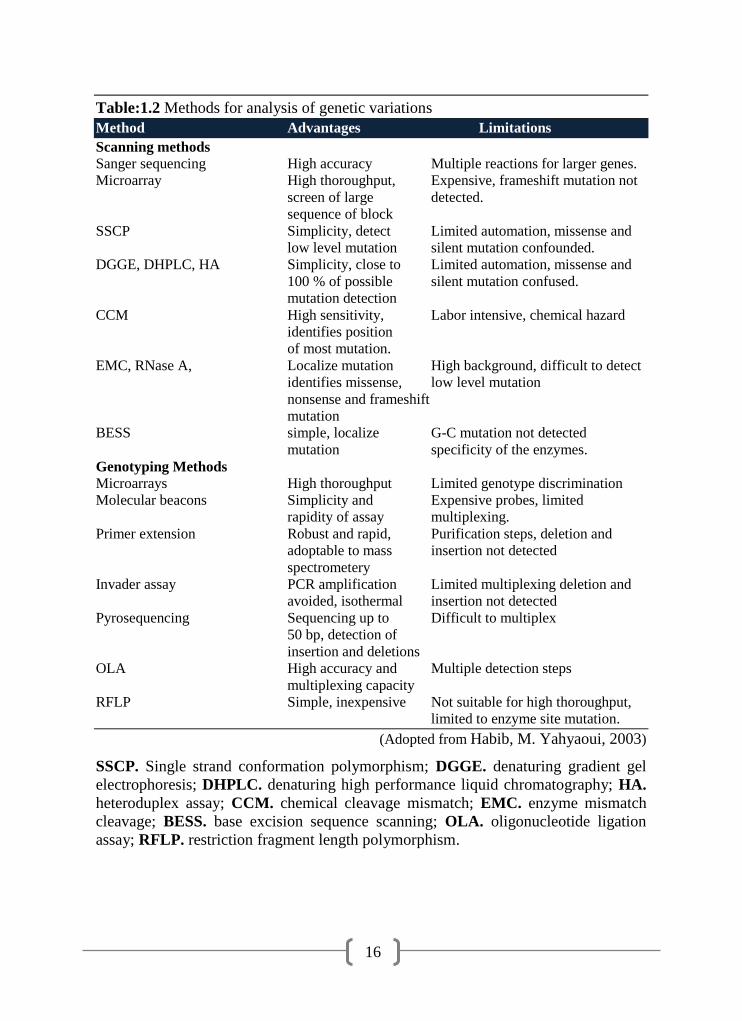
1.6 Methods for analysis of genetic variations
Various methods (Table: 1.2) are being used to uncover the genetic variation in an
organisms. (reviewed by Ahmadian and Lundeberg, 2002). All these methods have
their own advantages and disadvantages. So, the choice of a technique requires
careful consideration of several factors.
16
Table:1.2 Methods for analysis of genetic variations
Method Advantages Limitations
Scanning methods
Sanger sequencing High accuracy Multiple reactions for larger genes.
Microarray High thoroughput, Expensive, frameshift mutation not
screen of large detected.
sequence of block
SSCP Simplicity, detect Limited automation, missense and
low level mutation silent mutation confounded.
DGGE, DHPLC, HA Simplicity, close to Limited automation, missense and
100 % of possible silent mutation confused.
mutation detection
CCM High sensitivity, Labor intensive, chemical hazard
identifies position
of most mutation.
EMC, RNase A, Localize mutation High background, difficult to detect
identifies missense, low level mutation
nonsense and frameshift
mutation
BESS simple, localize G-C mutation not detected
mutation specificity of the enzymes.
Genotyping Methods
Microarrays High thoroughput Limited genotype discrimination
Molecular beacons Simplicity and Expensive probes, limited
rapidity of assay multiplexing.
Primer extension Robust and rapid, Purification steps, deletion and
adoptable to mass insertion not detected
spectrometery
Invader assay PCR amplification Limited multiplexing deletion and
avoided, isothermal insertion not detected
Pyrosequencing Sequencing up to Difficult to multiplex
50 bp, detection of
insertion and deletions
OLA High accuracy and Multiple detection steps
multiplexing capacity
RFLP Simple, inexpensive Not suitable for high thoroughput,
limited to enzyme site mutation.
(Adopted from Habib, M. Yahyaoui, 2003)
SSCP. Single strand conformation polymorphism; DGGE. denaturing gradient gel
electrophoresis; DHPLC. denaturing high performance liquid chromatography; HA.
heteroduplex assay; CCM. chemical cleavage mismatch; EMC. enzyme mismatch
cleavage; BESS. base excision sequence scanning; OLA. oligonucleotide ligation
assay; RFLP. restriction fragment length polymorphism.

17
1.6.1 Genotyping / Polymorphism detection methods
These include hybridization and enzymatic based methodologies like polymerase
chain reaction-restriction fragment length polymorphism (PCR-RFLP),
oligonucleotide ligation assay (OLA), allele specific-polymerase chain reaction (AS-
PCR), invader assay, primer extension analysis and pyrosequencing etc. Among these
techniques, PCR coupled with RFLP and DNA sequencing is commonly used to
study genetic polymorphism.
1.6.2 Restriction fragment length polymorphism (RFLP)
PCR-RFLP is one of the simplest and commonly used methods for mutation detection
as well as genotyping. The variation in length of DNA fragments produced after
digestion of PCR amplified fragment with restriction endonucleases. The differences
in DNA fragments lengths are due to presence or absence of particular restriction
enzyme site. Initially, RFLP procedure involves hybridization with DNA probe after
separation of digested genomic DNA by agarose gel electrophoresis. Now, there is
slight modification which involves electrophoresis of digested PCR product giving
rise of fragments of different lengths and variation in the lengths size of DNA
fragments are indicative of nucleotide changes. Only drawback found in the RFLP
procedure is that not all the polymorphisms alter restriction sites, but this problem can
be sometime overcome by introducing mismatched primers to create restriction sites.
At present, PCR-RFLP is commonly used for milk protein polymorphism detection
and for preliminary characterization of bovine breeds in the absence of sequencing
facilities.
The PCR-RFLP method of genotyping used by various authors to identify allelic
variations among genes having association with production traits such as bovine
growth hormone (Lucy et al., 1993; Schlee et al., 1994 b; Mitra et al., 1995;
Kemenes et al., 1999; Sorensen et al., 2002; Dybus et al., 2003; Masoudi et al., 2002
; Dario et al., 2005; Kovacs et al., 2006), kappa-casein (Mitra et al., 1998; Kemenes

18
et al., 1999; Otaviano et al., 2005; Rafy and Darwish, 2008; Gangaraj et al., 2008;
Othman O. E., 2005; Galila and Samah, 2008 and Dayem et al., 2008) and beta-
lactoglobulin (Chung et al., 1998; Kemenes et al., 1999; Badola et al., 2004;
Rachagani et al., 2006) genes.
1.6.3 Nucleotide sequencing
Nucleotide sequencing is the determination of the order of nucleotide bases in the
specific DNA fragment. Sequencing is one of the commonly used, reliable and high
thoroughput methods for unknown mutations detection. Chain termination or dideoxy
method of sequencing can be used to detect unknown mutation. It can also be used to
confirm and to find out the location of changed basees in the target sequence already
recognized as changes by other approaches. It is also used to characterize any
unknown and known mutation useful in biological research, to identify, diagnose and
potentially develop treatments for various genetic diseases.
1.7 Bovine growth hormone
The bovine growth hormone (bGH) is well-known as somatotropin, a family of
somatolactogenic hormones that consist of different steroid, protein and
haematopoetic growth factors. It is a single-chain polypeptide hormone having
22KDa molecular weight comprises of 190 amino acids, having Ala or Phe at the N
terminus, due to alternative processing of bGH precursors (Wood et al., 1989). The
bGH produced in the anterior pituitary and plays role in several biological events
including mammary gland development, lactation process, growth and metabolism
regulation etc. It also stimulates postnatal somatic development and has insulin-like
and lactogenic effects etc in vivo (Reis et al., 2001; Carnicella et al., 2003).
1.7.1 Organization of bovine growth hormone gene (bGH)
The bGH gene is an attractive candidate gene for use as a milk and beef production
marker due to its role in galactopoietic metabolism and the growth related activities.
19
Genomic organization of bGH gene is presented (Figure: 1.2). It is mapped on cattle
chromosome 19 in the area of bands q26-qter (Hediger et al., 1990). The total length
of bGH gene is around 1800 bps and contains five exons (I, II,III,IV & V) and four
introns (A through D) (Woychick et al.,1982; Gordon et al., 1983; Hediger et al.,
1990).
Growth and prolactin (PRL) hormones have been shown formerly a pattern of
evolution in which events of rapid changes are executed on a low basal rate. Out of
seven protein hormones, six of these including prolactin, insulin, GH, parathyroid
hormone, glycoprotein hormone alpha-subunit, and luteinizing hormone beta-subunit
showed distinctly variable evolutionary rates (Wallis, 2001). In mammals the
organization of GH is strongly well-preserved, showing a low basal rate of molecular
evolution. However, on two events, during the evolution of primates and of
artiodactyls, the evolution rate has increased dramatically (Lioupis et al., 1997). The
GH-PRL gene family in mammals is an exciting example of evolution by gene
duplication. Deviation among duplicated genes is categorized by the comparatively
high rate of non-synonymous substitutions (Ohta, 1993). The bGH is synthesized as
pre-bGH with a signal peptide of 26 amino acids residues coded by exon-I and
part of exon-II, contains short sequences of DNA that are recognized by
binding sites, associated with the control of gene expression and initiation. It is
important to investigate the promoter region and the region 5' of un-translated
gene, since these regions have several binding sites for transcription regulatory
factors.
Six variable nucleotide sites were detected in the flanking region and one in the
intron-I of bGH gene. Some of these variable sites act as potential binding sites for
transacting factors. Three single nucleotide polymorphism were found in the
promoter region of bGH gene of Angus cattle (Ge et al., 2003).

20
Fig: 1.2 Genomic organization of bovine growth hormone gene and AluI
restriction site (L-V).
1.7.2 Polymorphism in bovine growth hormone gene
Allelic variation in the structural as well as regulatory regions would be of attractive
from several reasons. Firstly, genetic polymorphism contributes towards genetic
characterization of bovine breeds and secondly they would have possible effect
(direct or indirect) on milk production. So, the variation in the intronic as well as
exonic regions has potential as genetic markers which help in improvement of
indigenous breeds (Mitra et al., 1995).
The bGH gene found to be polymorphic in many breeds showing different genotypes
(LL, LV and VV). The frequencies of these genotypes vary among different breeds.
These genotypes are linked to the production traits in animals and are inherited in
allelic ways (Chikuni et al . ,1991; Zhang et al . ,1993; Unanian et al . ,1994;
Lagziel and Soller, 1999). The extensively studied polymorphism was in the exon-V
of bGH gene which is 5 C to G transversion at nucleotide position 2141 (Gordon et
I II III IV V
G GGA
AGCT
T
CTG GTG = L/V

21
al., 1983) producing an amino acid change from leucine (designated as L) to valine
(designated as V) at the amino acid position 127 (Lucy et al., 1991). Similarly, Zhang
et al. (1993) reported polymorphism in the Intron III of bGH gene.
Earlier studies have also investigated the association between genetic polymorphism
at the bGH locus with production trait e. g milk yield and protein percentage etc.
(Vukasinovic et al., 1999). It has been found that the leucine (L) genotype has been
found to be associated with a higher growth hormone release in German black and
white cattle and a lower bGH release in Friesian cattle (Grochowska et al., 2001).
The frequency of allele L is higher in Holstein cattle (Sorensen et al., 2002). It was
also observed that bGH-AluI polymorphism is related to plasma levels of bGH
(Schlee, 1994 b). Genotype leucine-leucine (designated as LL) was usually associated
with higher circulating concentration of bGH than genotype leucine-valine
(designated as LV). In an other study, Dybus A. (2002) noted that cattle with
genotype LL produced higher milk fat and protein yield than LV individuals and it
was noticed that higher frequency of allele L in dairy breeds of largest mature size
(Holstein and Brown Swiss), whereas smaller breeds (Ayrshire and Jersey) had the
highest frequency of allele V (Lucy et al., l993).
Dario et al. (2005) also reported higher daily milk yields in the animals of bGH-AluI
genotype LL than LV, while genotype LV was significantly linked with fat and
protein percentage. Similarly, the allele L is associated with higher production of
milk, fat and protein (Sabour et al., 1997; Shariflou et al., 2000).
A significant association was also reported between bGH Val / Leu polymorphism
and milk production traits in Danish Black and White cattle only in the first lactation.
Dybus A. (2002) found that in the first 305-day of lactation, the cattle of genotype

22
LL produced extra milk (+225 kg), fat (+7 kg) and protein (+7 kg) than the
individuals having LV genotype.
A similar study was conducted among the Canadian Holstein AI bulls and the study
revealed that the bGH V allele was preferred for improved milk production traits,
particularly protein (Sabour and Lin, 1996). This was further evaluated and found that
the effects of bGH were significant for milk protein percentage. In an association
study between the bGH L/V locus and estimated transmitting abilities of milk yield in
Holstein cattle and similarliy it was found that bGH allele V was more common in the
top than in bottom group of bulls (Sabour et al., 1997) and genotype bGH LV affects
live body weight and daily weight gain and animals of genotype bGH VV show
maximum daily weight gain (Zwierzchowski et al., 2001).
Table: 1.3 shows the bGH genetic variants association with milk production traits.
Similarily, Grisart et al., 2002 and Kaupe et al., 2003 found the effect of Diacyl
glycerol acyl transferase I gene on the fat content of milk. At present a number of
studies dealt with the effect of long term usage of bGH on lactational performance
and reported that recombinant bGH administration increased average fat corrected
milk yield than bGH of pituitary origin (Bauman and Eppard, 1985).
So, findings evolving from bGH gene polymorphism studies in different breeds, some
dairy breeds shows higher frequencies of allele L and vice versa. It was also noticed
that allele L was found in higher frquencies in larger size breed (Holstein and Brown
Swiss etc.) than smaller breeds had the highest frequency of V allele and their
frequencies are varies with the breeds.

23
Table: 1.3 Association of genetic variants of bGH and DGAT1 loci with milk
production traits.
Arrows indicate increase (↑) and decrease (↓). ND: Not determined.
1.8 Milk proteins
Milk is the natural secretion of mammary glands consisting of all essential nutrients
required for the young ones growth. Milk contains fat globules and casein micelles,
(composed of casein, calcium and phosphorous) suspended in aqueous phase, also
contain lactose, whey proteins and minerals salts etc. The milk quality is dependent
both upon the genetic and environmental factors such as climate, management and
stage of lactation etc. Bovine milk contains different proteins, (containing both
essential as well as non-essential amino acids) which can be classified into two
groups: the caseins (αS1, αS2, β and κ) (Eigel et al., 1984) and whey proteins (α-LA
and β-lg) (Threadgill and Womack, 1990). The whey proteins, (α-LA and β-lg) are
soluble at pH 4.6, while the caseins found remained insoluble at this pH (Fox and
McSweeney, 1998).
Genomic variations in milk protein genes draw significant research attention due to
their importance in selection as well as characterization of bovine breeds (Reviewed
Loci Allele Milk
Yield
Protein
content
Fat
content
References
bGH-
AluI
L ↑ ND ND Lucy et al., 1993
V ND ↑ ↑ Sabour et al., 1997
V ND ↑ ↑ Zwierzchowski et al.,
2002
V ND ND ↑ Lee et al., 1994
bGH-
Msp1
+ ↑ ND ND Lee et al., 1994
+ ↑ ↑ ↑ Yao et al., 1996
− ND ND ↑ Lee et al., 1994
− ND ND ↑ Falaki et al., 1996
DGAT-1
A ↑ ND ND Grisart et al., 2002
K ND ND ↑ Kaupe et al., 2003,
Grisart et al., 2002.
24
by Lara et al., 2002). These variations affect milk composition and its processing
properties (Mclean, 1987; Molina et al., 2006; Otaviano et al., 2005). The variation
include addition and deletion of one or more nucleotides in the DNA sequence which
creates restriction site for specific restriction enzyme and can be identified by
restriction digestion using agarose gel electrophoresis. Other kind of variations
includes post-transcriptional variations (phosphorylation and glycosylation) were also
reported in casein molecule (Mclean, 1987).
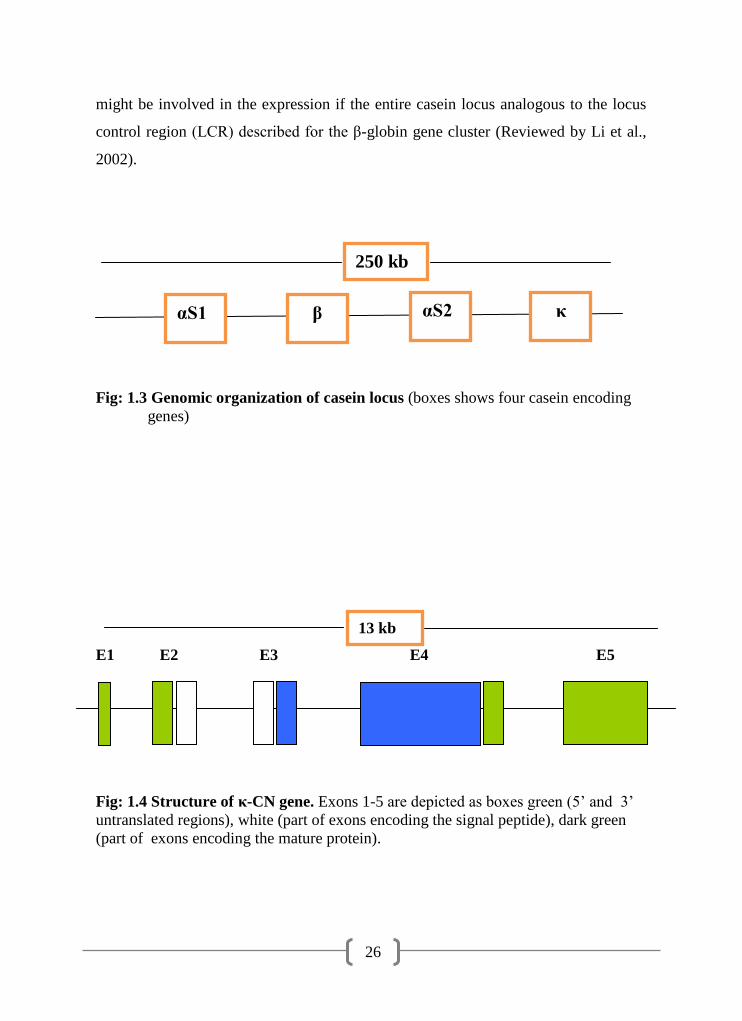
1.8.1 Casein genes
Casein genes of cattle are tightly linked in the form of cluster can play a considerable
role in MAS (Lien and Rogne, 1993). It is located on bovine chromosome 6q31
(cattle and goat) within 250 kb fragment (Fig: 1.3) in the order αS1, β, αS2 and κ
(cattle and goat), while in buffalo located on chromosome 7. The overall genomic
organization of the casein locus is conserved between mammalian species. The αS1-,
β-, and αS2-casein genes are most closely linked, whereas the κ-CN gene is 70 kb
away from them (Ferretti et al., 1990). Caseins constitute about 78-82% of bovine
milk proteins. The structural organization of the casein gene have been described in
bovine, human and mouse (Fujiwara et al., 1997).
1.8.2 Organization of kappa-casein gene
The length of -CN gene is about 13 kb and is divided into five exons and intervening
sequences (Fig: 1.4). It constitutes about 25 % of the total casein fraction. Most of the
coding sequences for mature -CN protein are located within exon IV (Kamenes et
al., 1999). The κ-CN is considerably different from other caseins in structure and
other properties and acts as a stabilizing factor during the formation of micelle
structure in curdling of milk (Fiat and Jolles, 1989). Several reports have described
the major influence of -CN and beta-lactoglobulin (β-LG) genotypes on milk

25
composition and its processing properties along with some association with
lactational performance etc (Ng-Kwai-Hang et al., 1986; Grosclaude, 1988).
The κ-CN gene has been characterized in several species, including cattle
(Gorodetskii and Kaledin, 1987), sheep (Furet et al., 1990), and Goat (Coll et al.,
1993). The signal peptides of mature κ-CN are different both in length and amino
acid sequence from other calcium sensitive proteins. The structure of gene is also
quite different from each other and has been described in goat, human and and rabbit.
Repetitive elements have also been identified in the 5‟ flanking region of the κ-CN
gene from different species. The bovine κ-CN gene contains a microsatellite repeat in
intron-III with six alleles (Lien and Rogne, 1993; Leveziel et al., 1994). It has been
reported that three calcium-sensitive genes have evolved from a common ancesteral
gene such as gene duplication and exon shuffling (Bonsing and Mackinlay, 1987). In
contrast, κ-CN gene appears to have evolved along a different pathway, since it does
not share any common pattern with other casein genes. The κ-CN gene was
postulated to be evolutionary related to the fibrinogen (γ-chain) gene family, whose
cleavage by thrombin, results in blood clotting (Jolles et al., 1978).
Although κ-CN gene is not evolutionarily related to the calcium sensitive caseins
encoding genes but it is physically and functionally linked to them. However, the four
casein encoding genes showed high level coordinated expression in tissue and during
physiological stage. Thus the expression pattern of κ-CN seems to be similar to that
of other caseins in spite of the different organization of its 5‟ flanking region.
Though, κ-CN genomic clones (from Goat, Cow and Rabbit) were poorly expressed
in transgenic mouse lines under their own regulatory sequences. In contrast, κ-CN
gene has been shown to be expressed in the transgenic mice mammary gland
(Gutierrez et al., 1996) and transgenic cattle (Brophy et al., 2003), when linked to a β-
CN regulatory sequences. Thus, the observations suggest that regulatory elements
26
might be involved in the expression if the entire casein locus analogous to the locus
control region (LCR) described for the β-globin gene cluster (Reviewed by Li et al.,
2002).
Fig: 1.3 Genomic organization of casein locus (boxes shows four casein encoding
genes)
E1 E2 E3 E4 E5
Fig: 1.4 Structure of κ-CN gene. Exons 1-5 are depicted as boxes green (5‟ and 3‟
untranslated regions), white (part of exons encoding the signal peptide), dark green
(part of exons encoding the mature protein).
αS1 β αS2
κ
250 kb
13 kb

27
1.8.3 Polymorphism of kappa-casein (κ-CN) gene
Milk protein polymorphism was firstly reported by Aschaffenburg and Drewry
(1955). Genetic polymorphism of six milk proteins encoding genes of cattle is well
recognized (Grosclaude, 1988), the B alleles of β–CN, –CN and β-LG milk protein
genes have been found to be associated with increase milk protein (Ng-Kwai Hang et
al., 1986; Van Eenennaam and Medrano,1991), fat yields (Ng-Kwai-Hang et al.,
1986) and better cheese making properties (Rampilli et al., 1988).
Owing to the importance of κ-CN during technological properties of milk, genetic
polymorphism of the κ-CN has been widely studied in ruminants such as cattle
(Pinders et al., 1991; Rijnkels et al., 1997), buffalo (Pipalia et al., 2001; Otaviano et
al., 2005; Patel et al., 2007; Riaz et al., 2008), goats (Angiolillo et al., 2002; Kiplagat
et al., 2010), sheep (Moioli et al., 2007) and yak (Prinzenberg et al., 2008).
Various alleles of the κ-CN gene have been described, which include A, B, C, E, F,
G, H, I and A1 (Prinzenberg et al., 1999). Amongst these, only A and B are most
commonly found alleles. Alleles A and B differ by only a two amino acids
substitution i.e.Thr136/IIe and Asp148/Ala (Neelin, 1964; Woychik, 1964; Alexander
et al., 1988). These two variant can be genotyped by PCR-RFLP using Hind III or
Hinf I restriction endonucleases (Medrano and Aguilar-Cordova, 1990a; Pinder et al.,
1991). The frequency of these genotypes varies among different species. Several
studies have reported significant association of κ-CN variants with lactation
performance, composition of milk and its processing properties (Marziali and Ng-
Kwai-Hang, 1986; Grosclaude, 1988; Aleandri et al., 1990).
The allele B of κ-CN containing milk has better cheese making properties, because it
has better thermal resistance, shorter coagulation time, makes better curdles and
forms micelles of various sizes (Marziali and Ng-Kwai-Hang, 1986).
28
Barroso et al. (1998) described a PCR-RFLP to differentiate various bovine κ-CN
genotypes i.e. AA, AB, BB, AE, BE, EE, AC and BC. A PCR-RFLP analysis was
used (restriction endonucleases Hind III, Hinf I and TaqI) to detect different point
mutations in alleles A and B of -CN gene in Sahiwal cattle, Murrah, Nili-Ravi and
Egyptian Buffaloes. While in Sahiwal cattle genotypes AA and AB were reported
(Mitra et al., 1998). The -CN gene polymorphism was also studied in Pantaneiro
cattle breeds by PCR-RFLP indicating high degree of genetic variability for this locus
and the observed frequency of B allele was remain low as in other cattle breeds and
found to be 0.218 (Lara et al., 2002). Soria et al. (2003) described eleven variant of -
CN gene by PCR-RFLP test in different cattle breeds of Argentine with the highest
frequency of -CN A allele followed by B and E alleles. Similarly, a PCR-RFLP and
PCR-SSCP test were also used to analyze -CN gene of female Water Buffaloes
(Otaviano et al., 2005). Polymorphism was found for -CN gene with the higher
frequency of allele A in Holstein cows in Turkey (Yasemin and Cengiz, 2006). PCR-
RFLP and PCR-SSCP techniques also used for genotyping of κ-CN gene
(Prinzenberg et al., 1996; Barroso et al., 1998; Prinzenberg et al., 1999). Similarly,
genetic variability for milk proteins and growth hormone genes was detected using
polymerase chain reaction-single strand conformation polymorphism (PCR-SSCP) in
Portugues sheep breeds in αS1 (exon 10 & 11), β-CN (exon 7), κ-CN (exon 4), α-LA
(exon 1), growth hormone (exons 4 & 5) and growth hormone receptor (exon 6)
genes (Bastos et al., 2001). Chessa et al. (2007) analyzed bovine milk proteins for
single nucleotide polymorphism using Microarrays.
The impact of bovine κ-CN genotypes on milk production traits have been
extensively studied and most of the data revealed that milk from cows genotyped for
κ-CN BB contains higher proportion of protein and casein contents than milk from κ-
CN AA cows (Ng-Kwai Hang, 1998). The B allele is significantly associated with
higher casein and lower whey protein contents resulting in a higher ratio of casein to

29
total proteins. The bovine κ-CN BB genotype has also been associated with milk of
superior manufacturing properties e.g. short coagulation time and higher cheese yield
etc (Marziali and Ng-Kwai Hang, 1986). It was also found that the animal with
genotype BB had lesser milk production than AA while, it produces higher protein
contents (Bovenhuis et al., 1992). Table: 1.4 shows an association of different milk
protein genes (beta-casein, kappa-casein and beta-lactoglobulin) genetic variants with
milk production traits.
The κ-CN BB genotyped animals have been shown to have a significantly higher
milk protein yield and 10% higher cheese yield as compared to the AA genotype
animal milk (Bovenhuis et al., 1992; Marziali and Ng-Kwai-Hang, 1986). Several
findings emerging from κ-CN gene polymorphism studies found in buffalo and cattle,
where some cattle breeds shows high frequency of allele A. There are variations in
the frequencies of genotype AA, AB and BB among different cattle breeds. The
frequency of allele B seems to be lower in cattle breeds of Bos indicus origin.

30
Table: 1.4 Association of beta-casein, kappa-casein and beta-lactoglobulin genetic
variants with milk production traits.
Loci Alleles Milk
Yield
Casein
Content
cheese
Yield
References
Beta- Casein
A2 ND ↑ ND Kucerova et al.,
2006.
A2 ↑ ND ND Matyukov, 1983;
Bech and
Kristiansen, l990.
A1 ↑ ND ND Kucerova et al.,
2006.
A3 ↑ ND ND Ng-Kwai-Hang,
1998.
B ND ↑ ↑ Marziali and Ng
Kwai-Hang, 1986.
B ND ↑ ND Heck et al., 2009.
Kappa-
Casein
A ↑ ND ND Kucerova et al.,
2006.
A ↑ ND ND Strzalkowska et al.,
2002.
B ND ND ↑ Medrano and
Anguilar-Cordova,
1990.
B ND ↑ ND Caroli et al., 2004
B ND ↑ ↑ Strzalkowska et al.,
2002.
B ND ND ↑ Hallen et al., 2007.
B ND ↑ ND Hallen et al., 2008.
B ND ↑ ND Heck et al., 2009.
Beta-
Lactoglobulin
A ↑ ND ND Robitaille et al.,
2002.
A ↑ ↑ ND Strzalkowska et al.,
2002.
A ↑ ND ND Daniela and
Vintila, 2005.
A ND ↓ ND Heck et al., 2009.
B ND ↑ ND Robitaille et al.,
2002.
B ND ↑ ↑ Daniela and
Vintila, 2005.
B ND ↑ ND Hallen et al., 2008.
Arrows indicate increase (↑) and decrease (↓). ND: Not determined.

31
1.9 Beta-lactoglobulin
Beta-lactoglobulin (β-LG) is an important component of whey protein in the milk of
ruminants and other species. It is mainly involve in binding and transporting small
hydrophobic molecules. The β-LG is an extremely acid stable protein exists at normal
pH of milk. It is a single chain polypeptide with a molecular weight of 18 kDa and
comprises of 162 amino acids. In most of the species β-LG found to be monomeric.
Under physiological condition, the β-LG protein presents a globular and compact
structure and it tends to dissociate subsequent to a slight change in pH (below 3.5 and
above 7.5). The β-LG among the first proteins to be crystallized and its different
(secondary and tertiary) structures is well characterized (Monaco et al., 1987).
Comparison of the amino acids sequence of bovine, ovine and caprine β-LGs protein
shows that proteins from these species are highly homologous with sequence identity
greater than 95 %. All three proteins contain five cysteine residues, four of which
form interchain disulphide bridges with the fifth cysteine residue. Β-LG protein
belongs to the lipocalin protein family, which is constituted by small secreted proteins
and characterized by their affinity to bind hydrophobic molecules. Though lipocalin
have been classified as transport proteins but is also involved in several complex
biological processes like retinol and pheromone transport, synthesis of
prostaglandins, immune response, and cell homeostasis (Flower, 1996). Member of
lipocalin family show a great diversity at the protein sequence level (only 20-30 % of
similarity), however, stretches of sequence that are important in defining three
dimensional structure of protein are highly conserved. Comparison of amino acid
sequences of bovine, ovine and caprine β-LG shows that the three proteins are highly
homologous with sequence identity greater than 95 %. The coding sequence is highly
conserved between three species (Preaux et al., 1979). The lipocalin family includes
apolipoprotein D, retinol-binding protein, and prostaglandin synthase and protein
pregnancy 14 (Ali and Clark, 1988).
32
1.9.1 Organization of beta-lactoglobulin gene
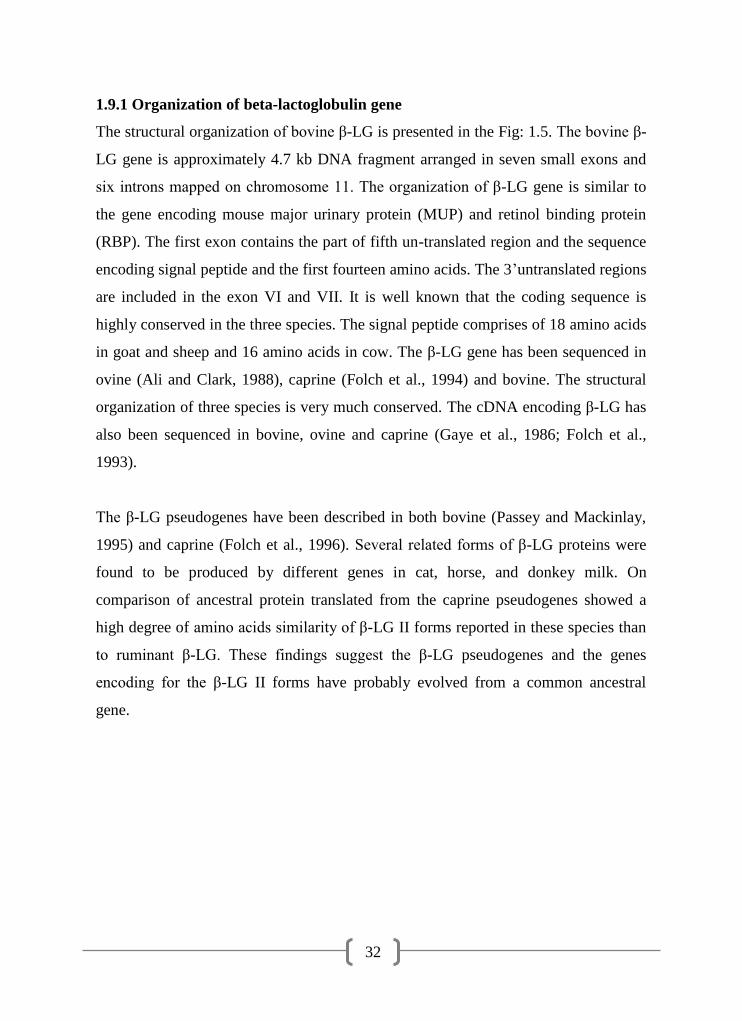
The structural organization of bovine β-LG is presented in the Fig: 1.5. The bovine β-
LG gene is approximately 4.7 kb DNA fragment arranged in seven small exons and
six introns mapped on chromosome 11. The organization of β-LG gene is similar to
the gene encoding mouse major urinary protein (MUP) and retinol binding protein
(RBP). The first exon contains the part of fifth un-translated region and the sequence
encoding signal peptide and the first fourteen amino acids. The 3‟untranslated regions
are included in the exon VI and VII. It is well known that the coding sequence is
highly conserved in the three species. The signal peptide comprises of 18 amino acids
in goat and sheep and 16 amino acids in cow. The β-LG gene has been sequenced in
ovine (Ali and Clark, 1988), caprine (Folch et al., 1994) and bovine. The structural
organization of three species is very much conserved. The cDNA encoding β-LG has
also been sequenced in bovine, ovine and caprine (Gaye et al., 1986; Folch et al.,
1993).
The β-LG pseudogenes have been described in both bovine (Passey and Mackinlay,
1995) and caprine (Folch et al., 1996). Several related forms of β-LG proteins were
found to be produced by different genes in cat, horse, and donkey milk. On
comparison of ancestral protein translated from the caprine pseudogenes showed a
high degree of amino acids similarity of β-LG II forms reported in these species than
to ruminant β-LG. These findings suggest the β-LG pseudogenes and the genes
encoding for the β-LG II forms have probably evolved from a common ancestral
gene.
33
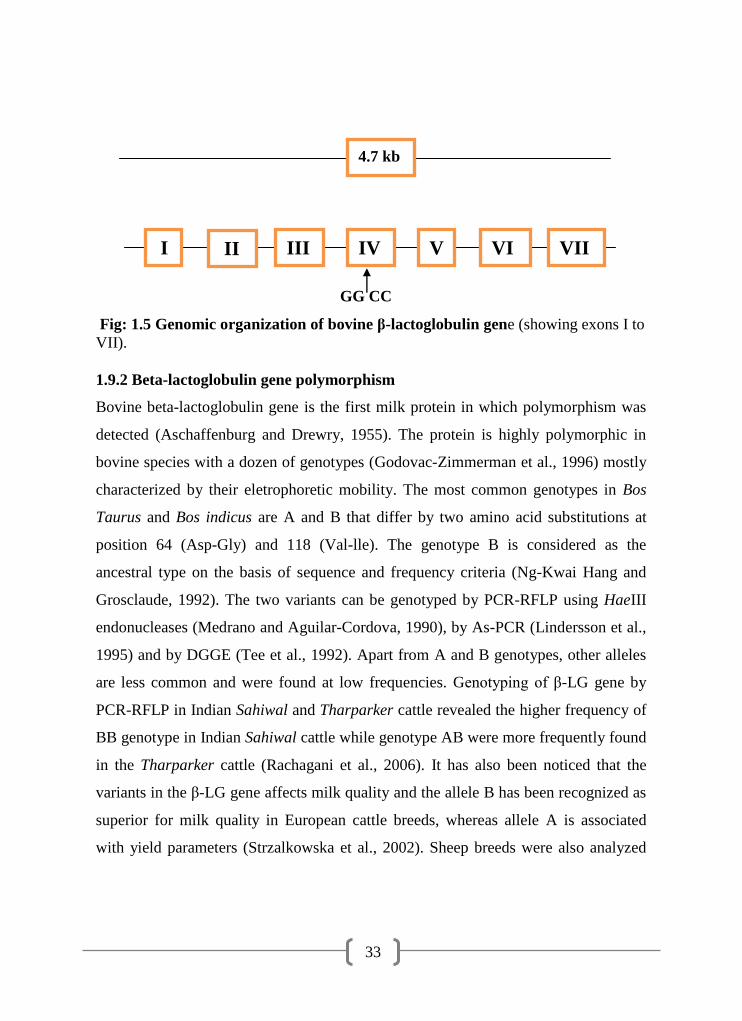
Fig: 1.5 Genomic organization of bovine β-lactoglobulin gene (showing exons I to
VII).
1.9.2 Beta-lactoglobulin gene polymorphism
Bovine beta-lactoglobulin gene is the first milk protein in which polymorphism was
detected (Aschaffenburg and Drewry, 1955). The protein is highly polymorphic in
bovine species with a dozen of genotypes (Godovac-Zimmerman et al., 1996) mostly
characterized by their eletrophoretic mobility. The most common genotypes in Bos
Taurus and Bos indicus are A and B that differ by two amino acid substitutions at
position 64 (Asp-Gly) and 118 (Val-lle). The genotype B is considered as the
ancestral type on the basis of sequence and frequency criteria (Ng-Kwai Hang and
Grosclaude, 1992). The two variants can be genotyped by PCR-RFLP using HaeIII
endonucleases (Medrano and Aguilar-Cordova, 1990), by As-PCR (Lindersson et al.,
1995) and by DGGE (Tee et al., 1992). Apart from A and B genotypes, other alleles
are less common and were found at low frequencies. Genotyping of β-LG gene by
PCR-RFLP in Indian Sahiwal and Tharparker cattle revealed the higher frequency of
BB genotype in Indian Sahiwal cattle while genotype AB were more frequently found
in the Tharparker cattle (Rachagani et al., 2006). It has also been noticed that the
variants in the β-LG gene affects milk quality and the allele B has been recognized as
superior for milk quality in European cattle breeds, whereas allele A is associated
with yield parameters (Strzalkowska et al., 2002). Sheep breeds were also analyzed
I III VII VI IV V
4.7 kb
GG CC
II

34
for β-LG gene polymorphism and these were found to be polymorphic with several
genetic variants but most common are A and B variants with genotype A is
predominant (Gaye et al., 1986). The genotype C was also reported in German and
Spanish merino breeds (Erhardt, 1989; Recio et al., 1995) which differ from A
genotype by a single change at postion 18. A PCR-RFLP method was developed to
identify β-LG C genotype in sheep and it was further characterized and found two
G/A transitions at position 4626 and 4750 (Pena et al., 1999).
Several studies have investigated the effects of milk protein polymorphisms on milk
production traits during the past and, in some cases, results are still conflicting
(Bovenhuis et al., 1992) while the results on the effect of β-LG genotypes on milk
production traits have been rather more consistent. Genotype BB has been positively
correlated with fat content (Hill et al., 1997; Tsiaras et al., 2005), while genotype AA
mainly affected the protein yield (Ng-Kwai Hang, 1998). The higher content of
protein in milk from AA genotype animals is due to higher amount of β-LG. In fact,
higher expression of allele A has been described in heterozygous animal genotyped
for AB genotype, whereas quantification of β-LG protein in milk shows a relative
proportion of 60 and 40 % for A and B forms respectively.
Effect of β-LG gene polymorphism on milk composition and dairy performance have
been described in various studies but the results are somewhat contradictory and no
clear association has been established. Table: 1.4 shows an association of beta-
lactoglobulin genetic variants with milk production traits.
Although the structure of all six main milk proteins has been described in cattle,
sheep and goat breeds. Similarly the induction of milk proteins is under the control of

35
several complex mitochondrial processes. These involve glucocorticoids, prolactin,
insulin and several other lactogenic factors including growth hormone etc involve in
the expression of milk proteins. Expression of casein during lactation only confind
the use of milk protein based genotypic evaluation but DNA based evaluation of milk
protein genes has made it possible and simpler to analyze number of animals
(Medrano and Aguilar Cordova, 1990).
1.10 Aims / Objectives:
Genetic improvement of indigenous livestock breeds through selective breeding has
received special attention because in this way, we may achieve rapid progress in most
of the traits etc. Potentially, the use of MAS can speed up the progress in term of
economic traits in animals. Genetically superior animals, they are considered to be
more efficient in nutrient utilization and attain optimum growth during short span of
time. Bovine growth hormone and different milk protein encoding genes exerts a key
role in various physiological activities such as nutrient use, growth, mammary gland
development and lactation and the quality of milk etc.
In many countries selection for the κ-CN, β-LG and bGH alleles is integrated into
animal selection programs because of its effect on milk composition, manufacturing
properties and growth etc (Pedersen, 1991). The Nili-Ravi buffalo and Sahiwal,
Cholistani and Red Sindhi cattle are the main dairy breeds of the Indian sub-continent
and are also kept in other parts of the world. So, considering the importance of
growth hormone and milk protein genes, the present study was undertaken in
indigenous buffalo and cattle breeds with the objectives to find out polymorphism in
bovine growth hormone and milk protein genes using PCR-RFLP technique.

36
Therefore, the aims / objectives of present study are as below:
To establish a molecular diagnostic assay for the detection of bovine growth
hormone (bGH), kappa-casein (-CN) and -lactoglobulin (-LG) genes for
the selection of dairy breeds in Pakistan.
To explore the frequency of bGH, κ-CN and β-LG alleles resulting from
polymorphisms and prevalence in Nili-Ravi buffaloes, Sahiwal cattle and their
molecular characterization.
37
CHAPTER 2
MATERIALS AND METHODS
2 Chemicals and reagents
All the general laboratory chemicals and reagents used in this study were of a high
purity or its equivalent. General laboratory materials, biochemical reagents and
reagents for molecular biology work were obtained from companies mentioned or
unless other was stated, the reagent and buffers were prepared according to the
manufacturer instruction. List of equipments and chemicals used in the present study
(Appendix-VII).
Sigma-Aldrich chemical company Ltd., http:/ www.sigmaaldrich.com
Bio-Rad laboratories, http:/ www.bio-rad.com
Roth, http:// www.roth.com
Fermentas, http:/ www.fermentas.com
New England biolab, http:/ www.neb.com
Promega, http:/ www.promega.com
Qiagen, http:/ www.qiagen.com
Roche diagnostics, http:/ www.roch.com
2.1 Animals
A total of three hundred and sixty six randomly selected female animals from
indigenous buffalo and cattle breeds were used in this study. The animals were
sampled from government livestock and private farms houses. Among government
farms these animals were kept at four livestock farms include i) Livestock Production
and Research Institute, Bahadurnagar, ii) Buffalo Research Institute, Pattoki, iii)
Livestock Experiment Station, Qadirabad and iv) Barani Livestock Production and
Research Institute, Kherimorat. Out of three hundred and sixty six animals, one

38
hundred and sixty three were of Nili-Ravi buffaloes (n =163) whereas two hundred
and three were of three cattle breeds include: Sahiwal (n =145), Red Sindhi (n=28)
and Cholistani (n=30).
2.2 Collection of blood samples
5-10 ml of peripheral blood was collected by juglar veinpuncture using 16 gugae
needles from each animal in K3-EDTA coated sterile vacutainers. These vacutainers
were maintained at -200
C until used in experimental work.
2.2.1 DNA Extraction
Phenol: chloroform method of DNA extraction was used for extraction of genomic
DNA from the experimental blood samples and is described below:
2.2.1a Phenol chloroform method
DNA was extracted from blood cells using phenol: chloroform method as described
by Sambrook et al. (1989). After thawing the frozen blood samples at room
temperature, take 750 µl of blood in 1.5 ml microfuge tube and add equal volume of
solution A (0.32 M sucrose, 10 mM Tris-HCl, 5 mM MgCl2). After mixing, the tubes
were kept at room temperature for 10 min. Centrifuge the tubes for 60 sec at 13000
rpm after mixing and vortexing. The supernatant was discarded and the pellet was re-
suspended in solution B (10 mM Tris-HCl, 400 mM NaCl, 2 mM EDTA). The
resultant pellet then re-suspended in 25 µl of 10 % SDS and 8 µl of proteinase K (20
mg / ml) (Appendix-I) followed by gentle mixing. Leave the tubes for overnight at
37o
C, or 65o
C in water bath for 3-5 hours. After incubation add the equal volume of
phenol (equilibrated with Tris-HCl) (Appendix-I) and chloroform: isoamyl alcohol
(24: 1). After thorough mixing centrifuge the tubes for 10 min at 13000 rpm. The
upper layer was carefully transferred to another clean tube followed by addition of
chloroform: isoamyl alcohol (24: 1). Centrifuge for 10 min at 13000 rpm and remove
aqueous phase (upper) in new 1.5 ml tube. To collect the aqueous phase, add 55 µl of
39
3 M sod. acetate (pH: 6) and equal volume of isopropanol (500 µl, stored at -20 o
C).
DNA was precipitated by centrifugation at 4° C for 10 min at 13000 rpm. DNA pellet
was washed by 70 % ethanol, the DNA pellet was dried through vacuum drier (speed
vac) or air and dissolve the DNA in DNA dissolving solution (200-250 µl) or PCR
grade water. Leave samples at room temperature overnight or at 37° C for 2 hour.
Check DNA by running on agarose gel.
2.2.2 Concentration and quality of extracted DNA
The concentration of the extracted DNA from the experimental samples were
determined with Gene quant spectrophotometer, UK. The absorbance ratio at 260 nm
and 280 nm (OD 260 / OD 280) provides an estimate of the purity of the DNA
sample. A ratio between 1.7-1.9 was considered as high purity of DNA. The quality
of extracted DNA was further evaluated by analyzing the DNA electrophoretically on
agarose gel after staining the gel with ethidium bromide and exposure to UV light
using eagle eye gel documentation system (Stratagene, USA).
2.3 Primers / Oligonucleotides
The primers or oligonucleotides used in this study for amplification of bovine growth
hormone, kappa-casein and beta-lactoglobulin genes fragments are presented in
Table: 2.1 were synthesized from MBI, Fermentas, Germany.
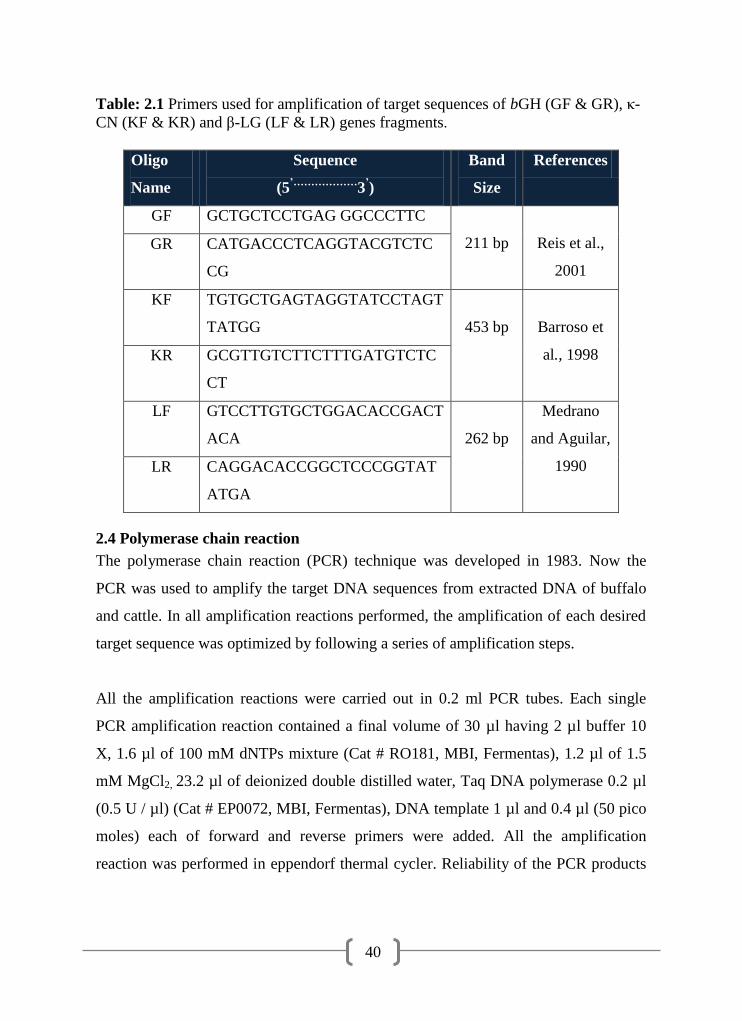
40
Table: 2.1 Primers used for amplification of target sequences of bGH (GF & GR), κ-
CN (KF & KR) and β-LG (LF & LR) genes fragments.
2.4 Polymerase chain reaction
The polymerase chain reaction (PCR) technique was developed in 1983. Now the
PCR was used to amplify the target DNA sequences from extracted DNA of buffalo
and cattle. In all amplification reactions performed, the amplification of each desired
target sequence was optimized by following a series of amplification steps.
All the amplification reactions were carried out in 0.2 ml PCR tubes. Each single
PCR amplification reaction contained a final volume of 30 µl having 2 µl buffer 10
X, 1.6 µl of 100 mM dNTPs mixture (Cat # RO181, MBI, Fermentas), 1.2 µl of 1.5
mM MgCl2, 23.2 µl of deionized double distilled water, Taq DNA polymerase 0.2 µl
(0.5 U / µl) (Cat # EP0072, MBI, Fermentas), DNA template 1 µl and 0.4 µl (50 pico
moles) each of forward and reverse primers were added. All the amplification
reaction was performed in eppendorf thermal cycler. Reliability of the PCR products
Oligo
Name
Sequence
(5’………………
3’)
Band
Size
References
GF GCTGCTCCTGAG GGCCCTTC
211 bp
Reis et al.,
2001
GR CATGACCCTCAGGTACGTCTC
CG
KF TGTGCTGAGTAGGTATCCTAGT
TATGG
453 bp
Barroso et
al., 1998 KR GCGTTGTCTTCTTTGATGTCTC
CT
LF GTCCTTGTGCTGGACACCGACT
ACA
262 bp
Medrano
and Aguilar,
1990 LR CAGGACACCGGCTCCCGGTAT
ATGA
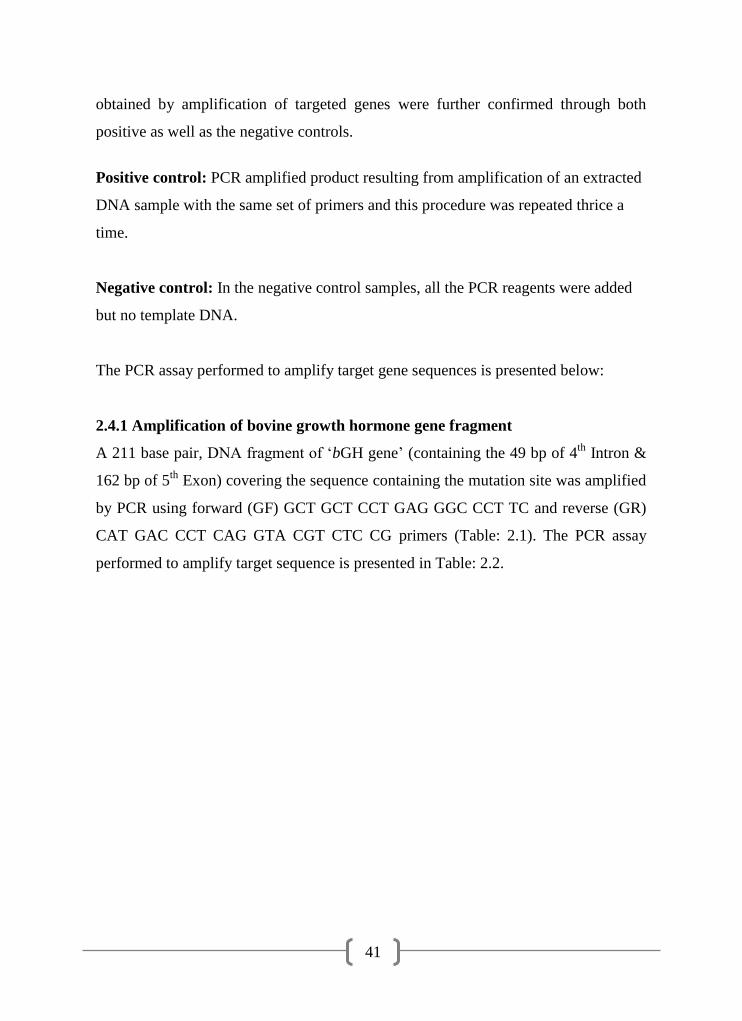
41
obtained by amplification of targeted genes were further confirmed through both
positive as well as the negative controls.
Positive control: PCR amplified product resulting from amplification of an extracted
DNA sample with the same set of primers and this procedure was repeated thrice a
time.
Negative control: In the negative control samples, all the PCR reagents were added
but no template DNA.
The PCR assay performed to amplify target gene sequences is presented below:
2.4.1 Amplification of bovine growth hormone gene fragment
A 211 base pair, DNA fragment of „bGH gene‟ (containing the 49 bp of 4th
Intron &
162 bp of 5th
Exon) covering the sequence containing the mutation site was amplified
by PCR using forward (GF) GCT GCT CCT GAG GGC CCT TC and reverse (GR)
CAT GAC CCT CAG GTA CGT CTC CG primers (Table: 2.1). The PCR assay
performed to amplify target sequence is presented in Table: 2.2.
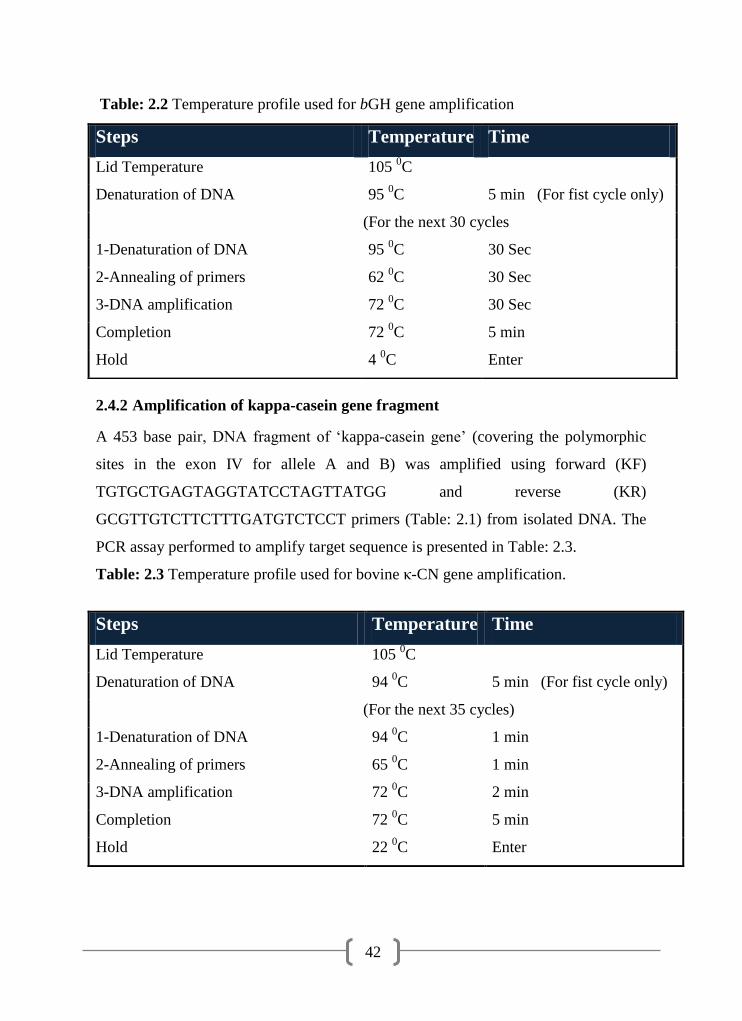
42
Table: 2.2 Temperature profile used for bGH gene amplification
2.4.2 Amplification of kappa-casein gene fragment
A 453 base pair, DNA fragment of „kappa-casein gene‟ (covering the polymorphic
sites in the exon IV for allele A and B) was amplified using forward (KF)
TGTGCTGAGTAGGTATCCTAGTTATGG and reverse (KR)
GCGTTGTCTTCTTTGATGTCTCCT primers (Table: 2.1) from isolated DNA. The
PCR assay performed to amplify target sequence is presented in Table: 2.3.
Table: 2.3 Temperature profile used for bovine κ-CN gene amplification.
Steps Temperature Time
Lid Temperature 105 0C
Denaturation of DNA 95 0C 5 min (For fist cycle only)
(For the next 30 cycles
1-Denaturation of DNA 95 0C 30 Sec
2-Annealing of primers 62 0C 30 Sec
3-DNA amplification 72 0C 30 Sec
Completion 72 0C 5 min
Hold 4 0C Enter
Steps Temperature Time
Lid Temperature 105 0C
Denaturation of DNA 94 0C 5 min (For fist cycle only)
(For the next 35 cycles)
1-Denaturation of DNA 94 0C 1 min
2-Annealing of primers 65 0C 1 min
3-DNA amplification 72 0C 2 min
Completion 72 0C 5 min
Hold 22 0C Enter

43
2.4.3 Amplification of beta-lactoglobulin gene fragment
A 262 base pair, DNA fragment of „β-LG gene‟ covering the polymorphic sites
(containing the 94 bp of 4th
Exon & 168 bp of 4th
Intron) for allele A and B was
amplified through PCR using forward (LF) GTCCTTGTGCTGGACACCGACTACA
and reverse (LR) CAGGACACCGGCTCCCGGTATATGA primers (Table: 2.1).
The PCR assay performed to amplify target sequences is presented in Table: 2.4.
Table: 2.4 Temperature profile used for bovine β-LG gene amplification.
The specificity and concentration of the amplicons were checked by loading 5 µl of
the amplified product from each tube after being mixed with 2 µl of loading dye on
1.8 % ethidium bromide (concentration of 10 mg/ml) (Appendix-I) stained agarose
gel in 1X TBE buffer (Appendix-II). A DNA band of discrete size confirmed through
DNA marker was visible under UV light and a photograph was taken in gel-doc
equipment (Eagle eye gel documentation system, Stratagene, USA).
Steps Temperature Time
Lid Temperature 105 0C
Denaturation of DNA 97 0C 3 min (For fist cycle
only)
(For the next 35 cycles)
1-Denaturation of DNA 94 0C 1 min
2-Annealing of primers 60 0C 1 min
3-DNA amplification 72 0C 2 min
Completion 72 0C 5 min
Hold 22 0C Enter

44
2.4.4 Gel electrophoresis
The resulted PCR amplified products of encoding genes were resolved on 1.8 %
agarose gel. This was prepared by melting 1.8 grams of agarose in 100 ml of 1X TBE
buffer (0.89 M Tris-Borate, 0.025 M EDTA), in a micro-wave oven for 2-5 minutes.
Ethidium bromide with a final concenteration (10 mg / ml) was added to stain the
DNA for their visualization after completion of gel electrophoresis. PCR products
were mixed with 6 X loading dye (Appendix-I). The electrophoresis was performed
in horizontal gel electrophoresis system (Midi) (Sci-Plas, UK) at 100 volts for 30-40
minutes using 1 X TBE buffer. Resolved PCR products were visualized by placing
the gel on gel documentation system (Eagle eye gel documentation system,
stratagene, USA).
2.4.5 Purification of amplified PCR products
The amplified PCR products (amplicons) obtained for bovine growth hormone,
kappa-casein and beta-lactoglobulin genes were purified by Wizard® PCR Preps
DNA purification system (Appendix-V). The purified PCR product obtained from
each sample was used for genotyping by RFLP and DNA sequencing. In certain cases
the purified PCR product was cloned into TA cloning vector for DNA sequencing.
The cloned PCR product was ligated in to PTZ57R/T cloning vector (Cat NO. K1214,
MBI, Fermentas) (Appendix-IV) and transformed into competent E.coli cells,
transformants containing the PCR products were selected on LB agar plates
(Appendix-III) supplemented with antibiotic as selection marker. Plasmid DNA
(containing the desired amplified PCR product) was isolated (Appendix-III).
2.5 PCR-RFLP genotype assay:
For detection of bovine growth hormone, kappa casein and beta-lactoglobulin
genotypes in experimental samples of buffalo and cattle breeds, PCR-RFLP assay
was carried out. In this system, a particular DNA fragment of interest is amplified
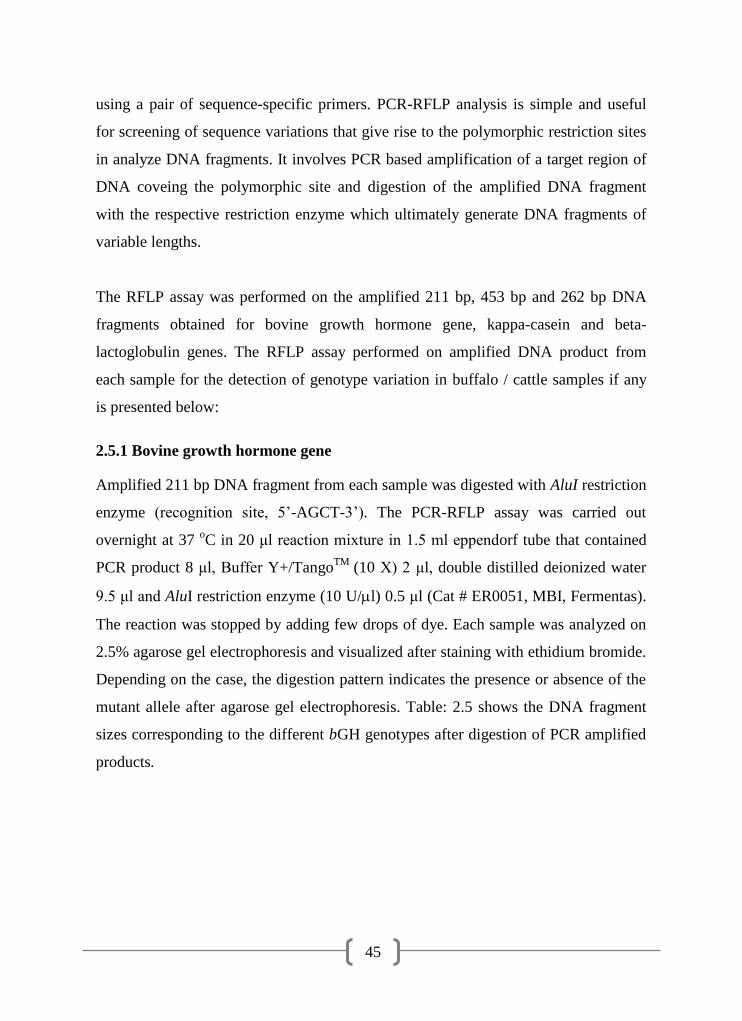
45
using a pair of sequence-specific primers. PCR-RFLP analysis is simple and useful
for screening of sequence variations that give rise to the polymorphic restriction sites
in analyze DNA fragments. It involves PCR based amplification of a target region of
DNA coveing the polymorphic site and digestion of the amplified DNA fragment
with the respective restriction enzyme which ultimately generate DNA fragments of
variable lengths.
The RFLP assay was performed on the amplified 211 bp, 453 bp and 262 bp DNA
fragments obtained for bovine growth hormone gene, kappa-casein and beta-
lactoglobulin genes. The RFLP assay performed on amplified DNA product from
each sample for the detection of genotype variation in buffalo / cattle samples if any
is presented below:
2.5.1 Bovine growth hormone gene
Amplified 211 bp DNA fragment from each sample was digested with AluI restriction
enzyme (recognition site, 5‟-AGCT-3‟). The PCR-RFLP assay was carried out
overnight at 37 oC in 20 μl reaction mixture in 1.5 ml eppendorf tube that contained
PCR product 8 μl, Buffer Y+/TangoTM
(10 X) 2 μl, double distilled deionized water
9.5 μl and AluI restriction enzyme (10 U/l) 0.5 μl (Cat # ER0051, MBI, Fermentas).
The reaction was stopped by adding few drops of dye. Each sample was analyzed on
2.5% agarose gel electrophoresis and visualized after staining with ethidium bromide.
Depending on the case, the digestion pattern indicates the presence or absence of the
mutant allele after agarose gel electrophoresis. Table: 2.5 shows the DNA fragment
sizes corresponding to the different bGH genotypes after digestion of PCR amplified
products.

46
Table: 2.5 DNA fragment sizes corresponding to the different bGH genotypes after
digestion of PCR amplified products according to the Reis et al. (2001).
2.5.2 Bovine kappa-casein gene
The purified amplified PCR product (453 bp) from each sample was subjected to
digestion with three restriction endonucleases i.e: Hinf I (recognition site, 5‟-
GANTC-3‟), Hae III (recognition site, 5‟-GGCC-3‟) and Mae II (recognition site, 5‟-
ACGT-3‟) independently. The enzymatic reaction was performed in a total volume of
20 μl in a 1.5 ml eppendorf tube that contained amplified PCR product 8μl, reaction
buffer (10 X) 2 μl, double distilled deionized water 9.5 μl and respective restriction
enzyme (10 U/l) 0.5 μl. Each tube was incubated at 370
C for 12-16 hours in three
separate reaction tubes, with appropriate volume of water and that of optimum buffer
for each enzyme. Table: 2.6 shows DNA fragment sizes for each genotypes of -CN
locus after digestion with HinfI, HaeIII and MaeII restriction enzymes.
Genotypes Restriction Fragments
sizes (Restriction Enzyme
Alu I)
LL 159, 52 bp
LV 211, 159, 52 bp
VV 211 bp
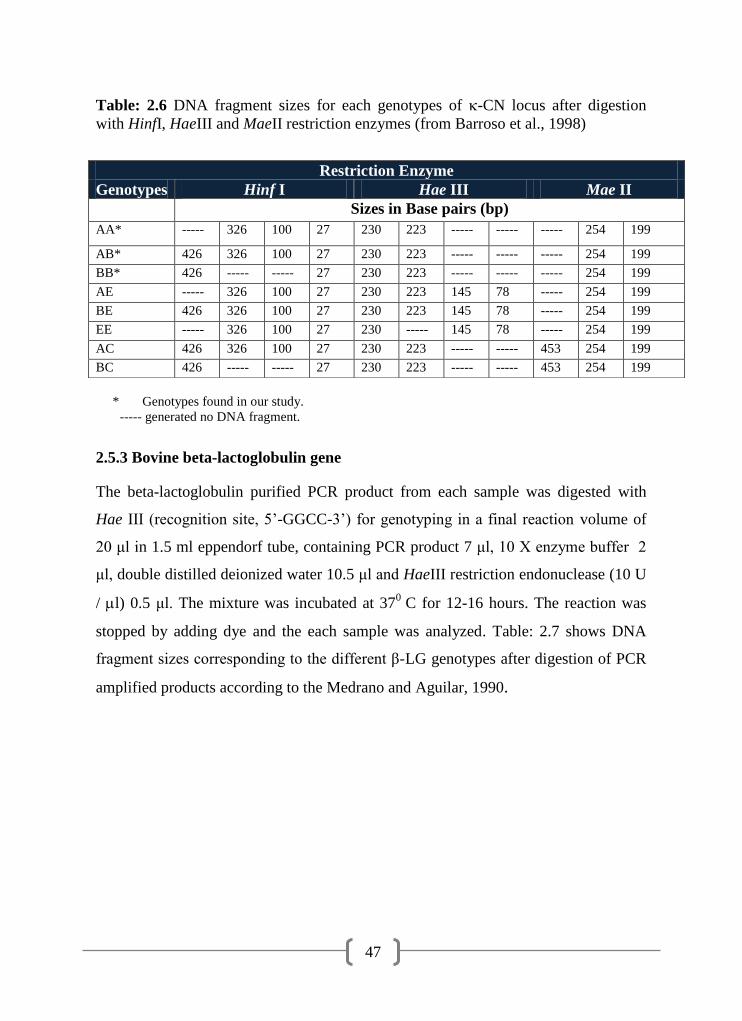
47
Table: 2.6 DNA fragment sizes for each genotypes of -CN locus after digestion
with HinfI, HaeIII and MaeII restriction enzymes (from Barroso et al., 1998)
* Genotypes found in our study.
----- generated no DNA fragment.
2.5.3 Bovine beta-lactoglobulin gene
The beta-lactoglobulin purified PCR product from each sample was digested with
Hae III (recognition site, 5‟-GGCC-3‟) for genotyping in a final reaction volume of
20 μl in 1.5 ml eppendorf tube, containing PCR product 7 μl, 10 X enzyme buffer 2
μl, double distilled deionized water 10.5 μl and HaeIII restriction endonuclease (10 U
/ l) 0.5 μl. The mixture was incubated at 370
C for 12-16 hours. The reaction was
stopped by adding dye and the each sample was analyzed. Table: 2.7 shows DNA
fragment sizes corresponding to the different β-LG genotypes after digestion of PCR
amplified products according to the Medrano and Aguilar, 1990.
Restriction Enzyme
Genotypes Hinf I Hae III Mae II
Sizes in Base pairs (bp)
AA* ----- 326 100 27 230 223 ----- ----- ----- 254 199
AB* 426 326 100 27 230 223 ----- ----- ----- 254 199
BB* 426 ----- ----- 27 230 223 ----- ----- ----- 254 199
AE ----- 326 100 27 230 223 145 78 ----- 254 199
BE 426 326 100 27 230 223 145 78 ----- 254 199
EE ----- 326 100 27 230 ----- 145 78 ----- 254 199
AC 426 326 100 27 230 223 ----- ----- 453 254 199
BC 426 ----- ----- 27 230 223 ----- ----- 453 254 199
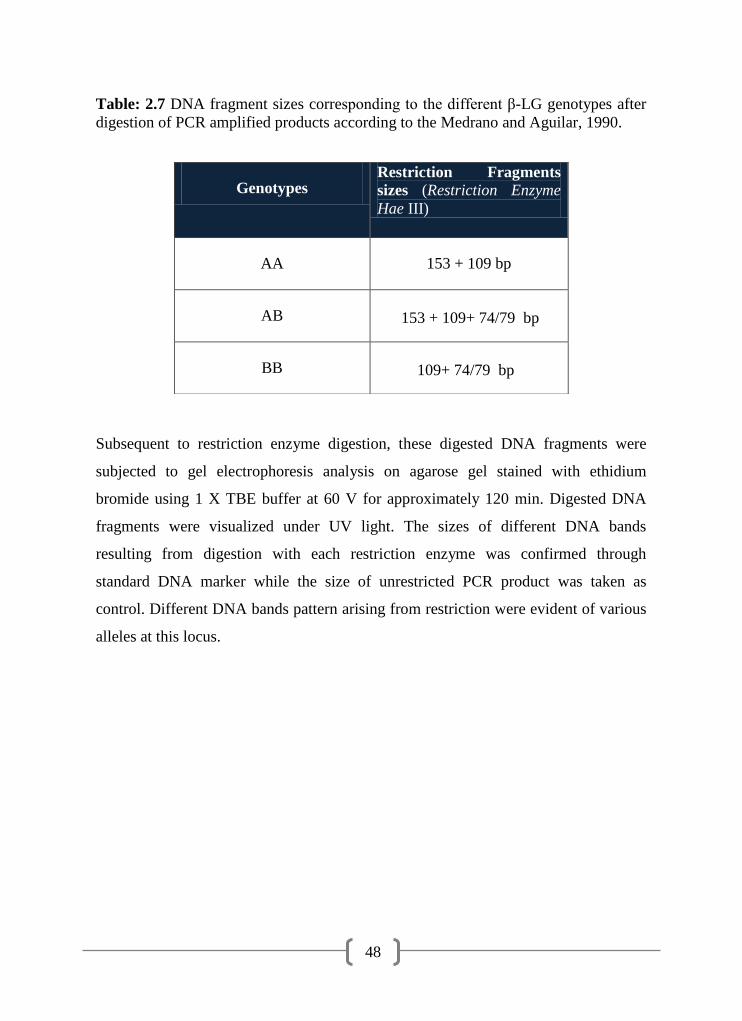
48
Table: 2.7 DNA fragment sizes corresponding to the different β-LG genotypes after
digestion of PCR amplified products according to the Medrano and Aguilar, 1990.
Subsequent to restriction enzyme digestion, these digested DNA fragments were
subjected to gel electrophoresis analysis on agarose gel stained with ethidium
bromide using 1 X TBE buffer at 60 V for approximately 120 min. Digested DNA
fragments were visualized under UV light. The sizes of different DNA bands
resulting from digestion with each restriction enzyme was confirmed through
standard DNA marker while the size of unrestricted PCR product was taken as
control. Different DNA bands pattern arising from restriction were evident of various
alleles at this locus.
Genotypes Restriction Fragments
sizes (Restriction Enzyme
Hae III)
AA 153 + 109 bp
AB
153 + 109+ 74/79 bp
BB
109+ 74/79 bp
49
2.6 Allele frequency estimation
After confirming the specific genotype for each animal, the allelic frequencies were
calculated by counting method. A chi-square test (χ2) at one degree of freedom (P <
0.05) (contingency Table: 4.4, Appendix-VI) was employed to see if the populations
of animals used in this study were in Hardy-Weinberg Equilibrium (Pennington,
2000). Where p is the frequency of dominant allele and q is the frequency of recessive
allele. p is designated as all the alleles in animals, who are AA and half of the alleles
in animals who are Aa while q is designated as all of the alleles in animals who are aa
and the remaining other half of the alleles in animals who are Aa. So, the allele
frequency of the bGH, κ-CN and β-LG genes was calculated as follows;
Eq. 1 p = 2(AA) + (Aa)
2N
Eq. 2 q = 2(aa) + (Aa)
2N
Where, p =the gene frequency of L allele, q =the gene frequency of V allele and N is
the total number of tested animals.

50
2.7 DNA sequencing
The cloned DNA fragments were sequenced using automated sequencer (Macrogen,
Korea). The gene sequences were compared with other available sequences in Gene
Bank database using NCBI/BLAST. The database search of sequences for a possible
match to the DNA sequence of respective gene was conducted using
(www.ncbi.nlm.gov/BLAST) to ascertain that the sequences were of respective
genes.
2.7.1 Distance tree analysis
The distance tree analysis of the sequenced fragments of Nili-Ravi buffaloes for
growth hormone, kappa-casein and beta-lactoglobulin genes sequence were carried
out. A rooted genetic dendrogram was constructed by neighbor-joining method and
phylogenetic relationship (www.ncbi.nlm.gov/BLAST) was determined between
sequences.

51
CHAPTER 3
RESULTS
In the present study, an attempt has been made to analyze bovine growth hormone,
kappa-casein and beta-lactoglobulin genes polymorphism in Pakistani buffalo and
cattle breeds using molecular approaches. For this blood samples were randomly
collected from animals of selected breeds (buffalo and cattle breeds) available at the
government and private farms. The genomic DNA was extracted from collected blood
samples (See Materials and Methods) and analyzed. The results are presented below:
3.1 Purity of extracted DNA
Electrophoretic analysis of extracted genomic DNA from blood samples of selected
buffalo and cattle using 0.8-1% agarose gel followed by observation on UV
transilluminator revealed high molecular weight bands of DNA (Figure: 3.1).
The visual estimation revealed that the presence of DNA in all samples. The
concentration of DNA varies in samples. The DNA concentration was measured
spectrophotometrically and it was found to be from 20-200 micro-gram / ml. The
optical density (OD) reading obtained at 260 nm and 280 nm by using UV
spectrophotometer were used to estimate the quality and quantity of isolated DNA.
The ratio of the reading ranged from 1.7 to 1.9 which indicates fairly good quality
Fig: 3.1 Analysis of genomic DNA extracted from blood samples on 0.8 % agarose
gel. Lanes 1-4 genomic DNA from Nili-Ravi buffaloes, Lanes 5-8; 9-12 and 13-16
genomic DNA from cattle breeds, Sahiwal, Cholistani and Red Sindhi respectively.
1 2 3 4 5 6 7 8 9 10 11 12 13 14 15 16

52
DNA and there is no contamination. The result indicated that DNA extraction method
was good and extracted DNA was suitable for PCR-RFLP analysis.
3.2 Polymerase chain reaction analysis
The amplified PCR product‟s obtained from isolated genomic DNA from animals by
applying polymerase chain reaction (PCR) technique by using specific forward and
reverse primers (Table: 2.1) were analyzed electrophoretically on agarose gel
alongwith negative and positive control samples. The results are presented in Figures:
3.2, 3.3 & 3.4.
3.2.1 Amplification of bovine growth hormone gene
Figure 3.2 represent the analysis of amplified bovine growth hormone gene from
buffalo and cattle breeds along with negative, positive control and 50 bp DNA size
marker. The amplification product of two hundred and eleven base pair (211 bp) was
observed in all the samples as judged from agarose gel electrophoresis. No
amplification was observed in negative control.
Fig: 3.2 Analysis of amplified product of bovine growth hormone (4th
intron & 5th
exon) on 1.8 % agarose gel. Lane 1: 50 bp DNA ladder (Cat # SM0371, MBI,
Fermentas), Lane 2: Positive control. Lane 3: Negative control. Lane 4: Nili-Ravi
buffalo, Lane 5: Sahiwal, Lane 6: Cholistani & Lane 7: from Red Sindhi cattle which
resulted in 211 bp PCR product.
1 2 3 4 5 6 7
211 bp
500 bp
200 bp
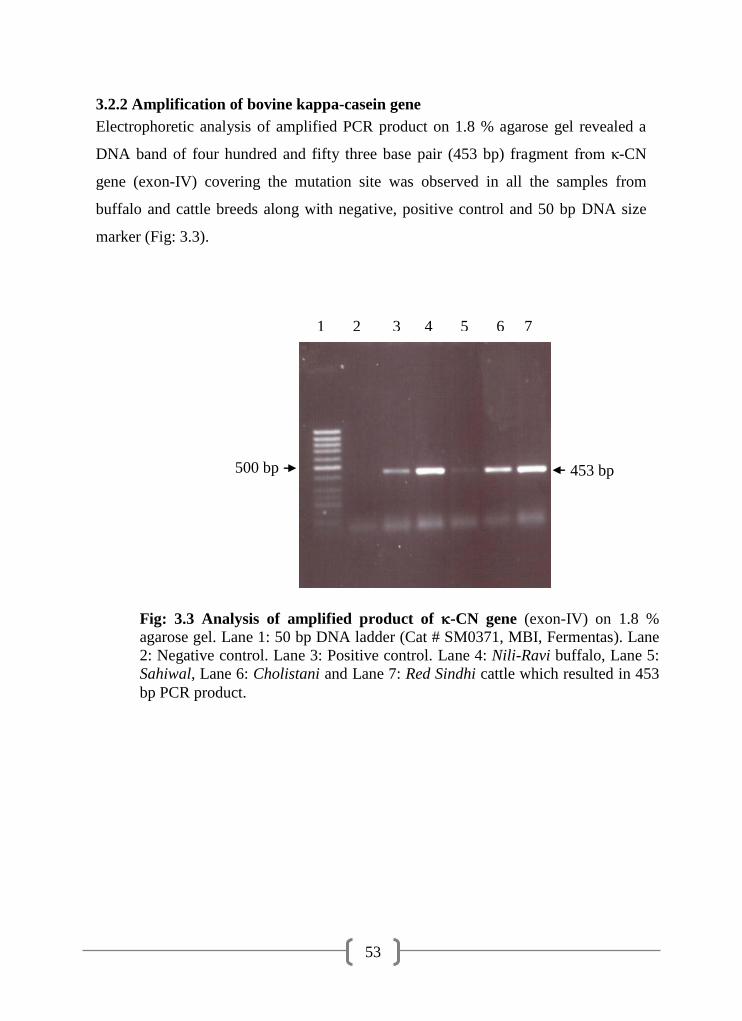
53
3.2.2 Amplification of bovine kappa-casein gene
Electrophoretic analysis of amplified PCR product on 1.8 % agarose gel revealed a
DNA band of four hundred and fifty three base pair (453 bp) fragment from κ-CN
gene (exon-IV) covering the mutation site was observed in all the samples from
buffalo and cattle breeds along with negative, positive control and 50 bp DNA size
marker (Fig: 3.3).
1 2 3 4 5 6 7
Fig: 3.3 Analysis of amplified product of -CN gene (exon-IV) on 1.8 %
agarose gel. Lane 1: 50 bp DNA ladder (Cat # SM0371, MBI, Fermentas). Lane
2: Negative control. Lane 3: Positive control. Lane 4: Nili-Ravi buffalo, Lane 5:
Sahiwal, Lane 6: Cholistani and Lane 7: Red Sindhi cattle which resulted in 453
bp PCR product.
500 bp 453 bp
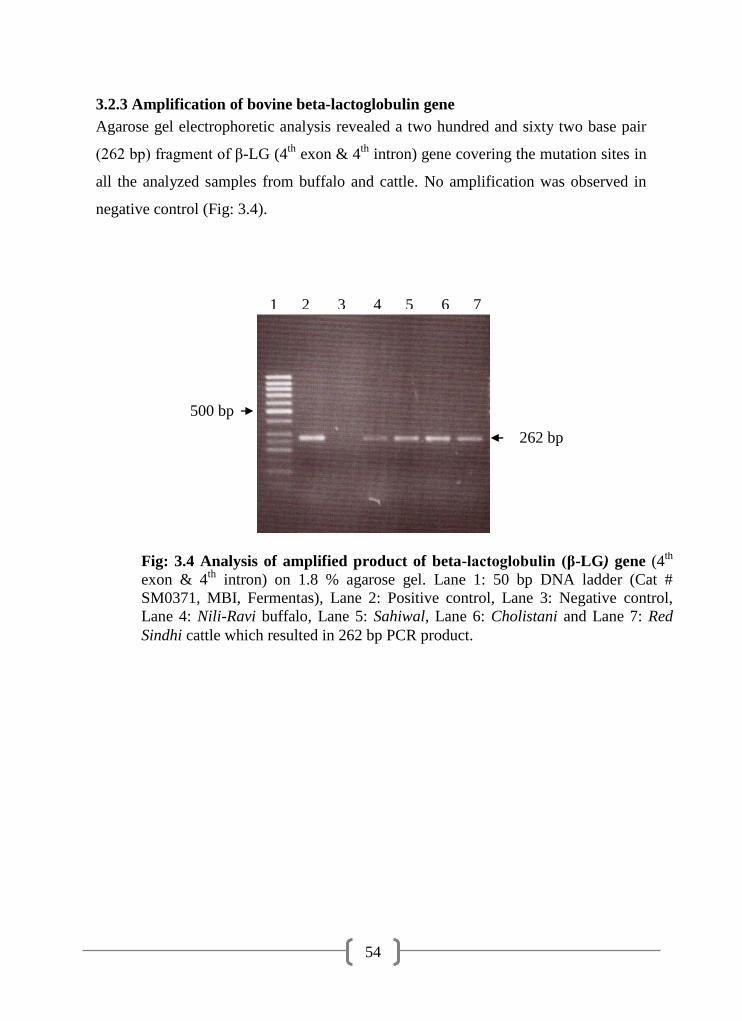
54
3.2.3 Amplification of bovine beta-lactoglobulin gene
Agarose gel electrophoretic analysis revealed a two hundred and sixty two base pair
(262 bp) fragment of β-LG (4th
exon & 4th
intron) gene covering the mutation sites in
all the analyzed samples from buffalo and cattle. No amplification was observed in
negative control (Fig: 3.4).
Fig: 3.4 Analysis of amplified product of beta-lactoglobulin (β-LG) gene (4th
exon & 4th
intron) on 1.8 % agarose gel. Lane 1: 50 bp DNA ladder (Cat #
SM0371, MBI, Fermentas), Lane 2: Positive control, Lane 3: Negative control,
Lane 4: Nili-Ravi buffalo, Lane 5: Sahiwal, Lane 6: Cholistani and Lane 7: Red
Sindhi cattle which resulted in 262 bp PCR product.
1 2 3 4 5 6 7
8
500 bp
262 bp
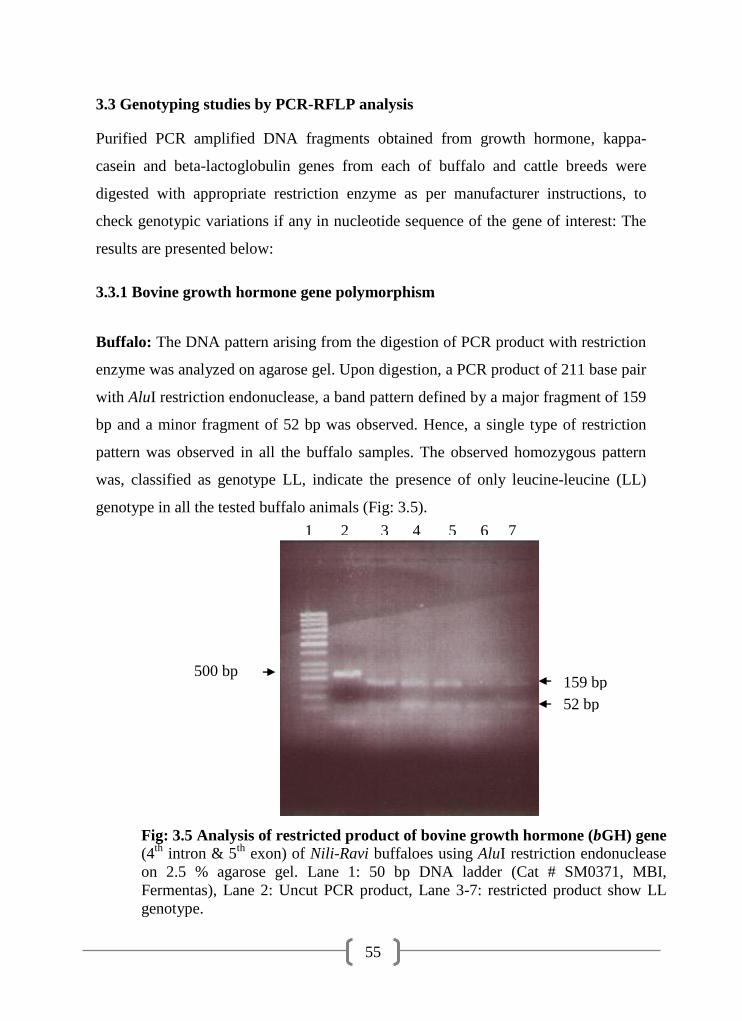
55
3.3 Genotyping studies by PCR-RFLP analysis
Purified PCR amplified DNA fragments obtained from growth hormone, kappa-
casein and beta-lactoglobulin genes from each of buffalo and cattle breeds were
digested with appropriate restriction enzyme as per manufacturer instructions, to
check genotypic variations if any in nucleotide sequence of the gene of interest: The
results are presented below:
3.3.1 Bovine growth hormone gene polymorphism
Buffalo: The DNA pattern arising from the digestion of PCR product with restriction
enzyme was analyzed on agarose gel. Upon digestion, a PCR product of 211 base pair
with AluI restriction endonuclease, a band pattern defined by a major fragment of 159
bp and a minor fragment of 52 bp was observed. Hence, a single type of restriction
pattern was observed in all the buffalo samples. The observed homozygous pattern
was, classified as genotype LL, indicate the presence of only leucine-leucine (LL)
genotype in all the tested buffalo animals (Fig: 3.5).
1 2 3 4 5 6 7
Fig: 3.5 Analysis of restricted product of bovine growth hormone (bGH) gene (4
th intron & 5
th exon) of Nili-Ravi buffaloes using AluI restriction endonuclease
on 2.5 % agarose gel. Lane 1: 50 bp DNA ladder (Cat # SM0371, MBI,
Fermentas), Lane 2: Uncut PCR product, Lane 3-7: restricted product show LL
genotype.
.
500 bp 159 bp
52 bp

56
Cattle breeds: An amplified DNA fragment of 211 bp from cattle breeds was
digested with AluI restriction enzyme, two types of DNA banding pattern were
observed (Figure 3.6). Allelic variation was seen in cattle breeds i. e Sahiwal,
Cholistani and Red Sindhi; where one restriction site for LL and two restriction sites
for LV genotypes which yielded 159 & 52 bp and 211, 159 and 52 bp DNA
fragments respectively (Fig: 3.6) indicate the presence of two alleles Leu (L) and Val
(V) in two genotypic forms that is LL and LV were confirmed through restriction
analysis. No valine-valine (VV) genotype was found among animals under study. So,
this was confirmed that for L allele digestion with AluI generated two fragments (159,
and 52 bp) while in heterozygous form three fragments were evident of both L and V
alleles. Our PCR-RFLP based data revealed that LL is the most prevalent variant of
bGH gene in Pakistani dairy cattle, while only few animals had the LV variant and
there was no VV variant in any of these cattle.
Fig: 3.6 Analysis of restricted product of bovine growth hormone (bGH)
gene (4th
intron & 5th
exon) of cattle breeds with AluI restriction endonuclease
on 2.5% agarose gel. Lane 1: 50 bp DNA ladder (Cat # SM0371, MBI,
Fermentas), Lane 2 & 3: samples from Sahiwal, Lane 4 & 5: Cholistani, Lane 6
& 7: Red Sindhi cattle breeds & Lane 8: Control uncut PCR product.
1 2 3 4 5 6 7 8
159 bp
500 bp
52 bp
211 bp
LL LL LL LV LV LL
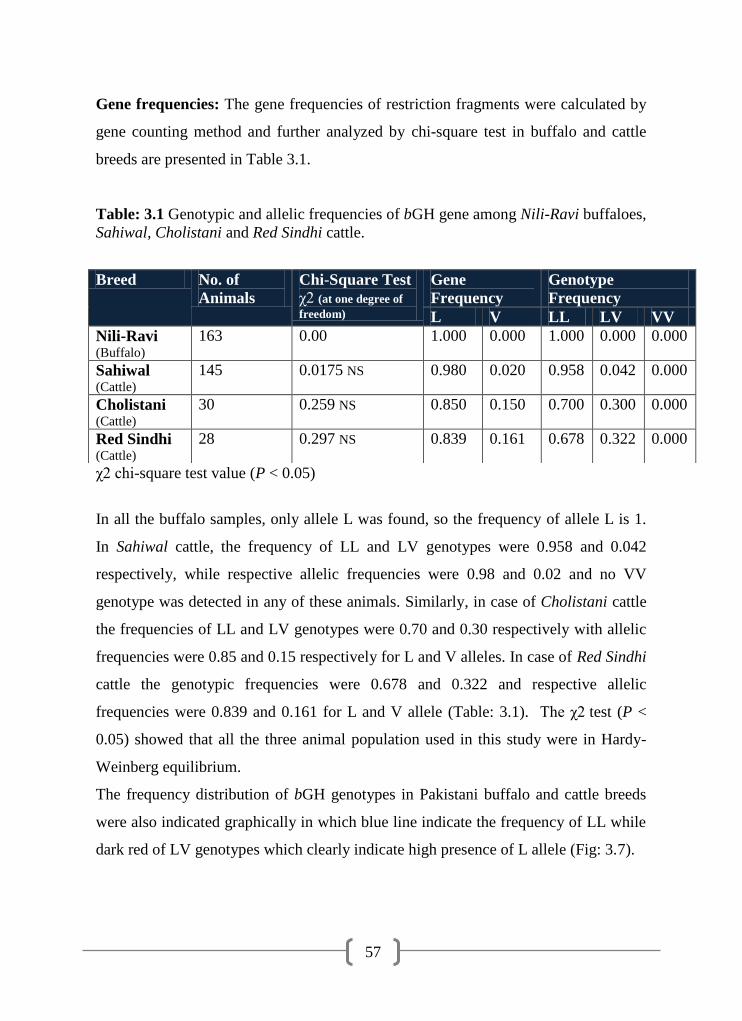
57
Gene frequencies: The gene frequencies of restriction fragments were calculated by
gene counting method and further analyzed by chi-square test in buffalo and cattle
breeds are presented in Table 3.1.
Table: 3.1 Genotypic and allelic frequencies of bGH gene among Nili-Ravi buffaloes,
Sahiwal, Cholistani and Red Sindhi cattle.
χ2 chi-square test value (P < 0.05)
In all the buffalo samples, only allele L was found, so the frequency of allele L is 1.
In Sahiwal cattle, the frequency of LL and LV genotypes were 0.958 and 0.042
respectively, while respective allelic frequencies were 0.98 and 0.02 and no VV
genotype was detected in any of these animals. Similarly, in case of Cholistani cattle
the frequencies of LL and LV genotypes were 0.70 and 0.30 respectively with allelic
frequencies were 0.85 and 0.15 respectively for L and V alleles. In case of Red Sindhi
cattle the genotypic frequencies were 0.678 and 0.322 and respective allelic
frequencies were 0.839 and 0.161 for L and V allele (Table: 3.1). The χ2 test (P <
0.05) showed that all the three animal population used in this study were in Hardy-
Weinberg equilibrium.
The frequency distribution of bGH genotypes in Pakistani buffalo and cattle breeds
were also indicated graphically in which blue line indicate the frequency of LL while
dark red of LV genotypes which clearly indicate high presence of L allele (Fig: 3.7).
Breed No. of
Animals
Chi-Square Test
χ2 (at one degree of
freedom)
Gene
Frequency
Genotype
Frequency
L V LL LV VV
Nili-Ravi (Buffalo)
163 0.00 1.000 0.000 1.000 0.000 0.000
Sahiwal (Cattle)
145 0.0175 NS 0.980 0.020 0.958 0.042 0.000
Cholistani (Cattle)
30 0.259 NS 0.850 0.150 0.700 0.300 0.000
Red Sindhi (Cattle)
28 0.297 NS 0.839 0.161 0.678 0.322 0.000
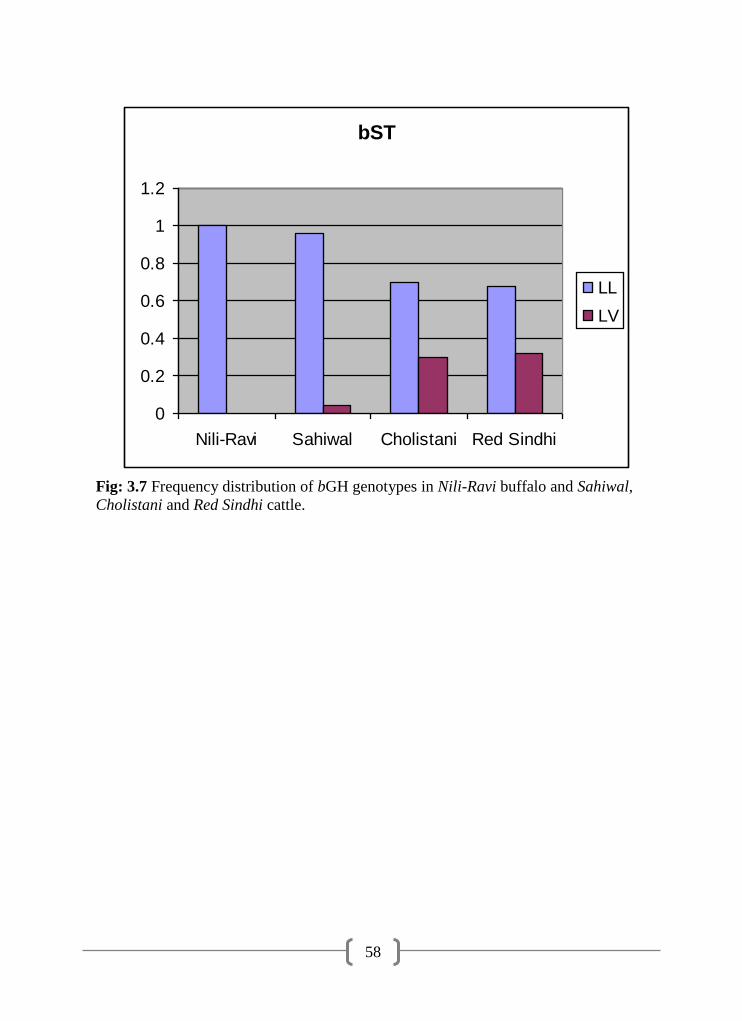
58
Fig: 3.7 Frequency distribution of bGH genotypes in Nili-Ravi buffalo and Sahiwal,
Cholistani and Red Sindhi cattle.
bST
0
0.2
0.4
0.6
0.8
1
1.2
Nili-Ravi Sahiwal Cholistani Red Sindhi
LL
LV

59
3.3.2 Bovine kappa-casein gene polymorphism
The purified PCR amplified DNA fragment of kappa-casein gene from each of
buffalo and cattle breeds were separately digested independently with three restriction
enzymes HinfI, HaeIII and MaeII as per manufacturer instructions to check variations
in the nucleotide sequence of gene of interest.
Buffalo: The DNA pattern arising from the digestion of each PCR product with each
of the three enzymes was analyzed to know its genotype. All the amplified products
from buffalo animals, upon digestion with Hinf I generated two DNA fragments (426
and 27 bp) (Fig: 3.8) indicates the presence of only one restriction site for Hinf I.
Digestion of the same PCR product with each of Hae III and Mae II yielded two
separate DNA fragments of different sizes i.e. 223 & 230 bp and 254 & 199 bp
respectively (Fig: 3.10 & 3.11). The cumulative allelic pattern observed from the
digestion of κ-CN gene fragment from buffalo depicted the existence of only BB
genotype.
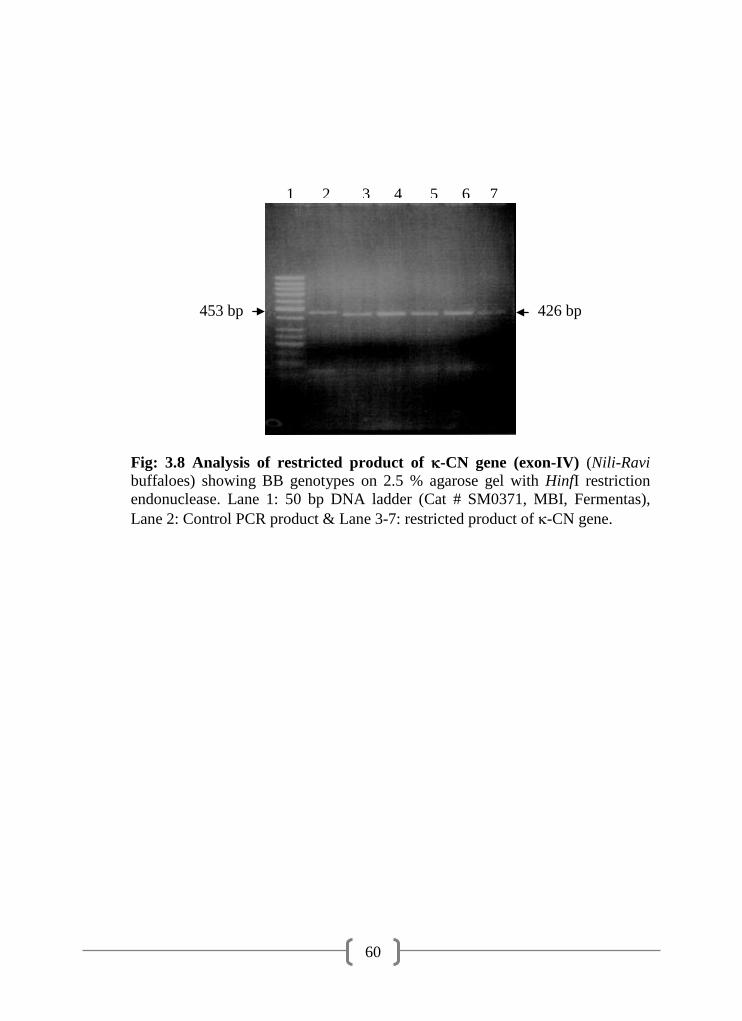
60
1 2 3 4 5 6 7
Fig: 3.8 Analysis of restricted product of -CN gene (exon-IV) (Nili-Ravi
buffaloes) showing BB genotypes on 2.5 % agarose gel with HinfI restriction
endonuclease. Lane 1: 50 bp DNA ladder (Cat # SM0371, MBI, Fermentas),
Lane 2: Control PCR product & Lane 3-7: restricted product of -CN gene.
453 bp 426 bp
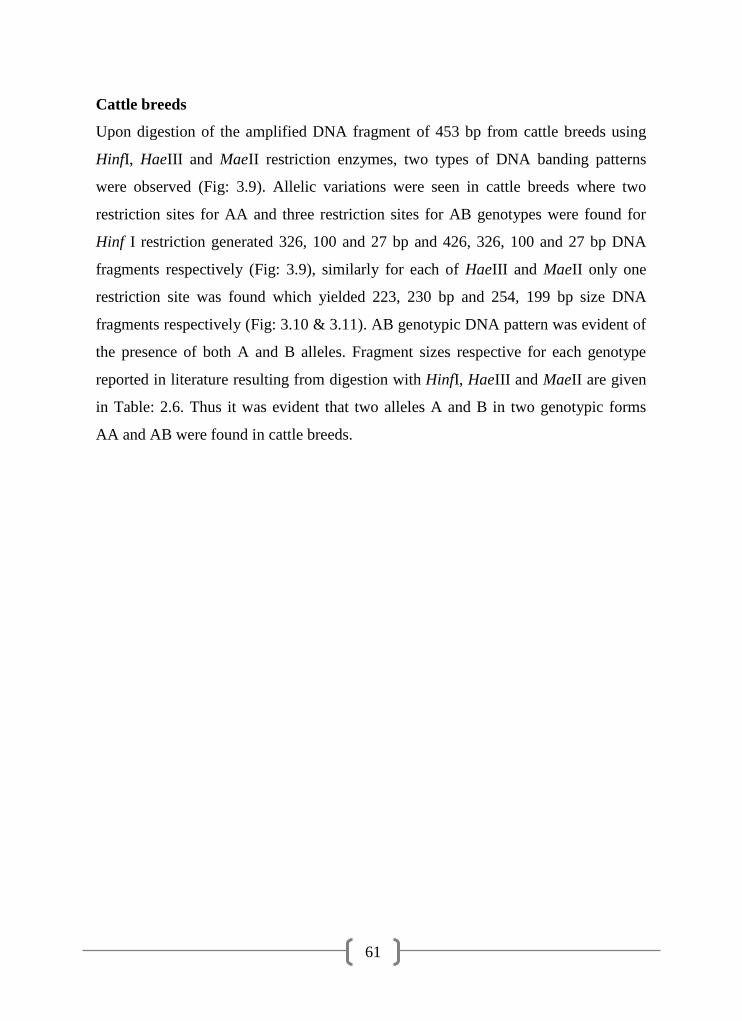
61
Cattle breeds
Upon digestion of the amplified DNA fragment of 453 bp from cattle breeds using
HinfI, HaeIII and MaeII restriction enzymes, two types of DNA banding patterns
were observed (Fig: 3.9). Allelic variations were seen in cattle breeds where two
restriction sites for AA and three restriction sites for AB genotypes were found for
Hinf I restriction generated 326, 100 and 27 bp and 426, 326, 100 and 27 bp DNA
fragments respectively (Fig: 3.9), similarly for each of HaeIII and MaeII only one
restriction site was found which yielded 223, 230 bp and 254, 199 bp size DNA
fragments respectively (Fig: 3.10 & 3.11). AB genotypic DNA pattern was evident of
the presence of both A and B alleles. Fragment sizes respective for each genotype
reported in literature resulting from digestion with HinfI, HaeIII and MaeII are given
in Table: 2.6. Thus it was evident that two alleles A and B in two genotypic forms
AA and AB were found in cattle breeds.

62
FFiigg:: 33..99 AAnnaallyyssiiss ooff rreessttrriicctteedd pprroodduucctt ooff -CN gene from cattle breeds
showing AA and AB genotypes ((eexxoonn--IIVV)) oonn 22 %% aaggaarroossee ggeell wwiitthh HHiinnffII
rreessttrriiccttiioonn eennddoonnuucclleeaassee.. LLaannee 11:: 5500 bp DNA Ladder (Cat # SM0371, MBI,
Fermentas), Lane 2 & 3: samples from Sahiwal, Lane 4 & 5: Cholistani, Lane
6: Red Sindhi cattle & Lane 7: Uncut PCR product
1 2 3 4 5 6 7
426 bp
100 bp
453 bp
326 bp
AA AA AB AB
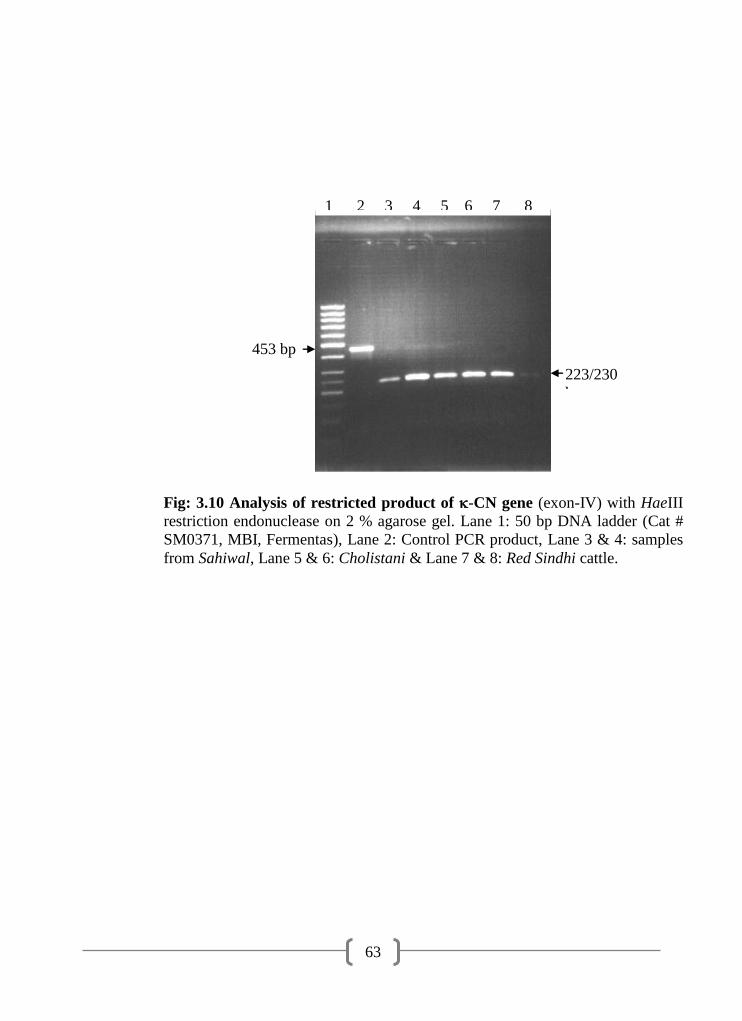
63
1 2 3 4 5 6 7 8
Fig: 3.10 Analysis of restricted product of -CN gene (exon-IV) with HaeIII
restriction endonuclease on 2 % agarose gel. Lane 1: 50 bp DNA ladder (Cat #
SM0371, MBI, Fermentas), Lane 2: Control PCR product, Lane 3 & 4: samples
from Sahiwal, Lane 5 & 6: Cholistani & Lane 7 & 8: Red Sindhi cattle.
453 bp
223/230
bp

64
1 2 3 4 5 6 7 8
Fig: 3.11 Analysis of restricted product of -CN gene (exon-IV) with MaeII
restriction endonuclease on 2 % agarose gel. Lane 1: 50 bp DNA ladder (Cat #
SM0371, MBI, Fermentas), Lane 2: Control PCR product, Lane 3 & 4: samples
from Sahiwal, Lane 5 & 6: Cholistani & Lane 7 & 8: Red Sindhi cattle.
453 bp
254 bp 199 bp

65
Gene frequencies
The gene frequencies of restricted fragments were calculated applying gene counting
method and further analyzed by chi-square test presented (Table: 3.2).
Table: 3.2 Genotypic and allelic frequencies for -CN gene among Nili-Ravi
buffaloes and Sahiwal, Cholistani and Red Sindhi cattle.
χ2 chi-square test value (P < 0.05)
* Significant, NS-non significant
In all the analyzed buffalo samples, only allele B was found, so the frequency of
allele B is 1. In Sahiwal cattle, the frequency of AA and AB genotypes were 0.386
and 0.614 respectively, while respective allelic frequencies were 0.69 and 0.31.
Similarly, in Cholistani cattle the frequencies of AA and AB genotypes were 0.8 and
0.2 respectively with allelic frequencies were 0.90 and 0.10 respectively for A and B
alleles. While in Red Sindhi cattle the genotypic frequencies were 0.714 and 0.286
and respective allelic frequencies were 0.86 and 0.14 for A and B allele. No BB
genotype was detected in any of these animals. The χ2 test (P < 0.05) showed that the
animals of Cholistani and Red Sindhi cattle used in this study were in Hardy-
Weinberg equilibrium while population of Sahiwal cattle was not in Hardy-Weinberg
equilibrium (Table: 3.2).
Breed No. of
Animals
Chi-Square Test
χ2 (at one degree of
freedom)
Gene
Frequency
Genotype
Frequency
A B AA AB BB
Nili-Ravi (Buffalo)
163 0.00 0.00 1.00 0.000 0.000 1.000
Sahiwal (Cattle)
145 14.81* 0.69 0.31 0.386 0.614 0.000
Cholistani (Cattle)
30 0.077 NS 0.90 0.10 0.800 0.200 0.000
Red Sindhi (Cattle)
28 0.266 NS 0.86 0.14 0.714 0.286 0.000

66
Frequency distribution of -CN genotypes in Pakistani buffalo and cattle breeds were
also indicated graphically (Fig: 3.12) in which yellow line indicate the frequency of
-CN gene BB genotypes while blue AA and dark red of AB genotypes. Yellow line
indicates that the buffalo animals only contain -CN BB genotype.
Fig: 3.12 Frequency distribution of κ-CN genotypes in buffalo and cattle breeds.
k-CN
0
0.2
0.4
0.6
0.8
1
1.2
Nili-Ravi Sahiwal Cholistani Red Sindhi
AA
AB
BB

67
3.3.3 Bovine beta-lactoglobulin gene polymorphism
The purified PCR amplified DNA fragment from beta-lactoglobulin gene from each
of buffalo and cattle breeds was digested with HaeIII restriction enzyme (MBI,
Fermentas) as per manufacturer instructions to check variations in the nucleotide
sequence of gene of interest.
3.3.3.1 Buffalo: The DNA pattern arising from the digestion of PCR product with
restriction enzyme was analyzed on agarose gel. Digestion of 262 bp DNA fragment
from 4th
exon & 4th
intron with HaeIII restriction enzyme generated two types of
DNA fragments patterns that is 153 and 109 bp (Fig: 3.13) which indicate that the
only one restriction site for AA while 109 and 74/79 bp (Fig: 3.14) for BB genotypes
and no AB genotype was observed in animals under study.

68
Fig: 3.13 Analysis of restricted product of beta-lactoglobulin (β-LG) gene (4th
exon & 4th
intron) of Nili-Ravi buffaloes showing AA genotype on 2 % agarose gel
with HaeIII restriction endonuclease. Lane 1: 50 bp DNA ladder (Cat # SM0371,
MBI, Fermentas), Lane 2: Control PCR product, Lane 3: Negative control & Lane 4-
8: restricted product of β-LG gene.
1 2 3 4 5 6 7 8
109 bp
153 bp 262 bp
500 bp
Fig: 3.14 Analysis of restricted product of beta-lactoglobulin (β-LG) gene (4th
exon & 4th
intron) of Nili-Ravi buffaloes on 2% agarose gel with HaeIII restriction
endonuclease. Lane 1: 50 bp DNA ladder (Cat # SM0371, MBI, Fermentas), Lane 2-
8: restricted product of β-LG gene showing BB genotype.
1 2 3 4 5 6 7 8
500 bp
109 bp
74/79 bp
69
3.3.3.2 Cattle breeds: In cattle breeds, two types of DNA fragment pattern were
obtained upon digestion of PCR amplified product (262 bp) with HaeIII enzyme that
is (153, 109, & 74/79 bp) indicating AB genotype while (109 & 74/79 bp) DNA band
pattern indicating BB genotype (Fig: 3.15).
3.3.3.3 Gene frequencies:
The gene frequencies of restriction DNA fragments were calculated by allele
counting methodology and further analyzed by chi-square test. In Nili-Ravi buffaloes
the observed genotypic frequencies were 0.64 and 0.36 for genotypes AA and BB
respectively. In cattle breeds the obsevered genotypes were AB and BB. In Sahiwal
cattle, the frequency of AB and BB genotypes were found to be 0.18 and 0.82
Fig: 3.15 Analysis of restricted product of beta-lactoglobulin (β-LG) gene (4th
exon & 4th
intron) of cattle breeds indicating AB and BB genotypes with HaeIII
restriction endonuclease on 2 % agarose gel. Lane 1: 50 bp DNA ladder (Cat #
SM0371, MBI, Fermentas), Lane 2 & 3: samples from Sahiwal, Lane 4 & 5:
Cholistani, Lane 6, 7 & 8: Red Sindhi cattle.
1 2 3 4 5 6 7 8
153 bp
250 bp
109 bp
74/79 bp
AB BB BB BB BB BB BB

70
respectively, while respective allelic frequencies were 0.09 and 0.91 for A and B
alleles. Similarly, in Cholistani cattle the frequencies of AB and BB genotypes were
0.24 and 0.76 respectively with allelic frequencies were 0.12 and 0.88 respectively for
A and B alleles. In Red Sindhi cattle, the genotypic frequencies were 0.36 and 0.64
and respective allelic frequencies were 0.18 and 0.82 for A and B allele and no AA
genotype was detected in any of these animals (Table: 3.3). The result shows that the
frequency of B allele was higher in all the cattle breeds. The χ2 test (P < 0.05) showed
that all the animals used in present study were in Hardy-Weinberg equilibrium.
Table: 3.3 Genotypic and allelic frequencies of β-LG gene among Nili-Ravi buffaloes
and Sahiwal, Cholistani and Red Sindhi cattle.
χ2 chi-square test value (P < 0.05)
NS Non Significant
Fig: 3.16 represent graphical frequency distribution of β-LG genotypes in Pakistani
buffalo and cattle breeds. The frequency of BB genotype was very much high in
Sahiwal cattle followed by Cholistani and Red Sindhi breeds while no AB genotype
was found in buffalo animals under study and however the frequency of genotype AA
was higher in Nili-Ravi buffaloes.
Breed No. of
Animals
Chi-Square Test
χ2 (at one degree of
freedom)
Gene
Frequency
Genotype
Frequency
A B AA AB BB
Nili-Ravi (Buffalo)
163 3.374 NS 0.64 0.36 0.64 0.000 0.36
Sahiwal (Cattle)
145 0.5265 NS 0.09 0.91 0.000 0.186 0.814
Cholistani (Cattle)
30 0.0713 NS 0.12 0.88 0.000 0.233 0.767
Red Sindhi (Cattle)
28 0.4 NS 0.18 0.82 0.000 0.357 0.643
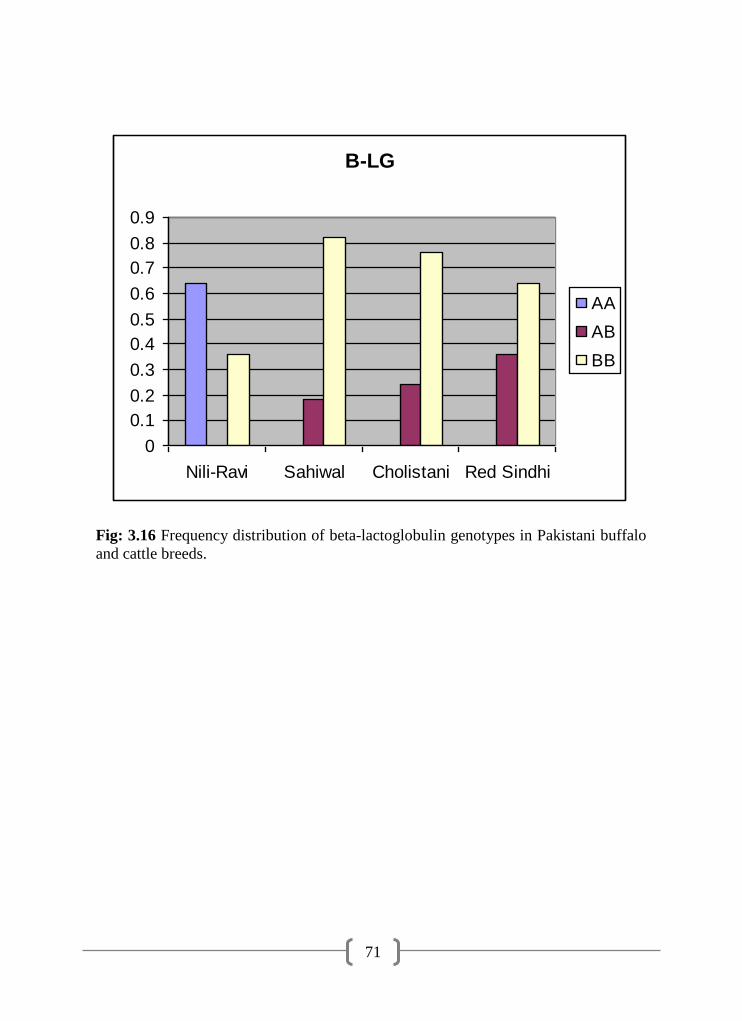
71
Fig: 3.16 Frequency distribution of beta-lactoglobulin genotypes in Pakistani buffalo
and cattle breeds.
B-LG
0
0.1
0.2
0.3
0.4
0.5
0.6
0.7
0.8
0.9
Nili-Ravi Sahiwal Cholistani Red Sindhi
AA
AB
BB

72
3.4 DNA sequencing
The cloned PCR products obtained from bovine growth homone, kappa-casein and
beta-lactoglobulin genes of Nili-Ravi buffalo were sequenced. The results obtained
are presented below.
3.4.1 Bovine growth hormone gene: As all the samples of Nili-Ravi buffalo
analyzed by PCR-RFLP were found to be homozygous, hence few samples were
sequenced to confirm this observation. The amplified PCR product of bGH gene
fragment was cloned into TA cloning vector. The cloned DNA fragment was
subjected to DNA sequencing and the resultant sequence was submitted to Gene bank
having Accession No. FJ754322 and presented (Fig: 3.17) alongwith the amino acid
translation data.
A) Alu-I (AGCT) site
5'GCTGCTCCTGAGGGCCCTTCGGCTCTCTGTCTCTCCTCCCTTGGCAGGAGCTGGAAGATG
GCACCCCCCGGGCTGGGCAGATCCTCAAGCAGACCTATGACAAATTTGACACAAACATGC
GCAGTGACGACGCGCTGCTCAAGAACTACGGTCTGCTCTCCTGCTTCCGGAAGGACCTGC
ACAAAACGGAGACGTACCTGAGGGTCAT 3'
B) Translation 1 - GCTGCTCCTGAGGGCCCTTCGGCTCTCTGTCTCTCCTCCCTTGGCAGGAGCTGGAAGATG - 60
1 - A A P E G P S A L C L S S L G R S W K M - 20
61 - GCACCCCCCGGGCTGGGCAGATCCTCAAGCAGACCTATGACAAATTTGACACAAACATGC - 120
21 - A P P G L G R S S S R P M T N L T Q T C - 40
121- GCAGTGACGACGCGCTGCTCAAGAACTACGGTCTGCTCTCCTGCTTCCGGAAGGACCTGC - 180
41 - A V T T R C S R T T V C S P A S G R T C - 60
181 - ACAAAACGGAGACGTACCTGAGGGTCAT - 208
61 - T K R R R T * G S X - 80
Fig: 3.17 Nucleotide and amino acid sequence of DNA from growth hormone gene;
A: represents nucleotide sequence alongwith restriction enzyme site B: alignment of
DNA sequence to aminno acids sequence.
Sequencing results of bGH Alu-I locus obtained Alu-I enzyme restriction site (AGCT)
that shows a polymorphism in the bGH gene (presence of the Alu-I restriction site
corresponds to the presence of the amino acid leucine (L) in the polypeptide chain of
bGH gene, whereas the absence of this site indicates the presence of valine (V) at the
same position).

73
DNA sequence homology
The obtained nucleotide sequence of Nili-Ravi buffaloes was subjected to BLAST
analysis at the NCBI website to retrieve similar sequences of mammalian origin. The
blasted sequence alignment study revealed that the maximum nucleotide sequence
homology up to 99% and 98% with the Bubalus bubalis and Bos taurus breeds
respectively (Fig: 3.18 a & b). Comparison of bGH gene sequence obtained in Nili-
Ravi buffaloes with Bubalus bubalis and Bos taurus revealed several sites of changes
includes one base deletion at position 35 with Bubalus bubalis while with Bos taurus
four sites were found. It includes two transitions at positions 182 & 185 (A G & C
T), two deletion were also observed at positions 23 & 36 (Fig: 3.18 a & b)
a) emb|AJ011533 Bubalus bubalis gene encoding growth hormone, exons 1-5
Length=1798, Score = 379 bits (205), Expect = 3e-102
Identities = 208/209 (99%), Gaps = 1/209 (0%), Strand=Plus/Plus
Query 1 GCTGCTCCTGAGGGCCCTTCGGCTCTCTGTCTCT-CCTCCCTTGGCAGGAGCTGGAAGAT 59
|||||||||||||||||||||||||||||||||| |||||||||||||||||||||||||
Sbjct 1397 GCTGCTCCTGAGGGCCCTTCGGCTCTCTGTCTCTCCCTCCCTTGGCAGGAGCTGGAAGAT 1456
Query 60 GGCACCCCCCGGGCTGGGCAGATCCTCAAGCAGACCTATGACAAATTTGACACAAACATG 119
||||||||||||||||||||||||||||||||||||||||||||||||||||||||||||
Sbjct 1457 GGCACCCCCCGGGCTGGGCAGATCCTCAAGCAGACCTATGACAAATTTGACACAAACATG 1516
Query 120 CGCAGTGACGACGCGCTGCTCAAGAACTACGGTCTGCTCTCCTGCTTCCGGAAGGACCTG 179
||||||||||||||||||||||||||||||||||||||||||||||||||||||||||||
Sbjct 1517 CGCAGTGACGACGCGCTGCTCAAGAACTACGGTCTGCTCTCCTGCTTCCGGAAGGACCTG 1576
Query 180 CACAAAACGGAGACGTACCTGAGGGTCAT 208
|||||||||||||||||||||||||||||
Sbjct 1577 CACAAAACGGAGACGTACCTGAGGGTCAT 1605
b) gb|M57764 Bovine growth hormone gene, [Bos taurus] complete cds Length=2856, Score = 364 bits (197), Expect = 9e-98
Identities = 206/210 (98%), Gaps = 2/210 (1%),Strand=Plus/Plus
Query 1 GCTGCTCCTGAGGGCCCTTCGG-CTCTCTGTCTCT-CCTCCCTTGGCAGGAGCTGGAAGA 58
|||||||||||||||||||||| |||||||||||| ||||||||||||||||||||||||
Sbjct 2089 GCTGCTCCTGAGGGCCCTTCGGCCTCTCTGTCTCTCCCTCCCTTGGCAGGAGCTGGAAGA 2148
Query 59 TGGCACCCCCCGGGCTGGGCAGATCCTCAAGCAGACCTATGACAAATTTGACACAAACAT 118
||||||||||||||||||||||||||||||||||||||||||||||||||||||||||||
Sbjct 2149 TGGCACCCCCCGGGCTGGGCAGATCCTCAAGCAGACCTATGACAAATTTGACACAAACAT 2208
Query 119 GCGCAGTGACGACGCGCTGCTCAAGAACTACGGTCTGCTCTCCTGCTTCCGGAAGGACCT 178
||||||||||||||||||||||||||||||||||||||||||||||||||||||||||||
Sbjct 2209 GCGCAGTGACGACGCGCTGCTCAAGAACTACGGTCTGCTCTCCTGCTTCCGGAAGGACCT 2268
Query 179 GCACAAAACGGAGACGTACCTGAGGGTCAT 208
||| || |||||||||||||||||||||||
Sbjct 2269 GCATAAGACGGAGACGTACCTGAGGGTCAT 2298
Fig: 3.18 The homology comparison of BLAST analysis of partial sequence of bGH
(Nili-Ravi buffaloes) (exon-V) gene with a) Bubalus bubalis and b) Bos taurus.

74
Distance tree analysis: The tree or dendrogram shows the cluster sequences
acoording to their distances from the query sequences. Distance tree analysis of bGH
sequence depicted the maximum closeness of Nili-Ravi buffalo with the Bubalus
bubalis growth hormone gene (Fig: 3.19). This will also helpful for recognizing the
prescence of aberrant or unusual sequences or potentially natural groupings of related
sequences such as members of a gene families or homologs from other species in the
blast results.
Fig: 3.19 Distance tree analysis of bovine growth hormone gene sequence indicates
their maximum closeness with the Bubalus bubalis growth hormone gene.
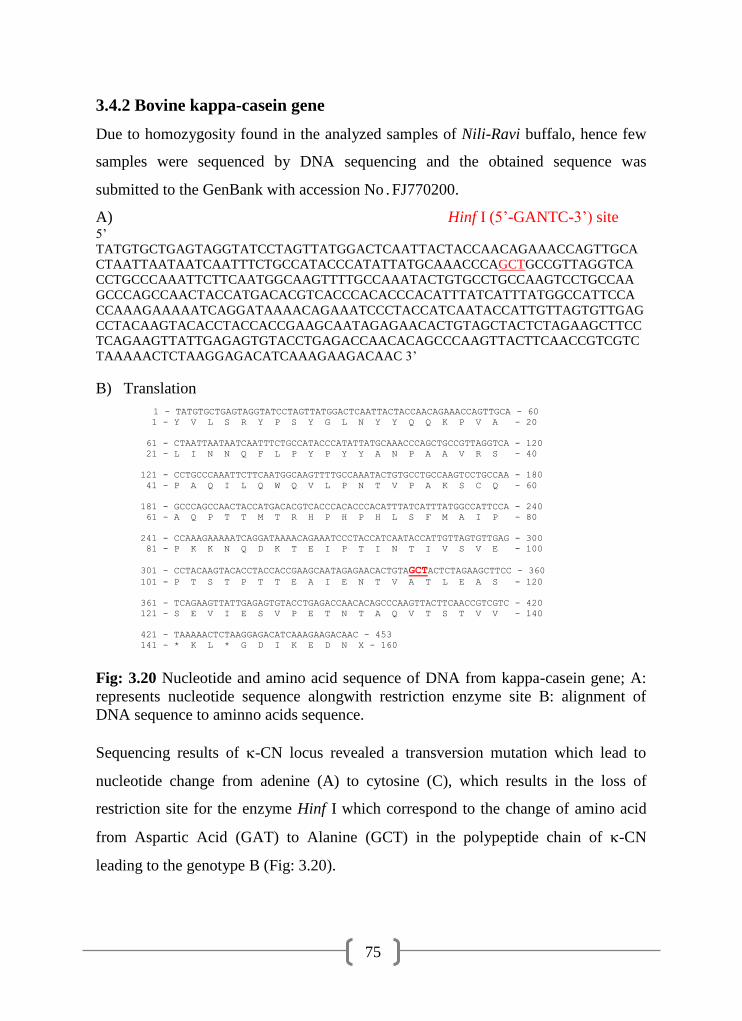
75
3.4.2 Bovine kappa-casein gene
Due to homozygosity found in the analyzed samples of Nili-Ravi buffalo, hence few
samples were sequenced by DNA sequencing and the obtained sequence was
submitted to the GenBank with accession No.FJ770200.
A) Hinf I (5‟-GANTC-3‟) site 5‟
TATGTGCTGAGTAGGTATCCTAGTTATGGACTCAATTACTACCAACAGAAACCAGTTGCA
CTAATTAATAATCAATTTCTGCCATACCCATATTATGCAAACCCAGCTGCCGTTAGGTCA
CCTGCCCAAATTCTTCAATGGCAAGTTTTGCCAAATACTGTGCCTGCCAAGTCCTGCCAA
GCCCAGCCAACTACCATGACACGTCACCCACACCCACATTTATCATTTATGGCCATTCCA
CCAAAGAAAAATCAGGATAAAACAGAAATCCCTACCATCAATACCATTGTTAGTGTTGAG
CCTACAAGTACACCTACCACCGAAGCAATAGAGAACACTGTAGCTACTCTAGAAGCTTCC
TCAGAAGTTATTGAGAGTGTACCTGAGACCAACACAGCCCAAGTTACTTCAACCGTCGTC
TAAAAACTCTAAGGAGACATCAAAGAAGACAAC 3‟
B) Translation
1 - TATGTGCTGAGTAGGTATCCTAGTTATGGACTCAATTACTACCAACAGAAACCAGTTGCA - 60 1 - Y V L S R Y P S Y G L N Y Y Q Q K P V A - 20
61 - CTAATTAATAATCAATTTCTGCCATACCCATATTATGCAAACCCAGCTGCCGTTAGGTCA - 120
21 - L I N N Q F L P Y P Y Y A N P A A V R S - 40
121 - CCTGCCCAAATTCTTCAATGGCAAGTTTTGCCAAATACTGTGCCTGCCAAGTCCTGCCAA - 180
41 - P A Q I L Q W Q V L P N T V P A K S C Q - 60
181 - GCCCAGCCAACTACCATGACACGTCACCCACACCCACATTTATCATTTATGGCCATTCCA - 240
61 - A Q P T T M T R H P H P H L S F M A I P - 80
241 - CCAAAGAAAAATCAGGATAAAACAGAAATCCCTACCATCAATACCATTGTTAGTGTTGAG - 300
81 - P K K N Q D K T E I P T I N T I V S V E - 100
301 - CCTACAAGTACACCTACCACCGAAGCAATAGAGAACACTGTAGCTACTCTAGAAGCTTCC - 360
101 - P T S T P T T E A I E N T V A T L E A S - 120
361 - TCAGAAGTTATTGAGAGTGTACCTGAGACCAACACAGCCCAAGTTACTTCAACCGTCGTC - 420
121 - S E V I E S V P E T N T A Q V T S T V V - 140
421 - TAAAAACTCTAAGGAGACATCAAAGAAGACAAC - 453
141 - * K L * G D I K E D N X - 160
Fig: 3.20 Nucleotide and amino acid sequence of DNA from kappa-casein gene; A:
represents nucleotide sequence alongwith restriction enzyme site B: alignment of
DNA sequence to aminno acids sequence.
Sequencing results of -CN locus revealed a transversion mutation which lead to
nucleotide change from adenine (A) to cytosine (C), which results in the loss of
restriction site for the enzyme Hinf I which correspond to the change of amino acid
from Aspartic Acid (GAT) to Alanine (GCT) in the polypeptide chain of -CN
leading to the genotype B (Fig: 3.20).

76
Sequence homology
Analysis of -CN gene sequence in Nili-Ravi buffaloes with Bubalus bubalis and
Bos taurus through blastn shows homology of nucleotide sequence with Bubalus
bubalis (99%) and Bos taurus (96%) (Fig: 3.21 a & b). In case of -CN gene
sequence comparison of Nili-Ravi buffaloes with Bubalus bubalis, two base
transitions were found. Comparison of -CN gene sequence obtained in Nili-Ravi
buffaloes with Bubalus bubalis and Bos taurus revealed several sites of changes
includes two transversion at positions 102 and 111 (C G & C A respectively)
with Bubalus bubalis while with Bos taurus sixteen altered sites were found. It
includes ten transition at positions 151, 199, 290, 328, 335, 378, 381, 390, 399 & 415,
two transversion at positions 296 and 379 (T G & G C), two deletion at
positions 362 & 419 and two base insertions were also observed at positions 359 &
416 (Fig: 3.21 a & b).
a) gb|AY750857 Bubalus bubalis kappa-casein mRNA, complete cds Length=882
Score = 826 bits (447), Expect = 0.0
Identities = 451/453 (99%), Gaps = 0/453 (0%)
Strand=Plus/Plus
Query 1 TATGTGCTGAGTAGGTATCCTAGTTATGGACTCAATTACTACCAACAGAAACCAGTTGCA 60
||||||||||||||||||||||||||||||||||||||||||||||||||||||||||||
Sbjct 222 TATGTGCTGAGTAGGTATCCTAGTTATGGACTCAATTACTACCAACAGAAACCAGTTGCA 281
Query 61 CTAATTAATAATCAATTTCTGCCATACCCATATTATGCAAACCCAGCTGCCGTTAGGTCA 120
||||||||||||||||||||||||||||||||||||||||| |||||||| |||||||||
Sbjct 282 CTAATTAATAATCAATTTCTGCCATACCCATATTATGCAAAGCCAGCTGCAGTTAGGTCA 341
Query 121 CCTGCCCAAATTCTTCAATGGCAAGTTTTGCCAAATACTGTGCCTGCCAAGTCCTGCCAA 180
||||||||||||||||||||||||||||||||||||||||||||||||||||||||||||
Sbjct 342 CCTGCCCAAATTCTTCAATGGCAAGTTTTGCCAAATACTGTGCCTGCCAAGTCCTGCCAA 401
Query 181 GCCCAGCCAACTACCATGACACGTCACCCACACCCACATTTATCATTTATGGCCATTCCA 240
||||||||||||||||||||||||||||||||||||||||||||||||||||||||||||
Sbjct 402 GCCCAGCCAACTACCATGACACGTCACCCACACCCACATTTATCATTTATGGCCATTCCA 461
Query 241 CCAAAGAAAAATCAGGATAAAACAGAAATCCCTACCATCAATACCATTGTTAGTGTTGAG 300
||||||||||||||||||||||||||||||||||||||||||||||||||||||||||||
Sbjct 462 CCAAAGAAAAATCAGGATAAAACAGAAATCCCTACCATCAATACCATTGTTAGTGTTGAG 521
Query 301 CCTACAAGTACACCTACCACCGAAGCAATAGAGAACACTGTAGCTACTCTAGAAGCTTCC 360
||||||||||||||||||||||||||||||||||||||||||||||||||||||||||||
Sbjct 522 CCTACAAGTACACCTACCACCGAAGCAATAGAGAACACTGTAGCTACTCTAGAAGCTTCC 581
Query 361 TCAGAAGTTATTGAGAGTGTACCTGAGACCAACACAGCCCAAGTTACTTCAACCGTCGTC 420
||||||||||||||||||||||||||||||||||||||||||||||||||||||||||||
Sbjct 582 TCAGAAGTTATTGAGAGTGTACCTGAGACCAACACAGCCCAAGTTACTTCAACCGTCGTC 641
Query 421 TAAAAACTCTAAGGAGACATCAAAGAAGACAAC 453
|||||||||||||||||||||||||||||||||
Sbjct 642 TAAAAACTCTAAGGAGACATCAAAGAAGACAAC 674

77
b) emb|AJ841941| Bos taurus partial kappa-casein gene for kappa-casein, exon 4, allele BB, Length=874
Score = 732 bits (396), Expect = 0.0
Identities = 434/452 (96%), Gaps = 4/452 (1%)
Strand=Plus/Plus
Query 4 GTGCTGAGTAGGTATCCTAGTTATGGACTCAATTACTACCAACAGAAACCAGTTGCACTA 63
||||||||||||||||||||||||||||||||||||||||||||||||||||||||||||
Sbjct 1 GTGCTGAGTAGGTATCCTAGTTATGGACTCAATTACTACCAACAGAAACCAGTTGCACTA 60
Query 64 ATTAATAATCAATTTCTGCCATACCCATATTATGCAAACCCAGCTGCCGTTAGGTCACCT 123
|||||||||||||||||||||||||||||||||||||| |||||||| ||||||||||||
Sbjct 61 ATTAATAATCAATTTCTGCCATACCCATATTATGCAAAGCCAGCTGCAGTTAGGTCACCT 120
Query 124 GCCCAAATTCTTCAATGGCAAGTTTTGCCAAATACTGTGCCTGCCAAGTCCTGCCAAGCC 183
||||||||||||||||||||||||||| ||||||||||||||||||||||||||||||||
Sbjct 121 GCCCAAATTCTTCAATGGCAAGTTTTGTCAAATACTGTGCCTGCCAAGTCCTGCCAAGCC 180
Query 184 CAGCCAACTACCATGACACGTCACCCACACCCACATTTATCATTTATGGCCATTCCACCA 243
||||||||||||||| ||||||||||||||||||||||||||||||||||||||||||||
Sbjct 181 CAGCCAACTACCATGGCACGTCACCCACACCCACATTTATCATTTATGGCCATTCCACCA 240
Query 244 AAGAAAAATCAGGATAAAACAGAAATCCCTACCATCAATACCATTGTTAGTGTTGAGCCT 303
|||||||||||||||||||||||||||||||||||||||||||||| ||||| |||||||
Sbjct 241 AAGAAAAATCAGGATAAAACAGAAATCCCTACCATCAATACCATTGCTAGTGGTGAGCCT 300
Query 304 ACAAGTACACCTACCACCGAAGCAATAGAGAACACTGTAGCTACTCTAGAAGCTTCCTC- 362
|||||||||||||||||||||||| |||||| |||||||||||||||||||||||| ||
Sbjct 301 ACAAGTACACCTACCACCGAAGCAGTAGAGAGCACTGTAGCTACTCTAGAAGCTTC-TCC 359
Query 363 AGAAGTTATTGAGAGTGTACCTGAGACCAACACAGCCCAAGTTACTTCAACCGTCG-TCT 421
||||||||||||||| |||||||| |||||||| ||||||||||||||| | || |||
Sbjct 360 AGAAGTTATTGAGAGCCCACCTGAGATCAACACAGTCCAAGTTACTTCAACTG-CGGTCT 418
Query 422 AAAAACTCTAAGGAGACATCAAAGAAGACAAC 453
||||||||||||||||||||||||||||||||
Sbjct 419 AAAAACTCTAAGGAGACATCAAAGAAGACAAC 450
Fig: 3.21 The homology comparison of BLAST analysis of partial sequence of -CN
(Nili-Ravi buffaloes) gene with a) Bubalus bubalis and b) Bos taurus.
Distance tree analysis
Similarly, distance tree analysis of bovine kappa-casein gene sequence depicted the
maximum closeness of Nili-Ravi buffaloes with the Bubalus bubalis kappa-casein
gene sequence (Fig: 3.22).
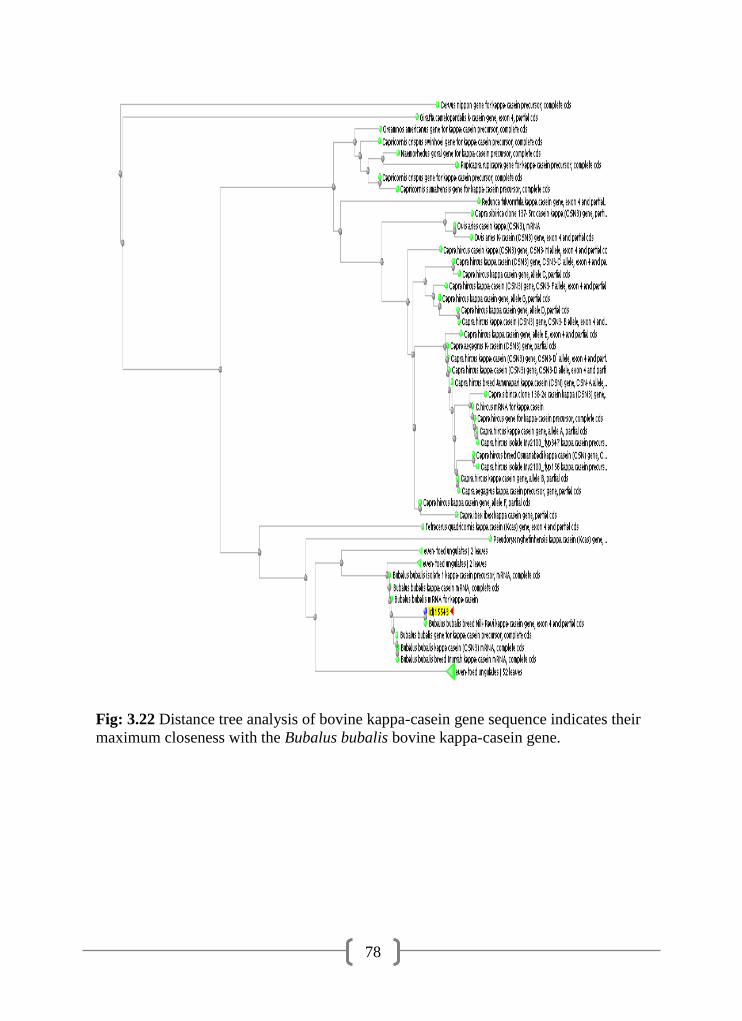
78
Fig: 3.22 Distance tree analysis of bovine kappa-casein gene sequence indicates their
maximum closeness with the Bubalus bubalis bovine kappa-casein gene.

79
3.4.3 Bovine beta-lactoglobulin gene
Due to homozygosity found in the analyzed samples for β-LG gene of Nili-Ravi
buffalo, hence few samples were also sequenced.
A) Hae III site: GG↓CC 5‟
GTCCTTGTGCTGGACACCGACTACAAAAAGTACCTGCTCTTCTGCATGGAGAACAGTGCT
GAGCCCGAGCAAAGCCTGGCCTGCCAGTGCCTGGGTGGGTGCCAACCCTGGCTGCCCAG
GGAGACCAGCTGTGTGGTCCTCGCTGCAACGGGGCCgggggggACGGTGGGAGCAGGGAGC
TTGATTCCCAGGAGGAGGAGGGATGGGGGGTCCCCGAGTCCCGCCAGGAGAGGGTGGTC
ATATACCGGGAGCCGGTGTCCTG 3‟
B) Transalation 1 - GTCCTTGTGCTGGACACCGACTACAAAAAGTACCTGCTCTTCTGCATGGAGAACAGTGCT - 60 1 - V L V L D T D Y K K Y L L F C M E N S A - 20
61 - GAGCCCGAGCAAAGCCTGGCCTGCCAGTGCCTGGGTGGGTGCCAACCCTGGCTGCCCAGG - 120
21 - E P E Q S L A C Q C L G G C Q P W L P R - 40
121 - GAGACCAGCTGTGTGGTCCTCGCTGCAACGGGGCCGGGGGGGACGGTGGGAGCAGGGAGC - 180
41 - E T S C V V L A A T G P G G T V G A G S - 60
181 - TTGATTCCCAGGAGGAGGAGGGATGGGGGGTCCCCGAGTCCCGCCAGGAGAGGGTGGTCA - 240
61 - L I P R R R R D G G S P S P A R R G W S - 80
241 - TATACCGGGAGCCGGTGTCCTG - 262
81 - Y T G S R C P X - 100
Fig: 3.23 Nucleotide and amino acid sequence of DNA from beta-lactoglobulin gene;
A: represents nucleotide sequence alongwith restriction enzyme site B: alignment of
DNA sequence to aminno acids sequence.
Sequencing results of β-LG locus revealed nucleotide change from T to C leading to
amino acid change valine (GTC) to alanine (GCT) in the polypeptide chain of β-LG
(Fig: 3.23).
Sequence homology
Analysis of partial β-LG gene sequence of Nili-Ravi buffalo with Bubalus bubalis and
Bos taurus through blastn shows homology of nucleotide sequence with Riverine
buffalo of Murrah breed (Bubalus bubalis) (97-99 %) with accession no.
gb|DQ340204 and emb|AJ492505 and 100 % with Bos taurus with accession no.
gb|DQ489319. Comparison of β-LG gene sequence obtained of Nili-Ravi buffalo with
Bubalus bubalis and Bos taurus revealed no change with Bos taurus while with
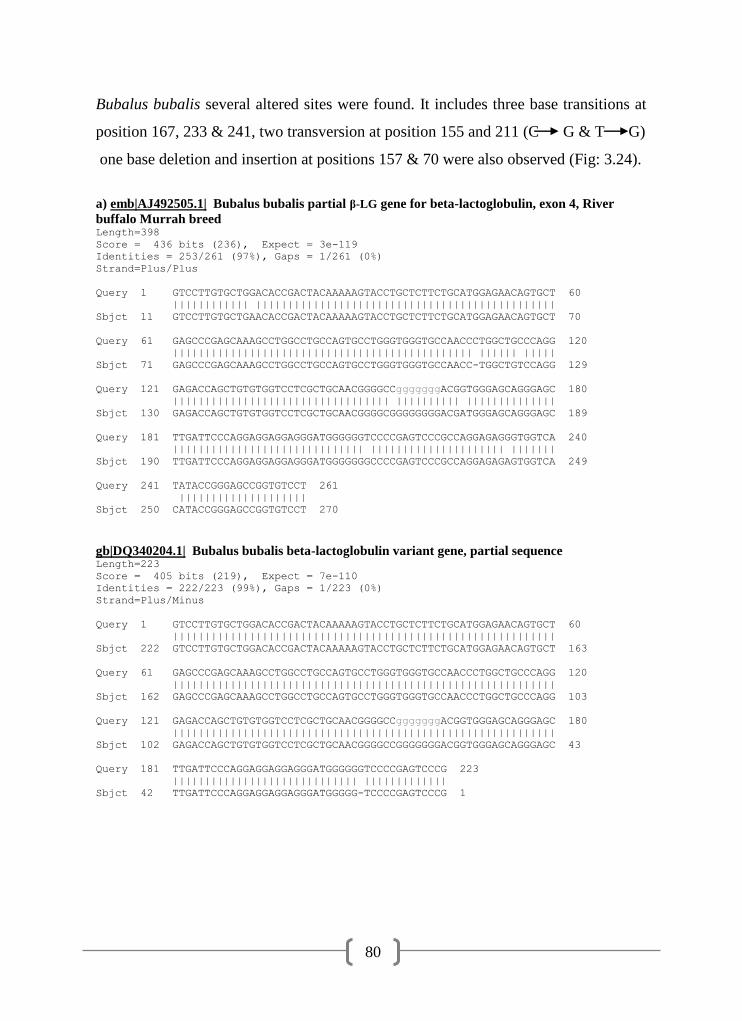
80
Bubalus bubalis several altered sites were found. It includes three base transitions at
position 167, 233 & 241, two transversion at position 155 and 211 (C G & T G)
one base deletion and insertion at positions 157 & 70 were also observed (Fig: 3.24).
a) emb|AJ492505.1| Bubalus bubalis partial β-LG gene for beta-lactoglobulin, exon 4, River
buffalo Murrah breed Length=398
Score = 436 bits (236), Expect = 3e-119
Identities = 253/261 (97%), Gaps = 1/261 (0%)
Strand=Plus/Plus
Query 1 GTCCTTGTGCTGGACACCGACTACAAAAAGTACCTGCTCTTCTGCATGGAGAACAGTGCT 60
|||||||||||| |||||||||||||||||||||||||||||||||||||||||||||||
Sbjct 11 GTCCTTGTGCTGAACACCGACTACAAAAAGTACCTGCTCTTCTGCATGGAGAACAGTGCT 70
Query 61 GAGCCCGAGCAAAGCCTGGCCTGCCAGTGCCTGGGTGGGTGCCAACCCTGGCTGCCCAGG 120
||||||||||||||||||||||||||||||||||||||||||||||| |||||| |||||
Sbjct 71 GAGCCCGAGCAAAGCCTGGCCTGCCAGTGCCTGGGTGGGTGCCAACC-TGGCTGTCCAGG 129
Query 121 GAGACCAGCTGTGTGGTCCTCGCTGCAACGGGGCCgggggggACGGTGGGAGCAGGGAGC 180
|||||||||||||||||||||||||||||||||| |||||||||| ||||||||||||||
Sbjct 130 GAGACCAGCTGTGTGGTCCTCGCTGCAACGGGGCGGGGGGGGACGATGGGAGCAGGGAGC 189
Query 181 TTGATTCCCAGGAGGAGGAGGGATGGGGGGTCCCCGAGTCCCGCCAGGAGAGGGTGGTCA 240
|||||||||||||||||||||||||||||| ||||||||||||||||||||| |||||||
Sbjct 190 TTGATTCCCAGGAGGAGGAGGGATGGGGGGGCCCCGAGTCCCGCCAGGAGAGAGTGGTCA 249
Query 241 TATACCGGGAGCCGGTGTCCT 261
||||||||||||||||||||
Sbjct 250 CATACCGGGAGCCGGTGTCCT 270
gb|DQ340204.1| Bubalus bubalis beta-lactoglobulin variant gene, partial sequence Length=223
Score = 405 bits (219), Expect = 7e-110
Identities = 222/223 (99%), Gaps = 1/223 (0%)
Strand=Plus/Minus
Query 1 GTCCTTGTGCTGGACACCGACTACAAAAAGTACCTGCTCTTCTGCATGGAGAACAGTGCT 60
||||||||||||||||||||||||||||||||||||||||||||||||||||||||||||
Sbjct 222 GTCCTTGTGCTGGACACCGACTACAAAAAGTACCTGCTCTTCTGCATGGAGAACAGTGCT 163
Query 61 GAGCCCGAGCAAAGCCTGGCCTGCCAGTGCCTGGGTGGGTGCCAACCCTGGCTGCCCAGG 120
||||||||||||||||||||||||||||||||||||||||||||||||||||||||||||
Sbjct 162 GAGCCCGAGCAAAGCCTGGCCTGCCAGTGCCTGGGTGGGTGCCAACCCTGGCTGCCCAGG 103
Query 121 GAGACCAGCTGTGTGGTCCTCGCTGCAACGGGGCCgggggggACGGTGGGAGCAGGGAGC 180
||||||||||||||||||||||||||||||||||||||||||||||||||||||||||||
Sbjct 102 GAGACCAGCTGTGTGGTCCTCGCTGCAACGGGGCCGGGGGGGACGGTGGGAGCAGGGAGC 43
Query 181 TTGATTCCCAGGAGGAGGAGGGATGGGGGGTCCCCGAGTCCCG 223
||||||||||||||||||||||||||||| |||||||||||||
Sbjct 42 TTGATTCCCAGGAGGAGGAGGGATGGGGG-TCCCCGAGTCCCG 1

81
b) gb|DQ489319.1| Bos taurus beta-lactoglobulin variant B precursor (BLG) gene, BLG-B allele, complete cds
Length=7670
Score = 484 bits (262), Expect = 9e-134
Identities = 262/262 (100%), Gaps = 0/262 (0%)
Strand=Plus/Plus
Query 1 GTCCTTGTGCTGGACACCGACTACAAAAAGTACCTGCTCTTCTGCATGGAGAACAGTGCT 60
||||||||||||||||||||||||||||||||||||||||||||||||||||||||||||
Sbjct 5225 GTCCTTGTGCTGGACACCGACTACAAAAAGTACCTGCTCTTCTGCATGGAGAACAGTGCT 5284
Query 61 GAGCCCGAGCAAAGCCTGGCCTGCCAGTGCCTGGGTGGGTGCCAACCCTGGCTGCCCAGG 120
||||||||||||||||||||||||||||||||||||||||||||||||||||||||||||
Sbjct 5285 GAGCCCGAGCAAAGCCTGGCCTGCCAGTGCCTGGGTGGGTGCCAACCCTGGCTGCCCAGG 5344
Query 121 GAGACCAGCTGTGTGGTCCTCGCTGCAACGGGGCCgggggggACGGTGGGAGCAGGGAGC 180
||||||||||||||||||||||||||||||||||||||||||||||||||||||||||||
Sbjct 5345 GAGACCAGCTGTGTGGTCCTCGCTGCAACGGGGCCGGGGGGGACGGTGGGAGCAGGGAGC 5404
Query 181 TTGATTCCCAGGAGGAGGAGGGATGGGGGGTCCCCGAGTCCCGCCAGGAGAGGGTGGTCA 240
||||||||||||||||||||||||||||||||||||||||||||||||||||||||||||
Sbjct 5405 TTGATTCCCAGGAGGAGGAGGGATGGGGGGTCCCCGAGTCCCGCCAGGAGAGGGTGGTCA 5464
Query 241 TATACCGGGAGCCGGTGTCCTG 262
||||||||||||||||||||||
Sbjct 5465 TATACCGGGAGCCGGTGTCCTG 5486
Fig: 3.24 The homology comparison of BLAST analysis of partial sequence of β-LG
(exon IV) (Nili-Ravi buffaloes) gene with a) Bubalus bubalis and b) Bos taurus.
Distance tree analysis: Distance tree analysis of bovine beta-lactoglobulin gene
sequence of Nili-Ravi buffaloes depicted their maximum closeness with the even toed
ungulates and Bos taurus β-LG gene sequence (Fig: 3.25).

82
Fig: 3.25 Distance tree analysis of bovine beta-lactoglobulin gene sequence indicates
their maximum closeness.
Animals with genotypes: Table 3.4 summerized that a total of 163 animals of Nili
Ravi buffalo were analyzed for bGH, κ-CN & β-LG genes polymorphism. All the
buffalo animals were found to be homozygous for bGH LL and κ-CN BB genotypes,
while two genotypes were found in homozygous form for β-LG gene as AA and BB
genotypes. Frequency of κ-CN genotype AB (89) was higher than AA (56) in Sahiwal
cattle while in Cholistan and Red Sindhi cattle, animals of AA genotype was higher.
Similarly, β-LG genotype BB was significantly higher in all the cattle breeds.
Table: 3.4 Breeds /animals with certain genes / genotypes
Breed
N
b-GH
(Genotypes)
Ҡ-CN
(Genotypes)
β-LG
Genotypes)
LL LV VV AA AB BB AA AB BB
Nili-Ravi (Buffalo) 163 163 - - - - 163 105 - 58
Sahiwal 145 139 6 - 56 89 - - 27 118
Cholistani 30 21 9 - 24 6 - - 7 23
Red Sindhi 28 19 9 - 20 8 - - 10 18

83
CHAPTER 4
DISCUSSION
Among various buffalo and cattle breeds in the country, Nili-Ravi buffaloes and
Sahiwal cattle are important due to their role in the milk production. Various animal
breeds of cattle, buffalo, sheep, goat and camel etc. are being exploited for milk
production in the world. In Pakistan, more than 61 % of total milk produced by
buffalo animals, while cattle are contributing nearly 35 % and remaining from sheep,
goat and camel etc. Infect more than 95 % of current milk production is from bovine
breeds in the country (GOP, 2011-12). The proportion and love for the buffalo milk is
increasing among people over the years, thus showing the preference for buffalo as
milk animal.
Selection of animals on the basis of desirable genotypes of candidate genes and
mating them to produce next generation has now increasingly been the basis of
livestock improvement. Genetic variation is the raw material for the breeders that
require the preservation of indigenous assets. Genetic variations exist among breeds
and individuals within a breed. Many traits of economic importance in animal
production are quantitative. So, the selection of dairy sires and cows mostly based on
quantitative traits such as milk, fat and protein yield etc.
Mutations within the bovine growth hormone and milk proteins genes produce
genotypes. Frequency of these genotypes is different according to the breeds.
Findings emerging from the earlier studies on bovine growth hormone and milk
proteins genes polymorphism may have some practical implementation for improving
the effectiveness of livestock sectors. There is no previous report on molecular study
on bGH, κ-CN and β-LG genes in Pakistani buffalo and cattle breeds; hence there is
dire need to characterize indigenous dairy breeds by molecular methodology. The

84
genotyping of bGH, -CN and β-LG alleles is of practical importance (Lucy et al.,
1993: Van Eenennam and Medrano, 1991).
Therefore, the genetic analysis of bovine growth hormone (bGH), kappa-casein (-
CN) and beta-lactoglobulin (β-LG) genes of three hundred and sixty six animals of
one buffalo (Nili-Ravi), and three cattle breeds Sahiwal, Cholistani and Red Sindhi
were carried out by means of PCR-RFLP methodology.
4.1 Genotyping / polymorphism of bovine growth hormone (bGH) gene
Bovine growth hormone (bGH) gene attracts significant research interest because of
its role in various physiological and metabolic processes etc. At present, several point
mutations have been described in the bGH gene (Chikuni et al., 1991; Zhang et al.,
1993; Lagziel and Soller, 1999), however, the most functional mutation present in
exon-V of bGH gene at the nucleotide position 2141 (Gordon et al., 1983).
Nili-Ravi buffalo: In the present study, all the analyzed animals of Nili-Ravi
buffaloes were found to be homozygous for leucine (L) allele of bovine growth
hormone gene, since there is only one restriction site for AluI restriction enzyme,
which resulted into two bands of 159 and 52 bp depicting a homozygotic nature of
Nili-Ravi buffaloes for bGH gene (Riaz et al., 2009). This allelic band pattern
classified as LL genotype. The present result was also in line with the earlier reports
about the monomorphism for growth hormone gene allele L in Nelore, Gyr, Guzeva
and Brown Swiss cattle (Table: 4.1). But in Bos tarus animals growth hormone locus
had two alleles due to amino acid substitution that is L and V are frequently reported
(Kemenes et al., 1999; Sabour et al., 1997). Therefore, homozygosity found in Nili-
Ravi buffalo animals could be due to the loss of genetic variability among the studied
population.

85
Cattle breeds: Polymorphism was detected in cattle (Sahiwal, Cholistani and Red
Sindhi) breeds as LL and LV genotypes. In the Sahiwal cattle, the observed genotype
frequencies for genotypes LL and LV were found to be 0.96 and 0.04 respectively,
while respective allelic frequencies were 0.98 and 0.02 and no VV genotype was
detected in any of these animals. The result shows that the frequency of allele L was
significantly higher in animals of Sahiwal cattle and only few animals were found to
be heterozygous for LV genotype.
Similarly, in Cholistani cattle, the frequencies of genotypes LL and LV were 0.70 and
0.30 respectively, while allelic frequencies were 0.85 and 0.15 for both L and V
alleles of bGH gene. In case of Red Sindhi cattle the genotypic frequencies were
found to be 0.68 and 0.32 for genotypes LL and LV respectively having respective
allelic frequencies were 0.84 and 0.16 for L and V allele (Table: 3.1). The results
showed that the frequency of genotype LL was also higher in Cholistani and Red
Sindhi cattle breeds. The Cholistani and Red Sindhi cattle are not purely used for the
dairy purpose but they are used for meat and drought purpose also. A nearly similar
results were reported in previous studies where, Lucy et al. (l993) reported higher
frequencies of bGH gene allele L in the dairy breeds of larger size, whereas smaller
breeds had the highest frequency of allele V for this locus. Dario et al. (2005) also
noticed a high frequency of bGH L allele (0.85) in Podolian cattle. Similar
findings were observed among different population of Holstein-Friesian bulls,
Canadian Holstein-Friesian bulls and Hungarian Holstein Frisian bulls where
frequency of allele V was found to be low (Zhang et al., 1993, Sabour and Lin, 1996
and Kovacs et al., 2006). Table 4.1 shows various cattle breeds with higher frequency
of allele L (Limousine, Bavarian Simental bulls, Ayrshire bulls, Jersy bulls, Simental
and Bavarian Brown bulls etc). The frequency of bGH allele V has been reported
0.04 by Mitra et al., 1995 in Indian Sahiwal cattle, 0.24 and 0.29 in Jersy and
Aryshire (Sabour et al., 1997), 0.00 in Iranian Sistani and Dashtyari breeds (Masoudi
86
et al., 2002), 0.33 in Limousine (Abbasi et al., 1999), 0.18 in Holstein (Shariflou et
al., 2000) and 0.19 in Polish black and white (Dybus A., 2002). These results are in
accordance with present findings regarding V allele of bGH locus.
The genotypic and allelic frequencies found in the present study were not much
differing from the previous studies. Thus allele L was significantly found to be higher
in analyzed animals of three cattle breeds and the higher frequency of allele L of bGH
locus was according to our hypothesis that dairy breeds would have higher allele L
since we have collected blood samples from dairy animals.
Hardy-Weinberg equation can be used to have a check on types of mating generally
practiced at the farm in the existing population. A population is considered to be in
Hardy-Weinberg equilibrium when allelic and genotypic frequencies remain constant
from one generation to the next. However, accumulation of some genotypes,
subdivision of population, migration, mutation etc. can results in state of
disequilibrium. In the present study, the deviation between observed genotypic
frequencies with those expected under Hardy-Weinberg equilibrium was not
significant (P<0.05), suggesting that the studied population of different Pakistan
cattle breeds for bGH gene were in Hardy-Weinberg equilibrium.
Several studies also demonstrating the relationship between bGH genotype and meat
traits in cattle; animals with genotype VV demonstrated lower growth rate, body
weight and daily gain than individuals with the two other genotypes (Chrenek et al.,
1998; Sirotkin et al., 2000) and lower weight of meat in the carcass (Grochowska et
al., 2001). The results of previous studies reported cows with genotype LL had higher
milk fat and protein yield compared to LV individuals (Dybus A., 2002). Whearas,
Lucy et al. (1993) reported that Holstein Friesian cows homozygous for allele L

87
produced more milk due to increase release of bGH than LV genotypes and vice versa
in US Jerseys cattle.
It was also noticed by Sabour et al. (l997) that in Holstein cows that bGH VV
genotypes had better milk production traits, especially higher milk protein when
compared with the other genotypes. In other study, Schlee et al. (1994 b) found that
bGH AluI polymorphism is related to the plasma level of bGH and genotype LL
generally associated with higher circulatory concentration of bGH. It was reported
that when Holstein cows were injected with recombinant forms of bGH, a greater
increase in milk yield occurred when cows were treated with allele V of bGH than
treated with L allele of bGH gene (Bauman and Eppard, 1985). However, Lucy et al.
(1993) reported a reduced genetic merit for milk yield in Holstein cows with V allele.
It shows that results of bGH gene polymorphism association are inconsistent. On the
basis of these observations we can think about the role of bGH gene and it may be
used as physiological indicator for milk production (Sorensen et al., 2002). So, these
findings suggest that the physiology of the animal and chemistry of the bGH
molecule may affect the relationship between bGH genotype and milk yield. So, next
studies should design especially on indigenous breeds with the aim to determine
crucial relationship between bGH genotypes and production traits.
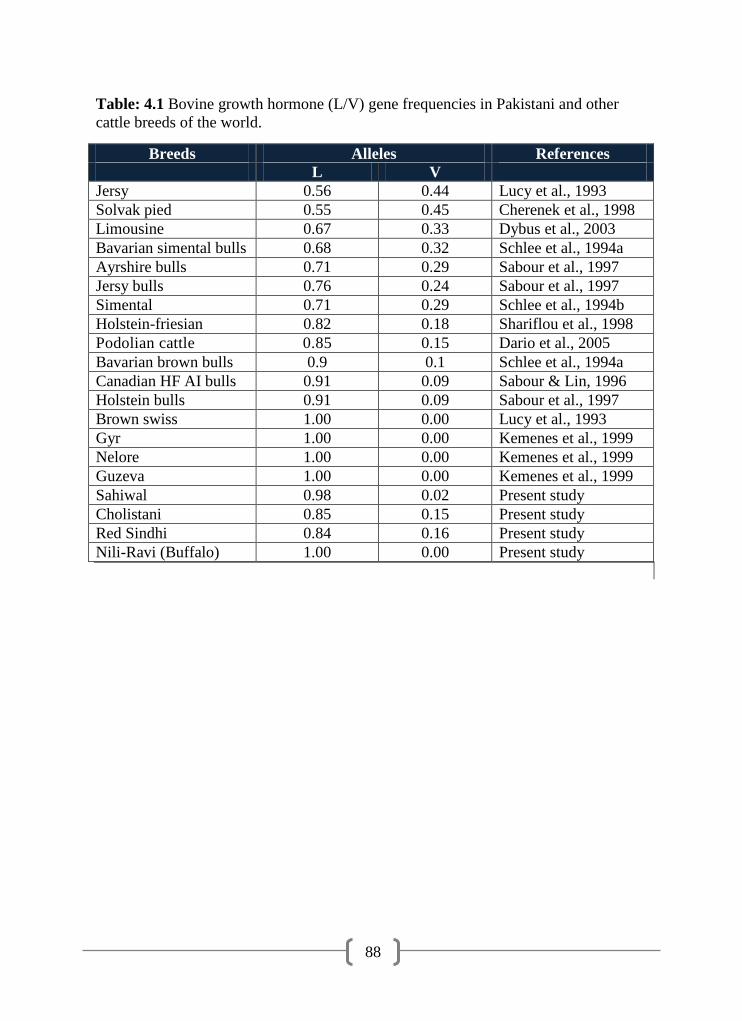
88
Table: 4.1 Bovine growth hormone (L/V) gene frequencies in Pakistani and other
cattle breeds of the world.
Breeds Alleles References
L V
Jersy 0.56 0.44 Lucy et al., 1993
Solvak pied 0.55 0.45 Cherenek et al., 1998
Limousine 0.67 0.33 Dybus et al., 2003
Bavarian simental bulls 0.68 0.32 Schlee et al., 1994a
Ayrshire bulls 0.71 0.29 Sabour et al., 1997
Jersy bulls 0.76 0.24 Sabour et al., 1997
Simental 0.71 0.29 Schlee et al., 1994b
Holstein-friesian 0.82 0.18 Shariflou et al., 1998
Podolian cattle 0.85 0.15 Dario et al., 2005
Bavarian brown bulls 0.9 0.1 Schlee et al., 1994a
Canadian HF AI bulls 0.91 0.09 Sabour & Lin, 1996
Holstein bulls 0.91 0.09 Sabour et al., 1997
Brown swiss 1.00 0.00 Lucy et al., 1993
Gyr 1.00 0.00 Kemenes et al., 1999
Nelore 1.00 0.00 Kemenes et al., 1999
Guzeva 1.00 0.00 Kemenes et al., 1999
Sahiwal 0.98 0.02 Present study
Cholistani 0.85 0.15 Present study
Red Sindhi 0.84 0.16 Present study
Nili-Ravi (Buffalo) 1.00 0.00 Present study
89
4.2 Genotyping / Polymorphism of bovine kappa-casein gene
Casein comprises the major part of the milk proteins exist in different molecular
forms i.e S1, S2, and κ having allelic variant of each type. Among these milk
proteins, κ-CN is important which presents polymorphism at its nucleotide sequence
due to allelic variations. Predominantly, genotypes A and B are commonly found in
all the cattle breeds, however they differ in amino acid position at 136 and 148 (Lin
et al., 1992). Earlier studies reported the importance of certain milk protein
genotypes and their association with milk production traits (Ng-Kwai-Hang et al.,
1984; Haenlein et al., 1987; Bech and Kristiansen, 1990), composition (Mclean,
1987; Ng-Kwai-Hang et al., 1986; Ng-Kwai-Hang, 1998; Robitaille et al., 2002) and
cheese production (Grosclaude, 1988; Aaltonen and Antila, 1987; Van den berg et al.,
1992) (Kastonina et al., 2004; Denisenko and Kalashnikova, 2004; Konovalova et al.,
2004; Romonasova, 1999; Marziali and Ng-Kwai-Hang, 1986; Aleandri et al., 1990).
Infect milk protein polymorphisms have drawn extensive research attraction because
of their potential use as a molecular markers (Del Lama and Zago, 1996).
Nili-Ravi buffalo: In the present study, restriction pattern was found subsequent to
enzymatic digestion of 453 bp PCR amplified fragment of -CN gene was compared
with already known patterns specific for each genotype (Table: 2.6). In case of Nili-
Ravi buffaloes, restriction analysis of -CN amplified DNA fragment with HinfI
restriction endonuclease generated DNA fragments of (426 & 27 bp), HaeIII
(223/230 bp) and MaeII (254 & 199 bp). Cumulative analysis of the restriction
pattern of three restriction enzymes depicted the existence of only BB genotype.
Similar results were found in another study carried out in Indian Nili-Ravi and
Murrah buffalo breeds also supported our finding by (Mitra et al., 1998), (Pipalia et
al., 2001), (Otaviano et al., 2005), (Gangaraj et al., 2008). A nearly similar results
were also found in Egyptian buffalo (Othman O. E., 2005); (Galila and Samah, 2008)

90
and (Dayem et al., 2008) which revealed monomorphism (BB) for this gene in
buffalo animals. Similarily, animals of Nili-Ravi buffaloes were also found to be
homozygous for genotype GG of bovine prolactin gene (Ishaq et al., 2012).
But there are variations in the observation of Sing et al., 2005 who noticed two alleles
that is A and B for -CN locus in Murrah and Bhadawari breeds but they have
reported monomorphism in Surti and Mehsana breedes of buffalo. Similarly two
types of alleles were found in Murrah, Surti and Pandharpuri breeds of buffalo
reported by (Patel et al., 2007). Monomorphic form BB of -CN gene is responsible
for increase yield in cheese making and milk protein yield etc (Mclean, 1987). The
cheese yield can be increased by 10 % if milk is from the animals of -CN genotype
BB can be used (Marziali and Ng-Kwai-Hang, 1986).
Cattle breeds: Polymorphism was found in cattle breeds as AA and AB genotypes.
Cumulative restriction pattern through restriction analysis of -CN gene indicating
different genotypes using three restriction enzymes is presented (Table: 2.6). In
Sahiwal cattle the observed frequencies for genotypes AA and AB were found to be
0.386 and 0.614 respectively and the frequencies of alleles A and B were 0.69 and
0.31 respectively.
Similarly, in Cholistani cattle the genotype frequencies for AA and AB were 0.800
and 0.200 respectively and the allele frequencies for A and B alleles were 0.900 and
0.100 respectively. In the Red Sindhi animals genotypic frequencies for genotypes
AA and AB were found to be 0.714 and 0.286 and their allelic frequencies for A and
B alleles were 0.860 and 0.140 (Table 3.2). Thus the observed frequency of allele B
in the Sahiwal animals was higher as compared to the Cholistani and the Red Sindhi
breeds. No BB, AE, BE, EE, AC and BC genotypes were detected in any of these
animals (Riaz et al., 2011).
91
The κ-CN genotypic and allelic frequency results of our study are in agreement with
those of other studies. In a study in Canada involving 6509 Holstein cows the
frequency of allele B was found to be 0.132. The genotypic frequencies for AA and
AB alleles were 73.47 % and 26.53 % respectively (Ng-Kwai-Hang et al., 1990). In a
study in India Mitra et al. (1998) used 57 animals to detect the κ-CN genotypes in the
Sahiwal cattle breed using a PCR-RFLP. No BB genotype was detected in their study.
The frequency of the allele B noted was low (0.16) as compared to the one found in
our study. This difference may be due to the number of animals used in both these
studies. Golijow et al. (1999) found a low frequency of allele B in Argentine Holstein
(0.344) and Argentine Creole (0.353) as compared to allele A. In Pantaneiro breed of
Brazil the frequency of allele B was found to be 0.218. Frequencies of the AA, AB
and BB were 0.598, 0.368 and 0.034 respectively (Lara et al., 2002). Alipanah et al.
(2005) detected frequencies of allele B to be 0.17 and 0.31 in Russian Black Pied and
Red Pied cattle breeds respectively. In the Black Pied breed the frequencies of the
AA, AB and BB genotypes were 68.89 %, 28.22 % and 2.89 % respectively, while in
the Red Pied breed these values were 44.12 %, 50.00 % and 5.88 % respectively. In a
study in Turkey the frequency of allele B in Holstein cattle was noted to be 0.288 by
urea-starch gel electrophoresis. The genotypic frequencies were 0.586, 0.251 and
0.163 for AA, AB and BB respectively (Oner and Elmaci, 2006). Rohallah et al.
(2007) reported a frequency of 0.361 of allele B in Irani Sistani cattle. The
frequencies observed for the AA, AB and BB genotypes were 0.4000, 0.4769 and
0.1231 respectively. Azevedo et al. (2008) conducted a study on κ-CN gene allelic
polymorphism in some cattle breeds of Brazil. They found that in all the breeds of
Bos indicus origin (Sindhi, Gyr, Guzerat and Nelore) allele B was less frequent, with
values ranging from 0.01 to 0.30. Sitkowska et al. (2008) observed a frequency of
0.17 of allele B in Holstein-Friesian cattle in a study in Poland. The frequencies of
the AA, AB and BB genotypes observed were 0.71, 0.23 and 0.06 respectively. In a
recent study on Black and white dairy cattle in Turkey, the frequency of allele B was
92
found to be 0.32 and the frequencies for the AA, AB and BB genotypes were detected
to be 0.51, 0.36 and 0.13 respectively (Gurcan, 2011). In general, the allele B occurs
at a higher frequency in cattle of Bos taurus origin than in those of Bos indicus origin
(Baker and Manwell, 1980; Del lama and Zago, 1996; Golijow et al., 1996; Kemenes
et al., 1999; Shetty et al., 2006). Table 4.2 shows κ-CN gene frequencies in cattle
breeds of the world indicating higher frequencies of allele A.
Relationships between milk protein genotypes and yield traits have been reported by
several authors (Lin et al., 1992). In a study conducted by (Bovenhuis et al., 1992),
κ-CN genotype had a significant effect on milk production (p>0.001), with cows of
the BB genotype producing 173 Kg less milk than AA cows. Whereas Strzalkowska
et al. (2002) and Aleandri et al. (1990) found no significant associations; results from
other group (Ikonen et al., 1999) indicated that there is indeed a relationship.
However, because of economic interests, it has been suggested that favorable milk
protein genotypes, κ-CN BB, should be included into the criteria for selection of dairy
cattle.
We detected no BB genotype animals in our study possibly because of very low
frequency of this genotype in the three breeds. Owning to their relationship to a
higher protein and cheese yield it is desirable to have increased κ-CN allele B and
genotype BB frequencies in dairy herds. In the three cattle breeds used in the present
study this can be achieved by selecting animals with the κ-CN AB genotype and
crossing them with one another so as to get more BB genotype progeny. This can be
especially useful in the Sahiwal breed in which the frequency of the AB genotype was
higher as compared to the Cholistani and Red Sindhi breeds as observed in the present
study. The χ2 test (P < 0.05) analysis showed that the animals of Cholistani and Red
Sindhi cattle used in this study were in Hardy-Weinberg equilibrium while results for
Sahiwal cattle shows slight deviation and making the results significant. Therefore, it
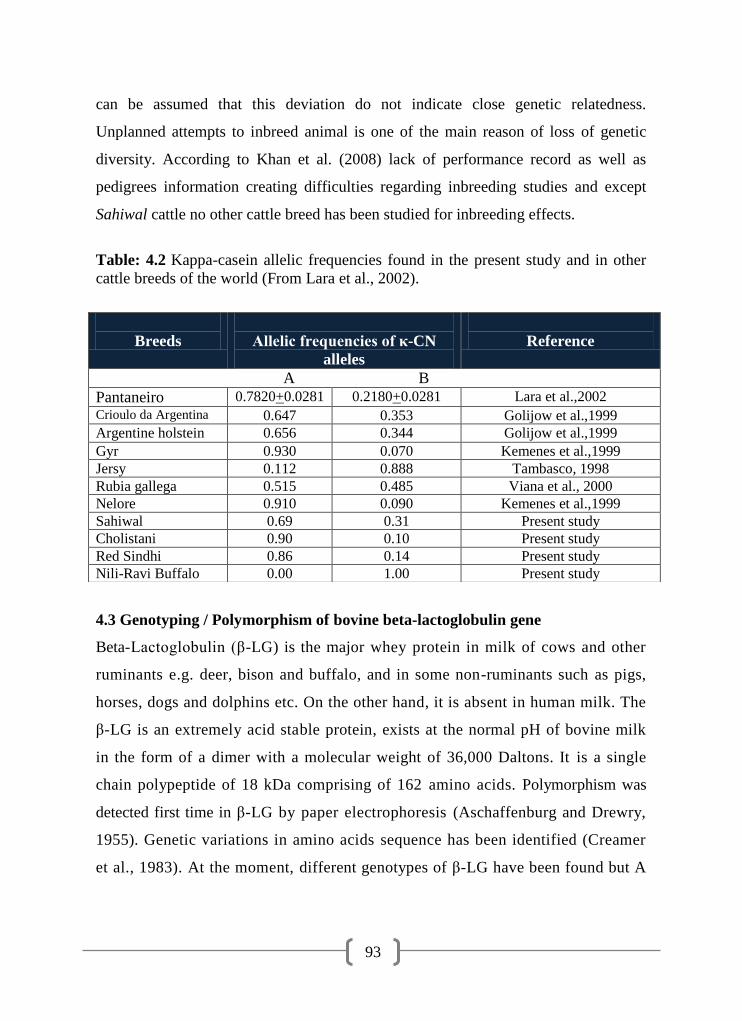
93
can be assumed that this deviation do not indicate close genetic relatedness.
Unplanned attempts to inbreed animal is one of the main reason of loss of genetic
diversity. According to Khan et al. (2008) lack of performance record as well as
pedigrees information creating difficulties regarding inbreeding studies and except
Sahiwal cattle no other cattle breed has been studied for inbreeding effects.
Table: 4.2 Kappa-casein allelic frequencies found in the present study and in other
cattle breeds of the world (From Lara et al., 2002).
4.3 Genotyping / Polymorphism of bovine beta-lactoglobulin gene
Beta-Lactoglobulin (β-LG) is the major whey protein in milk of cows and other
ruminants e.g. deer, bison and buffalo, and in some non-ruminants such as pigs,
horses, dogs and dolphins etc. On the other hand, it is absent in human milk. The
β-LG is an extremely acid stable protein, exists at the normal pH of bovine milk
in the form of a dimer with a molecular weight of 36,000 Daltons. It is a single
chain polypeptide of 18 kDa comprising of 162 amino acids. Polymorphism was
detected first time in β-LG by paper electrophoresis (Aschaffenburg and Drewry,
1955). Genetic variations in amino acids sequence has been identified (Creamer
et al., 1983). At the moment, different genotypes of β-LG have been found but A
Breeds
Allelic frequencies of κ-CN
alleles
Reference
A B
Pantaneiro 0.7820+0.0281 0.2180+0.0281 Lara et al.,2002
Crioulo da Argentina 0.647 0.353 Golijow et al.,1999
Argentine holstein 0.656 0.344 Golijow et al.,1999
Gyr 0.930 0.070 Kemenes et al.,1999
Jersy 0.112 0.888 Tambasco, 1998
Rubia gallega 0.515 0.485 Viana et al., 2000
Nelore 0.910 0.090 Kemenes et al.,1999
Sahiwal 0.69 0.31 Present study
Cholistani 0.90 0.10 Present study
Red Sindhi 0.86 0.14 Present study
Nili-Ravi Buffalo 0.00 1.00 Present study
94
and B are more commonly observed genotype. The biological functions of this
protein are still not known. It is speculated that β-LG may have certain role in
metabolism of phosphate in the mammary gland and the transport of retinol and
fatty acids in the gut etc (Hill et al., 1997).
Nili-Ravi buffalo: In the present study restriction digestion of 262 bp PCR
amplified products with HaeIII enzyme revealed three genotypes (AA, AB and
BB). In Nili-Ravi buffaloes, genotypes AA and BB were found in homozygous
form and the frequency of these genotypes were found to be 0.64 and 0.36 and no
animal of AB genotype was observed in the studied population. Similarly, two
alleles of β-LG gene A & B were noted in Murrah, Surti, Jaffarabadi and
Pandharpuri breeds of buffalo, but in contrast to present results the frequency of
AB genotype was higher reported by (Patel et al., 2007), however in Iranian
buffalo the genotype BB was more frequent (Karimi et al., 2009). More commonly
the B allele was found in higher frequencies in most of the cattle breeds (Table:
4.3) and recognized as superior for milk quality, while their frequencies (B allele)
was found low in studied population of Nili-Ravi buffaloes. To improve the
frequency of B allele, the bulls with favorable β-LG BB genotype should select
for breeding purposes. Because of the paucity of literature on β-LG gene
polymorphism in buffalo, it is difficult to compare current observation with others
to come to a solid conclusion on this locus.
Cattle breeds: In cattle, the observed genotypes were AB and BB. The frequencies
of these genotypes in cattle breeds as in (Table: 3.3). In Sahiwal cattle, the frequency
of AB and BB genotypes were found to be 0.18 and 0.82 respectively, while
respective allelic frequencies were 0.09 and 0.91 for A and B alleles and no AA
genotype was detected in any of these animals. Similarly, in Cholistani cattle the
frequencies of AB and BB genotypes were 0.24 and 0.76 respectively, while allelic
95
frequencies were 0.12 and 0.88 respectively for A and B alleles. In the Red Sindhi
animals, the genotypic frequencies were 0.36 and 0.64 and respective allelic
frequencies were 0.18 and 0.82 for A and B allele. The overall results show that the
animals of Nili-Ravi buffaloes has high frequency of A allele while frequency of B
allele was high in all three cattle breeds but among three Sahiwal is on top
followed by Cholistani and Red Sindhi cattle (Table: 3.3). The frequency of A
allele was found to be lower than that of the B allele in all the three cattle
breeds, and in close agreement to the results of earlier workers in Bos taurus
(Chung et al., 1998; Badola et al., 2004; Rachagani et al., 2006; Kucerova et al.,
2006). The deviation between observed genotypic frequencies with those expected
under Hardy-Weinberg equilibrium was not significant (P<0.05), suggesting that the
studied population for β-LG gene is in equilibrium. The genotyping results of
analyzed cattle breeds are similar to those reported in Gyr, Nelore and Sindhi
cattle (Del and Zago, 1996). Higher frequencies of B allele was also reported in
dual purpose Gyr and Nelore breeds than beef breeds (Kemenes et al., 1999).
These results further indicate that Bos indicus cattle are predominantly of β-LG B
type as compared to Bos taurus cattle (Table 4.3). Earlier reports indicate that milk
produced by β-LG AA genotyped cows produced more lactoglobulin, less casein and
less fat than that of BB genotype cows. While the milk produced by BB genotype
cows produced more cheese than by AA (Van der Berg et al., 1992) while the cows
having genotypes AB produced more milk and protein (Tsiaras et al., 2005).

96
Table: 4.3 Beta-lactoglobulin allelic frequencies in various cattle breeds of the world.
4.4 Sequencing and BLAST analysis of bovine growth hormone gene
The sequence obtained of bGH gene segment in Nili-Ravi buffaloes has been
submitted to the NCBI database with Accession No. FJ754322. The DNA sequencing
confirmed the homozygosity of Nili-Ravi buffaloes for bGH gene. Sequencing results
of bGH Alu-I locus obtained Alu-I enzyme restriction site (AGCT) that shows a
polymorphism in the bGH gene sequence. Zhang et al. (1993) and Lucy et al. (1993)
reported that in bGH gene Alu-I locus, a mutation occured between cytosine (AGCT)
to guanine (AGGT) respectively. The sequence analysis of bGH, gene in Nili-Ravi
buffaloes revealed several changes undertaken in this study.
The nucleotide BLAST analysis of sequence for possible match to the DNA sequence
of bGH gene yielded 103 hits on the query sequence. Comparison of partial bGH
sequence among Bubalus bubalis (Acces.No. AJ011533), cattle (Acces. No. M57764)
and sheep (Acces. No. EF077162) through blastn shows that the homology of the
nucleotide sequence with cattle is up to 98 %, buffalo is 99 % and sheep 96 %. The
nucleotide variation was found on comparison of the partial sequence of Nili-Ravi
buffaloes. Comparison of bGH gene sequence obtained in Nili-Ravi buffaloes with
Bubalus bubalis and Bos taurus revealed several sites of changes includes one base
Breed
Alleles frequencies
References A B
Finnish ayrshire 0.280 0.720 Ikonen et al., 2000
Polish black-and-white 0.370 0.630 Strzalkowska et al., 2002
Reggiana (Italian) 0.558 0.442 Caroli et al., 2004
Italian friesian 0.436 0.564 Caroli et al., 2004
Italian brown 0.347 0.653 Caroli et al., 2004
Czech fleckvieh 0.511 0.489 Kucerova et al., 2006
Swedish red 0.380 0.620 Hallen et al., 2008
Dutch holstein-friesian 0.583 0.417 Heck et al., 2009
97
deletion at position 35 with Bubalus bubalis while with Bos taurus four sites were
found. It includes two transitions at positions 182 & 185 (A G & C T), two
deletions were also observed at positions 23 & 36. Distance tree analysis of blasted
sequence of bovine growth hormone gene indicates their maximum closeness with the
Bubalus bubalis growth hormone gene.
98
4.5 Sequencing and BLAST analysis of bovine kappa-casein gene
The sequence obtained for the κ-CN gene segment in Nili-Ravi buffaloes has been submitted to
the NCBI database with Accession No. FJ770200. The DNA sequencing confirmed the
homozygosity of Nili-Ravi buffaloes for κ-CN gene and the resultant PCR products were of
targeted gene.
The nucleotide sequence search for possible match to the DNA sequence of κ-CN gene yielded
99 hits on the query sequence. On comparison of partial kappa-casein gene sequence of Nili-
Ravi buffaloes among Bubalus bubalis (Acces. No. AY750857), cattle (Acces. No. AJ849456),
goat (Acces. No.AY428577) through BLAST shows that the homology of the nucleotide
sequence with cattle is up to 96%, buffalo 99% and goat 93%.
Comparison of κ-CN gene sequence obtained in Nili-Ravi buffaloes with Bubalus bubalis and
Bos taurus revealed several sites of changes includes two transversion at positions 102 and 111
(C G & C A respectively) with Bubalus bubalis while with Bos taurus sixteen altered
sites were found. It includes ten transition at positions 151, 199, 290, 328, 335, 378, 381, 390,
399 & 415, two transversion at positions 296 and 379 (T G & G C), two deletion at
positions 362 & 419 and two base insertion were also observed at positions 359 & 416.
Distance tree analysis of blasted partial sequence of κ-CN gene indicates their maximum
closeness with the Bubalus bubalis κ-CN gene sequence.
4.6 Sequencing and BLAST analysis of bovine β-LG gene
The sequence obtained for the β-LG gene segment of Nili-Ravi buffaloes has been analyzed
using NCBI BLAST analysis. DNA sequencing confirmed that the resultant PCR product was
of targeted gene.
Analysis of partial β-LG gene sequence of Nili-Ravi buffaloes with Bubalus bubalis and Bos
Taurus through BLAST shows homology of nucleotide sequence with River buffalo of Murrah
breed (Bubalus bubalis) (97-99%) with accession no. DQ340204 and emb|AJ492505 and 100%
with Bos taurus with accession no. DQ489319. Comparison of β-LG gene sequence of Nili-
Ravi buffaloes with Bubalus bubalis and Bos taurus revealed no change with Bos taurus while

99
with Bubalus bubalis several altered sites were found. It includes three base transitions at
positions 167, 233 & 241, two transversion at positions 155 and 211 (C G & T G), one
base deletion and insertion at positions 157 & 70 were also observed (Fig: 3.21).
Distance tree analysis of β-LG gene sequence indicates their maximum closeness with the even
toed ungulates as well as Bubalus bubalis β-LG gene sequence. The amplified product showed
no variation in size either within or between the buffalo and cattle breeds analyzed, suggesting
the conservation of studied genes between Bubalus bubalis, Bos indicus and Bos taurus species.
In the present study the analyzed animals of Nili-Ravi buffaloes were found to be homozygous
for bGH and -CN genes and no polymorphism was detected, but in cattle polymorphism was
detected in the form of different genotypes. The present study is primarily based on already
known genes with known mutations with a standardized assay to identify these mutations.
Our results confirmed the supreme genetic potential of Pakistani dairy animals in accordance
with the previous studies. This suggests that if production of one animal is low than only one
must focuses his attention for the information of non-genetic factors. Genotyping of different
milk proteins can be performed by electrophoresis, directly from milk samples only during the
lactation phase. So, it can only be used in cows during lactation stage. With newly developed
techniques based on DNA analysis, it is now possible to analyze bGH, κ-CN and β-LG genes of
all individuals in a given population under selection, regardless of sex, age or any physiological
status.
Due to the high demand for κ-CN B milk by the dairy industry as it is related to an increase
cheese yield and protein contents, it can be helpful to increase B allele in the dairy cattle
population by identifying sires with homozygous or heterozygous κ-CN BB or AB allele and
using them more frequently as service sires for producing new generation with higher allelic
frequencies of allele B.
Usually the breeding plan is an approach by which livestock breeders identify superior animals
and to be used as parent of future generation. As the commercial breeding remain a valuable
alternative by exploiting genetic variability and diversity of existing populations, that gene
technology has rendered much more powerful and efficient, permitting required genotypes
identification as soon as born, prior to performance recording or progeny testing. In case of
100
dairy traits, progeny testing is supposed to be the method of choice especially for identification
of superior sires. Generally BLUP procedure or sire model are used to estimate breeding value
of animal. Non-reliability of data making these models less useful in Pakistan. Hence, there is
need to incorporate genomic informations of candidate genes having significant effect on milk
quality and quantity into selection program along with conventional strategies. Selection of high
milk producing animals ultimately will improve the income of farmers and industry as well.
Increase milk production will improve the economic condition as well as GDP of the country.
101
CONCLUSIONS
The Nili-Ravi buffaloes were found to be homozygous for allele L of bGH gene.
Frequency of the same allele L was also found to be higher in Sahiwal followed by
Cholistani and Red Sindhi cattle. Genotype VV was not found in any of these studied
animals. Since LL genotype has been previously correlated with milk yield. Therefore,
the high prevalence of LL genotype while the absence of VV genotype was according to
our hypothesis that high milk producing cattle would have LL genotype, since we have
collected samples from dairy animals.
All the Nili-Ravi buffaloes were monomorphic for -CN BB genotype, while
polymorphism was found in Sahiwal, Cholistani and Red Sindhi cattle in the form of
AA and AB genotypes, the frequency of allele A was higher in all cattle breeds than B
allele. We detected no BB genotype in cattle in the present study possibly because of
very low frequency of this genotype in the three breeds. Owning to their relationship to
a higher protein and cheese yield it is desirable to have increased κ-CN allele B and
genotype BB frequencies in dairy herd. This can be achieved by selecting animals with
the κ-CN AB genotype and crossing them with one another so as to get more BB
genotype progeny.
The Nili-Ravi buffaloes were also found homozygous for β-LG genotypes AA and BB.
While in cattle observed genotype were AB and BB. Frequency of allele B was higher in
cattle breeds than allele A.
B allele of -CN & β-LG milk proteins and L allele of bGH were recognized as superior
for milk production traits in the literature, and were observed to be high in the studied
population of Nili-Ravi buffaloes and Sahiwal, Cholistani and Red Sindhi cattle. These
observations suggest that the milk of Pakistani dairy breeds is advantageous for
producing high quality and increase cheese yield. Thus, it may be concluded that bGH,
-CN & β-LG genotypes, when used as genetic markers in selection programs, may
moderality but significantly contribute to the improvement of milk production traits.
102
Thus it would suggest that:
To increase the frequency of B allele of -CN gene, progeny tested sires with favorable
alleles BB and AB can be used in AI. Gene bank should establish where germplasm of
indigenous breeds should store with their known genetic status.
Future studies should plan to investigate the candidate genes and their relationship with
the productive traits in the indigenous livestock breeds.
The present study is the first report of bGH, -CN & β-LG genes polymorphism of
Pakistani bovine breeds. Therefore, it has been suggested that all cattle and buffaloes
used for dairy breeding purposes should be screened by molecular methods. Thus, it
would save massive amounts of money and time spent in selecting high milk producing
dairy animals.
103
REFERENCES
Aaltonen, M. L. and Antila, V. (1987). Milk renneting properties and genetic genotypes of
proteins. Milchwissenschaft, 42 (8): 490-92.
Aarestrup, F. M., Jensen, N. E. and Ostergard, H. (1995). Analysis of association between
major histocompatibility complex (BoLA) class-I haplotypes and subclinical mastitis
of dairy cows. Journal of Dairy Science, 78: 1684-1692.
Abbasi, A., Torkamanzehi, A. and Gharashi, S. A. (1999). Analysis of polymorphism in
growth hormone and its association with milk production traits in Iranian Holstein.
M.Sc. Thesis, Agriculture faculty of Sistan and Balouchestan University, Iran, pp: 108.
Ahmadian, A. and Lundeberg, J. (2002). A brief history of genetic variation analysis.
BioTechniques, 32: 1122-1137.
Aleandri, R., Buttazzoni, L. G., Schneider, J. C., Caroli, A. and Davoli, R. (1990). The effects
of milk protein polymorphism on milk components and cheese producing ability.
Journal of Dairy Science, 73: 241-255.
Ali, S. and Clark, A. J. (1988). Characterization of the gene encoding ovine beta-lactoglobulin.
Journal of Molecular Biology, 199: 415-426.
Alexander, L. J., Stewart, A. F., Mackinlay, A. G. and Kapelinskaya, T. V. (1988). Isolation
and characterization of the bovine kappa-casein gene. European Journal of
Biochemistry, 178: 395-401.
Alipanah, M., Kalashnikova, L. A. and Rodionov, G. (2005). Kappa-casein and PRL-RsaI
genotypic frequencies in two Russian cattle breeds. Archivos de Zootecnia, 57: 131-138.
Angiolillo, A., Yahyaoui, M. H., Sanchez, A., Pilla, F. M. and Folch, J. (2002). Characterization
of new genetic variant in the caprine kappa-casein gene. Journal of Dairy Science, 85:
2679-2680.
Aschaffenburg, R. and Drewry, J. (1955). Occurrence of different beta-lactoglobulins in cow's
milk. Nature, 176: 218-219.
Aschaffenburg, R. (1961). Inherited casein variants in cow's milk. Nature, 192:431-432.
Ashfaq, M. and Razzak, W. (2000). Prevalence of Theileria annulata infection in cross bred
cattle in Faisalabad. Pakistan Veterinary Journal, 57(1): 131-136.
104
Azevedo, A. L. S., Nascimento, C. S., Steinberg, R. S., Carvalho, M. R. S., Peixoto, M. G. C.
D., Teodoro, R. L., Verneque, R. S., Guimaraes, S. E. F. and Machado, M. A. (2008).
Genetic polymorphism of kappa-casein gene in Brazilian cattle. Genetics and Molecular
Research, 7: 623-630.
Baker, A. C. M. and Manwell, C. (1980). Chemical classification of cattle breeds. Animal blood
groups biochemistry. Genetics, 11: 127-150.
Badola, S., Battacharya, T. K., Biswas, T. K., Sivakumar, B. M., Pushpendra, K. and Arjava,
S. (2004). A comparison on polymorphism of beta-lactoglobulin gene in Bos indicus,
Bos taurus and indicine × taurine crossbred cattle. Asian Australian Journal of Animal
Science, 17(6): 733-736.
Bale, I. K. and Conover, C. A. (1992). Regulation of insulin like growth factor binding protein
3 messenger ribonucleic acid expression by insulin like growth factor-1. Endocrinology,
131: 608-14.
Barroso, A., Dunner, S. and Canow, J. (1998). Technical Note: Detection of bovine kappa-
casein variants A, B, C and E by means of PCR-SSCP. Journal of Animal Science, 76:
1535-38.
Bastos, E., Cravador, J. A. and Guedes-Pinto, H. (2001). Single strand conformation
polymorphism detection in six genes in Portuguese indigenous sheep breeds.
Biotechnology Agronomy Social Environment, 5 (1): 7-15.
Bauman, D. E. and Eppard, P. J. (1985). Response of high producing dairy cows to long-term
treatment with pituitary somatotropin and recombinant somatotropin. Journal of Dairy
Science, 68: 1352-1362.
Bech, A. M. and Kristiansen, K. R. (1990). Milk protein polymorphism in Danish dairy cattle
and the influence of genetic genotypes on milk yield. Journal of Dairy Science, 57: 53-
63.
Blumberg, B. S. and Tombs, M. P. (1958). Possible polymorphism of bovine alpha-
lactoalbumin. Nature, 181: 683-684.
Bonsing, J. and Mackinlay, A. G. (1987). Recent studies on nucleotide sequences encoding the
caseins. Journal of Dairy Research, 54: 447-461.
105
Botstein, D., White, R. L., Skolnick, M. and Davis, R. M. (1980). Construction of genetic
linkage map in man using restriction length polymorphism. American Journal of Human
Genetics, 32: 314-331.
Bovenhuis, H., Van Arendonk, J. A. M. and Korver, S. (1992). Association between milk
protein polymorphism and milk production traits. Journal of Dairy Science, 72: 2549-
2559.
Brophy, B., Srmlenski, G., Wheeler, T., Wells, D., Huillier, P. and Laible, G. (2003). Cloned
transgenic cattle produce milk with higher levels of beta-casein and kappa-casein. Nature
Biotechnology, 21: 157-162.
Caroli, A., Chessa, S., Bolla, P., Budelli, E. and Gandini, G. C. (2004). Genetic structure of
milk protein polymorphisms and effects on milk production traits in local dairy cattle.
Journal of Animal Breeding and Genetics, 12: 119-127.
Carnicella, D., Dario, C. and Bufano, G. (2003). Polimorfismo del gene GH performances
produttive. Large Animals Review, 3: 3-7.
Chikuni, K., Terada, F., Kageyama, S., Koishikawa, T., Kato, S. and Ozutsumi, K. (1991).
Identification of DNA sequence genotypes for amino acid residues 127 of bovine
growth hormone using the polymerase chain reaction method. Animal Science and
Technology, 62: 660-666.
Chessa, S., Chiatti, F. G., Cerotti, A., Ceroli, C., Consolaudi, G., Pagnacco and Castiglioni, B.
(2007). Development of single nucleotide polymorphism genotyping microarray
plateform for the identification of bovine milk protein genetic polymorphism.
Journal of Dairy Science, 90: 451-464.
Chrenek, P., Kmet, I., Sakowsky, D., Vasicek, J., Huba, J. and Chrenek, J. (1998). Relationship
of growth hormone genotypes with meat production traits of Slovak pied bulls.
Czech Journal of Animal Science, 43: 541-544.
Chung, E. R., Kim, W. T. and Lee, C. S. (1998). The DNA polymorphism of kappa- casein and
beta-lactoglobulin, growth hormone and prolactin genes in Korean cattle. Asian
Australian Journal of Animal Science, 11: 422-427.
Coll, A., Folch, J. M. and Sanchez, A. (1993). Nucleotide sequencing of the goat kappa-casein
cDNA. Journal of Animal Science, 71: 2833.
106
Creamer, L., Parry, D. and Malcolm, G. (1983). Secondary structure of Alpha-lactoglobulin.
Archives of Biochemistry and Biophysics, 227: 98-105.
Daniela, I. and Vintila, I. (2005). Analysis of gene polymorphism at locus of κ-casein and β-
lactoglobulin genes using multiplex PCR technique. Zootehnie şi Biotehnologii, 38:
769-773.
Dario, C., Carnicella, D. and Bufano, G. (2005). A note on the growth hormone GH1-AluI
polymorphism in Podolica cattle in southern Italy. Animal Science Paper and
Reports, 23 (1): 43-49.
Dayem Abdel, A. M. H., Mahmoud, K. G. M., Nawito, M. F., Ayoub, M. M. and Darwish, S.
F. (2008). Genotyping of kappa-casein gene in buffalo bulls. Livestock Science,
doi: 10.1016/j.livsci.2008.09.010.
Decker, J. E., Pires, J. C., Gavin C. C., Stephanie, D. M., Michael, P. H., Kefei, C., Alan, C.,
Johanna, V., Christopher, M. S., Alexandre, R. C., Gary, S. J., Rick, A. B., Olivier,
H., Lori, S. E., Pamela, W., Jong, J. K., Kwan, S. K., Tad, S. S., Curt, P. V. T.,
Holly, L. N., John, C. M., Rudiger, B., Luiz, L. C., Masroor, E. B., Gregory, A. W.,
Matthew, C. M., Megan, M. R., Jaewoo, K., Robert, D. S. and Jeremy, F. T. (2009).
Resolving the evolution of extant and extinct ruminants with high-throughput
phylogenomics. PNAS, 3 (44), 18644-18649.
Dekkers, J. C. M. (2004). Commercial application of marker and gene-assisted selection in
livestock: Strategies and lessons. Journal of Animal Science, 2 (E. Suppl.): E313-
E328.
Del Lama, S. N. and Zago, M. A. (1996). Identification of kappa-casein and beta-lactoglobulin
genotypes in Brazilian Bos indicus and Bubalus bubalis population. Brazilian
Journal of Genetics, 19: 73-77.
Denisenko, E. A. and Kalashnikova, L. A. (2004). Milk production of black pied breeds with
different genotypes of kappa-casein. 4th conference, biotechnology in farm animal.
Dobrovitsy, Russia. 24-25 Nov. 47-48.
Duncan, B. K. and Miller, J. H. (1980). Mutagenic deamination of cytosine residues in DNA.
Nature, 287: 560-561.

107
Dybus, A. (2002). Associations between Leu/Val polymorphism of growth hormone gene and
milk production traits in black and white cattle. Arch. Tierz. Dummerstorf, 45: 421-
428.
Dybus, A., Kmiec, M., Sobek, Z. and Wisniewski, B. (2003). Associations between
polymorphism of the growth hormone gene and production traits of Limousine
cattle. Medycyna Weterynaryjna, 59: 133-136.
Eigel, W. N., Butler, J. E., Ernstrom, C. A. and Farrell, H. M. (1984). Nomenclature of proteins
of cow‟s milk: Fifth revision. Journal of Dairy Science, 67: 1599-1631.
Eppard, P. J., Bentle, L. A., Violand, B. N., Ganguli, S., Hintz, R. L., Kung, L. J. R., Krivi, G.
G. and Lanza, G. M. (1992). Comparison of the galactopoietic response to
pituitary-derived and recombinant-derived variants of bovine growth hormone.
Journal of Endocrinology, 132, 47-56
Erhardt, G. (1989). Evidence for a third allele at the beta-lactoglobulin locus of sheep milk and
its occurrence in different breeds. Animal Genetics, 20: 197-204.
Falaki, M., Gengler, N., Sneyers, M., Prandi, A., Massart, S. and Formigoni, A. (1996).
Relationships of polymorphisms for growth hormone and growth hormone receptor
genes with milk production traits for Italian Holstein-Friesian bulls. Journal of
Dairy Science, 79(8): 1446-1453.
FAO. (2007). The state of the world‟s animal genetic resources for food and agriculture.
ftp://ftp.fao. org/docrep/fao/meeting/012/ah834e/ah834e.pdf.
Ferretti, L., Leone, P. and Sgaramella, V. (1990). Long range restriction analysis of bovine
casein genes. Nucleic Acids Research, 18: 6829-6833.
Fiat, A. M. and Jolles, P. (1989). Caseins of various origins and biologically active casein
peptides and oligosaccharides: structural and physiological aspects. Molecular Cell
Biochemistry, 87: 5-30.
Flower, D. R. (1996). The lipocalin protein family: structure and function. Biochemistry
Journal, 318: 1-14.
Folch, J. M., Coll, A. and Sanchez, A. (1993). Rapid communication: cloning and sequencing
of the cDNA encoding goat beta-lactoglobulin. Journal of Animal Science, 71: 2832.
Folch, J. M., Coll, A. and Sanchez, A. (1994). Complete sequence of the caprine beta-
lactoglobulin gene. Journal of Dairy Science, 77: 3493-3497.

108
Folch, J. M., Coll, A., Hayes, H. C. and Sanchez, A. (1996). Characterization of a caprine beta-
lactoglobulin pseudo gene, identification and chromosomal localization by in situ
hybridization in goat, sheep and cow. Gene, 177: 87-91.
Fox, P. F. and McSweeney, P. L. H. (1998). Dairy chemistry and biochemistry, pp: 146-149.
Fujiwara, Y., Miwa, M., Nogami, M., Okumura, K., Nobori, T., Suzuki, T. and Ueda, M. 1997.
Genomic organization and chromosomal localization of the human casein gene
family. Human Genetics, 99: 368-373.
Furet, J. P., Mercier, J. C., Soulier, S., Gaye, P., Hue-Delahaie, D. and Vilotte, J. L. (1990).
Nucleotide sequence of ovine kappa-casein cDNA. Nucleic Acids Research, 17:
5286.
Galila, A. E. R. and Samah, F. D. (2008). A PCR-RFLP assay to detect variants of kappa-casein
gene in cattle and buffalo. Arab Journal of Biotechnology, 11(1): 11-18.
Gangaraj, D. R., Shetty, S., Govindaiah, M. G., Nagaraja, S. M., Byregowda, S. M. and
Jayashankar, M. R. (2008). Molecular characterization of kappa-casein gene in
buffalo. Science Asia, 34: 435-439.
Gaye, P., Mue-Delahaie, D., Mercier, J. C., Soulier, S., Vilotte, J. L. and Furet, J. P. (1986).
Ovine beta-lactoglobulin messenger RNA: nucleotide sequence and mRNA levels
during functional differentiation of the mammary gland. Biochimie, 68: 1097-1107.
Ge, W., Davis, M. E., Hines, H. C., Irvin, K. M. and Simmen, R. C. M. (2003). Association of
single nucleotide polymorphism in the growth hormone and growth hormone
receptor genes with blood serum insuline like growth hormone factor-I concentration
and growth traits in Aungus cattle. Journal of Animmal Science, 81: 641-648.
Godovac-Zimmerman, J., Krause, I., Barany, M., Fisher, F. S., Juszczak, J., Erhardt, G.,
Buchberger, J. and Klostermeyer, H. (1996). Isolation and rapid sequence
characterization of two novel beta-lactoglobulin variants I and J. Protein Chemistry,
15: 743-750.
Golijow, C. D., Giovambattista, G., Poli, M., Dulout, F. N., and Lojo, M. M. (1996). Kappa-
casein gene frequencies support subdivision and historical origin of Argentine creole
cattle. Brazilian Journal of Genetics, 19: 583-586.
Golijow, C. D., Giovambattista, G., Ripoli, M. V., Dulout, F. N. and Lojo, M. M. (1999).
Genetic variability and population structure in loci related to milk production traits

109
in native Argentine creole and commercial Argentine Holstein cattle. Brazilian
Journal of Genetics, 22: 395-398.
GOP. (2010-11). Economic Survey, Economic Advisor Wing, Finance Division, Islamabad.
GOP. (2011-12). Economic Survey, Economic Advisor Wing, Finance Division, Islamabad.
Gorodetskii, S. I. and Kaledin, A. S. 1987. Nucleotide sequence analysis of cow kappa-casein
cDNA. Genetika, 23: 596-604.
Gordon, D. F., Quick, D. P., Erwin, C. R., Donelson, J. E. and Maurer, R. A. (1983). Nucleotide
sequence of the bovine growth hormone chromosomal gene. Molecular Cell
Endocrinology, 33: 81-95.
Grisart, B., Coppieters, W., Farnir, F., Karim, L., Ford, C. and Berzi, P. (2002). Positional
cloning of a QTL in dairy cattle: identification of a missense mutation in the bovine
DGAT1 gene with major effect on milk yield and composition. Genome Research,
12: 222-231.
Grochowska, R., Lunden, A., Zwierzchowski, I., Snochowski, M. and Oprzadek, J. (2001).
Association between gene polymorphism of growth hormone and carcass traits in
dairy bulls. Animal Science Papers and Reports, 72: 441-447.
Grosclaude, F. (1988). Genetic polymorphism of the principal milk proteins in cattle. Relation
with quantity, composition and cheese making suitability of milk. Journal of Dairy
Science, 74:1730-1742.
Gurcan, E. K. (2011). Association between milk protein polymorphism and milk production
traits in black and white dairy cattle in Turkey. African Journal of Biotechnology, 10:
1044-1048.
Gutierrez, A., Meade, H. M., Ditullio, P., Pollock, D., Harvey, M., Jimenez-Flores, M.,
Anderson, G. B., Murray, J. D. and Medrano, J. F. (1996). Expression of bovine
kappa-casein DNA in the mammary gland of tansgenic mice utilizing a milk protein
gene as an expression cassette. Transgenic Research, 5: 271-279.
Habib, M. Yahyaoui., Coli, A., Sanchez, A. and Folch, J. M. (2001). Genetic polymorphism of
the caprine kappa-casein gene. Journal of dairy research, 68: 209-216.
Habib, M. Yahyaoui. (2003). Genetic polymorphism of Goat. Thesis, pp: 20.
110
Haenlein, C. F. W., Gonyon, D. S., Mather, R. E. and Hines, H. C. (1987). Association of
bovine blood and milk polymorphism with lactation traits in Guernsey. Journal of
Dairy Science, 70: 2599-2609.
Hallen, E., Allmere, T., Naslund, J., Andren, A. and Lunden, A. (2007). Effect of genetic
polymorphism of milk proteins on rheology of chymosin induced milk gels.
International Dairy Journal, 17: 791–799.
Hallen, E., Wedholm, A., Andren, A. and Lunden, A. (2008). Effect of beta-casein, kappa-
casein and beta-lactoglobulin genotypes on concentration of milk protein variants.
Journal of Animal Breeding and Genetics, 125: 119-129.
Hayes, B., Nina, H., Adnoy, T., Pellerud, G., Berg, P. R. and Lien, S. (2006). Effect on
production traits of haplotypes among casein genes in Norwegian goats and evidence
for a site of preferential recombination. Genetics, 174: 455-64.
Heck, J. M. L., Schennink, A., Valenberg, H. J. F., Bovenhuis, H., Visker, M. H. P. W. and
Arendonk, J. A. M., et al. (2009). Effects of milk protein variants on protein
composition of bovine milk. Dairy Science, 92: 1192-1202.
Hediger, R., Johnson, S. E., Barendse, W., Drinkwater, R. D., Moore, S. S. and Hetzel, J.
(1990). Assignment of the growth hormone gene locus to 19q26-ter in cattle and
11q25qter in sheep by in situ hybridization. Genomics, 8(17): 1-174.
Hill, J. P., Thresher, W. C., Boland, M. J., Creamer, L. K., Anema, S. G., Manderson, G.,
Otter, D. E., Paterson, G. R., Howe, R., Burr, R. G., Motion, R. L., Windelman, A.
and Wickham, B. (1997). The polymorphism of the milk protein (beta-
lactoglobulin). In Milk composition, production and biotechnology, Edited by:
Welch RAS, et al. CAB International, Wallingford: UK, 1997: 173-2 13.
Houseknecht, K. L., Baile, C. A., Matteri, R. L. and Spurlock, M. E. (1998). The biology of
leptin: A review. Journal of Animal Science, 76: 1405-20.
Ikonen, T. L., Ojala, M. and Routtinen, O. (1999). Associations between milk protein
polymorphism and first lactation milk production traits in finish Ayrshire cows.
Journal of Dairy Science, 82:1206.
Ikonen, T. L. et al. (2000). Possibilities of genetic improvement of milk coagulation properties
of dairy cows, Academic Dissertation, University of Helsinki, Dept. of Animal
Science Publications.

111
Ishaq, R., Suleman, M., Riaz, M. N., Yousuf, M., Shah, A. and Ghafoor, A. (2012).
Prolactin gene polymorphism in Nili-Ravi buffaloes in relation to Sahiwal and
Achai cattle. International Journal of dairy Technology, 10.1111/j.1471-
0307.2012.00875.x
Jolles, P., Loucheux, L. M. H. and Henschen, A. (1978). Structural relatedness of kappa-
casein and fibrinogen y-chain. Journal of Molecular Evolution, 11: 271-277.
Karimi, K., Beigi, M. T., Mirzadeh, K., Ashayerizadeh, A., Roushanfekr, H. and Fayyazi, J.
(2009). Polymorphism of the beta-lactoglobulin gene and its association with milk
production traits in Iranian Najdi cattle. International Journal of Biotechnology,
7(2): 82-85.
Kastonina, O. V., Khripiakov, E.N., Strikozov, N. I. and Zinoveva, N. A. (2004). Effects of
different genotypes of kappa-casein, beta-lactogolubin and alpha-lactoalbumin on
technological properties of milk. 4th conference problems biotechnology in farm
animal. Dobrovitsy. Russia. 24-25 Nov. 54-60.
Kaupe, B., Thaller, G., Kramer, W., Winter, A., Kaupe, B., Erhardt, G. and Fries, R. (2003).
Effects of DGAT1 variants on milk production traits in German cattle breeds.
Journal of Animal Science, 81: 1911-1918.
Kemenes, P. A., Regitano, L. C. A., Rosa, A. J. M., Packer, I. U., Ralook, A. G., Figueirede, L.
A., Silva, N. A., Antonia, M., Etchegaray, L. and Coutinho, L. L. (1999). Kappa-
casein, beta-lactoglobulin and growth hormone allele frequencies and genetic
distances in Nelore, Gyr, Guzera, Caracu, Charolais, Canchin, and Santa Gertrudis
cattle. Genetics & Molecular Biology, 22(4): 539-41.
Khan, S. M., Zia, U. R., Muqqarab, A. K. and Sohail, A. (2008). Genetic resources and
diversity in Pakistani cattle. Pakistan Vetereinary Journal, 28 (2): 95-102.
Kiplagat, S. K., Agaba, M., Kosgey, I. S., Okeyo, M., Indetie, D., Hanotte, O. and Limo, M.
K. (2010). Genetic polymorphism of kappa-casein gene in indigenous Eastern
African goat population. International Journal of Genetics & Molecular Biology,
2: 001-005.
Konovalova, E. N., Seltcov, V. I. and Zinoveva, N. A. (2004). Polymorphism in kappa-casein
gene and its effects on production traits in Simmental cow breeds. 4th conference
problems biotechnology in farm animal. Dobrovitsy Russia, 24-25. Nov. 49-54.
112
Kovacs, K., Jozsef, V. C., Attila, Z., Istvan, G. and Laszlo, F. (2006). Association between the
AluI polymorphism of growth hormone gene and production traits in a Hungraian
Holstein Friesian bull dam population. Arch. Tierz, 49: 236-249.
Kucerova, J., Lund, M. S., Sorensen, P., Sahana, G., Guldbrandtsen, B., and Nielsen, V. H.,
et al. (2006). Multitrait quantitative trait loci mapping for milk production traits in
Danish Holstein cattle. Journal of Dairy Science, 89: 2245-2256.
Kuhn, Ch., Leveziel, H., Renard, G., Goldhammer, T., Schwerin, M. and Williams. (2005).
Genetic markers for beef quality (Review). In: Hocquette, J. F. and Gigli, S. (Ed),
Indicators of milk and beef quality. 23-32. EAAP publication. Wageningen
Academic Publishers.
Lagziel, A. and Soller, M. (1999). DNA sequence of SSCP haplotypes at the bovine growth
hormone (bGH) gene. Animal Genetics, 30: 362-365.
Lan, X. Y., Pan, C. Y., Chen, H., Zhao, M., Li, l. Y., Yu, J., Zhang, C. L., Lei, C. Z., Hua, L. S.
and Yang, X. B. (2007). The novel SNPs of the IGFBP3 gene and their association
with litter size and weight traits in goat. Archiv für Tierzucht- Dummerstorf, 50: 223-
4.
Lara, M. A. C., Gama, L. T., Bufarah, G., Sereno, S. P., Celegato, E. M. L and Abreu, U. P.
(2002). Genetic polymorphism at the kappa-casein locus in Pantaneiro cattle Arch.
Zootec. 52: 99-105.
Lee, B. R., Crookerl, B. A., Hansen, B. and Ester-Jones, H. C. H. (1994). Polymorphism in
the third intron of somatotropin gene and its association with selection for milk
yield in Holstein cows. Journal of Animal Science, 72: 31-36.
Leveziel, H., Rodellar, C., Leroux, C., Pepin, L., Grohs, C., Vaiman, D., Mahe, M. F., Martin,
P. and Grosclaude, F. (1994). A microsatellite within the bovine casein gene reveals
a polymorphism correlating strongly with polymorphisms previously described at
the protein as well as the DNA level. Animal Genetics, 25: 223-228.
Li, Q., Peterson, R. K., Fang, X. and Stamatoyannopoulos, G. (2002). Locus control regions.
Blood, 100: 3077-3086.
Lien, S. and Rogne. (1993). Bovine casein haplotypes number, frequencies and applicability as
genetic marker. Animal Genetics, 24: 373-376.
113
Lindersson, M., Lunden, A. and Andersonn, L. (1995). Genotyping of bovine milk protein using
allele discrimination by primer length and automated DNA sizing technology.
Animal Genetics, 26: 67-72.
Lin, C. Y., Sabour, M. P. and Lee, A. J. (1992). Direct typing to milk proteins as an aid for
genetic improvement of dairy bulls and cows: A review. Animal Breeding,
Abstracts, 60: 1-10.
Lioupis A, Wallis, O. C. and Wallis, M. (1997). Cloning and characterization of the gene
encoding red deer (Cervus elaphus) growth hormone: implications for the molecular
evolution of growth hormone in artiodactyls. Journal of Molecular Endocrinology,
19: 259–266.
Lucy, M. C., Hauser, S. D., Eppard, P. J., Krivi, G. G. and Collier, R. J. (1991). Genetic
polymorphism within bovine somatotropin gene detected by polymerase chain
reaction and endonuclease digestion. Journal of Dairy Science, 74 (1): 284.
Lucy, M. C., Hauser, S. D., Eppard, P. J., Krivi, G. G., Clark, J. H., Buman, D. E. and Collier,
R. J. (1993). Genotypes of somatotropin in cattle: gene frequencies in major dairy
breeds and associated with milk production. Domestic Animal Endocrinology, 10:
325-333.
Lucy, M. C., Johnsson, G. S., Shibuya, H., Boyd, C. K., Herring, W. O. and Werin, M. (1998).
Rapid communication: polymorphic (GT) microsatellite in the bovine somatotropin
receptor gene promoter. Journal of Animal Science, 76: 2209-10.
Maj, A., Korczak, M., Bagnicka, E., Zwierzchowski, L. and Pierzchala, M. (2007). A TG-repeat
polymorphism in the 5‟non-coding region of the goat growth hormone receptor gene
and search for its association with milk production traits. Small Ruminant Research,
67: 279-84.
Marziali, A. S. and Ng-Kwai-Hang, K. F. (1986). Effects of milk composition and genetic
polymorphism on cheese composition. Journal of Dairy Science, 69: 2533-2542.
Masoudi, A. K., Omrani, H. and Torkamanzehi, A. (2002). Study of growth hormone gene
polymorphism in Iranian Bos indicus cattle by PCR-RFLP techniques. Proceeding of
first seminar on genetics and breeding applied to Livestock, Poultry and Aquatics.
Iran, Tehran, pp: 141-145.
Matyukov, V. S. (1983). The value of beta-casein polymorphism for selection in cattle. Selsk.
114
Khoz. Biol. 18: 73-78.
Mclean, D. M. (1987). Influence of milk protein genetic genotypes on milk composition, yield
and cheese making properties. Animal Genetics, 100-1002.
Medrano, J. F. and Aguilar-Cordova, G. (1990). Polymerase chain reaction amplification of
bovine beta-lactoglobulin genomic sequences and identification of genotypes by
RFLP analysis. Animal Biotechnology, 1:73-74.
Medrano, J. F. and Aguilar-Cordova, E. (1990a). Genotyping of bovine kappa-casein loci
following DNA sequence amplification. Biotechnology, 8: 144-146.
Missohou, A., Talaki, E. and Laminon, I. M. (2006). Diversity and genetic relationships among
seven West African goat breeds. Asian Austalian Journal of Animals, 19: 1245-51.
Mitra, A., Schlee, P., Balakrishan, C. R. and Pirchner, F. (1995). Polymorphism at growth
hormone and prolactin loci in Indian cattle and buffalo. Journal of Animal Breeding
and Genetics, 112: 71-74.
Mitra, A., Schlee, P., Krause, I., Blusch, J., Werner, T., Bala, K. C. R. and Pirchner, F. (1998).
Kappa-casein polymorphism in the Indian dairy cattle and buffalo: A new genetic
genotype in buffalo. Animal Biotechnology, 9 (2): 81-7.
Moioli, B., Andrea, D. M. and Pilla, F. (2007). Candidate genes affecting sheep and goat milk
quality. Small Ruminant Research, 68: 179–192.
Molina, L. H., Kramm, J., Brito, C., Carrillo, B., Pinto, M. and Ferrando, A. (2006). Protein
composition of milk from Holstein-Friesian dairy cows and its relationship with
the genetic variants A and B of κ-casein and beta-lactoglobulin (Part-I). International
Journal of Dairy Technology, 59: 183-187.
Monaco, H. L., Zanotti, G., Spadon, P., Bolognesi, M., Sawyer, L. and Eliopoulos, E. E. (1987).
Crystal structure of the trigonal form of bovine beta-lactoglobulin and of its complex
with retinol at 2.5 A resolution. Journal of Molecular Biology, 197: 695-706.
Mullis, K. B. and Faloona, F. A. (1987). Specific synthesis of DNA in vitro via a polymerase -
catalyzed reaction. Methods in Enzymology, 155: 335-350.
Neelin, J. M. (1964). Genotypes of x-casein revealed by improved starch gel electrophoresis.
Journal of Dairy Science, 47: 506-509.
115
Ng-Kwai-Hang, K. F., Hayes, J. E., Moxley, J. D. and Monardes, H. G. (1984). Association
of genetic genotypes of casein and milk serum protein with milk fat and protein
production in dairy cattle. Journal of Dairy Science, 67: 835-40.
Ng-Kwai-Hang, K. F., Hayes, J. F., Moxley, J. D. and Monardes, H. G. (1986). Relationship
between milk protein polymorphism and major milk constituents in Holstein-
Friesian cows. Journal of Dairy Science, 69: 22-26.
Ng-Kwai-Hang, K. F., Monardes, H. G. and Hayes, J. F. (1990). Association between genetic
polymorphism of milk proteins and production traits during three lactation. Journal
of Dairy Science, 73: 3414-3420.
Ng-Kwai Hang, K. F. and Grosclaude, F. (1992). Genetic polymorphism of milk proteins. In:
Advanced Dairy Chemistry. Vol. 1. Proteins. (Ed. P.F. Fox). London, Elsevier
Applied Science, pp. 405-455.
Ng-Kwai-Hang, K. F. (1998). Genetic polymorphism of milk proteins: relationship with
production traits, milk composition and technological properties. Canadian Journal
of Animal Science, 31-147.
Ohta, T. (1993). Pattern of nucleotide substitution in growth hormone-prolactin gene family: a
paradigm for evolution by gene duplication. Genetics, 134 (4); 1271-6.
Otaviano, A. R., Tonhati, H., Desiderio, S. J. A. and Munoz, M. F. C. (2005). Kappa-casein
gene study with molecular markers in female buffaloes. Genetics and Molecular
biology, 28: 2: 237-241.
Othman, O. E. (2005). The identification of kappa-casein genotyping in Egyptian river buffalo
using PCR-RFLP (AbGH).
Othman, O. E. and Ahmed, S. (2007). Genotyping of the caprine kappa-casein variant in
Egyptian breeds. Journal of Dairy Science, 2: 90-4.
Oner, Y. and Elmaci, C. (2006). Milk protein polymorphisms in Holstein cattle. International
Journal of Dairy Technology, 59: 180-182.
Passey, R. G. and Mackinlay, A. G. (1995). Characterization of a second, apparently inactive
copy of the bovine beta-lactoglobulin gene. European Journal of Biochemistry, 233:
736-743.
Patel, R. K., Chauhan, J. B., Singh, K. M. and Soni, K. J. (2007). Genotyping and allelic
frequencies of -CN and β-LG in Indian River buffalo bulls. Buffalo Bulletin, 26. 3.

116
Pedersen, J. (1991). Selection to increase frequency of kappa-casein variant B in dairy cattle.
Journal of Animal Breeding and Genetics, 108: 434-445.
Pennington, S. (2000). Introduction to Genetics, pp: 188. Massachusetts: Blackwel Science.
Pena, N. P., Sanchez, A., Coll, A. and Folch, J. M. (1999). Isolation, sequencing and relative
quantitation by fluorescent-ratio PCR of feline beta-lactoglobulin I, II, and III
cDNAs. Mammalian Genome, 10: 560-564.
Pinder, S. J., Perry, B. N., Skidmore, C. J. and Sawa, D. (1991). Analysis of polymorphism in
the bovine casein genes by use of the polymerase chain reaction. Animal Genetics,
22: 11-20.
Pipalia, D. L., Ladani, D. D., Brahmkshtri, B. P., Rank, D. N., Joshi, C. G., Vataliya, P. H. and
Solanki, J. V. (2001). Kappa-casein genotyping of Indian buffalo breed using PCR-
RFLP. Buffalo Journal, 2: 195-202.
Preaux, G., Braunitzer, G., Schrank, B. and Strangl, A. (1979). The amino acid sequence of goat
beta-lactoglobulin. Hoppe-Seyler’s Physiology and Chemistry, 360: 1595-1604.
Prinzenberg, E. M., Hiendleder, S., Ikonen, T. and Erhardt, G. (1996). Molecular genetic
characterization of new bovine genetic kappa-casein alleles F and G and genotyping
by PCR-RFLP. Animal Genetics, 27: 347-349.
Prinzenberg, E. M., Krause, I. and Erhardt, G. (1999). SSCP analysis at the bovine CSN3 locus
discriminates six alleles corresponding to known protein genotypes and three new
DNA polymorphisms. Animal Biotechnology, 10: 49-62.
Prinzenberg, E. M., Jianlin, H. and Erhardt, G. (2008). Genetic variation in the kappa-casein
gene of Chinese Yak (Bos grunniens) and phylogenetic analysis of CSN3 sequence
in the genus Bos. Journal of Dairy Science, 91 (3): 1198-1203.
Rachagani, S., Ishwar, D. G., Neelam, G. and Gupta, S. C. (2006). Genotyping of beta-
lactoglobulin gene by PCR-RFLP in Sahiwal and Tharparkar cattle breeds. BMC
Genetics, 7: 31.
Rafy., G. A. and Darwish, S. F. (2008). A PCR-RFLP assay to detect genetic genotypes of
kappa-casein gene in cattle and buffalo. Arabian Journal of Biotechnology, 11 (1):
11-18.
117
Rampilli, M., Caroli, A., Bolla, P. and Pirlo, G. (1988). Relationship of milk protein genotypes
with casein composition and rennet ability of milk during lactation. Science
Technical Letter, 39: 262-279.
Recio, I., Molina, E., Ramos, M. and Frutos, M. (1995). Quantitative analysis of major whey
proteins by capillary electrophoresis using uncoated capillaries. Electrophoresis, 16:
654-658.
Reinecke, R., Barnes, M., Akers, R. and Pearson, R. (1993). Effect of selection for milk
yield on lactation performance and plasma growth hormone, insulin and IGF-I
in first lactation of Holstein cows. Journal of Dairy Science, 76: 286.
Reis, C., Navas, D., Pereira, M. and Cravador, A. (2001). Growth hormone AluI polymorphism
analysis in eight Portuguese bovine breeds. Archives of Zootec. 50: 41-48.
Riaz, M. N., Malik, N. A., Nasreen, F. and Qureshi, J. A. (2008). Molecular marker assisted
study of kappa-casein gene in Nili-Ravi (Buffalo) breed of Pakistan. Pakistan
Vetrinary Journal, 28:103-106.
Riaz, M. N., Tahir, M., Malik, N, A., Nasreen, F., Sadaf, S. and Qureshi, J. A. (2009).
Molecular analysis of bovine growth hormone gene polymorphism in Nili-Ravi
buffalo of Pakistan. Pakistan Journal of Zoology, Suppl. ser. no.9, pp. 47-54.
Riaz, M. N., Malik, N. A., Nasreen, F., Qureshi, J. A. and Khan, S. U. (2011). Genetic
variability in the Kappa-casein gene in Sahiwal, Cholistani and Red Sindhi cattle
breeds. International Journal of dairy Technology, 10.1111/j.1471-0307.2011.00755.
Rijnkels, M., Kooiman, P. M., Boer, H. A. and Pieper, F. R. (1997). Organization of the bovine
casein gene locus. Mammalian Genome, 8: 148-152.
Rijnkels, M. (2002). Multispecies comparison of the casein gene loci and evolution of casein
gene family. Journal of Mammary Gland Biology, 7: 327-45.
Robitaille, G., Britten, M., Morisset., J. and Petitclerc, D. (2002). Quantitative analysis of
alpha-lactoglobulin A and B genetic genotypes in milk of cows beta-lactoglobulin A
B through lactation. Journal of Dairy Research, 69:651-654.
Rohallah, A., Mohammadreza, M. A. and Sahin, M. B. (2007). Kappa-casein gene study in
Iranian Sistani cattle breed (Bos indicus) using PCR-RFLP. Pakistan Journal of
Biological Sciences, 10: 4291-4294.
118
Romonasova, E. G. (1999). Effect of genotypes and environment on milk traits and quality
technology of milk Swiss breeds. Ph.D. Thesis. Dobrovitsy, Russia.
Sabour, M. P. and Lin, C. Y. (1996). Association of bGH genetic genotypes with milk
production traits in Holstein cattle. Animal Genetics, 27 (Suppl.2.): 105.
Sabour, M. P., Lin, C. Y. and Smith, C. (1997). Association of genetic genotypes of bovine
growth hormone with milk production traits in Holstein cattle. Journal of Animal
Breeding and Genetics, 114: 435-442.
Sambrook, J., Fritsch, E. F. and Maniatis, T. (1989). Molecular Cloning: A Laboratory Manual,
2nd
ed. Vol.3, Cold Spring, Harbour Laboratory Press, New York.
Shariflou, M. R., Moran, C. and Nicholas, F. W. (1998). Candidate genes for production traits
in dairy cattle. Proceedings of the 6th World Conf. Genet. Appl. Livestock
Production, 25: 43.
Shariflou, M. R., Moran, C. and Nicholas, F. W. (2000). Association of the Leu (127) genotype
of the growth hormone gene with increased yield of milk, fat and protein in
Australian Holstein-Friesian. Australian Journal of Agriculture Research, 51: 515-
522.
Schlee, P., Graml, R., Rottmann, O. and Pirchner, F. (1994a). Influence of growth hormone
genotypes on breeding values of Simmental bulls. Journal of Animal Breeding and
Genetics, 111: 253-256.
Schlee, P., Graml, R., Schallenberger, E., Schams, D., Rottmann, O., Olbrichbludau, A. and
Pirchner, F. (1994b). Growth hormone and insulin-growth factor I concentrations in
bulls of various growth hormone genotypes. Theoretical and Applied Genetics, 88:
497-500.
Shuster, D. E., Kehrli, M. E., Ackermann, M. R. and Gilbert, R. O. (1992). Identification and
prevalence of a genetic defect that causes BLAD in Holstein cattle. Proceedings of
the National Academy of Sciences, USA, 89: 9225-9229.
Shetty, S., Patel, R. K., Soni, K. J., Singh, K. M. and Chauhan, J. B. (2006). Allelic frequency
of κ-casein and β-lactoglobulin in Jersey cattle. Indian Journal of Veterinary
Research, 15: 15-21.
Singh, S., Pushpendra, K. and Bhattacharya, T. K. (2005). DNA polymorphism of -CN and β-
CN genes and its association with milk production and quality traits in buffalo (B.

119
bubalis). P. 200. In Proceeding of National Symposium on domestic animals
diversity: status, opportunities and challenges, NBAGR, Karnal.
Sirotkin, A. V., Chrenek, P., Makarevich, A. V., Huba, J. and Bulla, J. (2000). Interrelation-
ships between breed, growth hormone genotype, plasma IGF-1 level and meat
performance in bulls of different ages. Archives of Animal Breeding, 43: 591-596.
Sitkowska, B., Neja, W. and Wisniewska, E. (2008). Relations between kappa-casein polymor-
phism (CSN3) and milk performance traits in heifer cows. Journal of Central
European Agriculture, 9: 641-644.
Sorensen, P., Grochowskat, R., Holen, L., Henryon, M. and Lovendhl, P. (2002). Polymorphism
in bovine GH gene effects endocrine release in dairy calves. Journal of Dairy
Science, 85: 1887-1893.
Soria, L. A., Iglesias, G. M., Huguet, M. J. and Mirande, S. L. (2003). A PCR-RFLP test to
detect allelic variants of the bovine kappa-casein gene. Animal Biotechnology,
14(1): 1-5.
Southern, E. M. (1975). Detection of specific sequences among DNA fragments separated by
gel electrophoresis. Journal of Molecular Biology, 98: 503-517.
Stancekov, K., Vasicek, D., Peskovicov, D., Bull, J. and Kubek, A. (1999). Effect of genetic
variability of the porcine pituitary-specific transcription factor (PIT-1) on carcass
traits in pigs. Animal Genetics, 30: 313-5.
Strzalkowska, N., Krzyzewski, J., Zwierzchowski, L. and Ryniewicz, Z. (2002). Effects of
kappa-casein and beta-lactoglobulin loci polymorphism, cow‟s age, stage of
lactation and somatic cell count on daily milk yield and milk composition in polish
black and white cattle. Animal Science Paper and Research, 20: 2: 1-35.
Tambasco, M. D. (1998). Detecao de polimorfismo dos genes de kappa-caseine, Beta-
lactoglobµlina animais da raca Jersy. Monogrfia: Universidade Federal de Sao
Carlos, SP.
Tee, M. K., Moran, C. and Nicholas, F. W. (1992). Temperature gradient gel electrophoresis:
detection of a single base substitution in the cattle (β-lactoglobulin) gene. Animal
Genetics, 23: 431-435.
Thompson, M. P., Kiddy, C.A., Pepper, L. and Zittle, C. A. (1962). Variation in the as1-casein
fraction of individual cow's milk. Nature, 195: 1001-1002.
120
Threadgill, D. W. and Womack, J. E. (1990). Genomic analysis of the major bovine milk
protein genes. Nucleic Acids Research, 18: 6935-6942.
Tsiaras, A. M., Bargouli, G. G., Banos, G. and Boscos, C. M. (2005). Effect of kappa-casein
and β-lactoglobulin loci on milk production traits and reproductive performance
of Holstein cows. Journal of Dairy Science, 88: 327-334.
Unanian, M. M., Denise, S. K. and Zhang, H. M. (1994). Rapid communication: Polymerase
chain reaction-restriction fragment length polymorphism in the bovine growth
hormone gene. Journal of Animal Science, 72: 2203.
Van den berg, G., Escher, J. T. M., De Koning, P. J. and Bovenhuis, M. (1992). Genetic
polymorphism of kappa-casein and beta-lactoglobulin in relation to milk
composition and processing properties. Netherlands Milk Dairy Journal, 46: 145-68.
Van Eenennaam, A. L. and Medrano, J. F. (1991). Differences in allelic protein expression in
the milk of heterozygous kappa-casein cows. Journal of Dairy Science, 74: 1491-
1496.
Viana, J. L., Fernández, A., Frenadez, M., Iglesias, A., Becerra, J., Alonso, M, M., Feijóo M.,
Rivero, C. J. and Carril, J. (2000). Identificación de las genotypees genéticas de tres
Proteínas lácteas en sementales de raza Rubia Gallega mediante nálisis des ADN. II
Congresso Ibérico sobre Recursos Genéticos Animais. Santarém, Portugal.
Vukasinovic, N., Denise, S. K. and Freeman, A. E. (1999). Association of growth hormone loci
with milk yield traits in Holstein bulls. Journal of Dairy Science, 82: 788-794.
Wallis, M. (2001). Episodic evolution of protein hormones in mammals. Journal of molecular
evolution, 53 (1) 10-8.
Whitley, N. C., Walker, E. L., Harley, S. A., Keisler, D. H. and Jackson, D. J. (2005).
Correlation between blood and milk serum leptin in goats and growth of their
offspring. Journal of Animal Science, 83: 1854-59.
Wood, D. C., Salsgiver, W. J., Kasser, T. R., Lange, G. W., Rowald, E., Violand, B. N.,
Johnson, A., Leimgruber, R. M., Parr, G. R., Siegel, N. R., Kimack, N. M., Smith,
C. E., Zobel, J. F., Ganguli, S. M., Garbow, J. R., Bild, G. and Krivi, G. G. (1989).
Purification and characterization of pituitary bovine somatotropin. Journal of Biology
and Chemistry, 264: 14741-14747.
Woychik, J. H. (1964). Polymorphism in x-casein cow's milk. Biochemical and Biophysical

121
Research Communications, 16: 267-271.
Woychik, R. P., Camper, S. A., Lyons, R. H., Horowitz, S., Goodwin, E. C. and Rottman,
F. M. (1982). Cloning and nucleotide sequence of the bovine growth hormone
gene. Nucleic Acids Research, 10: 7197-7210.
Yao, J., Samuel, E. A., Zadworny, D., Hayes, J. F. and Kuhnlein, U. (1996). Sequence variation
in the bovine growth hormone gene characterized by single stranded conformation
polymorphism (SSCP) analysis and their association with milk production traits in
Holsteins. Genetics, 144: 1809-1816.
Yasemin, O. and Cengiz, E. (2006). Milk protein polymorphism in Holstein cattle. International
Journal of Dairy Technology, 59(3): 180-182.
Yu, L. M., Jiang, M. L., Qiang, S. G., Jie, P. Q., Wei, S. and Lian, W. G. (2004). Polymorphism
analysis of goat growth hormone gene in the 5‟ regulatory sequence. Hereditas, 6:
831-5.
Zhang, H. M., Brown, D. R., Denise, S. K. and Ax, R. I. (1993). Rapid communication:
polymerase chain reaction-restriction fragment length polymorphism analysis of the
bovine somatotropin gene. Journal of Animal Science, 71: 2276.
Zwierzchowski, L., Oprzadek, J., Dymnicki, E. and Dzierzbicki, P. (2001). An association of
growth hormone, kappa-casein, beta-lactoglobulin, leptin and Pit-1 loci polymorphism
with growth rate and carcass traits in beef cattle. Animal Science Papers and Reports,
19: 65-77.
Zwierzchowski, L., Lukaszewicz, M., Dymnicki, E. and Oprzadek, J. (2002). Polymorphism of
growth hormone, κ-casein and β-lactoglobulin genes in growing Friesian cattle. Animal
Science Papers and Reports, 16: 61-68.

122
APPENDICES
APPENDIX-I
Ethidium bromide (10 mg/ml)
Add 1 gm of ethidium bromide to 100 ml of water. Stir on
magnetic stirrer for several hours to ensure that the dye is
dissolved. Wrap the container in aluminum foil or transfer the
solution to dark bottle and store at room temperature.
Ethidium Bromide is a powerful mutagen and is moderately toxic.
Gloves should be worn when working with solutions that contain
this dye and a mask should be worn when weighing it out. After
use, these solutions should be decontaminated.
6 X Loading dye
Dissolve 4 gm sucrose and 2.5 mg of bromophenol blue in a 6 ml
solution of 10 mM Tris HCl, pH 8.0 and 1mM EDTA (TE
buffer). Once dissolved bring up to volume of 10 ml with TE
buffer. Store at room temperature. (Promega p.no.400)
Saturated phenol chloroform
Mix equal parts of TE buffer and phenol and allowed the phases
to separate. Then mix 1 part of the lower phenol phase with 1 part
of chloroform: isoamylalcohol (24:1).
Proteinase K
20 mg / ml in D. H2O
Aliquot in 1.5 ml eppendorf tube.
Store at -20 ºC.
123
APPENDIX-II
RBC’s Lysis buffer
155 mM NH4Cl, 10 mM KHCO3, 1 mM EDTA (pH 7.4)
NH4Cl 8.29 g
KHCO3 0.84 g
EDTA 2 ml from 0.5 M stock
Make up volume to 1 lit with D. H2O
Store at 4˚C
5 M NaCl
Add 292.1 g NaCl in 800 ml D. H2O.
Adjust the vol to 1liter with D. H2O.
Use only the clear solution from stock, do not crystals from
the bottom. Store at room temperature or 4ºC.
Stir on magnetic stirrer. Adjust pH to 8.0 with NaOH (20g).
Store in a dark bottle at room temperature
Nuclei Lysis buffer
Tris 10 ml from 1 M stock
NaCl 80 ml from 5 M stock
EDTA 4 ml from 0.5 M stock
Make up volume to 1 liter with D. H2O
Store at 4ºC.
TE Buffer
20 mM Tris (pH 8.0), 1 mM EDTA
10 ml Tris from 1 M stock
1ml EDTA from 0.5 M stock
Make up volume to 500 ml with D.H2O
Store at 4ºC.
3M Sodium acetate (pH 4.0)
408.1 g Sodium Acetate 3 H2O in 800 ml D. H2O
Adjust pH to 4.0 with glacial acetic acid.

124
1M Sodium citrate
Dissolve 36.76 g tri-sodium citrate in 100 ml D.H2O
Adjust pH to 4.0 with glacial acetic acid.
Adjust vol. to 125 ml with D.H2O
Store at room temperature.
NaCl/EDTA (For tissue lysis for DNA/RNA extraction)
100 mM NaCl, 125 mM EDTA
NaCl 10 ml from 5 M stock
EDTA 125 ml from 0.5 M stock
Adjust vol. to 500 ml with D. H2O
Store at room temperature
Phenol: chloroform: isoamyl alcohol
25:24:1
Store at 4ºC or room temperature in a dark bottle
Chloroform: isoamyl
24:1
10% SDS (pH 7.2)
100 g SDS in 900 ml D. H2O.
Adjust pH by few drops of HCl / NaOH.
Adjust the volume to 1liter with D. H2O.
(Heat to dissolve if crystallized).
1 M Tris
Dissolve 121.1g of Tris base in 800 ml of D. H2O.
Adjust pH to desired value by adding conc. HCl
PH HCl
7.4 70 ml
7.6 60 ml
8.0 42 ml
125
Allow the solution to cool to room temperature. Before making final adjustments of pH. Adjust
the volume of solution to 1 liter with D. H2O. Store at room temperature or 4ºC.
0.5 M EDTA (pH 8.0)
Add 186.1 g disodium EDTA. 2 H2O to 800 ml H2O.
Stir on magnetic stirrer.
Adjust pH to 8.0 with NaOH (20g).
Store in a dark bottle at room temperature.
Preparation of 1 liter of 10 X TBE buffer (0.89 M)
107.7 g Tris base
55 g Boric acid
7.44 g EDTA
Add water to 900 ml.
Dissolve with a magnetic stirrer. Remove the magnetic stirrer and
make up volume to 1 liter. Filter the solution through 0.45 m filter
(Millipore HV). Store the stock solution at 4˚C.
50X Tris-acetate EDTA buffer (TAE)
1) Tris-base 242 g
2) Glacial acetic acid 57.1 ml
3) 0.5 M EDTA (pH 8.0) 100 ml
Make up the final volume with distilled water to 1000 ml

126
APPENDIX-III
Mini-prep solutions
Solution I (suspension buffer)
Tris (pH 7.4-7.6) 50 mM
EDTA 1.0 mM
RNase 100 μg / ml
Solution II (denaturation soln.)
NaOH 0.20 N
SDS 1.0 %
Solution III (neutralization soln.)
Potassium acetate 3 M
Glacial acetic acid 11.5 ml / 100ml
(pH 4.8-5.0)
LB (Luria-bertani) medium
Tryptone 1.0 %
Yeast extract 0.5 %
NaCl 0.5 %
Agar 1.5 %
Shake to dissolve solutes. Adjust pH 6.2 - 7.2 and adjust volume
of solution to I liter with deionized water. Sterilized by
autoclaving for 20 minutes at 15 Ib/sq on liquid cycle (Sambrook
et al., 1989). The solution (25-30 ml) was than poured in petri
plates.
LB (Luria-bertani) broth
Tryptone 1.0 %
Yeast extract 0.5 %
NaCl 0.5 %
Adjust pH 6.2 - 7.2 and autoclave.
127
Preparation of competent cells of E.coli
1- A single colony from a freshly grown plate of E.coli is picked and transferred into 50 ml
LB medium in 250 ml flask and incubate at 37 0C overnight with vigorous shaking.
2- 2 ml of the overnight culture is taken and diluted to 250 ml in 1 liter flask and shaken
vigorously at 37 oC until OD of 0.5-1.0 (10
10 cells / ml).
3- Culture was cooled by placing on ice for 30 minutes. The cells are transferred
aseptically to sterile disposable 50 ml propylene tubes
4- The cells are pelleted by centrifugation at 4000 rpm at 4 oC for 5 minutes and resuspend
in 5 ml of 0.1 M MgCl2.
5- The cells are pelleted by centrifugation at 4000 rpm at 4 o
C for 5 minutes and resuspend
in 5 ml of 0.1 M CaCl2 and kept on ice for 30 min.
6- The cells are again pelleted by centrifugation at 4000 rpm for 5 minutes and suspend
finally in appropriate amount of 0.1 M CaCl2 and sterile cold 100% glycerol.
7- The cells are stored in aliquotes of 100 μl or 200 μl at -70o C.
Transformation of competent cells
1. Thaw on ice a 200µl aliquot of B10 strain of E.coli competent cells in an Eppendorf
tube.
2. Add six micro liters of the ligated DNA.
3. Incubate the tubes on ice for 30 minutes.
4. Heat the tubes for exactly 120 seconds at 42 o
C.
5. Place the tubes on ice for two minutes.
6. Add 600 µl of LB medium to the tubes and shake gently at 37o C for one hour.
7. Spread 200 µl of each transformant on LB agar plates (Appendix-I) supplemented with
100µl / ml ampicillin, 40 µg/ ml X-Gal and 50 µg/ ml IPTG.
8. Allow the plates to sit at room temperature for few hours.
9. Invert the plates and incubate at 37oC for 12-16 hours.
In all transformation experiments, negative and positive controls were also included to check
the background colonies if any.
128
Transformants / selection of transformants
The ligated mixture was transformed into prepared competent B-10 strain of E-coli. In this case,
LB medium contained ampicillin (100 µg/ml). Selection of transformants was made on
ampicillin LB agar plates.
Plasmid DNA isolation
Following protocol was used for the isolation of plasmid DNA from E.coli.
1) A single E.coli colony was cultured in 3-5 ml liquid L.B medium containing 100 μg
/ ml ampicillin and grown overnight at 37oC.
2) The E.coli culture was centrifuged in 1.5 ml Eppendorf tube at 10,000 rpm for 5
minutes.
3) The supernatant was discarded and the pellet was allowed to dry for 2 minutes.
4) 100 μl solution-I (see mini-prep solutions) was added to Eppendorf tube and the
pellet was suspended in the solution with the help of vortex.
5) 150 μl solution-II (see mini-prep solutions) was added to Eppendrof tube and mixed
well by inverting gently and allowed to stand for 5 minutes at chilled ice.
6) 200 μl of solution-III (see mini-prep solutions) was added to Eppendorf tube, mixed
well and centrifuged at 14000 rpm for 5 minutes.
7) The supernatant was taken in fresh eppendorf tube and two volume of 100 % ethanol
were added.
8) Eppendorf was kept at -40o
C for 20 minutes and centrifuged at 14000 rpm for 10
minutes.
9) The supernatant was discarded and the pellet was washed with 70% ethanol.
10) After centrifugation supernatant was discarded and pellet was vacuum dried.
11) 20 μl of sterile distilled water was added to the pellet to dissolve DNA and was
stored at -40o C.

129
The plasmid concentration and size were detected by 1% agarose gel electrophoresis using
stranded DNA markers.
APPENDIX-IV
Ligation of bGH DNA fragment
The purified DNA fragments of bGH were ligated to the plasmid (PTZ57R/T) vector (Cat#
K1214, MBI, Fermentas).
The following components were added to a 1.5 ml micro-centrifuge tubes:
DNA 6 µl
10X Ligation Buffer 2 µl
PTZ57R/T 3 µl
T4 DNA Ligase (Cat# EL0011 MBI, Fermentas) 1 µl
PEG 2 µl
dddH2O 6 µl
Total Volume 20 µl
Ligation of κ-CN DNA fragment
The purified DNA fragments of κ-CN were ligated to the PTZ57R/T vector.
The following components were added to a 1.5 ml micro-centrifuge tubes:
10X Ligation Buffer 2 µl
DNA 6 µl
PEG 2 µl
PTZ57R/T 2 µl
T4 DNA Ligase 1 µl
dddH2O 7 µl
Total Volume 20 µl
130
Ligation of β-LG DNA fragment
The purified DNA fragments of β-LG gene were ligated to the PTZ57R/T vector.
The following components were added to a 1.5 ml micro-centrifuge tubes:
10X Ligation Buffer 2 µl
DNA 5 µl
PTZ57R/T 3 µl
T4 DNA Ligase 1 µl
PEG 2 µl
dddH2O 7 µl
Total Volume 20 µl
The mixtures were incubated at 16°C overnight. Control reactions was also set up in which the
insert is omitted to check for the non-recombinant background.
Restriction analysis of cloned κ-CN DNA fragments
Nine micro liters of the cloned DNA in a TA plasmid vector was digested with 5-10 units of
restriction enzymes EcoR1 and BamHI (MBI, Fermentas) and were placed at 370
C for 8 hrs.
The total reaction volume (20l) contain following reagents:
Cloned DNA 9.0 l
EcoR1 (Cat # ER0271, MBI, Fermentas) 0.5 l
BamH1 (Cat # ER0051, MBI, Fermentas) 1.0 l
Rnase 1.0 l
Buffer (Yellow 10X) 4.0 l
Double distilled demonized water 4.5 l
Total 20 l

131
Restriction analysis of cloned β-LG DNA fragments
Eight micro liters of the cloned DNA in a TA plasmid vector was digested with 5-10 units of
restriction enzymes EcoR1 and Hind III (MBI, Fermentas) and were placed at 370
C for 8 hrs.
The total reaction volume (20l) contain following reagents:
Cloned DNA 8.0 l
EcoRI 0.5l
BamH1 0.5 l
Rnase 1.0 l
Buffer (EcoR1) 4.0 l
Double distilled demonized water 6.0 l
Total 20 l
132
APPENDIX-V
Purification of DNA from agarose gel
The restricted DNA product was separated by gel electrophoresis in a TBE agarose gel. The
desired DNA bands were excised using a clean razor blade and added to a 1.5 ml centrifuge
tube. The DNA fragment was purified using a Wizard PCR preps DNA purification kit
provided by Promega, Inc. (USA).
Rapid gel extraction protocol
Perform all centrifugations at room temperature.
Before beginning, preheat an aliquot of TE to 65 to 70ºC. Equilibrate a water bath or heat block
to 50 ºC. Verify that ethanol has been added to wash Buffer (L2).
1) Gel slice excision: Cut the area of gel containing the DNA fragment using a clean,
sharp blade. Minimize the amount of surrounding agarose excised with the fragment.
2) Gel slice weighing: Weigh the gel slice.
a. For < 2% agarose gel, place up to 400 mg of gel into a 1.5 ml polypropylene
tube. Divide gel slices exceeding 400 mg among additional tubes. Add 30 μl of
Gel solubiliszation Buffer (L1) for every 10 mg of gel.
b. For > 2% agarose gel, place up to 400 mg of gel into a 5 ml polypropylene tube.
Divide gel slices exceeding 400 mg among additional tubes. Add 60 μl of Gel
solubilization Buffer (L1) for every 10 mg of gel.
3) Gel solubilization: Incubate at 50 ºC for > 15 min. Mix every 3 min to ensure gel
dissolution. After gel slice appear dissolved, incubate for 5 min longer.
4) Cartridge loading: Place a spin cartridge into a 2-ml wash tube. Pipette the mixture
from step 3 into the spin cartridge. Centrifuge the mixture in a microcenrtifuge at >
12,000 rpm for 1 min. Discard the flow through.
Note: Load no more than 400 mg agarose per cartridge.
5) Optional cartridge wash: Place the spin cartridge back into the 2 ml wash tube.
Add 500 μl Gel Solublization Buffer (L1) to the spin cartridge. Incubate at room
temperature for 1 min, then centrifuge at > 12,000 rpm for 1 min. Discard the flow
through.
133
6) Cartridge wash: Place the spin cartridge back into the 2 ml wash tube. Add 700 μl of
Wash Buffer (L2) (containing ethanol) to the spin cartridge and incubate for 5 min at room
temperature. Centrifuge at > 12,000 rpm for 1 min. Discard the flow through. Centrifuge
again for 1 min to remove residual wash buffer.
7) DNA elution: Place the spin cartridge into a 1.5 ml recovery tube (supplied).
Add 50 μl of warm TE Buffer (TE) directly to the center of the spin cartridge.
Incubate for 1 min at room temperature, then centrifuge at > 12,000 rpm for 1 min.
Gel casting
An adequate volume of electrophoresis buffer (1X TBE) was taken in the electrophoresis tank.
1% agarose was prepared in 1X TBE buffer by melting in microwave oven till boiling. It was
then cooled to 55°C before pouring the gel casting tray and the comb was inserted ensuring that
no air bubble was trapped in the gel. After hardening of the gel at room temperature, comb was
removed carefully. Gel caster containing gel was then placed in electrophoresis chamber
containing sufficient buffer.
Loading of the samples
Genomic DNA samples was loaded on the gel in the respective wells after mixing with
appropriate amount (0.5 l) of 6 X loading dye (appendix-1). Allowed to run for 0.5 to 1.0 hour
at 100 V in 1% gel. Migration of the DNA in the gel from the cathode to anode was monitored
by the movement of dye. Power supply was turned off when the dye reached to a distance
sufficient for separation of DNA fragments.
Staining and visualization of gel
When electrophoresis was completed. Gel was taken out and stained in ethidium bromide for
approximately 15 minutes by slowly shaking the tray. Ethidium bromide solution was removed
by washing the gel for 3-4 times in water. Gel was then photographed under UV illuminator at a
wavelength of 254 nm with Eagle Eye Gel documentation system (Stratagene, USA). The DNA
bands were visualized under UV light and documented. The amount and quality of an aliquot of
DNA were then roughly estimated by comparing its intensity with DNA standards of known
characteristics.

134
APPENDIX-VI
Table: 4.4 Value of the X2 distribution
P
d.f,
0.995 0.975 0.050 0.025 0.010 0.005 0.001
1 392704.10 E 10 982069.10E9 3.84146 5.02389 6.63490 7.87944 10.828
2 0.0100251 0.0506356 5.99146 7.37776 9.21034 10.5966 13.816
3 0.0717218 0.215795 7.81473 9.34840 11.3449 12.8382 16.266
4 0.206989 0.484419 9.48773 11.1433 13.2767 14.8603 18.467
5 0.411742 0.831212 11.0705 12.8325 15.0863 16.7496 20.515
6 0.675727 1.23734 12.5916 14.4494 16.8119 18.5476 22.458
7 0.989256 1.68987 14.0671 16.0128 18.4753 20.2777 24.322
8 1.34441 2.179773 15.5073 17.5345 20.0902 21.9550 26.125
9 1.73493 2.70039 16.9190 19.0228 21.6660 23.5894 27.877
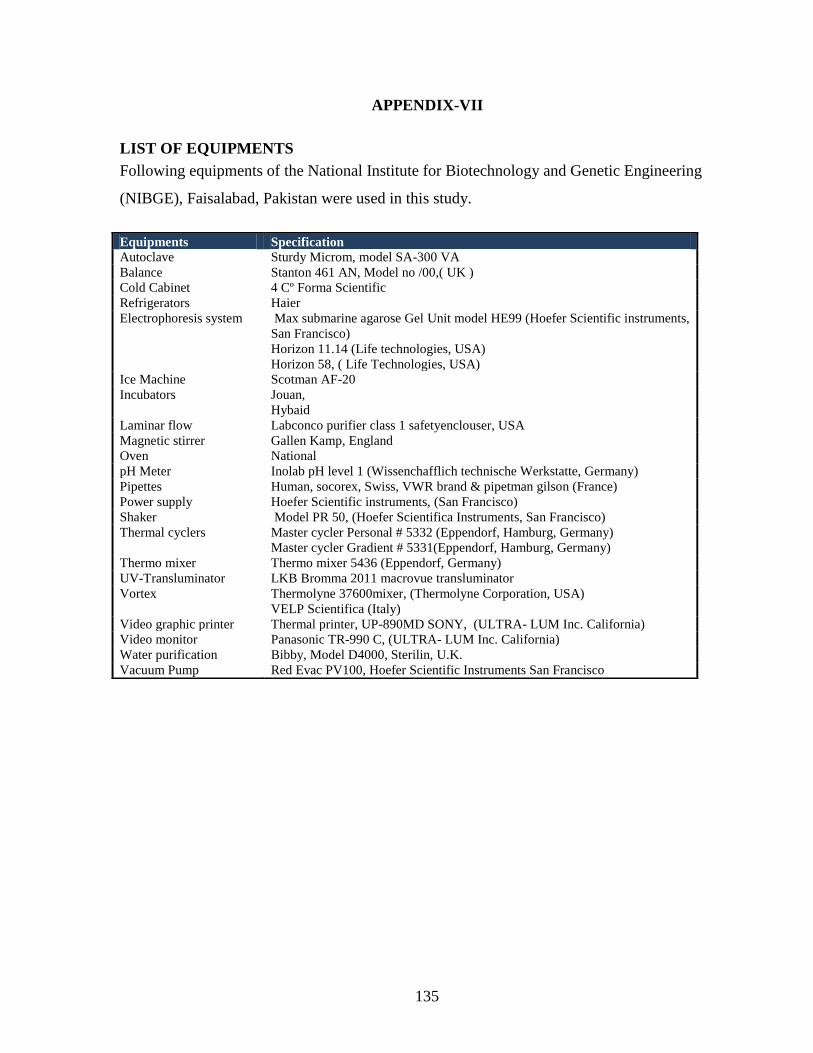
135
APPENDIX-VII
LIST OF EQUIPMENTS
Following equipments of the National Institute for Biotechnology and Genetic Engineering
(NIBGE), Faisalabad, Pakistan were used in this study.
Equipments Specification
Autoclave Sturdy Microm, model SA-300 VA
Balance Stanton 461 AN, Model no /00,( UK )
Cold Cabinet 4 Cº Forma Scientific
Refrigerators Haier
Electrophoresis system Max submarine agarose Gel Unit model HE99 (Hoefer Scientific instruments,
San Francisco)
Horizon 11.14 (Life technologies, USA)
Horizon 58, ( Life Technologies, USA)
Ice Machine Scotman AF-20
Incubators Jouan,
Hybaid
Laminar flow Labconco purifier class 1 safetyenclouser, USA
Magnetic stirrer Gallen Kamp, England
Oven National
pH Meter Inolab pH level 1 (Wissenchafflich technische Werkstatte, Germany)
Pipettes Human, socorex, Swiss, VWR brand & pipetman gilson (France)
Power supply Hoefer Scientific instruments, (San Francisco)
Shaker Model PR 50, (Hoefer Scientifica Instruments, San Francisco)
Thermal cyclers Master cycler Personal # 5332 (Eppendorf, Hamburg, Germany)
Master cycler Gradient # 5331(Eppendorf, Hamburg, Germany)
Thermo mixer Thermo mixer 5436 (Eppendorf, Germany)
UV-Transluminator LKB Bromma 2011 macrovue transluminator
Vortex Thermolyne 37600mixer, (Thermolyne Corporation, USA)
VELP Scientifica (Italy)
Video graphic printer Thermal printer, UP-890MD SONY, (ULTRA- LUM Inc. California)
Video monitor Panasonic TR-990 C, (ULTRA- LUM Inc. California)
Water purification Bibby, Model D4000, Sterilin, U.K.
Vacuum Pump Red Evac PV100, Hoefer Scientific Instruments San Francisco

136
LIST OF SOLUTIONS
Techniques Solutions Composition
DNA extraction from
blood
Solution A: 0.32 M sucrose
10 mM Tris HCl (pH 7.5)
5 mM MgCl2
Triton X-100 1 % v/v
Solution B: 10 mM Tris HCl (pH 7.5)
400 mM NaCl,
2 mM EDTA (pH 8.0)
Solution C:
Common solution:
Proteinase K:
Saturated Phenol (pH 8.0)
20 mg/ml in dH2O
Sod. Acetate
Chloroform : Isoamyl alcohol
SDS:
3 M
24: 1
10% stock solution (pH: 7.2)
NaCl: 5 M saturated stock solution
Alcohol: 70 % ethanol
EDTA: 0.5 M (pH 8.0)
Gel electrophoresis 10X Loading buffer: 2.5 mg/ml BPB, 1% SDS in 2 ml glycerol
Ethidium bromide: 10 mg/ml
10X TBE buffer: 1 M Tris-Base, 900 mM Boric Acid, 20
mM Na2EDTA (pH 8.3)
Agarose gels: 1X TBE buffer containing ethidium
bromide
Polymerase chain
reaction
10X PCR buffer: 10 mM Tris-HCl (pH 9.0), 50 mM KCl,
0.1% Triton X-100
MgCl2: 1.5 mM MgCl2
dNTPs: 100 mM dNTP mixture