genetic population structure of muskellunge in the great lakes€¦ · kevin l. kapuscinski a,...
TRANSCRIPT

This article was downloaded by: [Kevin Kapuscinski]On: 21 June 2013, At: 12:34Publisher: Taylor & FrancisInforma Ltd Registered in England and Wales Registered Number: 1072954 Registered office: Mortimer House,37-41 Mortimer Street, London W1T 3JH, UK
Transactions of the American Fisheries SocietyPublication details, including instructions for authors and subscription information:http://www.tandfonline.com/loi/utaf20
Genetic Population Structure of Muskellunge in theGreat LakesKevin L. Kapuscinski a , Brian L. Sloss b & John M. Farrell aa College of Environmental Science and Forestry , State University of New York , 304 IllickHall, 1 Forestry Drive, Syracuse , New York , 13210 , USAb U.S. Geological Survey , Wisconsin Cooperative Fishery Research Unit, University ofWisconsin–Stevens Point, College of Natural Resources , 800 Reserve Street, Stevens Point ,Wisconsin , 54481 , USAPublished online: 21 Jun 2013.
To cite this article: Kevin L. Kapuscinski , Brian L. Sloss & John M. Farrell (2013): Genetic Population Structure of Muskellungein the Great Lakes, Transactions of the American Fisheries Society, 142:4, 1075-1089
To link to this article: http://dx.doi.org/10.1080/00028487.2013.799515
PLEASE SCROLL DOWN FOR ARTICLE
Full terms and conditions of use: http://www.tandfonline.com/page/terms-and-conditions
This article may be used for research, teaching, and private study purposes. Any substantial or systematicreproduction, redistribution, reselling, loan, sub-licensing, systematic supply, or distribution in any form toanyone is expressly forbidden.
The publisher does not give any warranty express or implied or make any representation that the contentswill be complete or accurate or up to date. The accuracy of any instructions, formulae, and drug doses shouldbe independently verified with primary sources. The publisher shall not be liable for any loss, actions, claims,proceedings, demand, or costs or damages whatsoever or howsoever caused arising directly or indirectly inconnection with or arising out of the use of this material.

Transactions of the American Fisheries Society 142:1075–1089, 2013C© American Fisheries Society 2013ISSN: 0002-8487 print / 1548-8659 onlineDOI: 10.1080/00028487.2013.799515
ARTICLE
Genetic Population Structure of Muskellungein the Great Lakes
Kevin L. Kapuscinski*College of Environmental Science and Forestry, State University of New York, 304 Illick Hall,1 Forestry Drive, Syracuse, New York 13210, USA
Brian L. SlossU.S. Geological Survey, Wisconsin Cooperative Fishery Research Unit,University of Wisconsin–Stevens Point, College of Natural Resources, 800 Reserve Street, Stevens Point,Wisconsin 54481, USA
John M. FarrellCollege of Environmental Science and Forestry, State University of New York, 250 Illick Hall,1 Forestry Drive, Syracuse, New York 13210, USA
AbstractWe quantified genetic relationships among Muskellunge Esox masquinongy from 15 locations in the Great Lakes
to determine the extent and distribution of measurable population structure and to identify appropriate spatial scalesfor fishery management and genetic conservation. We hypothesized that Muskellunge from each area representedgenetically distinct populations, which would be evident from analyses of genotype data. A total of 691 Muskellungewere sampled (n = 10–127/site) and genetic data were collected at 13 microsatellite loci. Results from a suite of analyses(including pairwise genetic differentiation, Bayesian admixture prediction, analysis of molecular variance, and testsof isolation by distance) indicated the presence of nine distinct genetic groups, including two that were approximately50 km apart. Geographic proximity and low habitat complexity seemed to facilitate genetic similarity among areas,whereas Muskellunge from areas of greater habitat heterogeneity exhibited high differentiation. Muskellunge frommost areas contained private alleles, and mean within-area genetic variation was similar to that reported for otherfreshwater fishes. Management programs aimed at conserving the broader diversity and long-term sustainabilityof Muskellunge could benefit by considering the genetically distinct groups as independent fisheries, and individualspawning and nursery habitats could subsequently be protected to conserve the evolutionary potential of Muskellunge.
Conservation of global biodiversity requires the preservationof ecosystems, species, and their genes (IUCN 2011), so infor-mation on within-species genetic diversity and spatial structureis essential to conservation practitioners. The Esocidae, whichare fishes native to the freshwaters of Asia, Europe, and NorthAmerica, have been considered to contain lower levels of within-population diversity than other freshwater fishes based on stud-ies of Northern Pike Esox lucius (Hansen et al. 1999; Senananand Kapuscinski 2000; Miller and Senanan 2003). The genetic
*Corresponding author: [email protected] April 5, 2012; accepted April 18, 2013
diversity and structure of the Muskellunge E. masquinongy, thelargest member of Esocidae, has not been described across itsnative range. The Muskellunge is a long-lived species (up to30 years; Casselman et al. 1999) with overlapping generations(Scott and Crossman 1998) and is the apex aquatic predatorthroughout its native range in eastern North America, whichincludes nearshore habitats of the Great Lakes. Unfortunately,the Muskellunge has suffered significant population declinesand local extinctions due in part to overexploitation and the
1075
Dow
nloa
ded
by [
Kev
in K
apus
cins
ki]
at 1
2:34
21
June
201
3

1076 KAPUSCINSKI ET AL.
ongoing degradation and loss of spawning and nursery habitats(Whillans 1979; Trautman 1982; Farrell et al. 2007; Kapuscin-ski et al. 2007). Despite these population declines, Muskellungeare still economically important as sport fish (Menz and Wilton1983; New York Power Authority 2005; Simonson 2008) andare managed by multiple environmental agencies in Canada andthe USA.
Contemporary Muskellunge populations typically occurat low densities and are difficult to sample, so substantialinformation on Muskellunge reproductive biology, geneticdiversity, and stock structure are lacking. The Muskellunge is aspring spawner that broadcasts eggs near shore (<1.5-m depth)among submersed aquatic vegetation and provides no parentalcare (Farrell et al. 1996; Scott and Crossman 1998; Zorn et al.1998; Farrell 2001). Adult Muskellunge implanted with radiotransmitters have been shown to move up to 98 km away fromspawning sites postspawn (LaPan et al. 1996), and severalresearchers have captured tagged Muskellunge at the samespawning location in multiple years (Crossman 1990; Farrellet al. 2007; Jennings et al. 2011). Natal philopatry is assumedto be the mechanism that maintains genetic spatial structure ofother vagile fishes in the Great Lakes such as the Lake SturgeonAcipenser fulvescens (DeHaan et al. 2006) and Walleye Sandervitreus (Stepien et al. 2009), but it is unknown if spawning-sitefidelity by Muskellunge is natal philopatry that influencesgenetic spatial structure. Although many advances in moleculartechniques have recently been made, only a single publishedstudy has attempted to examine genetic diversity amongseveral Muskellunge populations from a wide geographic range(Koppelman and Philipp 1986). Koppelman and Philipp (1986)assessed genetic diversity of Muskellunge from nine potentialpopulations (five wild and four hatchery populations) using 10polymorphic isozyme loci. While their study was limited bysmall sample sizes (n = 2–26 per potential population) andthe use of isozyme loci that have largely been replaced bymicrosatellite loci in studies of genetic population structure,Koppelman and Philipp (1986) were able to demonstrate theexistence of genetic variation among populations. However,they considered their study preliminary because of these afore-mentioned limitations and called for a more extensive geneticanalysis that has not yet been conducted. As a consequence ofthe lack of information on the genetic structure of Muskellunge,fish have been stocked across drainage boundaries and Muskel-lunge in large bodies of water are typically managed as singlestocks, even where demographic evidence for intrasystem stockstructure exists (Haas 1978; Mooradian et al. 1986; Strand 1986;Bryant and Smith 1988; Crossman 1990; Farrell et al. 2007).
Stocking Muskellunge has been a common management ac-tion in many areas of the Great Lakes to supplement or rein-troduce populations. For example, the upper Niagara River wasstocked with 408,000 Muskellunge fry during 1941–1955 thatwere progeny of Chautauqua Lake (New York) Muskellungeand 18,425 fingerlings during 1960–1974 that were progeny
of Stony Lake (Ontario) Muskellunge (M. Wilkinson, NewYork State Department of Environmental Conservation, per-sonal communication). A total of 553,800 Muskellunge fry(<50 mm), 682,081 fingerlings (50–270 mm), and 195 juve-niles (>270 mm) also were stocked in Lac des Deux Mon-tagnes and the Montreal region of the St. Lawrence River during1950–1997; fish of known origin were progeny of ChautauquaLake (New York) Muskellunge (Y. de Lafontaine, Environ-ment Canada, personal communication). In addition, 119,000Muskellunge fry (mean length = 24 mm) and 763 fingerlings(mean length = 76 mm) that were progeny of locally caught,wild fish were stocked into a total of 10 sites on the St. LawrenceRiver during 1990–1992, 1994, and 1996 for an experiment(Farrell and Werner 1999). Finally, the Fox River (a tributaryto Green Bay, Lake Michigan) was stocked with progeny ofMuskellunge captured from the Indian River Spreads (north-central Michigan) and Lake St. Clair in most years since 1989as part of a reintroduction program (Kapuscinski et al. 2007).Although stocking has been widespread, effects on the integrityof the Muskellunge genome have not been quantified. Assess-ment of the spatial genetic structure of Muskellunge populationsis an important first step toward genetic conservation and under-standing what effects, if any, stocking has had on the genome(Koppelman and Philipp 1986).
Losses of genetically distinct Muskellunge populations,whether caused by introgression with stocked fish or failures toprotect populations and their critical habitats, could ultimatelyreduce the species’ ability to adapt to environmental changes.Therefore, sound management plans for Muskellunge couldusefully consider genetic issues such as differentiation amongspawning groups, conservation of rare alleles, and inbreedingdepression. The objective of our study was to determine if inter-population diversity and genetic spatial structure exists amongthe putative Muskellunge populations in the Great Lakes andto quantify this diversity and structure to inform managementplans that will be effective at conserving the species’ evolution-ary potential. In addition, we discuss how patterns in geneticstructure relate to the results of Muskellunge movement studiesthat indicated reproductive homing and how within-populationdiversity of Muskellunge compares to other freshwater fishes.The genetic variation of potential Muskellunge populations wascompared at 13 microsatellite loci; microsatellite loci were cho-sen because (1) they are highly polymorphic and therefore idealfor analyses of genetic variation among small potential pop-ulations (Allendorf and Luikart 2007), (2) they allowed fornonlethal sampling, and (3) developed markers being used inmultiple locations across the Muskellunge native range wereavailable (Sloss et al. 2008a). It was our aim that the resultsof this study would benefit resource managers by identifyingappropriate scales for fishery management and protection ofspawning and nursery habitats and by determining populationboundaries, across which stocking could risk disrupting poten-tial locally adapted gene complexes.
Dow
nloa
ded
by [
Kev
in K
apus
cins
ki]
at 1
2:34
21
June
201
3

MUSKELLUNGE GENETICS 1077
METHODSSampling locations.—Muskellunge were collected from 15
areas throughout the Great Lakes drainage, including (1) theFox River, a tributary to Green Bay, Lake Michigan; (2) PointeAu Baril, Georgian Bay, Lake Huron; (3) Moon River, GeorgianBay, Lake Huron; (4) Severn Sound, Georgian Bay, Lake Huron;(5) Lake St. Clair; (6) Buffalo Harbor, Lake Erie; (7) the upperNiagara River; (8) the lower Niagara River; (9) the ThousandIslands region of the St. Lawrence River; (10) Blind Bay, aknown spawning location in the eastern Thousand Islands regionof the St. Lawrence River; (11) Garlock Bay, a known spawninglocation at the eastern edge of the Thousand Islands regionof the St. Lawrence River; (12) the St. Lawrence River belowthe dam at Massena, New York (hereafter Massena); (13) theGrasse River, a tributary to the St. Lawrence River; (14) Lac desDeux Montagnes, Quebec; and (15) the St. Lawrence River nearMontreal, Quebec (Table 1; Figure 1). The geographic area ofsampling localities ranged from point locations (e.g., trap netsset within Blind Bay and Garlock Bay) to an approximately 30-km-long stretch of the St. Lawrence River within the ThousandIslands region. We hypothesized that each area contained at leastone spawning group that was distinct from all others, and werefer to these groups as populations.
Sample collection and storage.—Muskellunge were capturedthroughout the open-water season by angling, electrofishing,and trap-netting. Tissue samples, collected as scales or fin clips,were either allowed to dry in individually labeled coin envelopesor immediately placed in vials containing nondenatured 100%ethanol. Attempts were made to collect ≥50 Muskellunge fromeach area, but low capture numbers often made this impractical.Therefore, sample sizes ranged from 10 (Massena) to 127 (LakeSt. Clair) individuals.
DNA extraction and microsatellite genotyping.—All DNAextractions and microsatellite genotyping were conducted bythe Molecular Conservation Genetics Laboratory, College ofNatural Resources, University of Wisconsin–Stevens Point. Ge-nomic DNA from individual tissue samples was extracted usingthe Promega Wizard Genomic DNA purification kit (Promega,Madison, Wisconsin) modified for 96-well extractions with re-hydration of the DNA in 100 µl of tris-low-EDTA buffer solution(TLE; 10mM NaCl, 0.1 mM EDTA, pH 8.0). Extracted DNAwas quantified using a Nanodrop ND-1000 spectrophotome-ter (Nanodrop Technologies, Wilmington, Delaware). All DNAsamples were normalized to a final concentration of 20 ng/µLprior to genotyping. Thirteen of the 14 microsatellite loci de-scribed by Sloss et al. (2008a) were used to genotype individual
TABLE 1. Summary of genetic diversity measures calculated from 13 microsatellite loci of Muskellunge sampled from 15 potential populations includingsample size N, expected heterozygosity He and standard deviation He SD, observed heterozygosity Ho and standard deviation Ho SD, mean number of observedalleles per locus A and standard deviation A SD, mean allelic richness per locus after rarefaction Ar, observed number of private alleles PA, and mean number ofprivate alleles per locus after rarefaction PAr.
Population Latitude Longitude N He He SD Ho Ho SD A A SD Ar PA PAr
Fox River (Lake Michigan) 44◦28′36.07′′N 88◦02′35.73′′W 108 0.5242 0.0865 0.5114 0.0135 5.85 4.10 3.94 5 0.44Pointe Au Baril (Lake
Huron)45◦33′45.92′′N 80◦30′18.06′′W 27 0.4900 0.0727 0.4843 0.0267 4.23 3.11 3.46 1 0.08
Moon River (Lake Huron) 45◦07′00.85′′N 80◦02′47.78′′W 34 0.5099 0.0781 0.4627 0.0240 5.46 3.86 4.18 3 0.17Severn Sound (Lake
Huron)44◦48′21.84′′N 79◦47′20.54′′W 16 0.5656 0.0785 0.5240 0.0346 5.15 3.69 4.49 4 0.31
Lake St. Clair 42◦22′33.29′′N 82◦27′43.03′′W 127 0.5422 0.0775 0.5253 0.0126 7.31 6.42 4.53 3 0.12Buffalo Harbor (Lake Erie) 42◦51′37.25′′N 78◦53′03.59′′W 18 0.5198 0.0618 0.4530 0.0325 5.00 3.16 4.06 1 0.14Upper Niagara River 42◦57′30.04′′N 78◦56′12.77′′W 113 0.4564 0.0643 0.4498 0.0130 5.77 4.17 3.39 2 0.04Lower Niagara River 43◦14′06.07′′N 79◦03′17.78′′W 12 0.4911 0.0686 0.4872 0.0400 4.00 2.77 3.76 0 0.03St. Lawrence River,
Thousand Islands region44◦15′02.61′′N 76◦06′03.40′′W 80 0.5274 0.0782 0.5079 0.0155 6.23 5.33 4.48 1 0.03
Blind Bay (St. LawrenceRiver)
44◦16′02.47′′N 76◦00′57.42′′W 14 0.5226 0.0796 0.4911 0.0389 4.31 2.90 4.12 0 0.10
Garlock Bay (St. LawrenceRiver)
44◦19′07.37′′N 75◦56′43.88′′W 16 0.5029 0.0715 0.4924 0.0356 4.23 3.03 3.81 0 0.01
Massena (St. LawrenceRiver)
45◦00′06.14′′N 74◦47′40.85′′W 10 0.5482 0.0691 0.5154 0.0438 4.38 2.96 4.38 0 0.11
Grasse River (St. LawrenceRiver tributary)
44◦44′53.01′′N 75◦07′47.18′′W 15 0.5034 0.0593 0.4769 0.0358 3.46 1.66 3.25 0 0.09
Lac des Deux Montagnes 45◦30′03.72′′N 73◦56′17.06′′W 37 0.6103 0.0578 0.6119 0.0226 5.85 4.45 4.45 2 0.08St. Lawrence River, near
Montreal45◦30′08.63′′N 73◦32′03.72′′W 64 0.5974 0.0595 0.6072 0.0172 6.77 5.53 4.62 0 0.04
Dow
nloa
ded
by [
Kev
in K
apus
cins
ki]
at 1
2:34
21
June
201
3

1078 KAPUSCINSKI ET AL.
FIGURE 1. Locations of 15 potential populations of Great Lakes Muskellunge sampled for genetic analysis. Site abbreviations are as follows: FOX = Fox River,PAB = Pointe Au Baril, MOR = Moon River, SEV = Severn Sound, LSC = Lake St. Clair, BUH = Buffalo Harbor, UNR = upper Niagara River, LNR = lowerNiagara River, SLR = St. Lawrence River, BLB = Blind Bay, GAR = Garlock Bay, MAS = Massena, GRA = Grasse River, LDM = Lac des Deux Montagnes,and MON = St. Lawrence River near Montreal.
Muskellunge and determine genetic variation among the 15 po-tential populations; locus EmaD12a failed in a subset of samplesand was therefore removed from all records prior to analysis.Five multiplex PCR reactions were used for each sample to am-plify individual loci with fluorescently labeled primers (Slosset al. 2008a). Microsatellite variation was visualized on an ABI3730 DNA Analyzer (Applied Biosystems, Foster City, Califor-nia). An in-lane standard (GeneFlo 625; Chimerx, Milwaukee,Wisconsin) was included with all samples and GeneMapper 4.0genetic analysis software (Applied Biosystems) identified indi-vidual genotypes that were visually verified and entered into amaster database.
Data analysis.—Population (sample) conformance toHardy–Weinberg equilibrium (HWE) expectations was testedusing the chi-square test implemented in GENALEX 6.3 (Peakalland Smouse 2006). Because of known biases with highly poly-
morphic loci and HWE tests, all locus and population compar-isons with statistically significant chi-square tests were retestedfor deviations from HWE after rare genotypes (expected fre-quency <1; Hedrick 2000) were pooled into one expected andone observed frequency value. A sequential Bonferroni correc-tion (initial α = 0.05 for all tests herein; Rice 1989) was applied.
Next, gametic disequilibrium between each locus pair wastested to determine if loci were linked or independently as-sorted. Fisher’s exact tests for each locus pair were performedin GENEPOP 4.0 (Raymond and Rousset 1995a, 1995b) usinga Markov chain method (10,000 dememorization steps, 100batches, and 5,000 iterations/batch; Guo and Thompson 1992),and a sequential Bonferroni correction was applied to the result-ing P-values.
The genetic variation of populations was compared us-ing the following measures: (1) expected heterozygosity He,
Dow
nloa
ded
by [
Kev
in K
apus
cins
ki]
at 1
2:34
21
June
201
3

MUSKELLUNGE GENETICS 1079
(2) observed heterozygosity Ho, (3) mean number of alleles perlocus A, (4) mean allelic richness per locus after rarefaction Ar,(5) observed number of private alleles PA, and (6) mean numberof private alleles per locus after rarefaction PAr. We used theExcel Microsatellite Toolkit (Park 2001) to calculate A, He, andHo, and HP-RARE 1.1 (Kalinowski 2005) to calculate Ar and PAr
based on a minimum sample size of 10 individuals (20 genes).Genetic differentiation among potential populations was
quantified with pairwise comparisons of (1) Weir and Cock-erham’s (1984) θ, an analog of Wright’s (1931) FST that uses aweighted analysis of variance (ANOVA) to quantify the amountof allelic variation in the entire sample that is attributable to dif-ferences among potential populations, and (2) harmonic means(across all loci) of Jost’s D (Jost 2008), which provides the pro-portion of each potential population’s alleles that are unique tothat group. Tests of θ and significant deviations from zero wereconducted in ARLEQUIN 3.5.1.2 (1,000 permutations; Excoffierand Lischer 2010), and harmonic means of D were calculated inSMOGD 1.2.5 (1,000 bootstrap replicates; Crawford 2010). Wethen used the values of θ and D from each potential popula-tion pair to generate two similarity matrixes (similarity = 1–θ
and 1–D), and created a nonmetric multidimensional scalingmodel (NMDS; SAS 9.2, SAS Institute, Cary, North Carolina)based on each to visually examine the genetic similarity amongpopulations.
We further examined the spatial genetic structure of Muskel-lunge populations with the Bayesian algorithm implementedin the program STRUCTURE 2.3.3 (Pritchard et al. 2000), usingthe following hierarchical approach. First, we excluded the FoxRiver population because it was introduced, and then evaluatedthe remaining data set (583 Muskellunge from 14 populations)for K = 1–12 potential discrete groups (five runs per K value)with the following conditions: (1) 500,000 replicate burn-insfollowed by 500,000 replicates, (2) the admixture model witha uniform prior on the degree of admixture α (initial value =1, maximum = 10, SD = 0.025), and (3) allele frequencieswere considered correlated among populations (prior mean =0.01, prior SD = 0.05, λ = 1). The best estimate of K groupswas chosen following the methods of Evanno et al. (2005),using STRUCTURE HARVESTER 0.56.4 (Earl 2010). Each groupwas then evaluated for K = n + 2 (where n = the number ofpopulations within a group) potential discrete subgroups usingthe conditions outlined above to determine whether spatial ge-netic structure (multiple spawning groups) existed within thegroup. Following the suggestions of Pritchard et al. (2000), weused iterative STRUCTURE analysis to determine if further hier-archical structure existed in the data. After K was determinedas described above, each population sample was categoricallyput into discrete subgroups for testing based on its majorityQ-value score. The composite subgroups were then tested usingSTRUCTURE as described.
Next, we performed a hierarchical analysis of molecularvariance (AMOVA; Excoffier et al. 1992) in ARLEQUIN 3.5.1.2(Excoffier and Lischer 2010) to compare the molecular vari-
ance within and between population groups. The populationgroups tested were those suggested during three main steps ofthe STRUCTURE analysis (K = 2, 5, and 8). Significance levelsfor each AMOVA were calculated using 50,175 permutations ofthe data (Excoffier et al. 1992), and the three different groupingstrategies were evaluated based on which maximized molecu-lar variance among groups and minimized molecular varianceamong populations within groups.
Finally, tests of isolation by distance (IBD) were conductedusing the ISOLATION BY DISTANCE WEB SERVICE 3.21 (Jensenet al. 2005) to determine if migration between populations in-fluenced spatial genetic structure. The IBD tests consisted of areduced major axis regression of pairwise θ and D values againstpairwise geographical distance measurements (distance in kilo-meters between each population pair measured across water),followed by a Mantel test (Mantel 1967) with 999 random-izations to determine the statistical significance of the relationbetween genetic and geographic distance measures. In initialIBD tests, the relations of θ versus geographic distance and Dversus geographic distance were nonlinear, with an inflection atNiagara Falls. Therefore, prior to the final IBD tests reportedhere, the θ versus geographic distance and D versus geographicdistance matrices were each divided into two matrices based onwhether potential populations were located upstream or down-stream of Niagara Falls. The Fox River population was excludedfrom IBD tests because it was established by stocking, with oneof the sources having been the Lake St. Clair population.
RESULTSA total of 691 individual Muskellunge samples remained for
analyses after duplicates (e.g., recaptured Muskellunge) wereremoved and records with genotype data missing from five ormore loci were excluded. The number of alleles per locus (acrossall populations) ranged from 2 to 25 and averaged 10.4. All pop-ulations were considered to conform to HWE expectations forsubsequent analyses because only one of 184 (0.5%) exact testsdeviated from HWE following sequential Bonferroni correction(locus EmaA11 for the FOX population). Linkage analysis, ex-cluding the FOX population because it resulted from a smallnumber of founding events, showed 12 significant locus-by-locus comparisons following sequential Bonferroni correctionwithin populations (66 comparisons per population); the max-imum number of significant locus pair comparisons was three.Given a total of 924 locus pair comparisons, we concluded thedata conformed to overall linkage equilibrium expectations withthe 12 significant comparisons being the result of genetic driftwithin select populations.
Each locus was polymorphic for each population, with thefollowing exceptions: (1) locus Ema-A10 was monomorphicfor the Moon River population, (2) Ema-D4 was monomor-phic for the Blind Bay and Garlock Bay populations, and (3)Ema-A104 was monomorphic for the Fox River, Pointe AuBaril, Severn Sound, Lake St. Clair, Buffalo Harbor, the upper
Dow
nloa
ded
by [
Kev
in K
apus
cins
ki]
at 1
2:34
21
June
201
3

1080 KAPUSCINSKI ET AL.
TABLE 2. Pairwise D values (above diagonal) and θ values (below diagonal; P-values in parentheses; an asterisk indicates P < 0.0001) calculated across 13microsatellite loci for 15 potential populations of Muskellunge in the Great Lakes. Population abbreviations are as follows: FOX = Fox River, PAB = Pointe AuBaril, MOR = Moon River, SEV = Severn Sound, LSC = Lake St. Clair, BUH = Buffalo Harbor, UNR = upper Niagara River, LNR = lower Niagara River,SLR = St. Lawrence River, BLB = Blind Bay, GAR = Garlock Bay, MAS = Massena, GRA = Grasse River, LDM = Lac des Deux Montagnes, and MON = St.Lawrence River near Montreal.
FOX PAB MOR SEV LSC BUH UNR LNR SLR BLB GAR MAS GRA LDM MON
FOX 0.1513 0.1578 0.1533 0.1290 0.1718 0.1765 0.1678 0.2022 0.1534 0.1736 0.1908 0.2712 0.2363 0.2227PAB 0.1714
(*)0.0411 0.0845 0.0996 0.1645 0.1829 0.1460 0.1436 0.0827 0.1305 0.1207 0.2142 0.1671 0.1551
MOR 0.1603(*)
0.0404(*)
0.0506 0.0672 0.1173 0.1197 0.0922 0.1118 0.0575 0.1086 0.0692 0.1847 0.0875 0.0984
SEV 0.1519(*)
0.1030(*)
0.0819(*)
0.0751 0.1028 0.1422 0.1259 0.0774 0.0324 0.0922 0.0943 0.1427 0.1030 0.1084
LSC 0.1276(*)
0.0935(*)
0.0733(*)
0.0675(*)
0.1026 0.1214 0.0971 0.0968 0.0767 0.0810 0.0690 0.1063 0.0612 0.0666
BUH 0.1605(*)
0.2115(*)
0.1962(*)
0.1428(*)
0.1228(*)
0.0000 0.0001 0.1684 0.1534 0.1231 0.1375 0.1788 0.1093 0.1260
UNR 0.1968(*)
0.2308(*)
0.2006(*)
0.1871(*)
0.1357(*)
0.0094(0.0830)
0.0000 0.2075 0.1714 0.1555 0.1781 0.2143 0.1699 0.1710
LNR 0.1883(*)
0.1902(*)
0.1669(*)
0.1614(*)
0.1174(*)
0.0187(0.1045)
0.0054(0.2305)
0.1920 0.1290 0.1500 0.1723 0.2056 0.1534 0.1516
SLR 0.1914(*)
0.1647(*)
0.1320(*)
0.1037(*)
0.0880(*)
0.1793(*)
0.2151(*)
0.1881(*)
0.0125 0.0023 0.0018 0.1283 0.0693 0.0388
BLB 0.1562(*)
0.1193(*)
0.0904(*)
0.0826(*)
0.0637(*)
0.1807(*)
0.2130(*)
0.1803(*)
0.0112(0.0801)
0.0044 0.0226 0.1388 0.0866 0.0772
GAR 0.1550 0.1490 0.1083 0.0851 0.0671 0.1425 0.1768 0.1595 −0.0025 0.0095 0.0085 0.1268 0.0641 0.0351(*) (*) (*) (*) (*) (*) (*) (*) (0.7002) (0.1641)
MAS 0.1939(*)
0.1649(*)
0.1380(*)
0.1115(*)
0.0789(*)
0.1518(*)
0.2048(*)
0.1859(*)
0.0109(0.1387)
0.0416(0.0147)
0.0123(0.1699)
0.1014 0.0349 0.0008
GRA 0.2510(*)
0.216(*)
0.2312(*)
0.1597(*)
0.1281(*)
0.1931(*)
0.2449(*)
0.2135(*)
0.1422(*)
0.1512(*)
0.1486(*)
0.1212(*)
0.0926 0.0893
LDM 0.1764(*)
0.1614(*)
0.1312(*)
0.1039(*)
0.0769(*)
0.1219(*)
0.1729(*)
0.1500(*)
0.0695(*)
0.0795(*)
0.0554(*)
0.0378(*)
0.0972(*)
0.0177
MON 0.1865(*)
0.1660(*)
0.1399(*)
0.1072(*)
0.0810(*)
0.1302(*)
0.1753(*)
0.1563(*)
0.0388(*)
0.0636(*)
0.0259(*)
0.0097(0.1289)
0.0978(*)
0.0125(0.0020)
Niagara River, the lower Niagara River, and the GrasseRiver populations. Expected heterozygosity values ranged from0.4564 (upper Niagara River) to 0.6103 (Lac des Deux Mon-tagnes), with a mean across all populations of 0.5274 (Table 1).Observed heterozygosity values ranged from 0.4498 (upper Ni-agara River) to 0.6119 (Lac des Deux Montagnes), with a meanof 0.5067. The mean number of alleles per locus ranged from3.46 (Grasse River) to 7.31 (Lake St. Clair), with a mean of 5.20,whereas the mean allelic richness following rarefaction rangedfrom 3.25 (Grasse River) to 4.62 (Montreal) and averaged 4.06.The number of private alleles per population ranged from 0 (sixpopulations) to 5 (Fox River), averaged 1.5, and was positivelyrelated to sample size (Pearson’s correlation coefficient = 0.524,P = 0.022 for a one-tailed test). The mean number of private al-leles per locus following rarefaction ranged from 0.01 (GarlockBay) to 0.44 (Fox River) and averaged 0.12.
Patterns of genetic differentiation among pairs of potentialpopulations were consistent whether calculated by θ or D. Allbut nine population pairs were significantly different accordingto estimates of θ, and each of these nine pairs had D values<0.05 (i.e., <5% allelic difference between pairs; Table 2); an
additional seven population pairs had D values <0.05. Valuesof θ ranged from –0.0025 (effectively zero; Thousand Islandsregion of the St. Lawrence River–Garlock Bay pair) to 0.2510(Fox River–Grasse River pair) and averaged 0.1428 across allpopulation pairs. Values of D ranged from 1.3 × 10⁻⁷ (up-per Niagara River–lower Niagara River pair) to 0.2712 (FoxRiver–Grasse River pair) and averaged 0.11 across all popu-lation pairs. Genetic similarities among populations (1–θ and1–D), as illustrated with NMDS models, were consistent withthe expectation that populations in close geographic proximitywould be more similar than distant population pairs. For ex-ample, Buffalo Harbor, the upper Niagara River, and the lowerNiagara River populations, which are geographically adjacent toone another (centers of sampling areas about 12–60 km apart),showed a high level of genetic similarity (Figure 2), whereas ge-ographically distant pairs of native populations (e.g., the PointeAu Baril–Grasse River pair; separated by about 1,330 km)showed the greatest genetic differentiation. Additionally, the sixSt. Lawrence River populations were clustered close to one an-other in the NMDS models, indicating that they were geneticallymore similar to each other than to more geographically distant
Dow
nloa
ded
by [
Kev
in K
apus
cins
ki]
at 1
2:34
21
June
201
3

MUSKELLUNGE GENETICS 1081
populations. The Grasse River population was positioned closerto the St. Lawrence River populations than others, consistentwith its connectivity to the St. Lawrence River.
The Bayesian clustering algorithm of the program STRUC-TURE (Pritchard et al. 2000) identified two likely grouping sce-narios (K = 2 and K = 5) for Muskellunge sampled from the 14potential populations (Figure 3). The hierarchical approach fur-ther parsed the K = 5 groups into eight total groups (Figure 3).Percent assignment of Muskellunge from each potential popu-lation to the most likely group averaged 89% (range 83–94%)for K = 2, 78% (range 55–89%) for K = 5, and 82% (range55–95%) for K = 8 (Table 3).
In the three subsequent AMOVA analyses, 82.42–87.04%of molecular variance was attributed to differences amongindividual Muskellunge (Table 4). Of the three groupingscenarios tested (Table 3; Figure 3), the eight-group AMOVAmaximized the amount of molecular variance among groupsand minimized the amount of molecular variance amongpopulations within groups. The assignment of 14 populationsinto eight groups, as suggested by the program STRUCTURE andsupported by AMOVA, is consistent with patterns observedfrom the genetic differentiation measures θ and D. No pair ofpopulations within a group had D values >0.05, and only theLac des Deux Montagnes–Montreal pair (θ = 0.0125, P =0.0020) and Blind Bay–Massena pair (θ = 0.0416, P = 0.0147)had significant θ values.
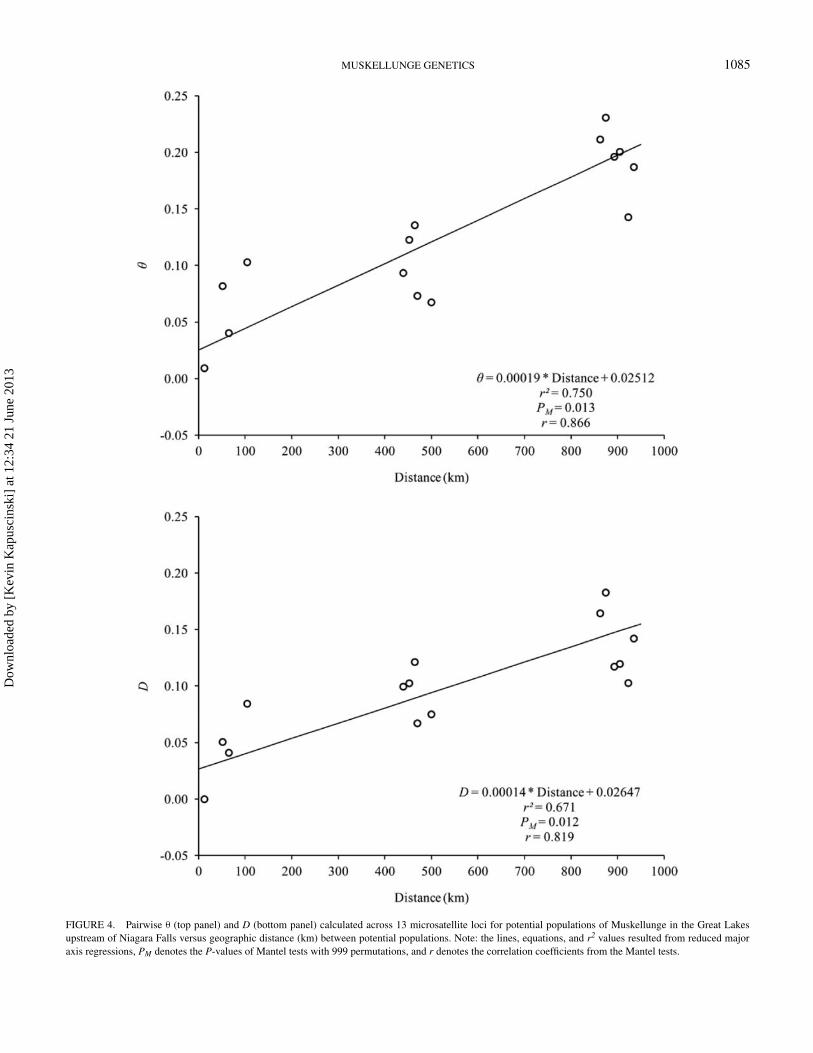
Muskellunge in the Great Lakes exhibited a strong patternof IBD that was statistically significant whether based on θ
(linear regression, P < 0.001, r2 = 0.678 above Niagara Falls;P < 0.001, r2 = 0.392 below Niagara Falls; Figure 4) or D(linear regression, P < 0.001, r2 = 0.704 above Niagara Falls;P < 0.001, r2 = 0.460 below Niagara Falls; Figure 5). Thispattern was consistent with results from the program STRUCTURE,which only assigned geographically proximate populations intocommon groups.
DISCUSSIONSignificant spatial structuring of Muskellunge genetic re-
sources in the Great Lakes was evident from multiple methodsof examination, including NMDS models of genetic similarity(1–θ and 1–D), results of the Bayesian clustering algorithm gen-erated with the program STRUCTURE, AMOVA, tests of isolationby distance, and the presence of private alleles in 9 of the 15 po-tential populations sampled. Most populations examined weregeographically distant enough to prevent reproductive mixing atrates high enough to cause genetic homogenization. For exam-ple, Muskellunge populations from three areas in Georgian Baythat are about 50–100 km apart had significant pairwise θ valuesranging from 0.0404 to 0.1030, mean pairwise D values rangingfrom 4% to 8%, and contained private alleles. While Koppel-man and Philipp’s (1986) results from isozyme loci supportedthe hypothesis that genetically distinct stocks of Muskellungelikely existed, our work clearly shows spatial genetic structure of
Muskellunge populations across the Great Lakes basin and de-scribes how genetic resources are partitioned in the Great Lakes.These findings are also evidence that stocking of Muskellungein the Great Lakes basin has not eradicated underlying geneticstructure and likely signify locally adapted groups with geneticresources critical for conservation of Great Lakes Muskellunge.
Muskellunge sampled from Buffalo Harbor, the upper Nia-gara River, and the lower Niagara River, which are separated byabout 10–60 km, were genetically very similar but collectivelyvery different from all other populations. The small sample sizesfrom Buffalo Harbor (n = 18) and the lower Niagara River (n= 12) make conclusive statements about genetic differentiationamong these areas tenuous. However, the significant amountof habitat destruction that has occurred in this region couldhave eliminated areas that once supported distinct spawninggroups of Muskellunge and forced reproductive mixing (ge-netic homogenization) in the remaining suitable habitats. Forexample, about 60% of the upper Niagara River shoreline isarmored with bulkhead, riprap, or other materials (Wooster andMatthies 2008), and more than 75% of wetlands are thoughtto have been destroyed (Whillans 1982; NYSDEC 1994). Fur-thermore, Muskellunge stocked in the Niagara River that wereprogeny of fish from Chautauqua Lake (New York) and StonyLake (Ontario) may have introgressed with native Muskellungeof Buffalo Harbor and the Niagara River, contributing to thegenetic similarity within these waters and dissimilarity withother populations (see Management Implications and ResearchNeeds, below). In addition to the genetic homogenization thatmay have resulted from habitat destruction and stocking, down-stream migration probably contributes to the genetic similarityof Muskellunge in Buffalo Harbor and the Niagara River. Re-capture data from Muskellunge tagged by anglers and in agencysurveys shows downstream movement among Buffalo Harbor,the upper Niagara River, and the lower Niagara River areas,whereas no upstream movement has been observed (NiagaraMusky Association and K. L. Kapuscinski, unpublished data).Of the 10 recaptures of Muskellunge tagged in Buffalo Harborwith complete tag–recapture records, eight occurred in Buf-falo Harbor and two occurred downstream in the upper NiagaraRiver. Similarly, of the 51 recaptures of Muskellunge taggedin the upper Niagara River, 50 occurred in that same stretch ofriver and 1 occurred in the lower river, confirming downstreampassage of Niagara Falls occurs.
The observed genetic structure of Muskellunge in the GreatLakes and the presence of IBD are consistent with results oftag–recapture studies on the species. LaPan et al. (1996), whoimplanted St. Lawrence River Muskellunge with radio trans-mitters during the spawning season, tracked their postspawnmovements, and recaptured them the following spawning sea-son, concluded that Muskellunge returned to the same spawningarea in successive years despite migrating about 30–80 km awayafter spawning. In addition, all 33 Muskellunge tagged andrecaptured during the spawning season over many years inthe Thousands Islands region of the St. Lawrence River were
Dow
nloa
ded
by [
Kev
in K
apus
cins
ki]
at 1
2:34
21
June
201
3

1082 KAPUSCINSKI ET AL.
FIGURE 2. First two dimensions for NMDS analysis of genetic similarity quantified as 1–θ (top panel) and 1–D (bottom panel) for 15 potential populationsof Great Lakes Muskellunge. Note: solid lines connect population pairs with θ values that did not differ (top) or D values <0.05 (bottom), dashed ovals indicatepopulations assigned to common groups by the program STRUCTURE, and population abbreviations are as follows: FOX = Fox River, PAB = Pointe Au Baril,MOR = Moon River, SEV = Severn Sound, LSC = Lake St. Clair, BUH = Buffalo Harbor, UNR = upper Niagara River, LNR = lower Niagara River, SLR = St.Lawrence River, BLB = Blind Bay, GAR = Garlock Bay, MAS = Massena, GRA = Grasse River, LDM = Lac des Deux Montagnes, and MON = St. LawrenceRiver near Montreal.
Dow
nloa
ded
by [
Kev
in K
apus
cins
ki]
at 1
2:34
21
June
201
3

MUSKELLUNGE GENETICS 1083
FIGURE 3. Plot of mean Q-values for all sampled individuals for K = 5. Thetwo-colored bar under the plot shows the majority distribution for K = 2 (see Ain Table 3). Results of iterative STRUCTURE analysis are presented below the plotfor each of the five predicted groups. Plots of mean Q-values for all sampledindividuals for PAB–MOR–SEV (see B in Table 3) and GRA–LDM–MON (seeC in Table 3) are below each group. Population abbreviations are as follows:FOX = Fox River, PAB = Pointe Au Baril, MOR = Moon River, SEV = SevernSound, LSC = Lake St. Clair, BUH = Buffalo Harbor, UNR = upper NiagaraRiver, LNR = lower Niagara River, SLR = St. Lawrence River, BLB = BlindBay, GAR = Garlock Bay, MAS = Massena, GRA = Grasse River, LDM = Lacdes Deux Montagnes, and MON = St. Lawrence River near Montreal. [Figureavailable online in color.]
recaptured at the original tagging location despite havingmore than 100 known spawning–nursery sites in the region(Farrell et al. 2007), providing further evidence of philopatry.Muskellunge in Stony Lake, Ontario (Crossman 1990), and fourWisconsin lakes (Jennings et al. 2011) also made postspawnmovements away from spawning sites and exhibited reproduc-tive philopatry in subsequent years. Reproductive philopatryby Muskellunge and the considerable geographic separation ofGreat Lakes populations has likely facilitated the creation andfurther strengthening of the spatial genetic structure describedabove. Researchers using tag–recapture and genetic data foundevidence of spawning-site and natal-site fidelity by the con-generic Northern Pike in the upper Niagara River (Harrison andHadley 1978), the St. Lawrence River (Bosworth and Farrell2006), and the relatively large (>10,000 ha) Kabetogama Lake(Miller et al. 2001). Isolation by distance also was consideredimportant in shaping the genetic structure of Northern Pikein the Baltic Sea (Laikre et al. 2005), and distinct spawninggroups have been identified that either reproduce in fresh orbrackish waters, but not both (Westin and Limburg 2002).
Esocids have typically been considered to contain low within-population genetic variation, but results from recent studiessuggest this is not the case. Early studies of Northern Pike,although broad in geographic scope, found low levels of within-population genetic variation. For example, mean He = 0.14at eight microsatellite loci for 20 populations throughout theglobal range of Northern Pike (Senanan and Kapuscinski 2000)and mean He = 0.24 at 13 loci for two Danish populations(Hansen et al. 1999). These findings led Miller and Senanan(2003) to conclude that Northern Pike contained lower geneticvariation than many other fishes, including sympatric Walleyeand Yellow Perch Perca flavescens; no comparable data wereavailable for the congeneric Muskellunge at the time. Subse-quent studies of Northern Pike found relatively high levels ofwithin-population genetic variation. Laikre et al. (2005), usingfive of the eight loci used by Senanan and Kapuscinski (2000),found mean He = 0.54 for Northern Pike from nine sites in theBaltic Sea. Bosworth and Farrell (2006), who used the six mostpolymorphic loci from an initial suite of 14, found mean He =0.66 for Northern Pike from four sites in the upper St. LawrenceRiver.
The use of different suites of loci in these studies makes directcomparisons difficult and highlights the need for the use of stan-dardized suites of loci. Our study used 13 of the 14 loci identifiedby Sloss et al. (2008a) that also were used in two other recentstudies of Muskellunge, so comparisons can be made regardingwithin-population genetic variation across a large portion of therange of Muskellunge. The mean He = 0.53 for Muskellungefrom 15 areas of the Great Lakes was similar to that observedfor Muskellunge from 43 water bodies in northern Wisconsin(He = 0.56; Spude 2010), both much greater than thegenetic variation of Muskellunge from Shoepack Lake innorthern Minnesota (He = 0.25; Miller et al. 2009). Forthe 55 total Muskellunge populations sampled to date, He
Dow
nloa
ded
by [
Kev
in K
apus
cins
ki]
at 1
2:34
21
June
201
3

1084 KAPUSCINSKI ET AL.
TABLE 3. Mean population-specific Q-value of each predicted genetic unit for (A) K = 2 and K = 5, the two most likely number of genetic units accordingto the Evanno et al. (2005) method (Figure 3), (B) all individual Muskellunge sampled from PAB–MOR–SEV, and (C) all individual Muskellunge sampled fromGRA–LDM–MON. Colors below group designations are from Figure 3, and population abbreviations are as follows: FOX = Fox River, PAB = Pointe Au Baril,MOR = Moon River, SEV = Severn Sound, LSC = Lake St. Clair, BUH = Buffalo Harbor, UNR = upper Niagara River, LNR = lower Niagara River, SLR = St.Lawrence River, BLB = Blind Bay, GAR = Garlock Bay, MAS = Massena, GRA = Grasse River, LDM = Lac des Deux Montagnes, and MON = St. LawrenceRiver near Montreal.
A B C
K = 2 K = 5 K = 3 K = 2
group 1 group 2 group 1 group 2 group 3 group 4 group 5 group 1 group 2 group 3 group 1 group 2Site N (Blue) (Red) (Blue) (Red) (Green) (Purple) (Light Blue) (Blue) (Green) (Red) (Purple) (Light Blue)
PAB 27 0.0297 0.9703 0.0160 0.0693 0.8873 0.0133 0.0140 0.8568 0.0876 0.0558MOR 34 0.0360 0.9640 0.0160 0.0940 0.8357 0.0270 0.0273 0.0444 0.6944 0.2610SEV 16 0.0307 0.9693 0.0313 0.0650 0.7350 0.0653 0.1033 0.0260 0.0280 0.9462LSC 127 0.0770 0.9230 0.0300 0.7890 0.0753 0.0590 0.0463BUH 18 0.8347 0.1653 0.7973 0.0717 0.0157 0.1017 0.0140UNR 113 0.9350 0.0650 0.8900 0.0390 0.0250 0.0317 0.0140LNR 12 0.8933 0.1067 0.8367 0.0720 0.0297 0.0343 0.0270SLR 80 0.0333 0.9667 0.0280 0.0580 0.0283 0.1307 0.7550BLB 14 0.0253 0.9747 0.0190 0.0407 0.1240 0.0473 0.7693GAR 16 0.0410 0.9590 0.0360 0.0783 0.0300 0.0650 0.7910MAS 10 0.0177 0.9823 0.0149 0.0442 0.0401 0.3535 0.5473GRA 15 0.0096 0.9904 0.0058 0.0686 0.0216 0.8929 0.0111 0.9052 0.0948LDM 37 0.0317 0.9683 0.0153 0.0367 0.0453 0.7937 0.1087 0.0588 0.9412MON 64 0.0303 0.9697 0.0277 0.0520 0.0320 0.6433 0.2453 0.0572 0.9428
TABLE 4. Analysis of molecular variance (AMOVA), including sum of squares SS, percent variance, and fixation index (F) explained by source for threegrouping strategies of Muskellunge sampled from 14 potential populations in the Great Lakes. The P-values for each variance component were <0.003. Populationabbreviations are as follows: FOX = Fox River, PAB = Pointe Au Baril, MOR = Moon River, SEV = Severn Sound, LSC = Lake St. Clair, BUH = BuffaloHarbor, UNR = upper Niagara River, LNR = lower Niagara River, SLR = St. Lawrence River, BLB = Blind Bay, GAR = Garlock Bay, MAS = Massena,GRA = Grasse River, LDM = Lac des Deux Montagnes, and MON = St. Lawrence River near Montreal.
Grouping scenario Source of variation SS Variance (%) F
Two-group AMOVAGroup 1 (BUH, UNR, LNR) Among groups 204.21 10.55 0.106Group 2 (all others) Among populations within groups 240.37 7.03 0.079
Within populations 3,307.46 82.42 0.176
Five-group AMOVAGroup 1 (PAB, MOR, SEV) Among groups 369.84 9.79 0.098Group 2 (LSC) Among populations within groups 74.74 3.24 0.036Group 3 (BUH, UNR, LNR) Within populations 3,307.46 86.97 0.130Group 4 (SLR, BLB, GAR, MAS)Group 5 (GRA, LDM, MON)
Eight-group AMOVAGroup 1 (PAB) Among groups 418.24 12.09 0.121Group 2 (MOR) Among populations within groups 26.35 0.87 0.010Group 3 (SEV) Within populations 3,307.46 87.04 0.130Group 4 (LSC)Group 5 (BUH, UNR, LNR)Group 6 (SLR, BLB, GAR, MAS)Group 7 (GRA)Group 8 (LDM, MON)
Dow
nloa
ded
by [
Kev
in K
apus
cins
ki]
at 1
2:34
21
June
201
3
MUSKELLUNGE GENETICS 1085
FIGURE 4. Pairwise θ (top panel) and D (bottom panel) calculated across 13 microsatellite loci for potential populations of Muskellunge in the Great Lakesupstream of Niagara Falls versus geographic distance (km) between potential populations. Note: the lines, equations, and r2 values resulted from reduced majoraxis regressions, PM denotes the P-values of Mantel tests with 999 permutations, and r denotes the correlation coefficients from the Mantel tests.
Dow
nloa
ded
by [
Kev
in K
apus
cins
ki]
at 1
2:34
21
June
201
3

1086 KAPUSCINSKI ET AL.
FIGURE 5. Pairwise θ (top panel) and D (bottom panel) calculated across 13 microsatellite loci for potential populations of Muskellunge in the Great Lakesdownstream of Niagara Falls versus geographic distance (km) between potential populations. Note: the lines, equations, and r2 values resulted from reduced majoraxis regressions, PM denotes the P-values of Mantel tests with 999 permutations, and r denotes the correlation coefficients from the Mantel tests.
Dow
nloa
ded
by [
Kev
in K
apus
cins
ki]
at 1
2:34
21
June
201
3

MUSKELLUNGE GENETICS 1087
ranged from 0.25 (Shoepack Lake; Miller et al. 2009)to 0.61 (Lac des Deux Montagnes, this study; Grind-stone Lake, Spude 2010) and averaged 0.54. This meanlevel of within-population variation is essentially equiva-lent to that reported for Yellow Perch in Lake Michigan(He = 0.54; Miller 2003) and Brook Trout Salvelinus fonti-nalis in Lake Superior (He = 0.55; Sloss et al. 2008b), but lessthan that reported for Lake Sturgeon in the upper Great Lakes(He = 0.63; DeHaan et al. 2006), Walleyes in the Great Lakes(He = 0.78; Stepien et al. 2009), and Lake Whitefish Coregonusclupeaformis in Lake Michigan (He = 0.64; VanDeHey et al.2009). On average, the within-population variation exhibited byMuskellunge is equal to that reported by DeWoody and Avise(2000) for 13 freshwater fish species (He = 0.54), so Muskel-lunge, and perhaps the Esocidae more generally, should not beconsidered to have low levels of genetic variation.
Management Implications and Research NeedsManagement plans for Muskellunge could focus on conserv-
ing individual populations, even those in close geographic prox-imity to each other within larger water bodies (e.g., Moon Riverand Severn Sound populations in Georgian Bay, Lake Huron),and protecting individual spawning and nursery habitats. Thesignificant spatial structuring of Muskellunge genetic resourcesin the Great Lakes, presence of private alleles in most popula-tions, and evidence of reproductive philopatry by esocids sug-gest that robust Muskellunge populations and individual spawn-ing and nursery habitats could be maintained as part of an effortto preserve the evolutionary potential of the species. Knowingwhether the reproductive philopatry exhibited by Muskellungeis actually natal or site fidelity following adulthood would helpfurther refine management plans for Muskellunge and their habi-tat, as suggested by Farrell et al. (2003). Although evidence sug-gestive of natal philopatry is mounting, this hypothesis has notbeen adequately tested, so the appropriate spatial scales for man-agement of spawning and nursery habitat remain unidentified.Research focused on obtaining movement data and genetic sam-ples from multiple geographically proximate spawning groups(e.g., within Georgian Bay or the Thousand Islands region ofthe St. Lawrence River) should be able to provide this criticalinformation, although obtaining adequate sample sizes will bea challenge. Until such a study is conducted, an approach thatindividually manages populations and fisheries and preserves allspawning and nursery habitats could be adopted to avoid lossesof genetic resources.
Our study identified three additional areas of research thatcould enhance the management of Muskellunge in the GreatLakes and our understanding of the historical distributionof this species. First, a more extensive genetic analysis ofMuskellunge from Buffalo Harbor and the upper and lowerNiagara River (with larger sample sizes) is needed to determineif Muskellunge from these three areas are truly geneticallysimilar or if the small sample sizes used in this study failed todetect more than one genetic unit. Second, an assessment is
needed to determine if stocking Muskellunge across populationboundaries has affected contemporary gene pools. For example,two brood sources (Indian River Spreads, north-central Michi-gan, and Lake St. Clair) were initially used for stocking GreenBay and its tributaries, but the effective contributions of eachsource to current populations are mostly unknown. Our resultsshow genetic dissimilarity between the Fox River and Lake St.Clair populations, suggesting that most Muskellunge sampledfrom the Fox River were progeny of broodstock captured fromthe Indian River Spreads (not sampled in this study), rather thanLake St. Clair. An in-depth analysis of source populations couldadequately address this issue and rule out the unlikely possibil-ity that remnant native Muskellunge persist—this is especiallyimportant because the majority of Muskellunge stocked intoGreen Bay since the program began in 1989 are progeny ofrecaptured stocked fish. Research is also needed to determineif the progeny of Chautauqua Lake (New York) and Stony Lake(Ontario) Muskellunge that were stocked into the Niagara andSt. Lawrence rivers, which contained naturally reproducing pop-ulations of native fish, successfully reproduced and contributedto contemporary populations. The Niagara River was stockedwith 408,000 fry during 1941–1955 that were progeny of Chau-tauqua Lake (New York) Muskellunge and 18,425 fingerlingsduring 1960–1974 that were progeny of Stony Lake (Ontario)Muskellunge (M. Wilkinson, New York State Department ofEnvironmental Conservation, personal communication). A totalof 1,236,076 Muskellunge from three size-classes (<50 mm,n = 553,800; 50–270 mm, n = 682,081; >270 mm, n = 195)were stocked into Quebec waters of the St. Lawrence River andits tributaries during 1950–1997 (Y. de Lafontaine, Environ-ment Canada, personal communication). Most of these stockedMuskellunge appear to have been progeny of Chautauqua Lake(New York) Muskellunge, but information on the origin ofstocked fish is incomplete. Information on the presence andextent of introgression between stocked and native Muskellungeis needed so managers can mitigate negative consequences(e.g., see Miller et al. 2009) and avoid propagating nonnativeMuskellunge within the Great Lakes. Finally, more extensivesampling of Muskellunge from throughout the Great Lakes andother drainages (i.e., the Ohio River, Mississippi River, HudsonBay, and Atlantic drainages) could elucidate which areas servedas glacial refugia and recolonization pathways. Understandingthe historical distribution and contemporary genetic spatialstructure of Muskellunge will help resource managers conservethe genetic resources of this important species.
Koppelman and Philipp (1986) stated that stocking Muskel-lunge into an established population may reduce fitness by irre-versibly disrupting locally adapted gene complexes. This warn-ing is repeatedly echoed in the fisheries literature (Crossman1984; Reisenbichler and Rubin 1999; Miller and Kapuscinski2003; Jennings et al. 2010). If one assumes that observationsof neutral (microsatellite) genetic diversity and spatial structureare indicative of adaptive variation in the genome, even at aremedial level, then our results strongly support these warnings.
Dow
nloa
ded
by [
Kev
in K
apus
cins
ki]
at 1
2:34
21
June
201
3

1088 KAPUSCINSKI ET AL.
Stocking Muskellunge across population boundaries into areascontaining native Muskellunge increases the risk of disruptingadaptive genetic diversity.
ACKNOWLEDGMENTSMany employees of the Thousand Islands Biological Station
and the New York State Department of Environmental Conser-vation assisted with tissue sample collection. Paul McKeownand Michael Wilkinson (New York State Department of Envi-ronmental Conservation) provided extensive logistical supportand help in the field. In addition, Arunas Liskauskas (OntarioMinistry of Natural Resources), David Rowe (Wisconsin De-partment of Natural Resources), Michael Thomas (MichiganDepartment of Natural Resources and Environment), and Si-mon Despatie and Yves de Lafontaine (Environment Canada)collected or coordinated the collection of Muskellunge tissuesamples. Numerous anglers, including members of the NiagaraMusky Association and Muskies Canada Gananoque and Thou-sand Islands Chapter, voluntarily submitted Muskellunge tissuesamples; Rich Clarke, Scott Kitchen, Josh Ketry, Greg Reynolds,John Kennedy, J-P Cloutier, Mike Lazarus, Rocky Gauthier,and Jim Hutchings made especially significant contributions.Ryan Franckowiak and Brandon Spude coordinated and con-ducted genotyping of Muskellunge tissue samples. This workwas funded by Federal Aid in Sport Fish Restoration Grants(most recently F-61-R) administered by the New York StateDepartment of Environmental Conservation and a grant fromthe Niagara River Greenway Ecological Fund Standing Com-mittee. This is a contribution of the Thousand Islands BiologicalStation. Any use of trade, firm, or product names is for descrip-tive purposes only and does not imply endorsement by the U.S.Government.
REFERENCESAllendorf, F. W., and G. Luikart. 2007. Conservation and the genetics of popu-
lations. Blackwell Scientific Publications, Malden, Massachusetts.Bosworth, A., and J. M. Farrell. 2006. Genetic divergence among Northern Pike
from spawning locations in the upper St. Lawrence River. North AmericanJournal of Fisheries Management 26:676–684.
Bryant, W. C., and K. D. Smith. 1988. The status of the Muskellunge in LakeSt. Clair, Michigan, 1978–86. Michigan Department of Natural Resources,Fisheries Research Report 1955, Lansing.
Casselman, J. M., C. J. Robinson, and E. J. Crossman. 1999. Growth and ultimatelength of Muskellunge from Ontario water bodies. North American Journalof Fisheries Management 19:271–290.
Crawford, N. G. 2010. SMOGD: software for the measurement of geneticdiversity. Molecular Ecology Resources 10:556–557.
Crossman, E. J. 1984. Introduction of exotic fishes into Canada. Pages 78–101in W. R. Courtenay Jr. and J. R. Stauffer Jr., editors. Distribution, biology,and management of exotic fishes. Johns Hopkins University Press, Baltimore,Maryland.
Crossman, E. J. 1990. Reproductive homing in Muskellunge, Esoxmasquinongy. Canadian Journal of Fisheries and Aquatic Sciences 47:1803–1812.
DeHaan, P. W., S. V. Libants, R. F. Elliott, and K. T. Scribner. 2006. Ge-netic population structure of remnant Lake Sturgeon populations in the upper
Great Lakes basin. Transactions of the American Fisheries Society 135:1478–1492.
DeWoody, J. A., and J. C. Avise. 2000. Microsatellite variation in marine,freshwater and anadromous fishes compared with other animals. Journal ofFish Biology 56:461–473.
Earl, D. A. 2010. Structure harvester v0.56.4. University of California, SantaCruz. Available: taylor0.biology.ucla.edu/struct harvest./ (November 2010).
Evanno, G., S. Regnaut, and J. Goudet. 2005. Detecting the number of clustersof individuals using the software STRUCTURE: a simulation study. MolecularEcology 14:2611–2620.
Excoffier, L., and H. E. L. Lischer. 2010. Arlequin suite ver 3.5: a new series ofprograms to perform population genetics analyses under Linux and Windows.Molecular Ecology Resources 10:564–567.
Excoffier, L., P. E. Smouse, and J. M. Quattro. 1992. Analysis of molecularvariance inferred from metric distances among DNA haplotypes: applicationto human mitochondrial DNA restriction data. Genetics 131:479–491.
Farrell, J. M. 2001. Reproductive success of sympatric Northern Pike andMuskellunge in an upper St. Lawrence River bay. Transactions of the Amer-ican Fisheries Society 130:796–808.
Farrell, J. M., R. Klindt, and J. M. Casselman. 2003. Update of the strategicplan for management of the St. Lawrence River Muskellunge population andsportfishery—phase III: 2003–2010. New York State Department of Environ-mental Conservation, Albany.
Farrell, J. M., R. M. Klindt, J. M. Casselman, S. R. LaPan, R. G. Werner,and A. Schiavone. 2007. Development, implementation, and evaluation of aninternational Muskellunge management strategy for the upper St. LawrenceRiver. Environmental Biology of Fishes 79:111–123.
Farrell, J. M., and R. G. Werner. 1999. Distribution, abundance, and survival ofage-0 Muskellunge in upper St. Lawrence River nursery bays. North Ameri-can Journal of Fisheries Management 19:309–320.
Farrell, J. M., R. G. Werner, S. R. LaPan, and K. A. Claypoole. 1996. Eggdistribution and spawning habitat of Northern Pike and Muskellunge in a St.Lawrence River marsh, New York. Transactions of the American FisheriesSociety 125:127–131.
Guo, S. W., and E. A. Thompson. 1992. Performing the exact test of Hardy–Weinberg proportion for multiple alleles. Biometrics 48:361–372.
Haas, R. C. 1978. The Muskellunge in Lake St. Clair. Pages 334–339 in R.L. Kendall, editor. Selected coolwater fishes of North America. AmericanFisheries Society, Special Publication 11, Bethesda, Maryland.
Hansen, M. M., J. B. Taggart, and D. Meldrup. 1999. Development of new VNTRmarkers for pike and assessment of variability at di- and tetranucleotide repeatmicrosatellite loci. Journal of Fish Biology 55:183–188.
Harrison, E. J., and W. F. Hadley. 1978. Ecologic separation of sympatricMuskellunge and Northern Pike. Pages 129–134 in R. L. Kendall, editor.Selected coolwater fishes of North America. American Fisheries Society,Special Publication 11, Bethesda, Maryland.
Hedrick, P. W. 2000. Genetics of populations. Jones and Bartlett Publishers,Boston.
IUCN (International Union for Conservation of Nature). 2011. About bio-diversity. IUCN, Gland, Switzerland. Available: www.iucn.org/iyb/about./(September 2011).
Jennings, M. J., G. R. Hatzenbeler, and J. M. Kampa. 2011. Spring capturesite fidelity of adult Muskellunge in inland lakes. North American Journal ofFisheries Management 31:461–467.
Jennings, M. J., B. L. Sloss, G. R. Hatzenbeler, J. M. Kampa, T. D. Simonson,S. P. Avelallemant, G. A. Lindenberger, and B. D. Underwood. 2010. Im-plementation of genetic conservation practices in a Muskellunge propagationand stocking program. Fisheries 35:388–395.
Jensen, J. L., A. J. Bohonak, and S. T. Kelley. 2005. Isolation by distance, webservice. BMC Genetics [online serial] 6:article 13.
Jost, L. 2008. GST and its relatives do not measure differentiation. MolecularEcology 17:4015–4026.
Kalinowski, S. T. 2005. HP-RARE 1.0: a computer program for performing rar-efaction on measures of allelic richness. Molecular Ecology Notes 5:187–189.
Dow
nloa
ded
by [
Kev
in K
apus
cins
ki]
at 1
2:34
21
June
201
3

MUSKELLUNGE GENETICS 1089
Kapuscinski, K. L., B. J. Belonger, S. Fajfer, and T. J. Lychwick. 2007. Pop-ulation dynamics of Muskellunge in Wisconsin waters of Green Bay, LakeMichigan, 1989–2005. Environmental Biology of Fishes 79:27–36.
Koppelman, J. B., and D. P. Philipp. 1986. Genetic applications in Muskellungemanagement. Pages 111–121 in G. E. Hall, editor. Managing muskies: atreatise on the biology and propagation of Muskellunge in North America.American Fisheries Society, Special Publication 15, Bethesda, Maryland.
Laikre, L., L. M. Miller, A. Palme; S. Palm, A. R. Kapuscinski, G. Thoresson,and N. Ryman. 2005. Spatial genetic structure of Northern Pike (Esox lucius)in the Baltic Sea. Molecular Ecology 14:1955–1964.
LaPan, S. R., A. Schiavone, and R. G. Werner. 1996. Spawning andpost-spawning movements of the St. Lawrence River Muskellunge (Esoxmasquinongy). Pages 73–82 in S. J. Kerr and C. H. Olver, editors. Managingmuskies in the ’90s: workshop proceedings. Ontario Ministry of Natural Re-sources, Southern Region Science and Technology Transfer Unit WorkshopProceedings WP-007, Kemptville.
Mantel, N. 1967. The detection of disease clustering and a generalized regressionapproach. Cancer Research 27:209–220.
Menz, F. C., and D. P. Wilton. 1983. An economic study of the Muskellungefishery in New York. New York Fish and Game Journal 30:12–29.
Miller, L. M. 2003. Microsatellite DNA loci reveal genetic structure of YellowPerch in Lake Michigan. Transactions of the American Fisheries Society132:503–513.
Miller, L. M., L. Kallemeyn, and W. Senanan. 2001. Spawning-site and natal-site fidelity by Northern Pike in a large lake: mark–recapture and geneticevidence. Transactions of the American Fisheries Society 130:307–316.
Miller, L. M., and A. R. Kapuscinski. 2003. Genetic guidelines for hatcherysupplementation programs. Pages 329–355 in E. M. Hallerman, editor. Popu-lation genetics: principles and applications for fisheries scientists. AmericanFisheries Society, Bethesda, Maryland.
Miller, L. M., S. W. Mero, and J. A. Younk. 2009. The genetic legacy of stockingMuskellunge in a northern Minnesota lake. Transactions of the AmericanFisheries Society 138:602–615.
Miller, L. M., and W. Senanan. 2003. A review of Northern Pike population ge-netics research and its implications for management. North American Journalof Fisheries Management 23:297–306.
Mooradian, S. R., J. L. Forney, and M. D. Staggs. 1986. Response of Muskel-lunge to establishment of Walleye in Chautauqua Lake, New York. Pages168–175 in G. E. Hall, editor. Managing muskies: a treatise on the biol-ogy and propagation of Muskellunge in North America. American FisheriesSociety, Special Publication 15, Bethesda, Maryland.
NYPA (New York Power Authority). 2005. Recreational fishing surveyof the upper Niagara River. NYPA, Niagara Power Project FERC2216, White Plains. Available: niagara.nypa.gov/StudyReports/FinalReports.htm#AcquaticResources. (April 2012).
NYSDEC (New York State Department of Environmental Conservation). 1994.Niagara River remedial action plan. NYSDEC, Albany.
Park, S. D. E. 2001. Trypanotolerance in West African cattle and the popula-tion genetic effects of selection. Doctoral dissertation. University of Dublin,Dublin.
Peakall, R., and P. E. Smouse. 2006. GENALEX 6: genetic analysis in Excel—population genetic software for teaching and research. Molecular EcologyNotes 6:288–295.
Pritchard, J. K., M. Stephens, and P. Donnelly. 2000. Inference of populationstructure using multilocus genotype data. Genetics 155:945–959.
Raymond, M., and F. Rousset. 1995a. An exact test for population differentia-tion. Evolution 49:1280–1283.
Raymond, M., and F. Rousset. 1995b. GENEPOP (version 1.2): population genet-ics software for exact tests and ecumenicism. Journal of Heredity 86:248–249.
Reisenbichler, R. R., and S. P. Rubin. 1999. Genetic changes from artificialpropagation of Pacific salmon affect the productivity and viability of supple-mented populations. ICES Journal of Marine Science 56:459–466.
Rice, W. R. 1989. Analyzing tables of statistical tests. Evolution 43:223–225.Scott, W. B., and E. J. Crossman. 1998. Freshwater fishes of Canada. Galt House
Publications, Oakville, Ontario.Senanan, W., and A. R. Kapuscinski. 2000. Genetic relationships among pop-
ulations of Northern Pike (Esox lucius). Canadian Journal of Fisheries andAquatic Sciences 57:391–404.
Simonson, T. D. 2008. Muskellunge management update. Wisconsin Depart-ment of Natural Resources, Publication FH-508-2008, Madison.
Sloss, B. L., R. P. Franckowiak, and E. L. Murphy. 2008a. Developmentof new microsatellite loci and multiplex reactions for Muskellunge (Esoxmasquinongy). Molecular Ecology Resources 8:811–813.
Sloss, B. L., M. J. Jennings, R. Franckowiak, and D. M. Pratt. 2008b. Geneticidentity of Brook Trout in Lake Superior south shore streams: potential forgenetic monitoring of stocking and rehabilitation efforts. Transactions of theAmerican Fisheries Society 137:1244–1251.
Spude, B. T. 2010. Contemporary stock structure of Muskellunge populations innorthern Wisconsin. Master’s thesis. University of Wisconsin–Stevens Point,Stevens Point.
Stepien, C. A., D. J. Murphy, R. N. Lohner, O. J. Sepulveda-Villet, and A. E.Haponski. 2009. Signatures of vicariance, postglacial dispersal and spawningphilopatry: population genetics of the Walleye Sander vitreus. MolecularEcology 18:3411–3428.
Strand, R. F. 1986. Identification of principal spawning areas and seasonaldistribution and movements of Muskellunge in Leech Lake, Minnesota. Pages62–73 in G. E. Hall, editor. Managing muskies: a treatise on the biology andpropagation of Muskellunge in North America. American Fisheries Society,Special Publication 15, Bethesda, Maryland.
Trautman, M. B. 1982. The fishes of Ohio, revised edition. Ohio State UniversityPress, Columbus.
VanDeHey, J. A., B. L. Sloss, P. J. Peeters, and T. M. Sutton. 2009. Geneticstructure of Lake Whitefish (Coregonus clupeaformis) in Lake Michigan.Canadian Journal of Fisheries and Aquatic Sciences 66:382–393.
Weir, B. S., and C. C. Cockerham. 1984. Estimating F-statistics for the analysisof population structure. Evolution 38:1358–1370.
Westin, L., and K. E. Limburg. 2002. Newly discovered reproductive isolationreveals sympatric populations of Esox lucius in the Baltic. Journal of FishBiology 61:1647–1652.
Whillans, T. H. 1979. Historic transformations of fish communities in threeGreat Lakes bays. Journal of Great Lakes Research 5:195–215.
Whillans, T. H. 1982. Changes in marsh area along the Canadian shore of LakeOntario. Journal of Great Lakes Research 8:570–577.
Wooster, M., and L. Matthies. 2008. Buffalo and Niagara rivers habitat assess-ment and conservation framework. Buffalo Niagara Riverkeeper, Buffalo,New York.
Wright, S. 1931. Evolution in Mendelian populations. Genetics 16:97–159.Zorn, S. A., T. L. Margenau, J. S. Diana, and C. J. Edwards. 1998. The influence
of spawning habitat on natural reproduction of Muskellunge in Wisconsin.Transactions of the American Fisheries Society 127:995–1005.
Dow
nloa
ded
by [
Kev
in K
apus
cins
ki]
at 1
2:34
21
June
201
3