genetic relationship among 36 genotypes of ceiba...
TRANSCRIPT

American Journal of Agriculture and Forestry 2016; 4(4): 86-96
http://www.sciencepublishinggroup.com/j/ajaf
doi: 10.11648/j.ajaf.20160404.13
ISSN: 2330-8583 (Print); ISSN: 2330-8591 (Online)
Genetic Relationship Among 36 Genotypes of Ceiba pentandra (L.) as Revealed by RAPD and ISSR Markers
Cosmas Sorngmenenye Abengmeneng1, *
, Daniel Ofori2, Philomena Kumapley
1, Richard Akromah
3,
Ramni Jamnadass4, Marian Quain
5
1Department of Silviculture and Forest Management, Kwame Nkrumah University of Science and Technology, Kumasi, Ghana 2Forestry Research Institute of Ghana, Council for Scientific and Industrial Research, Kumasi, Ghana 3Department of Crop and Soil Sciences, Kwame Nkrumah University of Science and Technology, Kumasi, Ghana 4International Centre for Research into Agroforestry, Nairobi, Kenya 5Crop Research Institute, Council for Scientific and Industrial Research, Kumasi, Ghana
Email address: [email protected] (C. S. Abengmeneng), [email protected] (D. Ofori), [email protected] (P. Kumapley),
[email protected] (R. Akromah), [email protected] (R. Jamnadass), [email protected] (M. Quain) *Corresponding author
To cite this article: Cosmas Sorngmenenye Abengmeneng, Daniel Ofori, Philomena Kumapley, Richard Akromah, Ramni Jamnadass, Marian Quain. Genetic
Relationship Among 36 Genotypes of Ceiba pentandra (L.) as Revealed by RAPD and ISSR Markers. American Journal of Agriculture and
Forestry. Vol. 4, No. 4, 2016, pp. 86-96. doi: 10.11648/j.ajaf.20160404.13
Received: May 25, 2016; Accepted: June 12, 2016; Published: July 23, 2016
Abstract: Ceiba pentandra (L.) Gaertn (trade name Ceiba) of the family Bombacaceae is an important multi-purpose tree
species in Ghana and demand for it is rising daily. As a result, it has been included as one of the species for the National Forest
Plantation Development Programme of Ghana as part of the efforts towards its restoration. Seedlings for the programme are being
raised from seed collected from the wild without regard for their genetic quality and its future adverse effects. The absence of
adequate information on the genetic diversity within the species therefore serves as a potential threat to its long term sustainable
management and efficient genetic conversation. The phylogenetic relationships of 36 genotypes of C. pentandra from natural
range of the species in five ecological zones (populations) of Ghana were therefore analyzed using 10 polymerase chain reaction
(PCR) markers (5 random amplified polymorphic DNAs (RAPDs) and 5 inter simple sequence repeats (ISSRs)). The principal
component analysis (PcoA) defined by axis 1 and 2 accounted for 67.15% of the variation observed. Cluster analysis using
GeneStat Discovery showed that, 14 (38.89%), 21 (58.33%) and 4 (11.11%) of the accessions had a coefficient of similarity of 1
from the RAPD, ISSR and the combined RAPD and ISSR polymorphism respectively. The most distantly related accessions from
the RAPD polymorphism analysis were BAW 1 and KON 8 with a similarity coefficient of 0.06 whereas those from the ISSR
polymorphism were BAW 10 and ASE 1 with 21% similarity between them. Similarly, BUF 1 and KUE 1 were the most
dissimilar accessions from the combined RAPD and ISSR fragments analysis with a similarity coefficient of 0.23. Nine (25%)
accessions with high degree of dissimilarity between them were identified in the study. These accessions could serve as good
candidates for conservation as seed trees and in breeding programs of C. pentandra in Ghana. Implications of the findings for
effective management of the genetic resources of the species were also discussed.
Keywords: Ceiba pentandra (L.), ISSR, RAPD, Genetic Diversity, Population, Genotypes
1. Introduction
Ceiba pentandra (L.) Gaertn, of the family Bombacaceae, is
a native species of the natural forests of tropical America and
tropical Asia [1, 2, 3]. It is commonly called the silk or kapok
tree and is known to have a pantropical distribution [4, 5]. The
wood is used in manufacturing plywood, domestic utensils,
drums, dugout canoes, and coffins [1, 2]. The fibre, commonly
called kapok, is used for stuffing cushions, pillows and
mattresses. It is also used in insulation, as absorbent material
and tinder. The gum is eaten to relieve stomach upset whereas

American Journal of Agriculture and Forestry 2016; 4(4): 86-96 87
the leaves and fruits are used as a laxative and infusion from
the leaf for colic treatment in both man and livestock [2]. C.
pentandra is gradually diminishing due to over exploitation in
Ghana and other parts of the world. For instance, populations
in the Peruvian and Brazilian Amazon have been reported to be
endangered due to over exploitation for plywood [6]. C.
pentandra has therefore been included as one of the species for
the National Forest Plantation Development Programme
(NFPDP) of Ghana as part of the efforts to ensure its
sustainable management. Seed for raising seedlings for the
programme are currently being collected from the wild without
regard for their genetic quality. The absence of knowledge on
the genetic diversity in the species could have adverse effects
on its survival and overall productivity in the future. High
levels of genetic variation provide the ability for tree species to
adjust to new environments, allowing local adaptation and the
migration of better-suited provenances along ecological
gradients [7]. As a result, genetic diversity conservation has
been designed to conserve the optimum amount of genetic
information in the present population for future use [8]. The
identification of genetic variation is therefore seen as an
essential tool for its conservation and management [9, 10, 11].
Again, genetic diversity is the first basic step in breeding
programme and therefore needs to be estimated accurately
[12]. DNA fingerprinting is one of the well known methods
that is used in the study of the extent of genetic diversity of
germplasm or cultivars as well as their specific classification.
DNA markers provide a powerful tool to quantify existing
levels of genetic variation in breeding and production
populations of forest trees [13]. Some of the techniques used
particularly when no genetic information is available include
RAPD [11, 14, 15, 16] and ISSR [10, 11, 17, 18] and the
combined analysis of RAPD and ISSR polymorphisms [11,
19]. MolecularThis study used DNA from progenies to
represent parental genotypes using two PCR based techniques;
RAPD and ISSR. These techniques are recommended for
species in which there is no prior availability of molecular
genetic information [11]. C. pentandra is a typical example of
this as this study pioneers its molecular work in Ghana. The
study has identified the level of genetic diversity among
accessions of C. pentandra in Ghana as well as genetically
unrelated ones for conservation as seed trees.
2. Materials and Methods
2.1. Plant Material Used
Matured fruits were collected from open-pollinated
individual trees (trees in which only one parent; the female, is
known) in the natural range of C. pentandra in Ghana. These
open-pollinated families were referred to as accessions and or
mother trees in this paper. An isolation distance of at least 100
metres was allowed between sampled trees to ensure that trees
with the same pedigrees were avoided. The seeds were
germinated and maintained under shed made from palm fronts
and the seedlings transplanted to the field at the age of five
months. Fresh leaves were collected from progenies of 36
accessions at twelve months after they were transplanted in the
field. The leaves were thoroughly but carefully washed with
distilled water and dried with tissue paper to rid off any
possible contaminants. A total of 200mg of fresh leaf were
taken using a cork borer. The discs were placed in labelled
1.5ml eppendoff tubes, frozen in liquid nitrogen and
transported to the biotechnology laboratory for DNA
extraction. The liquid nitrogen preservation was to keep the
samples fresh and prevents the DNA from degradation.
2.2. Genomic DNA Isolation
The genomic DNA extraction was done at the Crops
Research Institute (CRI), Fumesua-Kumasi, Ghana, of the
Council for Scientific and Industrial Research using the
modified DNA isolation method [20] and adopted by the CRI.
The DNA extraction buffer contained 1M of Tris-HCl (pH
8.0), 5M NaCl, 0.5M EDTA (pH 8.0), (10000mwt) poly vinyl
pirrolidone, 20% sarkosine, sodium metabisuphite, 10%
sodium ascorbate. 200mg of leaf tissue was weighed into 2ml
eppendorf tube and ground to fine powder with liquid nitrogen
and 800 µl of lysis buffer was used to lyses the nuclear
membrane. The lysis buffer contained 1M of Tris-HCl (pH
8.0), 5M NaCl, 0.5M EDTA (pH 8.0), (10000mwt) poly vinyl
pirrolidone, 20% sarkosine, sodium metabisuphite, 10%
sodium ascorbate. The protein contaminates were removed
using 400µl of 5M potassium acetate ([20] used 800µl of
phenol chloroform isoamyl alcohol) and entrifugation at
1300rpm for 15 minutes. The DNA was precipitated and
centrifuged at 13000rpm for 10 minutes. The RNA component
was also removed by adding 4µl RNase A and incubated at
37°C. DNA purification and recovery was carried out using
700µl isopropanol and 80% alcohol. DNA pellets were then
dried at room temperature and dissolved in 200µl of 1 X TBE
buffer. DNA quality and quantity were determined on 0.8%
agarose gel using a 100bp standard DNA ladder as a reference.
2.3. RAPD and ISSR Amplification and Detection of PCR
Products
A total number of 45 RAPD and 10 ISSR primers
(Invitrogen, UK) were screened using randomly selected
DNA samples. From the preliminary screening, 5 of the
RAPD and 5 of the ISSR primers were highly reproducible
and amplified with distinct and visible bands. These were
selected for further examination of all the C. pentandra DNA
samples. In performing the PCR, premix for genomic DNA
was prepared using 1ul of 10x buffer, 0.2цl Taq polymerase
(Industricod, South Africa), 0.9 1цl 25mM MgCl2, 0.4цl
10mM dNTPs, 0.5цl of each primer, 6цl nuclease free water,
1цl DNA (10ng/цl) which added up to a total reaction
volume of 10цl. 10цl of nuclease free water was used as a
control. The thermal cycler, (GenAmp PCR System 9700,
version 3.09, Applied Biosystems), was programmed for 30
cycles and was run 2 hours, 27 minutes and 2 seconds. Initial
denaturation was 3 minutes at 94°C, followed by 30 cycles of
1 minute at 94°C, 1 minute at 48°C, 1 minute at 72°C and 7
minutes final extension step at 72°C. The hold temperature

88 Cosmas Sorngmenenye Abengmeneng et al.: Genetic Relationship Among 36 Genotypes of
Ceiba pentandra (L.) as Revealed by RAPD and ISSR Markers
was set at 4°C. The amplified PCR products were analyzed
using the principle of electrophoresis on 2% agarose gels
stained with ethidium bromide in a horizontal gel casting tray
(BioRad, UK Ltd). DNA samples from all the 36 accessions
were loaded in separate lanes on the gel and repeated for all
the 5 RAPD and 5 ISSR reproducible primers. Differences
between accessions were detected based on the relative
movement of their DNA fragments in the electric field
provided by the process. The rate of DNA migration is
dependent on their fragment size. Hence, variability among
accessions was determined by the positions of their
respective DNA fragments on the gel in comparison with
standard 100bp DNA size maker. Amplified DNA loci were
manually scored as present (1) or absent (0) for each primer
and a bi-variate 1-0 data matrix generated. Every scorable
band was considered as a single locus/allele. Variations in
band presence were recorded as polymorphisms.
2.4. Data Analysis
The similarity and dissimilarity matrices were computed
using GenStat Discovery (Edition 3) using the Euclidean test
option. The RAPD and ISSR polymorphism were analyzed
separately. Data from the two techniques were also combined
and analyzed. Combining RAPD and ISSR data allows a
larger portion of the genome to be sampled resulting in more
robust conclusion than the individual techniques [11].
Dendrograms using Unweighted Pair Group of Arithmetic
Means (UPGMA) accessions based on Nei’s standard genetic
distances [21] generated by GenStat Discovery (Edition 3).
The strength of the dendrograms nodes were estimated with a
bootstrap analysis using 10000 permutations. This was done
to enable the global genetic relationships among accessions
to be observed. Principal coordinate analysis (PCoA) was
done with this same analytical tool. Pair-wise genetic
distances were calculated using UPGMA procedure [22] with
GenStat Discovery (Edition 3) as GD=1-dxy/dx+dy-dxy.
Where: GD = Genetic distance between two accessions, dxy
= total number of common loci (bands) in two accessions, dx
= total number of loci (bands) in accession 1 and dy = total
numbers of loci (bands) in accession 2.
3. Results
3.1. Genetic Diversity as Revealed by RAPD Analysis
Coefficient of similarity
Fig. 1. Dendrogram showing relationships among 36 accessions of C. pentandra based on RAPD polymorphism. See table A1 for similarity matrix used for
the construction of the dendrogram.
Key: DI = Dry Semi-deciduous Forest Zone-Inner, DO = Dry Semi-deciduous Forest Zone- Outlier, MS = Moist Semi-deciduous Forest Zone, M/W =
Moist/Wet Evergreen Forest Zone, GSZ = Guinea Savanna Zone.

American Journal of Agriculture and Forestry 2016; 4(4): 86-96 89
Association among the 36 accessions revealed by UPGMA
cluster analysis is shown in Figure 1. The accessions were
clustered into two major groups, A and B at a similarity
coefficient of 0.5. Cluster A had two sub-clusters (A1 and A2)
likewise cluster B (B1 and B2) at a similarity coefficient of
0.64 and 0.65, respectively. All groups contained accessions
from the entire range of the species. The genetic similarity
revealed among the accessions ranged from 0.06 to 1 (Table
A1). Fourteen (38.89%) of the accessions, representing all
the five ecological zones, had a coefficient of similarity of 1
(Fig. 1). The most diverged accessions were BAW 1 and
KON 8 with 94% dissimilarity. This was followed by 88%
dissimilarity between accessions NKA 1 and KON 8, ACH 1
and KON 8, MAA 1 and KON 8, KEC 1 and BAW 5, and
between BAW 4 and BAW 5 (Tables A1). Two accessions,
KUE 3 and BAW 5, were unique among the 36 screened.
3.2. Genetic Diversity as Revealed by ISSR Analysis
Figure 2 shows the association among accessions based on
UPGMA cluster analysis of ISSR polymorphism. The
dendrogram contained two major clusters, C and D. Cluster
C contained four subclusters (C1-C4). The similarity
coefficient ranged from 1 to 0.21 (Tables A2) with 21
(58.33%) of the accessions having a coefficient of similarity
of 1. These accessions are duplicates and only one could be
selected at a time. Accessions BAW 10 and ASE 1 were the
most unrelated among the 36 with about 79% dissimilarity
between them.
Coefficient of similarity
Fig. 2. Dendrogram showing the genetic relationships among 36 accessions of C. pentandra based on ISSR olymorphism. See table A2 for similarity matrix
used for the construction of the dendrogram.
Key: DI = Dry Semi-deciduous Forest Inner Zone, DO = Dry Semi-deciduous Forest Zone- Outlier, MSFZ = Moist Semi-deciduous Forest Zone, M/W =
Moist/Wet Evergreen Forest Zone, GSZ = Guinea Savanna Zone
3.3. Genetic Diversity as Revealed by the Combined RAPD
and ISSR Analysis
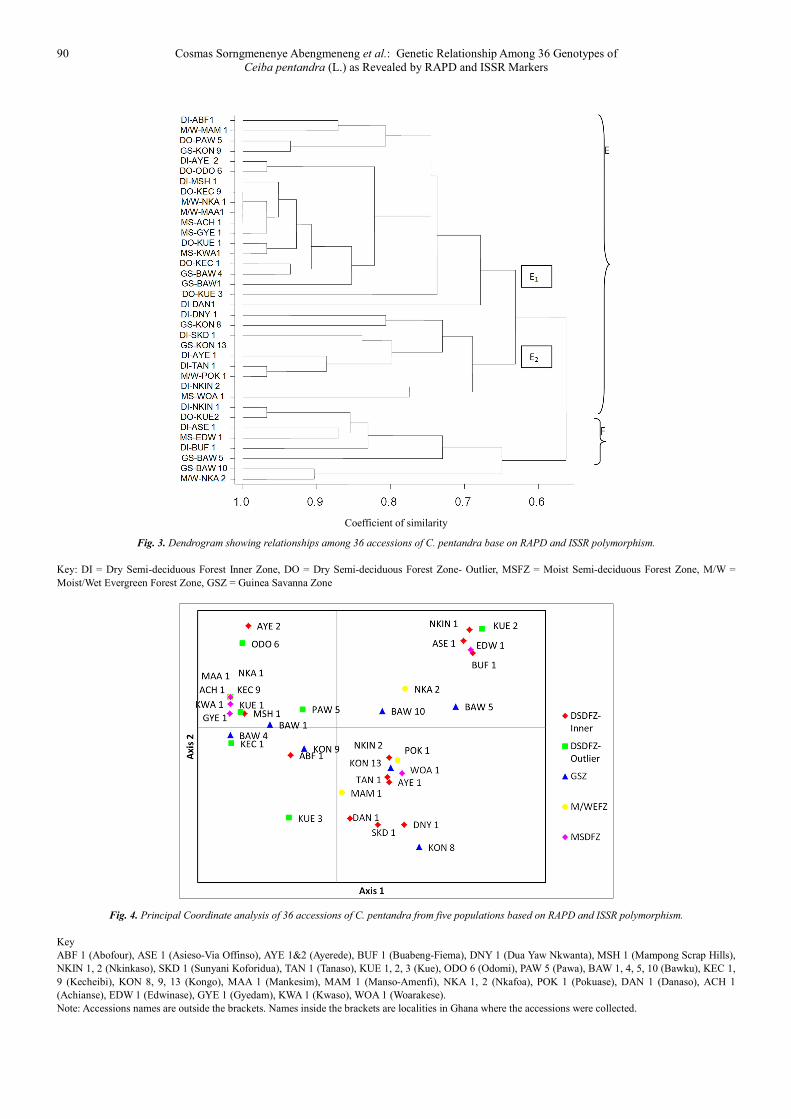
The dendrogram showed two clusters at a coefficient of
similarity of 0.6: the more diverse group E and the less
diverse Group F (Fig. 3). Cluster E had two sub-clusters, E1
and E2, at a similarity coefficient of 0.62. Similarity
coefficient ranged from 1 to 0.23with 4 (11.11%) of the
accessions having a similarity coefficient of 1 and are
duplicates. Accessions BUF 1 and KUE 1 had the highest
degree of dissimilarity of 77%. Four accessions, BAW 1,
KUE 3, DAN 1 and BAW 5, were very unique among the 36.
Like the results from the RAPD and ISSR analysis, variation
among accessions as revealed by the combined data of
RAPD and ISSR was neither population- structured nor
followed any known pattern. The principal component
analysis (PcoA) defined by axis 1 and 2 accounted for
67.15% of the variation observed (Fig. 4).
90 Cosmas Sorngmenenye Abengmeneng et al.: Genetic Relationship Among 36 Genotypes of
Ceiba pentandra (L.) as Revealed by RAPD and ISSR Markers
Coefficient of similarity
Fig. 3. Dendrogram showing relationships among 36 accessions of C. pentandra base on RAPD and ISSR polymorphism.
Key: DI = Dry Semi-deciduous Forest Inner Zone, DO = Dry Semi-deciduous Forest Zone- Outlier, MSFZ = Moist Semi-deciduous Forest Zone, M/W =
Moist/Wet Evergreen Forest Zone, GSZ = Guinea Savanna Zone
Fig. 4. Principal Coordinate analysis of 36 accessions of C. pentandra from five populations based on RAPD and ISSR polymorphism.
Key
ABF 1 (Abofour), ASE 1 (Asieso-Via Offinso), AYE 1&2 (Ayerede), BUF 1 (Buabeng-Fiema), DNY 1 (Dua Yaw Nkwanta), MSH 1 (Mampong Scrap Hills),
NKIN 1, 2 (Nkinkaso), SKD 1 (Sunyani Koforidua), TAN 1 (Tanaso), KUE 1, 2, 3 (Kue), ODO 6 (Odomi), PAW 5 (Pawa), BAW 1, 4, 5, 10 (Bawku), KEC 1,
9 (Kecheibi), KON 8, 9, 13 (Kongo), MAA 1 (Mankesim), MAM 1 (Manso-Amenfi), NKA 1, 2 (Nkafoa), POK 1 (Pokuase), DAN 1 (Danaso), ACH 1
(Achianse), EDW 1 (Edwinase), GYE 1 (Gyedam), KWA 1 (Kwaso), WOA 1 (Woarakese).
Note: Accessions names are outside the brackets. Names inside the brackets are localities in Ghana where the accessions were collected.

American Journal of Agriculture and Forestry 2016; 4(4): 86-96 91
4. Discussion
First, clusters in all the dendrograms contained accessions
from different ecological zones. Thus, accessions were not
structured by populations or any known pattern. The RAPD
markers showed 14 accessions (38.89%) are genetically
similar (Fig. 1). The ISSR markers gave the highest number
of accessions, 21 (58.33%), with similarity coefficient of 1
(Fig. 2). The combined RAPD and ISSR makers gave the
least with only four accessions (11.11%) having a similarity
coefficient of 1 out of the 36 accessions studied (Fig. 3). The
most distantly related accessions were BAW 1 and KON 8
with 94% dissimilarity as revealed by the RAPD fragments
(Table A1). This was followed by 79% dissimilarity between
BAW 10 and ASE 1 from the ISSR analysis (Tables A2). The
combined RAPD and ISSR, on the other hand, revealed BUF
1 and KUE 1 to be the least similar with 77% dissimilarity.
The three dendrographs present several ways in which
selection of genetically unrelated accessions could be made.
Accessions with coefficient of similarity of one are duplicates
and only one should be preferred at a time. For instance, the
accessions AYE 2, ODO 6, KEC 9, NKA 1, MAA 1, ACH 1,
BAW 1, KWA 1, ASE 1, EDW 1, TAN 1, POK 1, BAW 10 and
NKA 2, are all duplicates based on the RAPD polymorphism
and only one should be taken (Fig. 1). Likewise, the 21
accessions, ABF 1, MSH 1, KUE 1, KEC 1, KEC 9, BAW 4,
NKA 1, MAA1, KWA 1, ACH 1, GYE 1, ODO 6, PAW 5,
KON 9, AYE 1, BAW 1, KUE 3, MAM 1, NKIN 1, BUF 1,
and KUE 2 are duplicates, based on the ISSR polymorphism
(Fig. 2). Again, the four accessions, KEC 9, NKA 1, MAA1
and ACH 1 are duplicates, based on the combined RAPD and
ISSR polymorphism (Fig. 3). All the three techniques, RAPD,
ISSR and the combined RAPD and ISSR show that two
accessions; DNY 1 and SKD 1 were truly unrelated. It was
therefore suggested that much priority be given to these
accessions in the conservation programme of C. pentandra.
The PCA which accounted for 67.17% of the total variation in
axis 1 and axis 2 showed some uniqueness in 13 accessions
(36.11%). These included AYE 2, ODO 6, PAW5 and BAW 1
(first quadrant; top left on PCA chart), NKA 2, BAW 10 and
BAW 5 (second quadrant; top right on PCA chart), DAN 1,
MAM 1, DNY 1, KON 8 and SKD 1 (third quadrant; bottom
right on PCA chart) and KUE 3 (forth quadrant; bottom left on
PCA chart) as shown in Figure 4.
Three of these accessions, KON 8, BUF 1 and KUE 1,
from the three dendrograms and seven from the PCA: KON8,
ODO 6, MAM 1, DNY 1, SKD 1, NKA 2 and DAN 1, were
previously identified to have the potential of giving a future
gain when selected [23]. This means only nine accessions
(25%) out of the 36 tested were useful in the sustainable
management of C. pentandra. This number is woefully
inadequate and calls for the need for further studies in this
subject matter to ensure the identification and maintenance of
broad genetic base among the remnant populations of C.
pentandra. The number of genetically related accessions,
38.89% (RAPD), 58.33% (ISSR) and 11.11% (combined
RAPD and ISSR), suggests possible genetic erosion in the
species and calls for gene conservation methods to put in
place, timely. It is also an indication that self-pollination in
C. pentandra may be higher than that of cross-pollination and
hence increasing the chances of inbreeding depression. Thus,
the current rate of extraction of this species may be
unfavourable to pollinator movement resulting in reduced
inter-tree pollination efficiency and out-crossing rates. The
adverse effects of inbreeding depression are many including
increased fecundity, embryo abortion, limited fruit set,
reduced seed yield, lower germination rates, lower seedling
vigour and poor growth form leading to poor productivity at
maturity [24, 25]. Inbreeding depression can cause
population and/or species extinction [26, 27]. Evolutionary
forces such as genetic drift and natural selection pressure
have been reported to be the main factor accounting for the
variability observed in 20 accessions of Monodora myristica
in South Eastern Nigeria [28]. The low genetic variation
among accessions has serious implications on the
management of the genetic resources of C. pentandra. It is an
indication that the current methods of germplasm exchange
and management of the species have high risk on its
sustainable utilization and conservation. Hence, the current
practice of collecting seed from the wild with unknown
genetic quality for use in plantations under the National
Forest Plantation Development Programme should be
reviewed. It is also suggested that all the plantations that
have been established with unscreened planting stock need to
be screened and individuals of poor genetic integrity
uprooted. Furthermore, genetic screening should be
extensively conducted in all the ecological zones of Ghana
for more trees of high genetic quality to be identified and
preserved as seed trees. Again, genetic diversity is the first
basic step in breeding
5. Conclusion
C. pentandra is a fast growing-pioneer species and can
grow in all the forest zones of Ghana including those with
low soil fertility. This makes it a potentially important
species for forest regeneration and timber production on
disturbed lands. It is particularly successful at colonizing
highly disturbed areas. C. pentandra in Ghana constitutes a
rich source of biodiversity and conservation and utilization
requires a good knowledge on its genetic diversity and
characterization. This could assist in the understanding of its
evolutionary history and response to environmental changes
as well as the mechanisms of its local spread and adaptation.
The study showed that genetic diversity in C. pentandra is
dependent on the degree of germplasm exchange. It is
therefore advisable that sampling for conservation and
plantation establishment be concentrated on selecting
unrelated accessions from the entire range of the species.
However, the few accessions identified in the study to have
good genetic diversity, is a concern to the sustainability of
the species. There is therefore the need to further study,

92 Cosmas Sorngmenenye Abengmeneng et al.: Genetic Relationship Among 36 Genotypes of
Ceiba pentandra (L.) as Revealed by RAPD and ISSR Markers
identify and preserve a broad genetic diversity in C.
pentandra. The findings of this study are therefore
recommendable to all stakeholders in the forestry industry
especially those using C. pentandra as a major species in
their plantation development projects.
Acknowledgment
We are very grateful to the International Foundation for
Science (IFS), the Kwame Nkrumah University of Science
and Technology (KNUST) and the Tropenbos International-
Ghana for providing financial support to this work. We
acknowledge Mrs Theresa Peprah of the Forestry Research
Institute of Ghana for all the support she provided to make
this work a success. We also thank the technicians of the
Molecular Laboratories of both the Forestry Research
Institute of Ghana (FORIG) and the Crops Research Institute,
all of the Council for Scientific and Industrial Research
(CSIR), for their co-operation and assistance.
Appendix
Table A1. Matrix of genetic distances obtained from the RAPD data and used to generate the dendrogram shown in Fig. 1.
DI-
AB
F 1
DI-
DN
Y 1
DI-
DA
N 1
DI-
NK
IN 1
DI-
BU
F 1
DI-
AS
E 1
DI-
SK
D 1
DI-
AY
E 1
DI-
AY
E 2
DI-
NK
IN 2
DI-
TA
N 1
DI-
MS
H 1
DO
-KU
E 2
DO
-KU
E 1
DO
-OD
O 6
DO
-KU
E 3
DO
-PA
W 5
DO
-KE
C 1
DI-ABF 1 1
DI-DNY 1 0.65 1
DI-DAN 1 0.71 0.71 1
DI-NKIN 1 0.59 0.82 0.65 1
DI-BUF 1 0.53 0.76 0.59 0.71 1
DI-ASE 1 0.59 0.82 0.53 0.88 0.82 1
DI-SKD 1 0.65 0.76 0.71 0.71 0.65 0.71 1
DI-AYE 1 0.76 0.76 0.59 0.71 0.76 0.82 0.76 1
DI-AYE 2 0.76 0.41 0.47 0.35 0.29 0.35 0.41 0.53 1
DI-NKIN 2 0.65 0.76 0.59 0.71 0.76 0.71 0.53 0.76 0.41 1
DI-TAN 1 0.76 0.65 0.59 0.71 0.65 0.71 0.88 0.88 0.53 0.65 1
DI-MSH 1 0.82 0.47 0.53 0.41 0.35 0.41 0.47 0.59 0.94 0.47 0.59 1
DO-KUE 2 0.53 0.76 0.59 0.94 0.76 0.94 0.76 0.76 0.29 0.65 0.76 0.35 1
DO-KUE 1 0.65 0.41 0.59 0.47 0.18 0.35 0.53 0.41 0.88 0.29 0.53 0.82 0.41 1
DO-ODO 6 0.76 0.41 0.47 0.35 0.29 0.35 0.41 0.53 1 0.41 0.53 0.94 0.29 0.88 1
DO-KUE 3 0.65 0.41 0.71 0.35 0.41 0.24 0.53 0.41 0.65 0.53 0.53 0.71 0.29 0.65 0.65 1
DO-PAW 5 0.94 0.59 0.76 0.65 0.47 0.53 0.71 0.71 0.71 0.59 0.82 0.76 0.59 0.71 0.71 0.71 1
DO-KEC 1 0.59 0.35 0.65 0.29 0.35 0.18 0.47 0.35 0.82 0.35 0.47 0.76 0.24 0.82 0.82 0.82 0.65 1
DO-KEC 9 0.76 0.41 0.47 0.35 0.29 0.35 0.41 0.53 1 0.41 0.53 0.94 0.29 0.88 1 0.65 0.71 0.82
GS-BAW 4 0.59 0.24 0.53 0.29 0.24 0.18 0.35 0.35 0.82 0.47 0.47 0.76 0.24 0.82 0.82 0.82 0.65 0.88
GS-KON 13 0.71 0.71 0.65 0.76 0.59 0.76 0.94 0.82 0.47 0.59 0.94 0.53 0.82 0.59 0.47 0.47 0.76 0.41
GS-BAW 5 0.53 0.65 0.47 0.71 0.65 0.82 0.65 0.76 0.29 0.53 0.65 0.35 0.76 0.29 0.29 0.18 0.47 0.12
GS-KON 8 0.35 0.71 0.53 0.65 0.82 0.76 0.59 0.59 0.12 0.71 0.47 0.18 0.71 0.12 0.12 0.35 0.29 0.18
GS-BAW 1 0.71 0.35 0.53 0.41 0.24 0.29 0.47 0.47 0.94 0.35 0.59 0.88 0.35 0.94 0.94 0.71 0.76 0.88
GS-BAW 10 0.65 0.65 0.47 0.82 0.76 0.82 0.76 0.76 0.41 0.65 0.88 0.47 0.88 0.41 0.41 0.41 0.71 0.35
GS-KON 9 0.82 0.59 0.88 0.53 0.59 0.41 0.71 0.59 0.59 0.59 0.71 0.65 0.47 0.59 0.59 0.82 0.88 0.76
M/W-MAM 1 0.88 0.76 0.82 0.71 0.53 0.71 0.65 0.76 0.65 0.65 0.65 0.71 0.65 0.65 0.65 0.53 0.82 0.47
M/W-NKA 1 0.76 0.41 0.47 0.35 0.29 0.35 0.41 0.53 1 0.41 0.53 0.94 0.29 0.88 1 0.65 0.71 0.82
M/W-MAA 1 0.76 0.41 0.47 0.35 0.29 0.35 0.41 0.53 1 0.41 0.53 0.94 0.29 0.88 1 0.65 0.71 0.82
M/W-NKA 2 0.65 0.65 0.47 0.82 0.76 0.82 0.76 0.76 0.41 0.65 0.88 0.47 0.88 0.41 0.41 0.41 0.71 0.35
M/W-POK 1 0.76 0.65 0.59 0.71 0.65 0.71 0.88 0.88 0.53 0.65 1 0.59 0.76 0.53 0.53 0.53 0.82 0.47
MS-EDW 1 0.59 0.82 0.53 0.88 0.82 1 0.71 0.82 0.35 0.71 0.71 0.41 0.94 0.35 0.35 0.24 0.53 0.18
MS-KWA 1 0.71 0.35 0.53 0.41 0.24 0.29 0.47 0.47 0.94 0.35 0.59 0.88 0.35 0.94 0.94 0.71 0.76 0.88
MS-ACH 1 0.76 0.41 0.47 0.35 0.29 0.35 0.41 0.53 1 0.41 0.53 0.94 0.29 0.88 1 0.65 0.71 0.82
MS-WOA 1 0.65 0.76 0.71 0.71 0.65 0.71 0.53 0.65 0.41 0.88 0.53 0.47 0.65 0.41 0.41 0.53 0.59 0.35
MS-GYE 1 0.71 0.35 0.53 0.29 0.35 0.29 0.35 0.47 0.94 0.47 0.47 0.88 0.24 0.82 0.94 0.71 0.65 0.88

American Journal of Agriculture and Forestry 2016; 4(4): 86-96 93
Table A1. Continued. Matrix of genetic distances obtained from the ISSR data and used to generate the dendrogram shown in Fig. 1.
DO
-KE
C 9
GS
-BA
W 4
GS
-KO
N 1
3
GS
-BA
W 5
GS
-KO
N 8
GS
-BA
W 1
GS
-BA
W 1
0
GS
-KO
N 9
M/W
-MA
M 1
M/W
-NK
A 1
M/W
-MA
A 1
M/W
-NK
A 2
M/W
-PO
K 1
MS
-ED
W 1
MS
-KW
A 1
MS
-AC
H 1
MS
-WO
A 1
MS
-GY
E 1
DI-ABF 1
DI-DNY 1
DI-DAN 1
DI-NKIN 1
DI-BUF 1
DI-ASE 1
DI-SKD 1
DI-AYE 1
DI-AYE 2
DI-NKIN 2
DI-TAN 1
DI-MSH 1
DO-KUE 2
DO-KUE 1
DO-ODO 6
DO-KUE 3
DO-PAW 5
DO-KEC 1
DO-KEC 9 1
GS-BAW 4 0.82 1
GS-KON 13 0.47 0.41 1
GS-BAW 5 0.29 0.12 0.71 1
GS-KON 8 0.12 0.18 0.53 0.71 1
GS-BAW 1 0.94 0.88 0.53 0.24 0.06 1
GS-BAW 10 0.41 0.35 0.82 0.65 0.59 0.47 1
GS-KON 9 0.59 0.65 0.65 0.35 0.41 0.65 0.59 1
M/W-MAM 1 0.65 0.47 0.71 0.65 0.47 0.59 0.53 0.71 1
M/W-NKA 1 1 0.82 0.47 0.29 0.12 0.94 0.41 0.59 0.65 1
M/W-MAA 1 1 0.82 0.47 0.29 0.12 0.94 0.41 0.59 0.65 1 1
M/W-NKA 2 0.41 0.35 0.82 0.65 0.59 0.47 1 0.59 0.53 0.41 0.41 1
M/W-POK 1 0.53 0.47 0.94 0.65 0.47 0.59 0.88 0.71 0.65 0.53 0.53 0.88 1
MS-EDW 1 0.35 0.18 0.76 0.82 0.76 0.29 0.82 0.41 0.71 0.35 0.35 0.82 0.71 1
MS-KWA 1 0.94 0.88 0.53 0.24 0.06 1 0.47 0.65 0.59 0.94 0.94 0.47 0.59 0.29 1
MS-ACH 1 1 0.82 0.47 0.29 0.12 0.94 0.41 0.59 0.65 1 1 0.41 0.53 0.35 0.94 1
MS-WOA 1 0.41 0.47 0.59 0.53 0.71 0.35 0.53 0.59 0.76 0.41 0.41 0.53 0.53 0.71 0.35 0.41 1
MS-GYE 1 0.94 0.88 0.41 0.24 0.18 0.88 0.35 0.65 0.59 0.94 0.94 0.35 0.47 0.29 0.88 0.94 0.47 1
Table A2. Matrix of genetic distances obtained from the ISSR data and used to generate the dendrogram shown in Fig. 2.
DI-
AB
F 1
DI-
DN
Y 1
DI-
DA
N 1
DI-
NK
IN 1
DI-
BU
F 1
DI-
AS
E 1
DI-
SK
D 1
DI-
AY
E 1
DI-
AY
E 2
DI-
NK
IN 2
DI-
TA
N 1
DI-
MS
H 1
DO
-KU
E 2
DO
-KU
E 1
DO
-OD
O 6
DO
-KU
E 3
DO
-PA
W 5
DO
-KE
C 1
DI-ABF 1 1
DI-DNY 1 0.71 1
DI-DAN 1 0.71 0.71 1
DI-NKIN 1 0.29 0.43 0.43 1
DI-BUF 1 0.29 0.43 0.43 1 1
DI-ASE 1 0.36 0.5 0.36 0.79 0.79 1
DI-SKD 1 0.79 0.93 0.64 0.36 0.36 0.43 1
DI-AYE 1 0.79 0.93 0.64 0.5 0.5 0.57 0.86 1
DI-AYE 2 0.79 0.5 0.64 0.5 0.5 0.57 0.57 0.57 1
DI-NKIN 2 0.71 0.71 0.57 0.57 0.57 0.64 0.64 0.79 0.79 1
DI-TAN 1 0.71 0.86 0.71 0.57 0.57 0.5 0.79 0.93 0.5 0.71 1
DI-MSH 1 1 0.71 0.71 0.29 0.29 0.36 0.79 0.79 0.79 0.71 0.71 1
DO-KUE 2 0.29 0.43 0.43 1 1 0.79 0.36 0.5 0.5 0.57 0.57 0.29 1
DO-KUE 1 1 0.71 0.71 0.29 0.29 0.36 0.79 0.79 0.79 0.71 0.71 1 0.29 1
DO-ODO 6 0.86 0.57 0.57 0.43 0.43 0.5 0.64 0.64 0.93 0.86 0.57 0.86 0.43 0.86 1
DO-KUE 3 0.86 0.86 0.71 0.43 0.43 0.5 0.79 0.93 0.64 0.86 0.86 0.86 0.43 0.86 0.71 1
DO-PAW 5 0.86 0.57 0.57 0.43 0.43 0.5 0.64 0.64 0.93 0.86 0.57 0.86 0.43 0.86 1 0.71 1
DO-KEC 1 1 0.71 0.71 0.29 0.29 0.36 0.79 0.79 0.79 0.71 0.71 1 0.29 1 0.86 0.86 0.86 1

94 Cosmas Sorngmenenye Abengmeneng et al.: Genetic Relationship Among 36 Genotypes of
Ceiba pentandra (L.) as Revealed by RAPD and ISSR Markers
D
I-A
BF
1
DI-
DN
Y 1
DI-
DA
N 1
DI-
NK
IN 1
DI-
BU
F 1
DI-
AS
E 1
DI-
SK
D 1
DI-
AY
E 1
DI-
AY
E 2
DI-
NK
IN 2
DI-
TA
N 1
DI-
MS
H 1
DO
-KU
E 2
DO
-KU
E 1
DO
-OD
O 6
DO
-KU
E 3
DO
-PA
W 5
DO
-KE
C 1
DO-KEC 9 1 0.71 0.71 0.29 0.29 0.36 0.79 0.79 0.79 0.71 0.71 1 0.29 1 0.86 0.86 0.86 1
GS-BAW 4 1 0.71 0.71 0.29 0.29 0.36 0.79 0.79 0.79 0.71 0.71 1 0.29 1 0.86 0.86 0.86 1
GS-KON 13 0.64 0.79 0.64 0.5 0.5 0.57 0.71 0.71 0.71 0.93 0.64 0.64 0.5 0.64 0.79 0.79 0.79 0.64
GS-BAW 5 0.5 0.64 0.5 0.79 0.79 0.57 0.57 0.71 0.29 0.5 0.79 0.5 0.79 0.5 0.36 0.64 0.36 0.5
GS-KON 8 0.79 0.93 0.79 0.36 0.36 0.43 0.86 0.86 0.57 0.79 0.79 0.79 0.36 0.79 0.64 0.93 0.64 0.79
GS-BAW 1 0.79 0.93 0.64 0.5 0.5 0.57 0.86 1 0.57 0.79 0.93 0.79 0.5 0.79 0.64 0.93 0.64 0.79
GS-BAW 10 0.86 0.57 0.71 0.43 0.43 0.21 0.64 0.64 0.64 0.57 0.71 0.86 0.43 0.86 0.71 0.71 0.71 0.86
GS-KON 9 0.86 0.57 0.57 0.43 0.43 0.5 0.64 0.64 0.93 0.86 0.57 0.86 0.43 0.86 1 0.71 1 0.86
M/W-MAM 1 0.86 0.86 0.71 0.43 0.43 0.5 0.79 0.93 0.64 0.86 0.86 0.86 0.43 0.86 0.71 1 0.71 0.86
M/W-NKA 1 1 0.71 0.71 0.29 0.29 0.36 0.79 0.79 0.79 0.71 0.71 1 0.29 1 0.86 0.86 0.86 1
M/W-MAA 1 1 0.71 0.71 0.29 0.29 0.36 0.79 0.79 0.79 0.71 0.71 1 0.29 1 0.86 0.86 0.86 1
M/W-NKA 2 0.64 0.5 0.64 0.5 0.5 0.29 0.57 0.43 0.43 0.36 0.5 0.64 0.5 0.64 0.5 0.5 0.5 0.64
M/W-POK 1 0.64 0.79 0.64 0.64 0.64 0.43 0.71 0.86 0.43 0.64 0.93 0.64 0.64 0.64 0.5 0.79 0.5 0.64
MS-EDW 1 0.36 0.5 0.36 0.79 0.79 0.71 0.43 0.57 0.43 0.64 0.64 0.36 0.79 0.36 0.5 0.5 0.5 0.36
MS-KWA 1 1 0.71 0.71 0.29 0.29 0.36 0.79 0.79 0.79 0.71 0.71 1 0.29 1 0.86 0.86 0.86 1
MS-ACH 1 1 0.71 0.71 0.29 0.29 0.36 0.79 0.79 0.79 0.71 0.71 1 0.29 1 0.86 0.86 0.86 1
MS-WOA 1 0.64 0.64 0.64 0.64 0.64 0.43 0.57 0.71 0.43 0.64 0.79 0.64 0.64 0.64 0.5 0.79 0.5 0.64
MS-GYE 1 1 0.71 0.71 0.29 0.29 0.36 0.79 0.79 0.79 0.71 0.71 1 0.29 1 0.86 0.86 0.86 1
Table A2. Continued. Matrix of genetic distances obtained from the ISSR data and used to generate the dendrogram shown in Fig. 2.
DO
-KE
C 9
GS
-BA
W 4
GS
-KO
N 1
3
GS
-BA
W 5
GS
-KO
N 8
GS
-BA
W 1
GS
-BA
W 1
0
GS
-KO
N 9
M/W
-MA
M 1
M/W
-NK
A 1
M/W
-MA
A 1
M/W
-NK
A 2
M/W
-PO
K 1
MS
-ED
W 1
MS
-KW
A 1
MS
-AC
H 1
MS
-WO
A 1
MS
-GY
E 1
DI-ABF 1
DI-DNY 1
DI-DAN 1
DI-NKIN 1
DI-BUF 1
DI-ASE 1
DI-SKD 1
DI-AYE 1
DI-AYE 2
DI-NKIN 2
DI-TAN 1
DI-MSH 1
DO-KUE 2
DO-KUE 1
DO-ODO 6
DO-KUE 3
DO-PAW 5
DO-KEC 1
DO-KEC 9 1
GS-BAW 4 1 1
GS-KON 13 0.64 0.64 1
GS-BAW 5 0.5 0.5 0.43 1
GS-KON 8 0.79 0.79 0.86 0.57 1
GS-BAW 1 0.79 0.79 0.71 0.71 0.86 1
GS-BAW 10 0.86 0.86 0.5 0.64 0.64 0.64 1
GS-KON 9 0.86 0.86 0.79 0.36 0.64 0.64 0.71 1
M/W-MAM 1 0.86 0.86 0.79 0.64 0.93 0.93 0.71 0.71 1
M/W-NKA 1 1 1 0.64 0.5 0.79 0.79 0.86 0.86 0.86 1
M/W-MAA 1 1 1 0.64 0.5 0.79 0.79 0.86 0.86 0.86 1 1
M/W-NKA 2 0.64 0.64 0.43 0.71 0.57 0.43 0.79 0.5 0.5 0.64 0.64 1
M/W-POK 1 0.64 0.64 0.57 0.86 0.71 0.86 0.79 0.5 0.79 0.64 0.64 0.57 1
MS-EDW 1 0.36 0.36 0.57 0.71 0.43 0.57 0.5 0.5 0.5 0.36 0.36 0.43 0.71 1
MS-KWA 1 1 1 0.64 0.5 0.79 0.79 0.86 0.86 0.86 1 1 0.64 0.64 0.36 1
MS-ACH 1 1 1 0.64 0.5 0.79 0.79 0.86 0.86 0.86 1 1 0.64 0.64 0.36 1 1
MS-WOA 1 0.64 0.64 0.57 0.86 0.71 0.71 0.79 0.5 0.79 0.64 0.64 0.71 0.86 0.57 0.64 0.64 1
MS-GYE 1 1 1 0.64 0.5 0.79 0.79 0.86 0.86 0.86 1 1 0.64 0.64 0.36 1 1 0.64 1

American Journal of Agriculture and Forestry 2016; 4(4): 86-96 95
Abbreviations
Item Full meaning
df Degree of Freedom DNA Deoxyribonucleic Acid
EDTA Ethylenediaminetetraacetic Acid
Fig Figure ft Feet
ISSRs Inter Simple Sequence Repeats M Molar
ng Nanogram µM Micromolar
µl Microlitres
ml Millilitres mm Millimetres
m Metres m
3 Cubic Metres
mg Milligrammes
% Percent PCR Polymerase Chain Reaction
RAPD Random Amplified Polymorphic DNA rpm Revolution Per Minute
TAE Tris-acetate Ethlylenediaminetetraacetic Acid TFPGA Tools for Population Genetic Analyses
SE Standard Error
UPGMA Unweighted Pair Group Method with Arithmetic Averages
References
[1] Burkill HM, 1985 The Useful Plants of West Africa. Second edition. Royal Botanic Gardens, Kew. Pp. 278-283.
[2] Irvine FR, 1961 Woody Plants of Ghana with Special Reference to their Uses. Oxford University Press. Pg. 191.
[3] Siepel A, Poorter L, Hawthorne WD, 2004 Ecological Profiles of large timber species. In: Biodiversity of West African Forests. Poorter L, Bongers F, Kouame FN, Hawthorne WD (editors). CABI Publishing, Wallingford, UK. Pp 403.
[4] Lobo JA, Quesada M, Stoner KE, 2005 Effects of pollination by bats on the mating system of Ceiba pentandra (Bombacaceae) populations in two tropical life zones in Costa Rica. American Journal of Botany 92: 370-376. DOI: 10.3732/ajb.92.2.370
[5] Dick CW, Birmingham E, Lemes MR, Gribel R, 2007 Extreme long-distance dispersal of the lowland tropical rainforest tree Ceiba pentandra L. (Malvaceae) in Africa and the Neotropics. Molecular Ecology 16: 3039-3049.
[6] Brondani RPV, Gaiotto FA, Missiaggia AA, Kirst M, Gribel R, Grattapaglia D, 2003 Microsatellite markers for Ceiba pentandra (Bombacaceae), an endangered tree species of the Amazon forest. Molecular Ecology Notes 3: 177-179. DOI: 10.1046/j.1471-8286.2003.00389.x
[7] Williams JW, Jackson ST, Kutzbach JE, 2007 Projected distributions of novel and disappearing climates by 2100 AD. Proceedings of the National Academy of Science, USA 104: 5738-5742.
[8] Gillet E, Gomory D, Paule L, 2005 Measuring genetic variation within and among populations at marker loci. In Conservation and Management of Forest Genetic Resources in Europe. Geburek T, Turok J (editors). Arbora Publishers, Zvolen. Pp 237-273.
[9] Vendramin GG, Hansen OK, 2005 Molecular markers for characterizing diversity in forest trees. In Conservation and Management of Forest Genetic Resources in Europe. Geburek T, Turok J (editors). Arbora Publishers, Zvolen. Pp 337-368
[10] Archak S, Gaikwad AB, Gautam D, Rao EVVB, Swamy KRM, Karihaloo JL, 2003 Comparative assessment of DNA fingerprinting techniques (RAPD, ISSR and AFLP) for genetic analysis of cashew (Anacardium occidentale L.) accessions of India. Genome 46: 362-369.
[11] Ofori DA, 2001 Genetic diversity and its implications for the management and conservation of Milicia species. PhD thesis, University of Aberdeen. Pp 47.
[12] Enaberuel LO, Obisesan IO, Okolo EC, Akinwale RO, Aisueni NO, Ataga CD, 2014 Genetic Diversity of Shea Butter Tree (Vitellaria paradoxa C. F. Gaernt) in the Guinea Savanna of Nigeria Based on Morphological Markers. American-Eurasian J. Agric. & Environ. Sci., 14 (7): 615-623. DOI: 10.5829/idosi.aejaes.2014.14.07.12365
[13] Grattapaglia D, 2007 Marker-assisted selection in Eucalyptus. In: Current status and future perspectives in crops, livestock, forestry and fish. Guimaraes EP, Ruane J, Scherf BD, Sonnino A, Dargie JD (editors). Food and Agriculture Organization of the United Nations, Rome. Pp 252-281.
[14] Deng C, Zhou J, Gao W, Sun F, Qin R, Lu L, 2006 Assessment of genetic diversity of Lycoris longituba (Amaryllidaceae) detected by RAPDs. Journal of Genetics 85 (3): 205-207.
[15] Monteleone I, Ferrazzini D, Belletti P, 2006 Effectiveness of neutral RAPD markers to detect genetic divergence between the subspecies uncinata and mugo of Pinus mugo Turra. Silva Fennica 40 (3): 391-406.
[16] Brown JKM, 1996 The choice of molecular marker methods for population genetics studies of plant pathogens. New Phytopathology 133: 183-195.
[17] Xia T, Meng L, Mao K, Tian B, Miehe G, Liu J, 2008. Genetic variation in the Qinghai-Tibetan plateau endemic and endangered conifer Cupressus gigantea, detected using RAPD and ISSR markers. Silvae Genetica 57 (2): 85-92.
[18] Lee S, Kim Y, Kim W, 2003 Lack of allozyme and ISSR variation in the Rare endemic tree species, Berchemia berchemiaefolia (Rhamnaceae) in Korea. Annals of Forest Science 60: 357–360 357.
[19] Gupta S, Srivastava M, Mishra GP, Naik PK, Chauhan RS, Tiwari SK, Kumar M, Singh R, 2008 Analogy of ISSR and RAPD markers for comparative analysis of genetic diversity among different Jatropha curcas genotypes. African Journal of Biotechnology 7 (23): 4230-4243.
[20] Egnin M, Mora A, Prakash CS, 1998 Factors enhancing Agrobacterium tumefaciens – Mediated Gene Transfer in peanut (Arachis hypogeal L.). In vitro Cellualar and Developmental Biology of Plants, 34: 310-318.

96 Cosmas Sorngmenenye Abengmeneng et al.: Genetic Relationship Among 36 Genotypes of
Ceiba pentandra (L.) as Revealed by RAPD and ISSR Markers
[21] Nei M, 1972 Genetic distance between populations. American Naturalist, 106: 283-292.
[22] Nei M, Li W, 1979 Mathematical model for studying genetical variation in terms of restriction endonucleases. Proceedings of the National Academy of Sciences of the United States of America 76 (10): 5269-5273.
[23] Abengmeneng C S, Ofori DA, Kumapley P, Akromah R, Jamnadass R, 2015 Estimation of heritability and genetic gain in height growth in Ceiba pentandra. African Journal of Biotechnology, 14 (22): 1880-1885. DOI: 10.5897/AJB2014.14287
[24] Stacy EA, 2001 Cross-fertility in two tropical tree species: evidence of inbreeding depression within populations and genetic divergence among populations. American Journal of Botany, 88: 1041-1051.
[25] El-Kassaby YA, Cook C, 1994 Female reproductive energy and reproductive success in a Douglas-fir seed orchard and its impact on genetic diversity. Silvae Genetica, 43: 243-246.
[26] Boshier DH, 2000 Mating systems. In: Forest conservation genetics: principles and practice. Young A, Boshier D, Boyle T (editors). CSIRO Publishing/CABI Publishing, Melbourne/Wallingford. Pp 63-79
[27] Hansson B, Westerberg L, 2002 On the correlation between heterozygosity and fitness in natural populations. Molecular Ecology 11: 2467-2474.
[28] Uyoh EA, Umego C, Aikpokpodion PO, 2014 Genetic diversity in African Nutmeg (Monodora myristica) accessions from South Eastern Nigeria. African Journal of Biotechnology, 13 (42): 4105-4111. DOI: 10.5897/AJB2014.14075