genetic similarity among soybean (g/ycine max (l) merrill...
TRANSCRIPT

Sep1541~
Genetics and Molecu/w Biologr, 29, 4, 692-704 (2006)Copyright by the Bra:!'ilian Society of Genetics. Printed in Brazilwww.sbg.org.br
Research Alticle
Genetic similarity among soybean (G/ycine max (L) Merrill) cultivarsreleased in Brazil using AFLP markers
Ana Lídia V. Bonato1, Eberson S. Catvo2
, lsaias O. Geratdi3 and Cartos Alberto A. Arias4
1Centro Nacional de Pesquisa de Trigo, Empresa Brasileira de Pesquisa Agropecuária, Passo Fundo,RS, Brazil.2Tropical Afelhoramento & Genética Ltda., Cambé, PR, Brazil.JDepartamento de Genética, E<;colaSuperior de Agricultura "Luiz de Queiroz ", Universidade de São Paulo,Piracicaba, SP, Brazil.4Centro Nacional de Pesquisa de Soja, Empresa Brasileira de Pesquisa Agropecuária, Londrina, PR, Brazil.
Genetic similarity among soybean genotypes was studied by applyíng the amplífied fragment length polymorphism(AFLP) technique to 317 soybean cultivars released in Brazil frem 1962 to 1998. Genetic similarity (GS) coefficientswere estimated usíng the coefficient of Neí and Li (Nei and U 1979), and the cultivars were C!ustere<:!using the un-weighted pair-group method with averages (UPGMA). The parentage coefficients of 100 cultivars released between1984 and 1998 were calculated and correlate<:!with the genetic similarity obtained by the markers. The genetic simi-larity coefficients varied from 0.17 to 0.97 (x = 0.61), with 56.8% of the coefficients being above 0.60 and only 9.7%equal to or less than 0.50. The similarity coefficients have remained constant during the last three decades.Dendrogram interpretation was hindered by the large number of cultivars used, but ít was possible to detect groups ofcultivars formed as expected trom their genealogy. Another dendrogram, composed of 63 cultivars, allowed a betterinterpretatíon of the groups. Parentage coefficients among the 100 cultivars varied from zero to one (i= 0.21). How-ever, no significant correlation (r = 0.12) was detected among the parentage coefficients and the AFLP genetíc simi-larity. The results show the efficiency of AFLP markers ín large scale studies of genetic similarity and are díscussed inrelation to soybean breeding in Brazíl.
Key words: AFLP, genetic similarity, molecular markers, parentage coefticient, soybean.
Received: Jime 1, 2005; Accepted: May 18, 2006.
Knowing the degree of genetic simi!arity among dif-ferent genotypes is of fundamental importance for efficientplant breeding programs. Such information is useful for or-ganizing a working collection, identify ing heterotic gronps,and selecting parents lur crosses.
The parentage coefiiciem (Malécot, 1947) based oniníonnation regarding genotypc genealogy has been usedto estimate genetic similarity and to study the genetic stluc-lure 01'eultivated soybean germplasm. Pedigree analyses ofAmeriean gennplasm showed a high levei 01' genetic rela-tiOllShip(Delannay et ai., 1983), but more reeent studieshave revcaled that cultivars from the north and south oftheUnited States have contrasting genetic bases (Gizlice et aI.,1996). These smdíes also showcd that tbe genetíc diversity
Send correspondence to ALV. Sonata. Centro Nacional de Pes-quisa de Trigo, Embrapa, Caixa Postal 451, 99001-970 PassoFundo, RS, Brazil. E-mail: analídí[email protected].
ofNorth American soybean germplasm as a whole has becnreduced over lhe last 50 years (Gizlice et aI., 1993). Pedi-gree analyses have also shown a narrow genetic base inBrazilian soybean gennplasm (Vet\o et a!., 1988), althoughthe use ofMaJécot's coefficicnts depen<lson the availabil-ity and pteeision 01' geneaJogical information.
Genetic diversíty between individuaIs lnay be di-rectly estimated by using biochemical and mo!ecular mark-ers, although the use of biochemical markers, such asisoenzymes, has been hindered in soybean by lhe low de-gree ofpo!ymorphism ín this specie (Cox et ai., 1985). Thisproblem has bcen overcome by using molecular markers.Sneller et ai. (1997) clearly separated elite American linesfrom the north and south using restriction fragment lengthpolymorphism (RFLP) markers. This technique lias alsobeen \L~edto stndy exotic soybean gennplasffi and ii q.asal-lowed the identifieation of difierent gene pools (Kisha etai., 1998). Similar studies have been carried out using othertypes of molecular mark:ers, such as RAPD markers

(Abdelnoor et ai., 1995; Brown-Guedira et ai., 20(0), sim-pIe sequence repeat (SSR) markers (mícrosatellites) (Di-wan and Cregan, 1997) and amplified fragment lengthpolymorphism (AFLP) markers (Zhu et ai., 1999; Ude et01.,20(3).
A comparative study on the performance of differenttypes of markers in soybean genetic analysis showed thatmicrosatellite markers have li greater degree of polymor-plúsm and, thus, better diserinúnation between genotypes.However, AFLP markers have greater multiplex efficiency(i.e. a large number ofloci can be simultaneously analyzedin a ge1)and are considered an efficient tool for distinguish-ing highly related genotYI>es(Powell et ai., 1996). As a re-sult of such characteristics, this techlÚque continues to beused in current genetic diversity studies (Olivei.r'a et ai.,2004).
Although genetic diversity studies using molecularmarkers have been carried out with various types of mark-ers and diverse genotypes, as expeeted, they contirmed thepresence of a larger amount of genetic diversity in exoticgernlplasm (Zhu et ai., 1999). However, genetic diversityestimates between soybean cultivars obtained using boththe parentage coefficient and molecular markers, haveshown variable results. The magnitude of the correlationbetween these two estimates was 0.54 to 0.91 in RFLP stud-ies (Manjarrez-Sandoval et a/., 1997; Kisha et ai., 1998)but Helms et ai. (1997) obtained no apparent relationshipbetween the two types of estimates when using RAPDmarkers. Abdelnoor et ai. (1995) reported some cases ofdiscrepancy in the genetic distance between Braziliancultivars anaIyzed by RAPD and by pedigree, in spite ofoverall agreement in the data. Sínce molecular marker mea-surements are a direct measure of the genetic distance it ispossibIe that these discrepancies reflect errors related topedigree assessments.
AnaIysis ofBrazilian soybean germplasm by molecu-lar markers has been reported. Abdelnoor et ai. (1995), as-sessing the moIecular mark.er approach using the RAPDtechnique to measure the genetic diversity of 30 Bl'aziliancultivars, found five diflerent subgroups. However, the ap-plication of these results in a breeding program was hin-dered by the reduced number of genotypes used in thestudy. Recently, alieles of 12mícrosatellite Ioei of 186 Bra-zilian soybean cultivars were used to morphoIogicalIydistinguish similar groups and their use allowed the deter-mination of 184 profiJes for alJ cultivars (Priolli et ai.,20(2). Our presellt study was carried out to investigate theuse of AFLP markers in the genetic simílarity analysis of317 soybean cuItivars released in Brazil from 1962 to 1998.
Genetic material
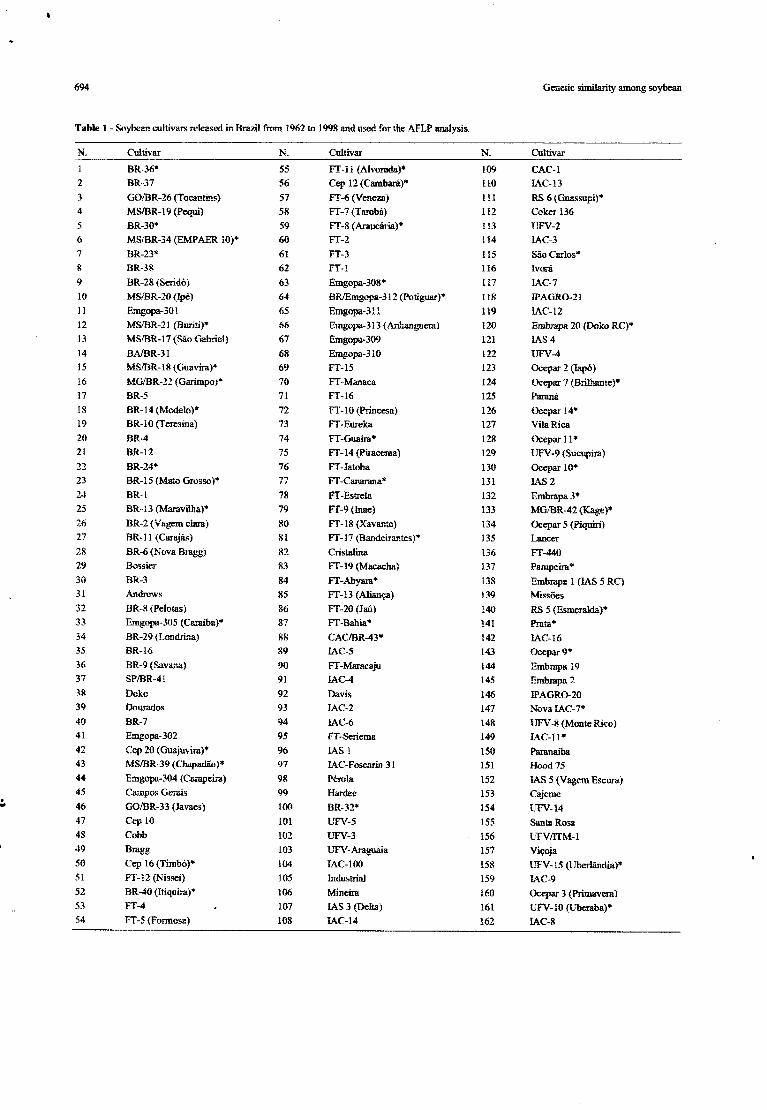
We investigated 317 soybean cultivars released inBrazil between 1962 and 1998 (TabIe 1).The genetic mate-
rial was ohtained from the Active Germplasm Bank oflheNational Soybean Research Center of the Brazilian Corpo-ration for Agriculture Research (Embrapa Soja), Londrina,PR,Brazil.
DNA exlraction and quanlificalion
For each cultivar, 30 leaves were collected from dif..fcrent greenhouse-grown plants and immediately frozen inliquid nitrogen and stored at -80°C for subsequent genomícDNA extraetion according to Saghai-Maroof et ai. (1984).The DNA concentration was estimated in 0.8% agarosegels by visual comparison ofDNA band intensity with Ull-digested lambda DNA standards and the DNA sampleswere then diluted to 30 ng JlL-1 and stored at -20°C untilneeded.
AFlP genotyping
All AFLP analyses were made with the AFLP Analy-ses Kit I (Gibco-LifeTechnologies, RoekvilJe, MD, USA)essentially as described in the kit manual. All the amplifica-tions were conducted in a Perkin-Elmer Gene Amp 9600thermocycler (Perkin-Elmer Corp., NOTwaIk, CT, USA).The AFLP products were fractionated using 5% (w/v) po1y-acrylamide sequencing gels, dried and the autoradiographywas performed by exposing Kodak. Bio Max MR-2 film(Eastman Kodak Co., Roehester NY, USA). Six EcoRI/Mvei primer combinations (E-AAC/M-CAT, E-AAC/M-CTA, E-AAC/M-CTC, E-AACiM-CTG, E-AAG/M-CTT,and E-ACT/M-CAT) were selected based on lhe previouslyreported polymorphism rate (Benato et al., 2006).
Data analysis
The DNA bands were scored as I (presence) and O(absence) based on visual observation and the results en..tered into an Excel<1.l.CJeneticsimilarity (GS) was estimatedfor alI genotype pairs using the equation GS;,; = 2N;i(21'1;,j +iV; + 1'1,) (Nei and Li, 1979), where GSi,j represents the simí-1arity estimate between the genotypes i and j, based on theAFLP data, lV;J is the total number of bands common to iand j, and N; and M correspond to the number of bandsfound in genotypes i and j. The matrix generated with lheGS estimates was used to cluster lhe genotypes in a den-drogram obtained by the unweighted pair group methodusing arithmetic averages (upGMA) (Rohlf, 1997).Cophenetic correlation between GS-matTÍx and dendro-gram cophenetic values was estimated to validate the den-drogram in relation to the original simílarity estimates andthe binary data matrix analyzed using the NTSYS 2.0 soft-ware (Rohlf, 1997). Bootstrap analysis (Tivang et ai.,1994) was used to verifYifthe number ofmarkers was suf-ficient to characterize the cultivars tOr genetic similarity.The procedures for this re-sampling have been described byBarroso et aI. (2003). Cophenetic correlation was obtainedby Bionumeric Analyses (Rolhf, 1997) to express the con-sistence of a cluster,
694 GenetÍC similarity amcng soybean
Table 1 - Soybea.ll cultiv8IS released in Brazil from 1962 to 1998 and use<!for lhe AFLP analysis.
N. Cultivar N. Cultivar N. Cultivar
1 BR-36* 55 FT-ll (Alvorada)* 109 CAC-l2 BR-37 56 Cep 12 (Cambani)* 110 IAC-133 GO!BR-26 (Tocantins) 57 FT-6 (Veneza) 111 RS 6 (Guassupi)*4 MSlBR-19 (Pequi) 58 FT-7 (Tarobá) 112 Coker 1365 BR-30· 59 FT-8 (Araucátia)* 113 UFV-26 M81BR-34 (EMPAER 10;* 60 FT-2 114 IAC-37 BR-23* 61 FT-3 115 São Carlos*8 BR-38 62 FT-l 116 Ivorá9 BR-·28 íSeridó) 63 Erngopa-30S* 117 IAC-710 MStBR-20 (Ipê) 64 BRlEmgnpa-312 (Potiguar)* 118 IPAGR0-21II Emgopa-301 65 Emgopa-311 119 IAC-1212 MStBR-21 (Bmiti)" 66 Emgopa-313 (Anhan~,'uera) 120 Embrapa 20 (Doko RC)*13 MSlBR-17 (São GP.briel; 67 Emgopa-309 121 IAS 414 BAiBR-31 68 Emgopa-310 122 UFV-4IS MS/BR-18 (Guavira)* 69 FT-15 123 Ocepar 2 (Iapó)16 MGJBR-22 (Garimpo)" 70 FT-Manaca 124 Ocepar 7 (BriTh.ante)*17 BR-S 71 FT-16 125 PlIIlIllá
18 BR-14 (Modelo)* 72 n'-lO (Princesa) 126 Ocepar 14·19 BR-I0 (Teresina) 73 FT-Eureka 127 Vila Rica20 BR-4 74 FT-Guaíra* 128 Ocepar lI"21 BR-12 75 FT-14 (Piracema) 129 lJFV -9 (Sucupira)22 BR-24* 76 FT-Jatoba 130 Ocepar 10*23 BR-15 (Maro Grosso)* 77 FT-Canarana* 131 IAS 224 BR-l 78 FT-Estrela 132 Embmpa3*25 BR-13 (Ma.'11vilha)* 79 FT··9 (Inae) 133 MG/BR-42 (Kage)*26 BR-2 (Vagem clara; 80 FT-18 (Xavante) 134 Ocepar 5 (Piquiri)27 BR-ll (Carajás) 81 FT-17 (Bandeira!ltes)* 135 Lancer28 BR-6 (Nova Bragg) 82 Cristalina 136 FT-44029 Bossier 83 FT-19 (Macacha) 137 Pampeira*30 BR-3 84 FT-Abyara* 138 Embrapa 1 (IAS 5 RC)31 Andrews 85 FT-13 (Aliança) 139 Missões32 BR-S (Pelotas) 86 FT-20 (Jaú) 140 RS 5 (Esmeralda)·33 Emgopa-305 (Caluíba)* 87 FT-Bahia* 141 Prata*34 BR-29 (Londrina) 88 CAC/BR-43* 142 lAC-1635 BR-16 89 IAC-5 143 Ocepar9*36 BR-9 (Sava.na) 90 FT-Maracaju 144 Embrapa 1937 8P/BR-4! 91 IAC-4 145 Embrapa238 Doio 92 Davis 146 IPAGR0-2039 Dourados 93 IAC-2 147 NovaIAC-7*40 BR-7 94 IAC-6 148 UFV-S (Monte Rico)41 Emgopa-302 95 FT-Seriema 149 lAC-11 *42 Cep 20 (Guajmira)* 96 IAS 1 150 Paranaíba43 MSlBR-39 (Chapadão)* 97 IAC-Foscarm 31 151 Hood 1544 Emgopa-304 (Campeira) 98 Pérola 152 IAS 5 (Vagem Escura)45 Campos Gerals 99 Hardee 153 Cajellle.
GO/BR-33 (Javaes)• 46 100 BR-32* 154 UFV-1447 Cep 10 101 UFV-5 155 Santa Rosa48 Cobb 102 UFV-3 156 lIFVIITM-l49 Bragg 103 UFV- Araguaía 157 Viçoja50 Cep 16 (Timbó)* 104 IAC-100 158 UFV-15 (Uberlândia)*51 FT-12 (Nissei) 105 industrial 159 JAC-952 BR-40 (Itiquira;* 106 Mineira 160 ÜCepar3 (Primavera)53 FT-4 107 IAS 3 (DeIUl) 161 UFV-lO (lJbe:raba)*54 FT-S (Formosa) 108 lAC-14 162 tAC-8

Bonato et ai. 695
Table 1 (conto)N- Cultivar N. Cultivar N. Cultivar
163 Embrapa5 218 Soberana 273 IAC-19164 MTiBR-45 (Paiaguás)" 219 Ocepar 15 (Paracatu) 274 BRAS-60 (Celeste)*165 Pamnagoiana 220 Embrapa62* 275 BRS 157166 Ocepar8* 221 KJ-S 702 276 BRS 158 (Milena)*167 IAC-l 222 Nobre" 277 MA/BR-64 (Parna1ba)
168 Pelicano 223 Embrapa 58" 278 MG/BR-56 {Confiança}*169 Sertaneja* 224 FT-Sa.ray 279 MAIBR-65 (Sarnbaiba)170 Ivaí 225 Cep 26 (Umbú) 280 BRS 137*171 Planalto 226 FT-Morena" 281 GOiBRS-l60 (Goiatuba)"172 Hill 221 Embrapa46 282 Emgopa-316 (Rio Verde)173 UFV-6 (Rio Doce)* 228 Ocepar 16 283 Embrapa 64 (Ponta Porã)174 RS 7 (Jacui)" 229 Embrapa59 284 BRS 133*175 IAC-lO 230 ~IT/BR-50 (parecis) 285 Ocepar 19 (eotia)176 J-200 231 MTiBR-47(Caná..-io) 286 GOiBRS-161 (Catalão)177 Tiaraju 232 FT- JIlIJlUlm 287 MG/BR-58 (Segurança)178 IAS 5 (Vagem Clara) 233 FI- Lider* 288 BRS 134*179 L<\C-15 234 MT!BR-52 (CU.-iÓ) 289 Coodetce-203180 UFV-7 (Juparana)* 235 Embrapa26 290 MS/BR-57 {Lambari}"181 União 236 Ocepar 12" 291 MS/BRS-168 (Piapara)182 Ocepar 13 237 Embrapa 32 (ltaqui)" 292 MTiBR-55 (Uirapuru)183 UFV-l 238 Ocepar6* 293 MSiBRS-171 (C. Grande)*184 Tcresina RCH 239 Rainha 294 CaririRCH185 Ocepar 4 (Iguaçú) 240 MS/BRS-l72 (Tuiuiú)" 295 MS/BRS-169 (Bacmi)186 Sào Luiz 241 Embrapa60" 296 BRS 136187 BRlIAC·21 242 KJ-S 801 297 Coodetec·-202"188 Vitória 24.3 BRS 154 298 BRS 135"189 Tropical 244 MS/BRS-167 (Carandá)· 299 GO/BRS-162 (Bela Vista)"190 Embrapa48" 245 MG/BRS-66 (Liderança)" 300 BRS 156191 Embrnpa 9 (Bays)* 246 FT-45263 301 &-ridoRCH192 Embrapa47 247 Embrapa30 302 Emgopa-315 (Rio Vermelho)"193 MT/BR-53 (Tucano) 248 Ocepar 17 303 h-1TJDRS-63 (Pintado)194 Timbira 249 BRS 153 304 Emgopa-307195 BR-35 (Rio Balsas)" 250 MS/BRS-17.3 (Pimputanga) 305 KJ-S602196 IAC-18 251 FT-Cristalina RCH" 306 FI-Cometa197 Invicta" 252 KJ-S602RCH 307 Erngopa-306 (Cr.aparla)198 Década 253 Embrapa 33 (Cariri RC)" 308 MS/BR-61 (Sutubi)"199 FT-I02 254 BRS 155* 309 BR-27 (Cariri)200 FI-IOO 255 Embrapa 31 (Mina) 310 KJ-S 601201 SPS-l 256 FI-I06 311 MG/BR-54 (Renascença)202 BRS 65 ( ltapoty)" 257 Coodetec-20 1 312 MT!DR-49 (Pioneira)"203 FI-I03 258 MSlBR-59 (Mandi) 313 GO/BRS-163 (latal)204 FT-I04 259 BRlEmgopa-314" 314 MG!BR-46 {Conquista)·205 Emhmpa61" 260 FT-2002 315 Emgopa-303*206 Embrapa25" 261 Embrapa 34 (reresina RC) 316 GOiBR-25 (Aruanã)*207 MT/BR-51 (Xingu) 262 BRS 138 317 Numbai,-a208 Cristalina Antiga 263 MTiBRS-159 (Crixás)209 FI - Cristal* 264 MG/BRS-68 (Vencedom)210 IAC-17 265 Pi.-apó 78211 BRS66· 266 BRS 132212 FI· 101* 267 IAC-20213 RS 9 (Itaubá)* 268 Embrapa 63 (Mirador)*214 Embrapa 4 (BR-4 RC) 269 Ocepar 18215 Fepagm-RS 10* 270 MS/BRS-166 (Apaiari)216 FI-Cristalina" 27] BRAS-62 (Carla)217 MG/BR-48 (Garimpo RCH)* 272 MS/BRS-170 (Taqllllri)
*Cultivars used tor parentage CoeaiciCl1i analysis.

Parentage coefficientThe parentage eoefficient, f, (Maléeot, 1947) esti-
mates among 100 soybean cultivars released from 1984 to1998 were based on their respective genealogies (see Velloet aI., 1988 for earlier results) and obtained using thePARENT software program (CL.<\GRI- ESALQtUSP).These eultivars are indicated with an asterisk (*) in Table 1.One hundred cultivars were used because this is the maxi-mum number of genotypes that can be assessed by thePARENT software. The estimates were later used to calcu-late the correlation between the parentage coefficient andthe genelÍc similarity between the respective pairs of culti-vars as measured by AFLP.
Results and Discussion
AFLP analysisThe six primer combinations used to analyze the 317
cultivars generated 394 bands, 78 (19.8%) of those werefound to be polymorphic among genotypes (Table 2). Theaverage nunlber of polymorphic markers per primer combi-nation was 13, varying from six to 25. The EcoRI-AACiMveI-CTC and EcoRI-AACiM\'eI-CAT markersgenerated the highest levels ofpolymorphism, 18 (34.6%)and 25 (30.1%) respel.iively.
Maughan et aI. (1996) detected 274 (36%) AFLPpolymorphic bands among Glycine max and Glycine sojaaccessions and an average of 18 polymorphic bands perprimer combination, cOllsidering accessions of both spe-cies, with most (31%) of the polymorphism occurring inGlycine s(~iaaccession and only 17% in Glycine max.
In our study, although we considered only adaptedG~)Jcinemax cultivars the leveI of polymorphism found(19.8%) clearly indicated the genetic similarity among thegenotypes. Our results confmn previous findings den1on-strating that AFLP is a molecular technique that detectspolymorphism in multiple loei, generating a vast number ofreproducible markers in a short period of time (Mahes-waran et a/.,1997) and is a powerful tool fbr screeninghighly related genotypes (Powell et ai., 1996).
Table 2 - EcoRLM~eI AFLP analysis primercombinations and number ofband'i.
Primers Numberofbands
EcoRI lll.~el Total Polymorphics
Al\C crc 52 18A.AC CrA 68 11
AAC crG 55 8
AAC CAT 83 25A.AG crr 86 10
ACT CAT 50 6
Total 394 78
According to Zhu et ai. (1999), the most polymorphicprimer combinations were EcoRI-AACiMsel-CTC (53%)andEcoRI-AACiMseI-CAT (50%). These same authorsre-ported a greater polymorphism frequency compared to thatfound by us, probably because Zhu et ai. (1999) were deal-ing with adapted and non-adapted G(vcine max and G(vcinesoja accesSÍons. Their results, however, are in line withthose obtained in our study and confmn that these twoprimer combinatiolls are highly infomlative for analysis ofBrazilian soybean germplasm.
AFLP estimates of genetic similarityWe construeted a similarity coefficient matrix from
the genetic similarity calculatiollS for the 317 genotypes.Figure 1 shows the frequency distribution of the coeffi-eients, the average coefficient among alI genotypes was0.61, ranging from 0.17 forthe Nobreand Bossiercultivarsto 0.97 for the FT-Cristal and FT Cristalina cultivars. Wealso found that 56.8% ofthe estimated coefficients had val-ues greater than 0.60, reflecting the high degree of geneticsimilarity among the cultivars used in this study. However,9.7% ofthe coefficients were equal to or less than 0.50, andcan be exploited for divergent parent selection.
High genetic similarity among Brazilian soybean eul-tivars was also detcl.ied hy Abdelnoor et ai. (1995), whoused RAPD analysis and obtained a mean GS coefficient of0.82 with a range of 0.69 to 1.00. The most divergentcultivars were Tropical and UFV-6, whereas the most simi-lar cultivars were Ocepar·9 and Paranagoiana. Other stud-ies using AFLP have also shown bigh similarity amongadapted Glycine max genotypes. For example, Maughan etai. (1996) tound similarity values ranging from 0.74 to1.00. Zhu et ai. (1999), although observing high sinúlaritycoefficient., between Glycine ma.r:and G(vcine soja acces-sions (0.60 to 0.94), emphasized the greater similarity ofG/ycine max cultivars. However. Priolli ef ai. (2002) usedSSR markers and tound OS values ranging from 0.18 to0.59 in a group of 186 Brdzilian soybean cultivars, this
~~l)nnl
~~)(~l~
.~ :~ l
,;:- 1500!H
j li~w~~t~- j
~(JÕü,,:! J 'I:.' Mil
("~'" ':~; ..,. .~ ~ t.•.e ~ e ~ o ~Gctl..:tiç;;imH~'oo..:flkirots
Figure I - Frequency díslributíon of50,01l6 AFLP genetic símilarily cod~fu:ients among 317 soybean cultivar&.
leveI of genetic similarity being Iower than that found inour study.
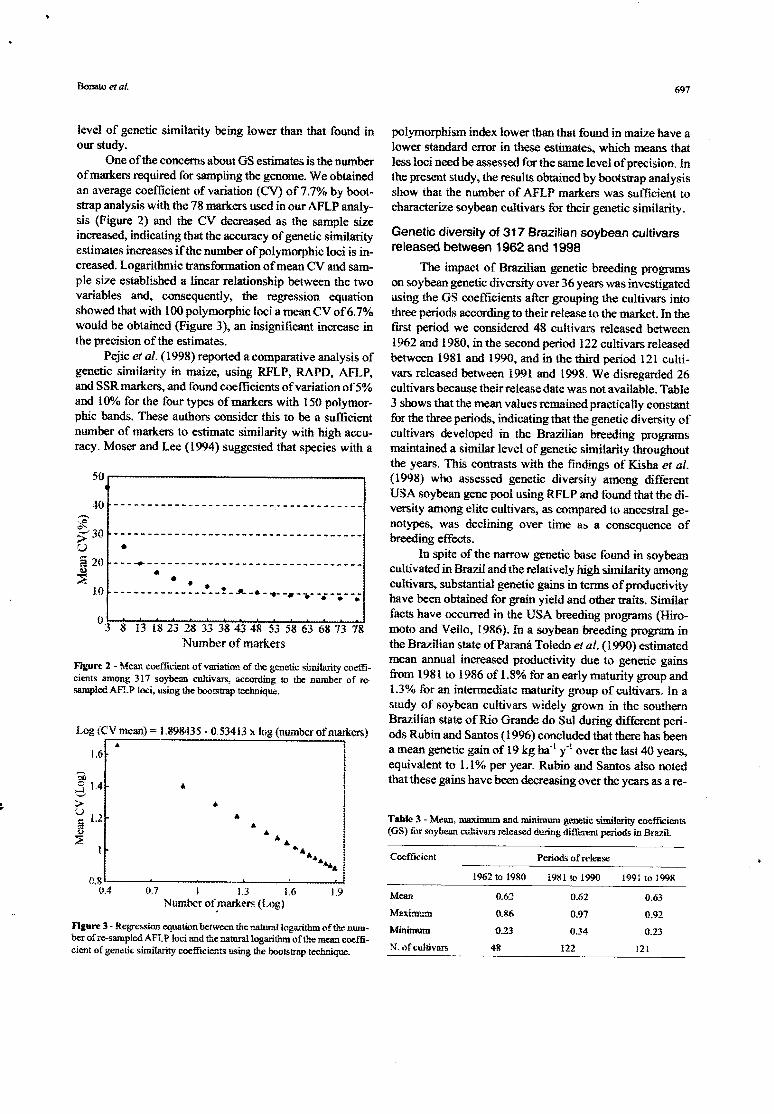
One ofthe concems about GS estimates is the numberofmarkers required for sampling tbe genome. We obtainedan average coefficient ofvariation (CV) of7.7% by boot-strap analysis with the 78 markers used in our AFLP anaIy-sis (Figure 2) and the CV decreased as the sample sizeincreased, indicating that the accuracy of genetic similarityestimates increases if the number of polymorphic Ioci is in-creased. Logarithmic transformation ofmean CV and sam-pIe size established a linear relationship between the twovariables and, consequently, the regression equationshowed that with 100 polymorphic loci a mean CV of 6.7%would be obtained (Figure 3), an insignificant increase inthe precision 01' the estimates.
Pejic et ai. (1998) reported a comparative analysis ofgenetic similarity in maize, using RFLP, RAPD, AFLP,and SSR markers., and found coe fficients 01' variation of 5%and 100/0 for the four types of markers with 150 polymor-phic bands. These authors consider this to 00 a sufficientnumber of markers to estimate similarity with high accu-raey. Moser and Lee (1994) suggested that species with a
---~--------------------------------• • •.....-_ _.._ _..-_._-! ' __a .....•__., ....•..._•....•• __._
o 3 8 13 18 23 28 33 38 43 48 53 58 63 68 73 78Numbcr of markers
Figure 2 - Mean coefticiem of variation of lhe genetic si..'nilali.tycoeffi-cients among 317 soybean cultivars, according to me number of Te-sampleà AFLP loei, using the bootstrap teclmique.
. '. I•..• i.. :•.•.••i
i0.7 I 1.3 1.6 1.9
Number of.markers (Log)
Figure 3 - Regressíon equatÍLmbetween lhe naturalloga. •.-itll.moft,l-·.enum-ber of re-sampled AFLP Ioei and lhe na1llra1Iogarithm of t.lte mea..'lcoeffi-cient of genetic sírnilarity coefficienls using lhe bootstrap techrJque.
polymorphism index Iower than that found in maize have alower standard error in these estimates, whieh means thatIess loci need be assessed for the same leveI of precision. lnthe present study, the results obtained by bootstrap analysisshow that the number of AFLP markers was sufficient tocharacterize soybean eultivars for their genetie similarity.
Genetic diversily of 317 Brazilian soybean cultivarsreleased between 1962 and 1998
The impact of Brazilian genetic breeding programson soybean genetic diversity over 36 years was investigatedusing the GS coefficients after grouping the cllltivars intothreeperiods aceording to their release tothe market. ln thefirst period we considered 48 cultivars released between1962 and 1980, in the second period 122 cultivars releasedbetween 1981 and 1990, and in the third period 121 eulti-vars released between 1991 and 1998. We disregarded 26eultivars because their relea'ie date was not avaiIable. Table3 shows that the mean values remained practieally constantfor the three periods, indicating that the genetic diversity ofcultivars developed tn the Brazilian breeding programsmaintained a similar leveI of geneúe similarity throughoutthe years. This eontrasts with the findings of Kisha et ai.(1998) who assessed genetic diversity among differentUSA soybean gene POOlllSingRFLP and found that the di-versity among elite eultivars, as compared to ancestral ge-notypes, was declining over time as a consequence ofbreeding effeets.
ln spite of the narrow genetic base fOllndin soybeaneulúvated in Bra7i1and the relaúvely high similarity amongcultivars, substantial genetic gains in terms ofproductivityhave been obtained for grain yield and other traits. Similarfaets have occurred in the USA breeding progratns (Hiro-moto and Vello, 1986). ln a soybean breeding program inthe Brazilian state ofParaná Toledo et ai. (1990) estimatedmean annual increased productivity due to genetic gainsfrom 1981 to 198601' 1.8% tor an early maturity group and1.3% for an intermediate maturity group of cultivars. ln aslUdy of soybean cultivars widely grovm in the southemBrazilian state ofRio Grande do Sul during different peri-ods Rubin and Santos (1996) eonc1uded that there has heena mean genelie gain of 19 kg ba'l y.t over the last 40 years,equivalent to 1.1% per year. Rubin and Santos also notedthat these gains have been decreasing over the years as a re-
Table 3 - Mean, maximum and minimum genetic similnrity coefficients(GS) for soybean cuhivars released dUl'ing diiferent peneds in Brazil.
Coefficient Periods of release
1962 to 1980 1981 to 1990 1991 to 1998
Mean 0.62 0.62 0.63
Maxi.'llUIn 0.86 0.9i 0.92
Minimum 0.23 0.34 0.23
N.ofcultivars 48 122 121

sult of using the same basic gennplasm during hybridiza-tiou. However, fuis is not necessarily the case, as revealedby the receut releases of new cultivars and the tàet that therehave been (:onsiderable improvemems in me performanceof agronomic trait<;due to the correction of defects con-trolled by qualitative traits and an improvement in grainyield has also been reported in several Brazilian states. Forexample, in Rio Orande do Sul the BRS 153 cultivar out-perfonned (in tenns of grain yield) the control cultivarBR-16 by 14%, while the cultivar BRS-133 outperformedthe same control by 8.5% in the state ofParaná, while in theBrazilian state of Mato Grosso do Sul me cultivarMSiBRS-l71 (Campo Grande) outperfonned the controlcultivar FT-Cristalina by 20% while the cultivarMT/BR-50 (Parecis) outperfonned cultivar MT!BR-45(Paiaguás) by 5% (Congresso Brasileiro de Soja, 1999).
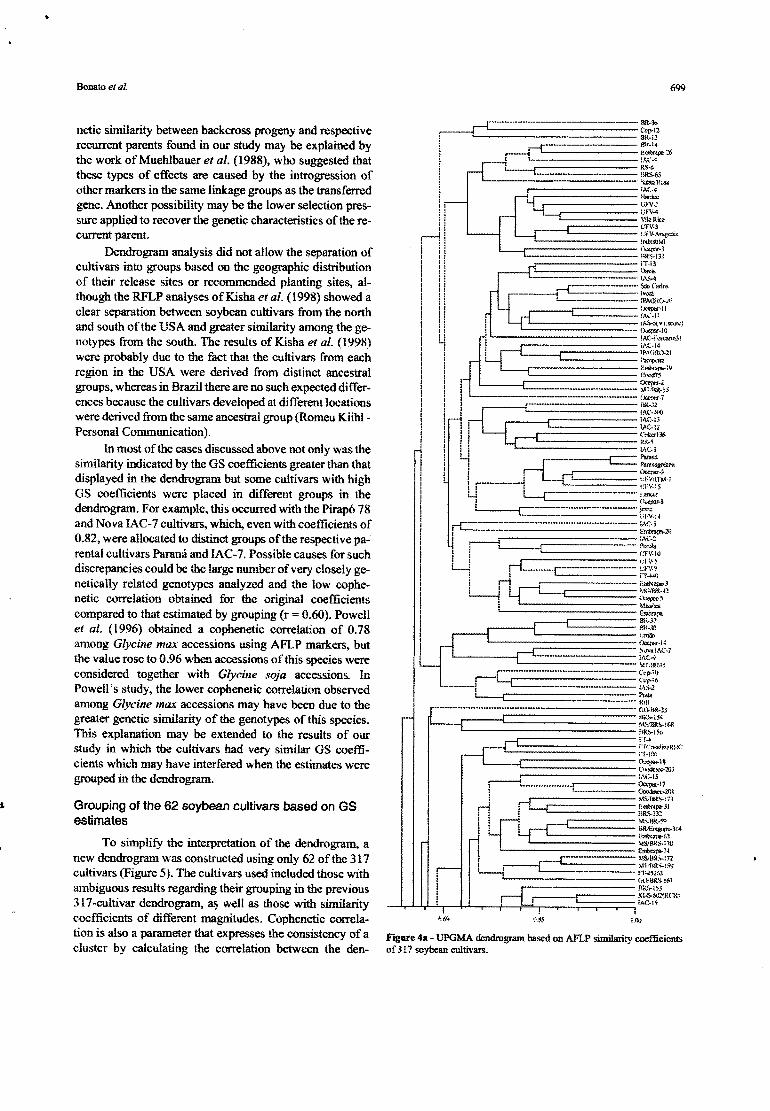
UPGMA grouping 01the 317 soybean cultivarsbased on GS estimates
The OS estímates for the 317 cultivars were used togenerale a UPOMA dendrogram (Figure 4). In spite of thelarge nwnbers hindering the assessment of similarities be-tween each paír of cultivars, the dendrogram a110wedthedetection of groups of cultivars with expected gene1ic simí-larity corresponding to their genealogy. These results sup-pon the previously noted efficiency of AFLP mar.kers forestimating genetic similarity among soybean genotypes.Knowing the genealogy of cultivars was essential for theinterpretation of the dendrogram, a fact in line with otherstudies (Abdelnoor et ai., 1995; Diwan and Cregan, 1997;Priollí et ai., 2002).
As expected, the genetic similarity (OS) coefficíentsand the dendrogram showed that cultivars derived fromnatural mutation had high similarity coefficients. The Para-nagoiana and Ocepar 9-SS1 cultivars, mutants ofthe Para-ná -cultivar, had similarity coefficients of 0.95. The SãoCarlos mutant cultivar had a genetic similarity c()cfficientofO.83 with res1'ect to the original Davis cultivar, while theUFV-1 mutant cultivar shared a coefficient ofO.67 with theoriginal Viçoja cultivar. The magnitude difference betweengenetic similarity coefficients observed for the differentmutants seems to indicate either that not a11mutations giv-ing rise to the mutant genotypes were single point muta-tions or they that these cultivars may not actually bemutants. However, the Paranagoiana and Ocepar 9-SS1cultivars are lmown to be mutants of the Paraná cultivar,thís having becn denlOnstrated by the electrophoresis andisoenzyme studies of Derbyshire et ai. (l990).
The OS estimates for cultivars derived from othercultivars also showed many cases of simílarity. Exampleswere fbund in the FT-Cristal and FT-Babia cultivars, whichhad GS coefficients of 0.97.and 0.87, respectively, com-1'ared with the FT-Cristalina cultivar from whích they wereselected. Similarly, the Ocepar-8 cultivar showed higb sim-ilarity (0.90), when compared to the Paraná cultivar from
which it was selected. However, in some instances, lowsimílarity was found between 1'utatively related cultivars,as in the case of the IAS 5 cultivar, which had been sepa-rated into two types according to pod color (dark pod IAS 5and pale 1'00IAS 5) by researchers at the Embrapa NationalSoybean Research Center (Personal Communicatíon). OurAFLP analysis indicated that these two cultivars must di-verge in other genesbesides those defining pod color be-cause the AFLP GS coefficient between them was only0.63. However, we also found that the FT-2 cultivar, de-rived from a selection within the IAS 5 cultivar, was closer(OS = 0.78) to the pale poo IAS 5cultivar than to the dar.kpod IAS 5 cultivar (OS = 0.65). These data indicate that theAFLP technique is híghly diserimínating for cultivar díffer-entiation even among closely related genotypes. Diwan andCregan (1997) analyzed soybean genotypes using 20 mi-crosatellite mar.kers but were unable to separate lhe Híni ge-notype from the its ancestral AK Harrow genotype.
Among cultivars derived from the same cross-sistercultivars, there were severa! cases of agreement be1weenGS coefficients and their alJocation in lhe same group.Cultivar;; MT/BR-50 (Parecis), MTiBR-51 (Xingu),MT/BR-52 (Curió) andMT/BR- 53 (Tucano),derived fromthe BR 83-9520-1 (2) x FT-Estrela cross, had genetic simi-larity coefficients greater than 0.80. There was a similar sit-uation for me UFV-2, UFV-3, UFV-4 and UFV-Araguaiacultivars, derived from the Hardee x IAC-2 cross, whosecoefficients were greater than 0.83. Among the FT-5, FT-10, FT-14 and FT-15 cultivars, derived from the FT-95 10 xSantAna cross, the OS coefficients varied from 0.71 to0.93. Cultivars Embrapa 59, Embrapa 60, Embrapa 61, andBRS 66, alI derived from the FT-Abyara x BR 83-147 emsshad OS coefficients greater than 0.75. AdditionalIy, theBRS 133, BRS 135, BRS 158, MS!BR-57 (Lambari) andMSIBRS-171 (Campo Orande) cultivars, also seleetedfrom the FT-Abyara x BR 83-147 cross, had GS coeffi-dents lower than 0.65 as compared to theír Embrapa 59,Bmbrapa 60, Embrapa 61, and BRS 66 sister cultivars. Weattributed these dífferences in similarity among the sistercultivars to selection efTeets. Abdelnoor et ai. (1995) alsofound similarities at severa! levels between cultivars de-rived from the same cross.
Cultivars developed from backcrosses had variableOS coefficients, as compared to theír recurrent 1'arents. Forexample, BR-6 (Nova Bragg) and BR-13 (Maravilha) cul-tivars were obtained from backcrosses (three to NovaBragg and four to Maravilha) with the Bragg cultivar andhad genetic similarity coefficients greater than 0.75 in rela-tion to the Bragg cultivar. The Embrapa 1cultivar,obtainedfrom six backcrosses to the IAS 5 cultivar, had a geneticsimílarity coefficient ofO.68 when compared with the darkpod IAS 5 cultivar and 0.54 when compared with the palepod IAS 5. The Embrapa 4 cultivar, derived from six back-crosses to the BR-4 cultivar, had a similarity coefficient of0.61 only with BR-4 cultivar. The lower than expected ge-
oetic similarity between backcross progeny and respectiverccurrent parents found in our study may be explained bythe work 01' Muehlbauer et ai. (1988), who suggested thatthese types of effeets are caused by the introgression ofolher markers io the same linkage groups as the transferrcdgene. Another possibility may be the lower selection pres-sure applied to recover the genetic characteristics ofthe rc-current parenL
Dendrogram analysis did not allow the separation ofcultivars ioto groups based on the geographic distributiooof their release sites or rccommended plaoting sites, al-though the RFLP analyses ofKisha et aI. (1998) showed aclear separation between soybean cultivars from the northand south ofthe USA and greater similarity among the ge-notypes from the south. The results of Kisha et ai. (1998)were probably due to the fact mat the cultivars from eachregion in lhe USA were derived from distinct ancestralgroups, whereas in Brazil there are no such expected differ-ences because the cultivars developed at different locationswere derived from the same ancestral group (Romeu Kiihl-Personal Communication).
ln most of the cases discussed above not only was thesimilarity indicated by the OS coefficients greater th30 thatdisplayed in the dendrogram but some cultivars with highOS coetlicients were placed in different groups in thedendrogram. For example, this occurred with the Pirapó 78and Nova lAC-7 cultivars, which. even with coefficients of0.82, were allocated to distinct groups ofthe respective pa-rental cultivars Paraná and IAC-7. Possible causes for suchdiscrepancies could be me large number of very closely ge-nctically relatcd genotypcs analyzed and the low cophe-netic correlation obtained for the original coefficientscompared to that estimated by grouping (r= 0.60). Powellet ai. (t 996) obtained a cophenetic correlation of 0.78amoog G/ycine max accessions using AFLP markers, butthe value rose to 0.96 when accessions ofthis species \Vereconsidered together with Glycille soja accessions. InPowell's study, the lower cophenetic correlation observedamong G/yciTlemax accessions may have been due to thegreater genetic similarity of the genotypes of this species.This explanation may be extended to the results of ourstudy in which the cultivars had very similar OS coeffi-cients which may have ioterfered when the estimates weregrouped in the dendrogram.
Grouping of the 62 soybean cultivars based on GSestimales
To simplify the interpretation of the dendrogram, anew dendrogram was constructed using only 62 of the 317cultivars (Figure 5). The cultivars used included those withambiguous results regarding their grouping in the previous317-cultivar dendrogram, ~ weIl as tbose with similaritycoefficients of diffen.."Dtmagnitudes. Cophenetic correla-tion is also a parameter that expresses the consistency of acluster by calculating the correlation between the den-
.----r--.-------.--- ..---.-- ..-.~~2
, ~----------- SR·i!: r-f'=::= ml~qí r--1~_~_-_-_-_-_-_-_-_-_-_-_-_-_-_;:;::.~26
: ._~---f~-------JlS.6; _.----.--.-- HR.W! -.~;!l.;:HüSlI! _-- l",\(;·4
L -~---------------------------~~: 1 ------l:FV-4,
I i ~...-----------.:::.::.::.:~~~~~r-11 '--__ -_-_-_-_-_-_-_-_-_-_~:b~~:aw.I I! -_.--.--- :~73~I II ~. .....c--...-.~t,-..i""i i ! C-------1 :~"{j.l"! i i __ ~----- (.ICt;w-·1I! li . ..r· !Ai.·'-Hi ! 1 i -- iAS-5tVE~un:~
! q dl ---===============;~':';03ii 1 1 r-L-'--1 ~~;~~21: 1 ~--------:::mio;m-:l,iI i _ ~-_-_-_-_-_-_-_-_-_-_-_-_-_-_-_-_fl"'xlrl.i 1 ! I -='j;1 ! 1 ----_-:..-_-_- _- _- _-_ -_ -..:._--_-_-_-_. (kc:Jar:l
! ! I!cc~r .;;"~:::mI 1 --i 'AC •.1"li 1 i i L·------·-·'AC;.I,
I i 1I =_. -------- h~\l36I ' l' PlI.! ~i -; ---l- __ -c:= ~~ilma
f ~ iL ~ ~-=~~(-JU----Lr . i~5: (rvt;fI!lr-&
i r:==-.-------- tr;~-j4rf-..-..- -- -- ..- ..---- ..-··---· r~~:m-2(!
i. ~c~
I iJ---,r0=!~---r-.-..--.-..--.-.--..-.------.r'~tI I _~:=========== fT...4(:
I.:' I I l-_ ••_-f ;~~~{~ o:~~
i ------- Mlssi'lJ(~i fmr~~:4Si ~-'i-r~:, ------------ fJ«,.~·HI C~-:..:..:..:..:..:..:..:..:..:.:...:..:..-= ;~~~~AC.1
r-.-- ..-._ _ _ _.t~~i:;~5____. ~-_-_--_~~~l)
L-.c::::=: -= ~~112
----_.- ••_- no/oo...J,}HR,I,,;.l;.l
MSBR".·;(.RHRS .. t5t.
.j--l================= i.~~t~ie\g;in~R~'~Cn~lnr.
---------t~:c:'*llSCnooc!\.ov1lU
~. -------- 1.\(>(5~"'_ ....__._.-..:-.----Otqxg,~l1
! ----~--.::-------- ------~=;.:,7.~i i jl-J--------------_-:.-_-_-_-_- :~~31. LQ --MS,'!lR·59':.!.! lL.[-1=: .--\ WV.;mg.."...l'4
------- :..•Mt"C~tllH'l1-------- "-!SlAA$.~·fv
I r...nto!':ifl1\-.J.f: ~~----_. MSlmt~~72I r--i w MT.'BRs.::W.....~ ~------f1:':;:]:Ü
'-----------(,{),.'11.'t~-:61
~
-.-------- ilR:,·l53___ ••----- K:-S-óG:lRO:,
• I ----;AC-t';
Figure 4a - UPGM-A dcndrogram based on AFLP similarity coefficienlsaf 317 soybean cultivars.

c----·m ;c.~~~""5_____________ n4'~
4 tl~~nl: L[ ti'o .•nR:).I6'.l! -- '!vlij
~Y2" --40 E•••• "'i"".:r:L..-...j~---------- M"'·2l".-65--------- Tí.liliir.\~---- R:dr.!bt
•••• ------.----.--- •••••• -.---- •••••• -.- •••• -- MS'BR!;-\(,OBHS-13ro.-{ - ---- - - -- - ..-. ~~;~~~:~~i
_·_-··---··-r---···-------- i:~i
~
;~~~:",."jg--1 :.~:~;;.:
f __:--------- ~~5rvnarn1i --C ::(:J"8t."'O:lt~W: _ •••• ---- ••••••.• _ OCClXol··!JL__ .. ~ .._._ ...._~::;;~i$
-.----.-- •.-- fT..:rsmma-------------------.--.---. (io;.epllr-6
:1:::======================== ~~;~1~
Emt......-l :'."*_48'----------- o:.mb!sp:r9__.r------- RS-7-e:: L _.__ _O,:;:,,~·4
- ---L .. ..;:::-~------------ in .•..ic:!2r-=---.------.- KI·~·SOI.."_.._l-f--=::::::====== ~~:~~/.~~{it"
;H.-2.------------------- •••--- 3;\·16
.-1 ~ ~~_)~L-_. ----{ __ _ Kl-fi,óJÜI
-------------- Ms.nR-J4
rL--.....-: ;;1~~~.3\}í-G--L-- ~~\»lí~
L--..{_. __ .__..__....__ ....~~~l?
3!t.•li:'I.1"1.'BR-47fr'C~:'IfnU:>tÚ(l,lsl\.~"l(l;
~ Mllll~·53
1--1 ~~;..~~<:~r -- •.•.••••-------------- ••----- ~s,.rSlt-'i1r "l'V.liI I ViWjU
: --- . ,.-,---------- ;~~lJ:>~{R('H.! ,-----L----.- .. ....I~J',.;
!: --------- t:fV·J: "-I(j·'RR-46: ,-------------------- ::~~)[!'>..•.•..'06• : .--------- ~l.'BR·~v
._ •••••• -. ~-------- t;\.):nR~.,.tti3
.----[_ _ ! __.._ _.___..!~l~Ji)S
• BR<':1~~ ...-.-e:=.------- ..- ;~7::<W!L '---------------D:.!'lw
! '----------:::============ FFj:f " ;---r 1o~ 100
Figure 4b - UPGMA dendrogmm base<!on AFLP similllri:y eoefficienLsof 317 soybean cultivar> (eont.)
Figure 4c - tJPGMA dendrogram base<!on AFLP similarity coefficientsof 311 soybean cultiva.••·s (cont.)

drogram-derived similarities and the matrix similarities. lnBioNumerics, the value is calculated for each cluster(branch) thus estimating the faithfulness of each subclusterof the dendrogram. The cophenetic correlation wasobtained for the whole dendrogranl from the copheneticcorrelation at the roots (Figure 5). ln the 63-cultivar den-drogram it was easier to visualize groups and there was asmaU in('Tease in the general cophenetic correlation valuesfrom 0.60 to 0.70. ln practical tenns, these results suggestthat parental selection based on genetic diversity may bcmore effective when soybean breeders use smaller groupsof genotypes to calculate coefficients and if genotypes arepreviously selected based on their qualitative and quantita-tive agronomic traits.
Among cultivars considered discrepant in the previ-ous dendrogram (Figure 4) there were pairs of cultivars thatwere reaUocated within the same group, indicating goodagreement with their original coefficients. Ao exanlple ofthis was the group gathering the Embrapa 32 (Itaqui),Embrapa 33 and Cariri RCH cultivars, alI derived frombackcrosses to the BR-27 (Cariri) cultivar. A similar situa-tion was observed for cultivar MS/BRS-l72 (Tuiuiú) andits recurrent parent (the FT-Cristalina cultivar) with fourbackcrosses (0.77). The MT/BR-45 (paiaguás) cultivar,from the cross between Doko x V\C-7, had a OS ofO.79with cultivar IAC-7 forming a group with cultivars IAC-7and Nova IAC-? Another example ofimproved groupingoccurred between tire sistercultivars MTIBR-55 (Uirapuru)and MT/BRS-159 (Crixás) in relation to cultivar MTIBR-50, this new group having OS coefficients higher than 0.70.
However, some cultivan>remained in different groupsin spite of sharing higb similarity coefficients, probably re-flecting deficiencies in the grouping approach, as shown bythe moderate cophenetic correlation value. This could beseen in severdl cases, such as the groups containing cultivarBRlIAC-21, derived from five backcrosses to the IAC-8cultivar, with OS coefficients of 0.40; the Coodetec 201cultivar, derived from five backcrosses to the Ocepar 4(Iguaçú) (0.75); and the two pairs of sister cultivars, BR-4and BR-5 (0.75) and BRS 153 and BRS 154 (0.71).
ln spite of such relationship, some cultivars were alIo-cated to difterent groups because of the low similarity ob-tained frem tlre AFLP markers, examples being cultivarBRS 137 and the recurrent parent Dourados cultivar, with asimilarity coefficient of 0.65, as well as the Embrapa-20(Doko RC) cultivar, derived from four backcrosses to t1leDoko cultivar, ",'ith a similarity coefficient ofO.63. A simi-lar finding was observed between cultivar UFV-6 and itssistercultiv8n> UFV-S, UFV-9, and UFV-lO.
Factors that may affect genetic simílarity estimates
Results contradictory. to theoretical expectations,based on the genealogy of each cultivar are difficult to ex-plain with certainty, but several sources of error may befbund itl such studies, e.g. the use of seeds containing ge-
65 7u 75 lU~ 4..< 9C~ ~ :(10
'tinbo • .+7
___ ,,,,,",·.1flt~'Hp:lofS
__________ lIl<. :.•;
______ llR· ~
______ 1''''''-<_-----.-n~·5
! ri ._.~.J04
i r··1 MSt'BR ~2i)
1 fl~-----'.--_._--J~'\~-302I )~opl!.3'.H
I ~Fr·:.1• _~-I.-r-I •••••
i,i ~~Ff-:O~ ! Ff·;\
i 1 i J"f-r-..\tCJKlaju
l{1ll'~' __ flil-h\- .v:·~
___ IJtIk,o
IJuufl&ôJN.
[JrJo,'1Ij)I 13)
b~"lR~3J5
_---_[A('~;
ri------NoJ'faiAC-7
--------- .•---fINlo'Hl'O'W
rl_..__..__~::::~:------l~~:V_ tú
M;/tJR-S:5
rJ=-r-C~taljIõ9C-LFi..Cri."tllI.
M.!OR·I.
M-rt'CR-50
M<.iiHk-.f6
------------J-Y-2, f::m\lrl)t1'~
ri---------l: '--"·--f~n:b:tt:M:':(o
• - I:olkr.a5~
l ~-----fJ(-~~'"
~-----tÀ1i5.1..
-_···--f.m.bcapaJ2
f-.mbmpo;]
BR·17
BR·';
--------MsmR-;9BRS-;;4
BR1AC-2;
--------IAC·g
Flpre S - UPGMA dendrogram based on AFLP similarity coeflicients of62 soybean cultivars and copbenetic correlation Ilt the roots.

netic material not originating from the stated parcnt plants(extraneous DNA), quality of chemicals and reagents usedin the analysis, imprecision in the AFLP analysis, and mis-takes in reading and interpreting the polymorphic fragmentdata. ln the prcsent study extrancous DNA was probablythe most important souree of error, beeause leaf sampleswere not taken from a single pIam since the use of geneticmaterial taken from a single plant could result in atypicalgenetic data for that cultivar, this being especial1y true inthe case of sister lines.
Several other factors may influence genetic similarityestimates and should be taken into account in studies ofthisnature. Firstly, the number of markers used can affeet thevariance in similarity estimate beeause a marker representsan independent genomic sample (Powell et ai., 1996), al-though in our study the 78 polymorphic markers used werefi)und to be adequate for the analysis of the 317 cultivars.
Seeondly, the disrribution of markers in the genome isalso an important factor to consider in diversity studies be-cause a good coverage of the genome improves its repre-sentation efficiency as well as the comparison betweenindividuais. It is normally assumed that markers are ran-domly distributed in the genome (Williams et ai., 1990) andthere is evidence that AFLP provides a wide coverage ofthe plant genome (MaheSWaI"'dnet aI., 1997).
Thirdly, the genetic similarity coefficient used mayinfluence how similarity results are interpreted andgrouped. For example, while the coeflicient ofNei and Li(Nei and Li, 1979) does not consider the absence of bandsas evidence of similarity between individuaIs the simplematching or common distance coefficient (SSM)of Sokaland Michener (1958) does, which may cause the SSMcoeffi-cient to overestimate genetic similarity because the absenceof amplification io a dominant marker band comnllm to twogenotypes does not necessarily represent genetic similarityamong the genotypes (Duarte et aI., 1999). ln respeet toJaccard's coefficient (SI) the Nei and Li coefficient differsonly by the double weight it assigns to the occurrence 01'bands iu both of any two analyzed gcnotypes (Duarte et aI.,1999; Mohammadi and Prasanna, 2003) and it thus seenlSthat the Nei and Li coefficient is best suited to the type ofanalysis discussed in this paper.
Gellctic modifications takcn as de novo variabilitymay also have an effect on this kind of study, with suchmodifications occurring because of intra-genic recombina-tion, unequal <:rossingover, transposon activity and DNAmetbylation, although these factors are not tbought to havebeen an important source of variability in our study.
Genetic similarity estimates based on the parentagecoefficient (f) and correlation between the GS and fcoefficients of genetic similarity
TIle 4,950 parentage éoefficients (1) of the 100 soy-bean cultivars, released from 1984, varied from f = O tof= 1, with a mean orO.21. When 1'=Othere is no parentage
between cultivars pairs, and {his occurred in this study in294 (5.94%) ofthe GS estimates. The maximum fcoeffi-cient (f= 1) was found in 14 (0.28%) ofthe cultivars paírs.Vello et aI. (1988) estimaled the parentage coellicient 01'each of the 69 cultivars recommended for the 1983/84growing season and observed a mean coefficient ofO.16. lnthe USA, eultivars released between 1947 and 1988showed mean f coefficienls ofO.18 for the cultivars fromthe north and 0.23 for the cultivars from the south (Gizliceet ai., 1993), values considered high. Sneller (1994) re-ported a similar finding when comparing elite cultivarsfrom the north and south ofthe United Stales, as weH as asurprisingly low f coefficient (0.10) betweeu northem andsouthern regions, suggesting that soybean breeders havekept distinct gene pools. Analysis of Chinese soybean cul-tivars showed a very low f coellicient (0.02), indicating ahigb degree in genetic diversity of the germplasm of thiscountry (Cui et ai., 2000).
ln our study the correlation coefficient between GSand the parentage coefficients (f) was low (r = 0.12) for sev-eral reasons. One reason eould be the f-acttbat the two typesof coefficients are not based on the samc type of geneticsimilarity, because the f coeflicient is a mathematical deter-mination based on probabilities, while AFLP molecularmarkers detect similarities directly at DNA leveI. Anotherrcason is thatthe conditions relatingto the use oftbe f coef-ficient are not always fulfilled when dealing with the germ-plasm used in plant breeding. ln fact, the violation oftheseassumptions seems to be critical for using this coefficient inthe plant breeding context and this may lead to low correla-tion between f coefficients and genetic marker data. Thishappens because the f calculation assumes that eaeh parenttmnsfers 50% 01'its genetic material to its offspring, with-OUI considering the effects of seleetion and genetic drift(Barret et aI., 1998). Only in cases where cultivars are de-rived from seleetion within cultivar:; or by mutatiol1 mustthe l' coetlicient be equal to 1 (i.e. full similaríty) becausethere is no possibility of a derived cultivar possessing dif ..ferent genes. However, the assunlption that f = O (i.e. nosimilarity) when the ancestors of a cultivar do not have par-entage in common is not always true and may possibly leadto an underestimation of the relationshíp between two ge-notypes. For example, Gizlice et aI. (1993) used multi-variate analysis to calculate similarity coefficients andfound coetlicíents varying from O to 0.88 among NorthAmerican soybean ancestors. Thus, lack of precise knowl-edge regarding the genealogy of a cultivar may interferenegatively with f coefficient estimates, a fact that does notoceur with molecular markers beeause they do not requireprevious knowledge 01'genealogy for the calculation of ge-netic similarity.
The correlation betv•.een genetic similarity values ob-tained using markers and parentage (1) coefficients hasbeen investigated in many studies with variable results.Very low correlation values (r = 0.33) were qbtained for

wheat using RFLP (Barbosa-Neto et ai., 1996), while high(r =0.97) values were obtained in maize with the same typeofmarker (Smith and Smith, 1991). Using AFLP markers,Barret and Kidwell (1998) found a correlation coefficient01'0.42 for wheat, which they explained in a similar mannerto that outlined in the previous paragraph.
[n tbis paper, we have presented the first global analy-sis 01' genetic similarity in Brazilian soybean germplasmand have sho\\n that AFLP markers are a very rapid, effec-tive and reliable tool for this type of analysis. These find-ings not only highlight the capacity ofthe AFLP techniquebut should also help Brazilian soybean breeders in the se-lection 01' parent-plants for their crossing programs.
AcknowledgmentsThe authors acknowledge the financial support re-
ceived from the Brazilian agency Fundação Mato Grosso(FMT) and are grateful to P.A.V. Barroso for the bootstrapand E. Binneck for the cophenetic analysis. A.L.V. Bonatoreceived a doctorate scholarship iTom the Brazilian agencyCNPq (Conselho Nacional de Desenvolvimento Científicoe Tecnológíco).
Abdelnoor RV, Barros EG and Mareira MA (1995) Determina-tion of genetic diversity within Brazilian soybean germ-plasm using random amp1ified po1ymorphic DNAtedllúques and comparative analysis with pedigree dataBrazJ Genet 18:265-273.
Barbosa-Neto JF, Sorrels ME and Cisar G (1996) Prediction ofheterosis in wheat using coefficient of parentage andRFLP-based estimates of genetic relationship. Genome39:1142-1149.
Barrett BA and Kidwell KK.(1998) AFLP-based genetie diversityamong wheat cultivars from the Pacifie Northwest. Cmp Sei38:1261-1271.
Barrett BA, Kidwell KK.and Fox PN (1998) Comparison of AFLPand pedigree-based genetic diversity assessment melhodsusing wheat cu1tivars from the Pacífic Northwest. Crop Sci38: 1271-1278.
Barroso PAV, Geraldi 10, Vieira MiC, Pu1cine1liCE, VencosvkyR and Dias CTS (2003) Predicting performance of soybeanpopulations using genetic distances estimated with RAPDmarkers. Genet .Molec Biol 26:343-348.
Bonato ALV, Calvo ES, Arias CAA, Toledo JFF and Geraldi 10(2006) Prediction of genetic variability through AFLP-based measure af genetic distance in soybean (G(l'cine maxL. Merrill). Crop Breed Appl BiotecMol 6:30-39.
Brown-Guedira GL, Thompson JA, Nelson RL and WarburtonML (2000) Eva1uation of genetic diversity of soybean intro-ductions and North American ancestors using RAPD andSSR markers. Crop Sei 40:815-823.
Congresso Brasileiro de Soja (1999) Anais ... Embrapa Soja, Lon-drina, 533 pp (Embrapa Soja Documentos 124).
Cox TS, Kiang YT, Gorman MB andRodgers DM (1985) Reia-tionship between eoefficient ofparentage and genetic simi-larity indices in the soybean. Crop Sei 25:529-532.
Cui Z, Carter Jr TE and Burton JW (2000) Genetic diversity pat-terns in Chinese soybean cu1tivars based on coefficíent ofparentage Crop Sei 40: 1780-1793.
Delannay X, Rodgers DM and Palmer RG (1983) Relative geneticcontributian among ancestrallines to North American soy-bean cultivars. Crop Sei 23:944-949.
Derbyshire E, Carvalho MTV and Sonato ER (1990) Comparisanof natural variants of lhe soybean cultivar Paraná by iso-enzyme ana1ysis. Braz J Genet 13:83-87.
Diwan N and Cregan PB (1997) Automated sizing of fiuores-cent-labeled slmple sequence repeat (SSR) markers to assaygenetic variation in soybean. Theor Appl Genet 95:723-733.
Duarte JM, Santos JB dos and Meio LC (1999) Comparison ofsimilarity coeffieients based on RAPD markers in the com-mon bean. Genet Molec Biol 22:427-432.
Gizlice Z, Carter .lrTE, Gerig TM and Burton JW (1996) Geneticdiversity patterns in North American publie soybean culti·-vars based on coefticient of parentage. Crop Sci 33: 753-765.
Gizlice Z, Olfter TE and Burton JW (1993) Genetic diversity inNorth American soybean: 1Mutivariate analysis of found-ing stock and relation to coefficient of parentage. Crop Sei33:614-620.
Helms T, Orf J, Vallad G and McClean P (1997) Genetic variance,coefficient of parentage, and genetic distance of six soybeanpopulatioIls. Theor Appl Genet 94:20-26.
Hiromoto DM and Vello NA (1986) The genetic base ofBraziliansoybean (Glycine max (L) Merrill) cultivars. Braz J Genet9:295-306.
Kisha TJ, Die.fSBW, HoytJM andSnelierCH(1998) Genetie di-versity arnong soybean plant introductions and North Amer-ican germplasm. Crop Sci 38: 1669-1680.
Maheswaran M, Subudhi PK.,Nandi S, Xu JC, Parco A, Yang Dealld Huang N (1997) Polymorphism, distribution, and segre-gation of AFLP markers in a doubled haploid rice popula-tion. Theor Appl Genet 94:39-45.
Malécot G (1947) Les Mathématiques de l'Hérédité. Masson eteie, Paris, 80 pp.
Manjarrez-Sandoval P, Carter Jr TE, Webb DM and Burton JW(1997) RFLP Genetic similarity estimates and coeffieient ofparentage as genetie variance predictors for soybean yield.Crop Sei 37:698-703
Maughan PJ, Saghai- Maroof MA and Buss GR (1996) Amp1ífiedfragment length polymorphism (AFLP) in soybean: Speeiesdiversity, inheritance, and near-isogenic line ana1ysis. TheorApp1 Genet 93:392-401".
Mohan1madi SA and Prasanna BM (2003) Analysis of genetic di-versity in crop p1ants - Salient statistieal tools and eonsider-ations. Crop Sei 43: 1235-1248.
Moser H alld Lee 1\1(1994) RFLP variation and genealogicdl dís-tance, multivariate distance, heterosís, and genetic variancein oats. Theor Appl Genet 87:947-956.
Mueh1bauer m, Specht JE, Thomas-Compton MA, Staswick PEand Bemard RL (1988) Near-isogenic lines - A potential re-source in the integmtion af conventional and molecularmarker linkage maps. Crop Sci 28:729-735.
Nei M and Li WH (1979) Mathematical model for studying ge-netic variation in terms of restriction endonucleases. ProcNatl Acad Sei USA 76:5269-5273.
Oliveira K.1\1,Laborda PR, Garcia AM, Paterniani MEZ andSouza AP (2004) Evaluating genetic relationships hetween

tropical maize inbred lines by means of AFLP proflling.Hereditas 140:24-33.
Pejic I, Ajmone-Marsan P, Morgante M, Kozumplick V, Casti-glioni P, Taramino G and Motto M. (1998) C.-omparativeanalysis ofgenetic similarity among inbred lines detected byRFLPs, RAPDs, SSR~ and AFLPs. Theor Appl Genet97:1248-1255.
PoweH W, Morgante 10.1, André C, Hanafey M, Vogel J, Tingey Sand Rafalskí A (1996) The comparison of RfLP, RAPD,AFLP, and SSR (microsat.ellit.e) markers for germplasmanalysis. Molec Breed 2:225··238.
Priolli RHG, Mendes Junior CT, Arantes NE and ConteI EPB(2002) Characterization of Brazilían soybean cultivars usingmicrosateUite markers. GenMol Biol 25: 185-193.
Ruhlf fJ (1997) NTSYS-pc: Numcrical Taxonomy and Multi-variate Analysis System. EXETER Software, New York.
Rubin SAL and Santos OS (1996) Progresso do melhoramentogenético da soja no Estado do Rio Grande do Sul: L Rendi-mento de grãos. Pesq Agropec Gaúcha 2:139.147.
Saghai- Maroof MA, Sloman Kc\1, Jorgensen R.J\ and Allard RW(1984) Ríbosomal DNA spacer-lengtll polymorphisms inbarley: Mendelían inheritanee, chromosomal location, andpopulation dynamics. Proc Natl Acad Sei USA 81:8014-8018.
Smith JSC and Smitb OS (1991) Restriction fragment lengtbpolymorphisms can differentiate among U.s. maize hybrids.Crop Sei 31:893-899.
Sneller CH (1994) Pedigree ana1ysis of elite soybean !ines. CropSei 34:1515-1522.
Snellel' CI-l,Miles J and Hoyt JM (1997) Agronomic períormanceof soybean plant introductions and tbeir genetic similarity toelite lines. Crop Sei 37:1595-1600.
Soka1RR and Michener CD (1958) A statistical method for evalu-ating systematic relationships. Univ. Kansas Sei Buli38:1409-1438-
Thompson JA and Nelson RL (1998) UtiJization of diverse germ-plasm ior soybean yield improvement. Cmp Sei 38:1362-1368.
Tivang JG, Nienhuis J and Smith OS (1994) Estimation of sam-pling variance of molecular marker data using bootstrap pro-cedure, Theor Appl Genet 89:259-264.
Toledo JFf, Almeida L'\., Kíihl RAS and Menosso 00 (1990)Ganho genético em soja no Estado do Paraná, via melho-mmento. Pesq Agropec Bras 25:89-94.
Ude GN, Kenwortby WJ, Costa JM, Cregan PB and Alvemaz J(2003) Genetic diversity of soybean cultivars from China,Japan, Nortb America, and Nortb American ancestrallinesdetemlined by amplified fragment length polymürphism.Crop Sei 43:1858-1867.
Vello NA, Hiromoto DM and Azevedo-Filho AJBV (1988) Coef-ticient of parentage and broeding of Brazilían soybeangermplasm. Bl'aZ J Genet 11:679-697.
Williarns JGK, Kubelik AR, I.ivak KJ, Rafalski JA and TingeySV (1990) DNA polymorphisms amplified by arbitrary pri-mers are useful as genetic markers. Nucl Aeids Res18:6531-6535.
Zhu SL, Monri LM, Avitabile A and Rao R (1999) Evaluation ofgenetic diversity in Chinese soyabean germplasm by AFLP.Plant Genet Res Newsletter 119:10-14.
Associate Editor: E~'eraido Gonçalves de Barros