genetic variation and association mapping of seed-related
TRANSCRIPT

fpls-08-02105 December 7, 2017 Time: 17:34 # 1
ORIGINAL RESEARCHpublished: 11 December 2017doi: 10.3389/fpls.2017.02105
Edited by:Maoteng Li,
Huazhong University of Scienceand Technology, China
Reviewed by:Liezhao Liu,
Southwest University, ChinaElisa Bellucci,
Università Politecnica delle Marche,Italy
*Correspondence:Huifang Jiang
[email protected] Liao
†These authors have contributedequally to this work.
Specialty section:This article was submitted to
Plant Breeding,a section of the journal
Frontiers in Plant Science
Received: 05 July 2017Accepted: 27 November 2017Published: 11 December 2017
Citation:Zhao J, Huang L, Ren X,
Pandey MK, Wu B, Chen Y, Zhou X,Chen W, Xia Y, Li Z, Luo H, Lei Y,Varshney RK, Liao B and Jiang H
(2017) Genetic Variationand Association Mapping
of Seed-Related Traits in CultivatedPeanut (Arachis hypogaea L.) Using
Single-Locus Simple SequenceRepeat Markers.
Front. Plant Sci. 8:2105.doi: 10.3389/fpls.2017.02105
Genetic Variation and AssociationMapping of Seed-Related Traits inCultivated Peanut (Arachis hypogaeaL.) Using Single-Locus SimpleSequence Repeat MarkersJiaojiao Zhao1†, Li Huang1†, Xiaoping Ren1, Manish K. Pandey2, Bei Wu1, Yuning Chen1,Xiaojing Zhou1, Weigang Chen1, Youlin Xia3, Zeqing Li4, Huaiyong Luo1, Yong Lei1,Rajeev K. Varshney2, Boshou Liao1* and Huifang Jiang1*
1 Key Laboratory of Biology and Genetic Improvement of Oil Crops, Ministry of Agriculture, Oil Crops Research Institute ofthe Chinese Academy of Agricultural Sciences, Wuhan, China, 2 International Crops Research Institute for the Semi-AridTropics, Hyderabad, India, 3 Nanchong Academy of Agricultural Sciences, Nanchong, China, 4 Shanghai IgenebankBiotechnology Company Limited, Shanghai, China
Cultivated peanut (Arachis hypogaea L.) is an allotetraploid (AABB, 2n = 4x = 40),valued for its edible oil and digestible protein. Seed size and weight are importantagronomical traits significantly influence the yield and nutritional composition of peanut.However, the genetic basis of seed-related traits remains ambiguous. Associationmapping is a powerful approach for quickly and efficiently exploring the genetic basis ofimportant traits in plants. In this study, a total of 104 peanut accessions were usedto identify molecular markers associated with seed-related traits using 554 single-locus simple sequence repeat (SSR) markers. Most of the accessions had no or weakrelationship in the peanut panel. The linkage disequilibrium (LD) decayed with the geneticdistance of 1cM at the genome level and the LD of B subgenome decayed faster thanthat of the A subgenome. Large phenotypic variation was observed for four seed-relatedtraits in the association panel. Using mixed linear model with population structure andkinship, a total of 30 significant SSR markers were detected to be associated withfour seed-related traits (P < 1.81 × 10⁻³) in different environments, which explained11.22–32.30% of the phenotypic variation for each trait. The marker AHGA44686 wassimultaneously and repeatedly associated with seed length and hundred-seed weight inmultiple environments with large phenotypic variance (26.23 ∼ 32.30%). The favorablealleles of associated markers for each seed-related trait and the optimal combinationof favorable alleles of associated markers were identified to significantly enhance traitperformance, revealing a potential of utilization of these associated markers in peanutbreeding program.
Keywords: association mapping, peanut, seed-related traits, single-locus SSR, linkage disequilibrium
INTRODUCTION
Cultivated peanut (Arachis hypogaea L.), an excellent source of edible oil and proteins, is one of themost important oilseed crops in the world. Cultivated peanut is an allotetraploid species (AABB,2n= 40), that evolved from a single natural hybridization between two diploid progenitor species,A. duranensis (AA, 2n = 20) and A. ipaensis (BB, 2n = 20), followed by chromosome duplication
Frontiers in Plant Science | www.frontiersin.org 1 December 2017 | Volume 8 | Article 2105

fpls-08-02105 December 7, 2017 Time: 17:34 # 2
Zhao et al. Association Mapping for Seed-Related Traits in Peanut
(Kochert et al., 1996; Bertioli et al., 2016). It is widely cultivatedin more than 100 countries due to its key role in humannutrition, especially in Asia and Africa, in which the productionof peanut accounted for approximately 90% in the global annualproduction. With the increasing demand for peanut in humanlife, the global area harvested raised from 22.8 Mha in 2012 to25.7 Mha in 20141. However, the peanut production is difficultto satisfy mass consumption. Thus there is great potential toenhance peanut global production through increasing the plantproductivity.
Yield is a complex and quantitative trait, which is directlyand indirectly influenced by multiple components agronomictraits. Generally, seed-related traits including seed length (SL),seed width (SW), ratio of SL to width (SL/W) and hundred-seedweight (HSW) significantly and directly impact the peanut yield,especially the plant productivity. Furthermore, the seed-relatedtraits also have effects on the nutrients composition (Prathibaand Reddy, 1994) and flavor (Pattee et al., 2002) in additionto the desirable seed features meeting the industry preferences.Therefore, there is a need for understanding the genetic basisof seed-related traits and identification of genetic factors wouldhelp in improving these traits using marker-assisted selection.Linkage mapping based on segregating population derived frombi-parental crossing is a routine approach for dissecting thegenetic basis of target traits including seed-related traits inpeanut. A number of quantitative trait loci (QTLs) for SL, SWand seed weight were detected using linkage mapping (Shirasawaet al., 2012; Huang L. et al., 2015; Chen et al., 2016). However, theresolution of linkage mapping in peanut was relatively low dueto the limited polymorphism between two parents. Further, thedevelopment of segregating population especially recombinantinbred line (RIL) was very laborious and time-consuming. Inaddition, the complexity of peanut genome has further sloweddown the process of fine mapping and candidate gene discoveryin the QTL region identified for seed-related traits in earlierstudies in peanut.
In recent years, association mapping based on extensivehistorical recombination in diversely natural population has beenan efficient approach to identify QTL for important agronomictraits and successfully conducted in model and non-model crops(Cai et al., 2014; Huang X. et al., 2015; Lquira et al., 2015; Xuet al., 2015; Xiao et al., 2016; Si et al., 2016). With the rapiddevelopment of high-throughput sequencing technology, singlenucleotide polymorphism (SNP) markers have been popularmolecular markers used in association mapping because of widedistribution and a large amount in genome. Although the high-quality reference genome sequences of two wild diploid ancestorsof cultivated peanut have been published (Bertioli et al., 2016),wide-range utilization of SNP markers are limited in peanutdue to the complexity of polyploidy genome structure andlarge genome size (2.7 ∼ 2.8 G). Thus simple sequence repeat(SSR) markers which feature multi-allelic nature, codominantheritability and genome-wide dispersal are the most preferredgenetic markers in association mapping in peanut. Previously,‘Reference Set’ developed by ICRISAT (Pandey et al., 2014) was
1http://faostat.fao.org/
conducted genome-wide association studies (GWAS) using nomore than 150 SSR markers leading to identification of a smallnumber of marker-trait associations (MTAs) for seed-relatedtraits.
Generally, the SSR markers in peanut could result in multipleloci because of the high homology between A and B subgenome.The application of multi-locus SSR markers in genetic studiescould lead to inaccuracy of assessment in number of alleles, allelefrequency and polymorphism information content (PIC) in eachmarker (Chen et al., 2008; Li et al., 2012). Furthermore, the multi-locus SSR markers are unsuitable to evaluate the populationstructure and linkage disequilibrium (LD) because of ambiguousgenotyping in natural population of allopolyploid. Thus, thesingle-locus SSR markers are more fit to association mapping inallopolyploid (Comadran et al., 2009; Jin et al., 2010).
Although an association study for seed-related traits hasalready been carried out in the peanut mini-core collection (Jianget al., 2014) that encompass the 99 accessions of mini–mini corecollection used in this study, there were two advantages thatlacked in the previous study. Firstly, five additional accessionsthat were parental lines of three segregating populations wereadded in this study to contribute to the QTLs identified usingassociation mapping and linkage mapping in our further studies.Moreover, the application of single-locus markers could benefitthe accuracy of MTAs. The association analysis in the previousstudy (Jiang et al., 2014) was conducted using alleles of 109 SSRmarkers and each polymorphic allele was obtained according tothe presence or absence of the amplification due to the limitationof the number of SSR markers developed at that time. Currently,large efforts have been made to develop the SSR markers andthousands of SSR markers have been developed in peanut usinggenomic survey sequencing. Thus, the development of SSRmarkers promoted the identification of the single-locus markersand the use of that in MTAs in this study.
In order to efficiently utilize germplasm resources in peanut,we conducted GWAS analysis using the genotyping data andmulti-environment phenotyping data on four seed-related traitsin the Chinese mini–mini core collection and five diverse peanutaccessions. Therefore, the objectives of this study were (a) toassess the genetic diversity and population structure of the peanutmini–mini core panel, (b) to identify SSR markers associated withseed-related traits, and (c) to evaluate the effects of allelic seriesfor breeding perspectives.
MATERIALS AND METHODS
Plant Materials and PhenotypingThe association mapping panel consists of the Chinese peanutmini–mini core collection with 99 accessions and five additionalaccessions (Zhonghua 6_vul, Zhonghua 10_vul, Yuanza9102_vul, ICG6375_vul and ICG12625_aeq) (SupplementaryTable S1). These accessions included five botanic varieties namelyvar. hypogaea, var. hirsuta, var. vulgaris, var. fastigiata, andvar. aequatoriana. These 104 accessions were planted in theexperimental fields of Wuhan during three consecutive years(2012, 2013, and 2014) and during two consecutive years in
Frontiers in Plant Science | www.frontiersin.org 2 December 2017 | Volume 8 | Article 2105

fpls-08-02105 December 7, 2017 Time: 17:34 # 3
Zhao et al. Association Mapping for Seed-Related Traits in Peanut
Nanchong (2013 and 2014) in China using a randomly completeblock design with two replications. Each accession was planted ina single-row with 12 plants within each row. The plant-to-plantspacing was 10 cm within each row and row-to-row spacing was30 cm. Ten plants from each accession were randomly selectedand surveyed for recording the observations for seed-relatedtraits namely SL, SW, SL/W, and HSW according to previouslydescribed standard procedures (Jiang et al., 2006).
Marker Polymorphism and GenotypingFresh leaves of each accession were collected for genomic DNAisolation. The quality detection of genomic DNA was performedusing 1% agarose gel and uncut lambda DNA marker.
A total of 4,485 SSR markers obtained from the publishedliterature (He et al., 2003; Ferguson et al., 2004; Moretzsohnet al., 2005; Cuc et al., 2008; Naito et al., 2008; Liang et al., 2009;Qin et al., 2012; Shirasawa et al., 2012, 2013; Tang et al., 2012;Wang et al., 2012; Zhang et al., 2012; Huang et al., 2016b; Zhouet al., 2016) were used to detect marker polymorphism in tenaccessions selected based on their abundant phenotypic variation.Subsequently, the polymorphic markers segregating in a single-locus model were selected following the method previouslydescribed in Brassica napus (Xiao et al., 2012) and used togenotype the 104 accessions of the association panel. Polymerasechain reaction (PCR) amplifications, PCR products detection andestimation of fragment sizes were performed as described byHuang et al. (2016b). In some cases, in which it was difficultto distinguish polymorphic fragment because of size similarity,the PCR amplifications were re-conducted using SSR primerslabeled with fluorescence dyes. The amplified PCR productswere diluted to 10–50-folds based on the product concentrationmeasured by agarose gel (1.2%), followed by mixing the dilutedPCR products (1 µl) with GeneScan 500 LIZ standard (AppliedBiosystems, 0.05 µl) with formamide (6.95 µl) in each well.Capillary electrophoresis (ABI 3730 Genetic Analyzer AppliedBiosystems) was used to visualize the polymorphism. Output fileswere then transferred to computer and the allele sizing of theelectrophoretic data was done using GeneMarker V2.1 software.The SSR allele was numerically coded in the ascending orderranked to the fragment size.
Heterozygous genotypes were treated as missing data. For eachSSR, the rare alleles with minor allele frequency (MAF) ≤ 0.05of which fragment sizes were apparently clustered were assignedinto a common allelic class (Abdurakhmonov and Abdukarimov,2008) and the other rare alleles which were unable to pool intocommon allelic class were treated as missing data to increase thepower of association analysis (Hirschhorn and Daly, 2005). Themarkers with more than 10% missing data were excluded fromthe genetic analysis. The PIC of markers and gene diversity werecalculated using the software PowerMarker 3.25 (Hirschhorn andDaly, 2005).
Assessment of Population Structure andRelative KinshipPopulation structure (Q-matrix) was estimated based on thepolymorphic SSR markers using the software Structure 2.2
(Pritchard et al., 2000). It is a model-based clustering methodfor using multi-locus genotype data to infer population structureand assign individuals to groups. An admixture model withindependent allele frequencies was applied to estimate eachof the possible groups (K) from 1 to 10. To achieve reliablesubpopulations, the other parameters were set at a higher levelsuch as burn-in length of 1,00,000 followed by 1,00,000 iterations,with each K being run five times. In order to obtain the optimumK-value, a method calculating an ad hoc (1K) statistic based onthe rate of change in LnP(D) between successive K-values wasemployed (Evanno et al., 2005). The accessions with membershipprobabilities ≥ 0.70 were assigned to corresponding group,otherwise they were classified into the mixed group. The Nei’sgenetic distances were calculated to build unrooted neighbor-joining tree using PowerMarker 3.25 (Liu and Muse, 2005).A kinship coefficient estimation matrix was conducted using theSPAGeDi software package (Hardy and Vekemans, 2002).
Linkage DisequilibriumGenerally, the correlation coefficient r2 was used to assess the LDusing the software TASSEL version 3.0 (Bradbury et al., 2007).The significance of r2 was calculated based on Fisher’s exacttest. Those SSRs mapped onto a high-density peanut geneticlinkage map (Huang et al., 2016a) were selected and used toassess LD level in peanut. The pairs of markers located on thesame linkage group were treated as linked markers, otherwiseas unlinked markers. We calculated the LD levels for global,linked and unlinked markers, respectively. The background LDlevel for this population per se was defined as the 95th percentileof r2 distribution between all unlinked markers (Wu et al.,2016), which was regarded as a population-specific threshold todeclare whether the LD is due to genetic linkage. The decay ofLD with genetic distance was estimated by interval rather thanmarker-pairs individually for reducing the influence of outliers aspreviously described (Mather et al., 2007). We combined r2 valuesinto an interval series of 0–0.5, 0.5–1, 1–2, 2–5, 5–10, 10–15,15–20, 20–25, 25–50, 50–75, 75–100, and 100–150 cM based onmarker distance. We estimated the averaged r2 for each intervaland assumed the r2 value with 0-cM marker distance to be 1 aspreviously described (Yan et al., 2009). The non-linear regressionfunction was deployed to fit the trend of LD decay. The LD decaywas not only plotted in the whole genome, but also in the A andB subgenomes. The linked markers in the A and B subgenomewere, respectively, selected and evaluated the LD levels using themethod mentioned above in the whole genome.
Statistical Analyses for Seed-RelatedTraitsWuhan in 2012, Wuhan in 2013, Wuhan in 2014, Nanchong in2013 and Nanchong in 2014 were treated as Environment I, II,III, IV, and V, respectively. The phenotypic distribution for seed-related traits, phenotypic correlations (r) between all traits andthe effect of population structure on each trait were estimatedusing the R package2. Broad-sense heritability based on familymean was assessed as described by Jiang et al. (2014).
2http://www.R-project.org/
Frontiers in Plant Science | www.frontiersin.org 3 December 2017 | Volume 8 | Article 2105

fpls-08-02105 December 7, 2017 Time: 17:34 # 4
Zhao et al. Association Mapping for Seed-Related Traits in Peanut
FIGURE 1 | Population structure of the peanut panel. (A) Two different methods for determining the optimal value of K. The blue line indicated the ad hoc approachdescribed by Pritchard et al. (2000). The red line indicated 1K based on the change of LnP(D) between consecutive K and developed by Evanno et al. (2005).(B) The population structure in the peanut panel at K = 3.
Genome-Wide Association Study (GWAS)AnalysisThe software program TASSEL3.0 (Bradbury et al., 2007)was used to conduct association analysis using a compressedmixed linear model (cMLM) by simultaneously accounting forpopulation structure (Q-matrix) and relative kinship (K-matrix)to control the spurious associations (Zhang et al., 2010). Inthis study, we used an adjusted Bonferroni method to correctthe multiple tests of association analysis, in which the P-valuethreshold was at P= 1.81× 10⁻³ (1/n, n was the marker numberfor association analysis).
RESULTS
Population Structure and RelativeKinship in the Peanut PanelAmong 4,485 SSR markers, a total of 554 SSR markers werepolymorphic segregated in a single-locus model in the peanutpanel. Subsequently, these 554 polymorphic SSR markers wereused to assess the population structure. The most significantchange of the LnP(D) value was observed when K increased from2 to 3, and a sharp peak of 1K was observed at K = 3 (Figure 1).On the basis of the membership probabilities, all accessions wereclassified into any one of the three given groups or mixed group.The Pop 1 group contained 40 accessions (37.70%), in which27 accessions (67.50%) belong to ssp. hypogaea. Twenty-nine
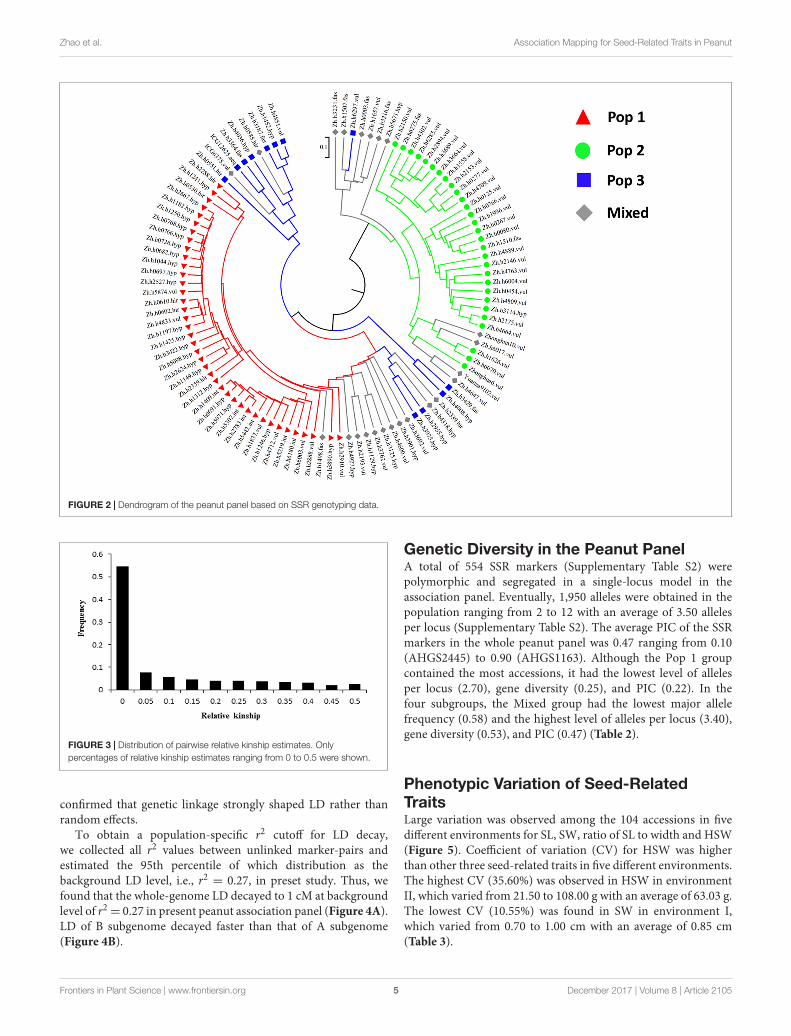
accessions were classified into Pop 2 group, 96.60% of whichbelong to ssp. fastigiata. The third group, Pop 3, included 12accessions, each half of which belongs to ssp. hypogaea andssp. fastigiata, respectively. In the Mixed group, there were 8(34.80%) and 15 (65.20%) accessions belonging to ssp. hypogaeaand ssp. fastigiata, respectively. The clusters divided based onNei’s genetic distances were basically consistent with the groupsestimated by population structure analysis with a few exceptions(Figure 2).
Relative kinship within the population was evaluated based on554 single-locus SSR markers. The average relative kinship valuein the peanut panel was 0.11. More than 70% of the pairwisekinship estimates were below 0.05, with a continuously decliningfrequency of kinship values falling in higher kinship assessmentcategories (Figure 3), indicating that there was no or very weakgenetic relationship among these accessions.
Linkage Disequilibrium Decay in PeanutGenomeThe extent of LD in the peanut association panel was assessedusing r2 of 274 SSR loci mapped onto 20 linkage groups (Huanget al., 2016a). In total panel, the average r2 was 0.10 and almost67.10% of r2 values showed statistically significant (P < 0.001)for global markers. Moreover, we found that a higher level of LD(i.e., the significant r2 proportion and average r2 value) was foundbetween the linked markers than that between unlinked markersin each group and the whole panel (Table 1), respectively, which
Frontiers in Plant Science | www.frontiersin.org 4 December 2017 | Volume 8 | Article 2105
fpls-08-02105 December 7, 2017 Time: 17:34 # 5
Zhao et al. Association Mapping for Seed-Related Traits in Peanut
FIGURE 2 | Dendrogram of the peanut panel based on SSR genotyping data.
FIGURE 3 | Distribution of pairwise relative kinship estimates. Onlypercentages of relative kinship estimates ranging from 0 to 0.5 were shown.
confirmed that genetic linkage strongly shaped LD rather thanrandom effects.
To obtain a population-specific r2 cutoff for LD decay,we collected all r2 values between unlinked marker-pairs andestimated the 95th percentile of which distribution as thebackground LD level, i.e., r2
= 0.27, in preset study. Thus, wefound that the whole-genome LD decayed to 1 cM at backgroundlevel of r2
= 0.27 in present peanut association panel (Figure 4A).LD of B subgenome decayed faster than that of A subgenome(Figure 4B).
Genetic Diversity in the Peanut PanelA total of 554 SSR markers (Supplementary Table S2) werepolymorphic and segregated in a single-locus model in theassociation panel. Eventually, 1,950 alleles were obtained in thepopulation ranging from 2 to 12 with an average of 3.50 allelesper locus (Supplementary Table S2). The average PIC of the SSRmarkers in the whole peanut panel was 0.47 ranging from 0.10(AHGS2445) to 0.90 (AHGS1163). Although the Pop 1 groupcontained the most accessions, it had the lowest level of allelesper locus (2.70), gene diversity (0.25), and PIC (0.22). In thefour subgroups, the Mixed group had the lowest major allelefrequency (0.58) and the highest level of alleles per locus (3.40),gene diversity (0.53), and PIC (0.47) (Table 2).
Phenotypic Variation of Seed-RelatedTraitsLarge variation was observed among the 104 accessions in fivedifferent environments for SL, SW, ratio of SL to width and HSW(Figure 5). Coefficient of variation (CV) for HSW was higherthan other three seed-related traits in five different environments.The highest CV (35.60%) was observed in HSW in environmentII, which varied from 21.50 to 108.00 g with an average of 63.03 g.The lowest CV (10.55%) was found in SW in environment I,which varied from 0.70 to 1.00 cm with an average of 0.85 cm(Table 3).
Frontiers in Plant Science | www.frontiersin.org 5 December 2017 | Volume 8 | Article 2105

fpls-08-02105 December 7, 2017 Time: 17:34 # 6
Zhao et al. Association Mapping for Seed-Related Traits in Peanut
TABLE 1 | Linkage disequilibrium (LD) in the entire panel and the four subpopulations.
Populationa Nb Globalc Unlinkedd Linkede
r2 Significant LD (%)f r2 Significant LD (%)f r2 Significant LD (%)f
Pop 1 40 0.05 2.44 0.05 1.82 0.14 14.24
Pop 2 29 0.07 2.95 0.06 2.31 0.13 14.22
Pop 3 12 0.17 0.50 0.17 0.47 0.19 1.10
Mixed 23 0.08 1.87 0.07 1.31 0.13 12.13
Total 104 0.10 67.10 0.10 66.47 0.16 78.14
aThe overall 104 peanut accessions were classified into Pop 1, Pop 2, Pop 3 and Mixed using the structural analysis. bThe number of accessions for overall and eachinferred groups. cThe whole set of marker pairs, including linked and unlinked markers pairs. dPairs of markers from different linkage groups. ePairs of markers on thesame linkage groups. fSignificant threshold is set to P < 0.001, which determine whether pairwise LD estimate is significant statistically.
FIGURE 4 | Linkage disequilibrium (LD) decay for all the 104 accessions. (A) Genome-wide LD decay of the whole genome for the peanut panel. (B) LD decay of theA and B subgenomes for the peanut panel.
The broad-sense heritability of the four seed-related traitswas 0.94, 0.85, 0.78, and 0.93 for SL, SW, SL/W, and HSW,respectively (Table 3), which was relatively high indicating thatgenetic factors played a predominant role in determining the
variation for these traits. In addition, population structure hadsignificant effect on the seed-related traits, explaining phenotypicvariation from 13.70% for SW in environment III to 57.69%for SL in environment III (Table 3). Significantly positive
Frontiers in Plant Science | www.frontiersin.org 6 December 2017 | Volume 8 | Article 2105

fpls-08-02105 December 7, 2017 Time: 17:34 # 7
Zhao et al. Association Mapping for Seed-Related Traits in Peanut
TABLE 2 | Diversity-related summary statistics for all groups defined by structural analysis.
Populationa Nb Alleles number of Alleles number of Major allele Genetic PIC
all markers each marker frequency diversity
Totala 104 1950 3.50 0.57 0.54 0.47
Pop 1 40 1480 2.70 0.84 0.25 0.22
Pop 2 29 1502 2.70 0.75 0.34 0.30
Pop 3 12 1571 2.80 0.61 0.48 0.42
Mixed 23 1862 3.40 0.58 0.53 0.47
aThe overall 104 peanut accessions were classified into Pop 1, Pop 2, Pop 3 and Mixed using the structural analysis. bThe number of accessions for overall and eachinferred groups.
FIGURE 5 | Phenotypic distribution of 4 seed-related traits in the peanut panel in the five different environments. (A) Seed length; (B) Seed width; (C) Ratio of seedlength to width; (D) Hundred-seed weight.
correlations were discovered in all pairs of the four seed-relatedtraits except SW didn’t correlated to SL/W (Table 4). The SL,SW, and SL/W strongly correlated with HSW (r = 0.88, 0.90,and 0.33, respectively, P < 0.01), which indicated the HSW isdirectly influenced by seed size. The positive correlation betweenSL and SW (r = 0.66, P < 0.01) implied that these traitsmay be affected by the same genetic factors. SL/W stronglycorrelated with SL (r = 0.71, P < 0.01) but not with SW(r = −0.04), which indicated that the seed shape was dominatedby SL.
Genome-Wide Association Mapping forFour Seed-Related TraitsA total of 30 MTAs were identified for the four seed-related traits in five environments at significant level ofP < 1.81 × 10⁻³ (Table 5 and Supplementary Figure S1)with phenotypic variance explained (PVE) ranging from11.22 to 32.30%. Nine markers significantly associated withSL were detected in five environments with PVE rangingfrom 11.64 to 31.45%. Among these associated markers,AGGS1312 and AHGA44686 were repeatedly detected in three
and two environments, respectively. AHGA44686 detected inEnvironment IV had the largest effect on SL (PVE = 31.45%),with the largest phenotypic difference between alleles of0.62 cm, almost equivalent to one-half of the minimumSL collected in peanut diverse panel. For SW, only twomarkers, AHGS2155 and AHGS1836, were identified onlyin single environment with PVE of 17.48 and 19.60%,respectively. There were ten markers significantly associatedwith SL/W with PVE ranging from 11.22 to 22.02%, amongwhich two markers associated with SL/W (AGGS1272 andAHGS2191) were repeatedly detected in two environments.AGGS1272 detected in Environment V had the largest effect(PVE = 22.02%) with the largest phenotypic difference betweenalleles of 1.07. Nine markers were significantly associatedwith HSW in any of given five environments with PVEranging from 11.61 to 32.30%. Among which, AHGA44686was repeatedly identified in four environments with PVEranging from 26.46 to 32.30%. AHGA44686 detected inenvironment I had the largest effect (PVE = 32.30%) withthe largest HSW between alleles difference of 36.44 g.In brief, five markers associated with one of the four
Frontiers in Plant Science | www.frontiersin.org 7 December 2017 | Volume 8 | Article 2105

fpls-08-02105 December 7, 2017 Time: 17:34 # 8
Zhao et al. Association Mapping for Seed-Related Traits in Peanut
TABLE 3 | Phenotypic variation for the four seed-related traits in the peanut panel.
Traita Environmentb Minimum Maximum Mean SDc CV(%)d R2(%)e H2f
SL I 1.20 2.10 1.57 0.25 15.78 54.69 0.94
II 0.98 2.18 1.62 0.29 17.60 57.22
III 1.00 2.10 1.65 0.25 15.39 57.69
IV 1.20 2.30 1.63 0.27 16.75 51.70
V 1.10 2.00 1.50 0.24 16.11 55.06
SW I 0.60 1.10 0.86 0.11 12.86 30.21 0.85
II 0.67 1.13 0.91 0.11 12.28 41.04
III 0.60 1.10 0.83 0.09 11.01 13.70
IV 0.60 1.00 0.88 0.09 10.55 31.46
V 0.50 1.20 0.89 0.13 14.24 33.93
SL/W I 1.30 2.30 1.84 0.24 13.20 46.00 0.78
II 1.30 2.20 1.78 0.22 12.58 49.63
III 1.40 2.50 2.02 0.28 13.80 51.01
IV 1.33 2.56 1.86 0.26 14.06 38.20
V 1.30 2.20 1.70 0.21 12.32 41.40
HSW I 24.50 103.00 63.46 20.56 32.40 47.83 0.93
II 21.50 108.00 63.03 22.44 35.60 51.64
III 25.60 117.80 64.97 20.80 32.02 42.32
IV 25.80 95.90 58.12 16.67 28.68 46.99
V 21.30 114.50 56.99 18.13 31.81 41.53
aSL, seed length; SW, seed width; SL/W, ratio of seed length to width; HSW, hundred-seed weight. b I: Wuhan in 2012; II: Wuhan in 2013; III: Wuhan in 2014; IV: Nanchongin 2013; V: Nanchong in 2014. cStandard deviation. dCoefficients of variation. ePercentage of phenotypic variance explained by population structure. fBroad-senseheritability of each trait.
TABLE 4 | Correlation analysis for the seed-related traits.
SL SW SL/W HSW
SL 0.66 0.71 0.88
SW ∗∗−0.04 0.90
SL/W ∗∗ ns 0.33
HSW ∗∗ ∗∗ ∗∗
SL, seed length; SW, seed width; SL/W, ratio of seed length to width; HSW,hundred-seed weight. ∗∗Significant at P < 0.01; ns, non-significant at P < 0.05.
seed-related traits were repeatedly detected in at least twoenvironments. In addition, two markers (AHGA44686 andAGGS2359) were found commonly associated with multipleseed-related traits, probably reflecting the positive correlationsamong these traits. It was notable that AHGA44686 wassimultaneously and repeatedly associated with SL and HSW inmultiple environments with large explained phenotypic variance(26.23∼ 32.30%).
The Accumulation of Favorable AllelesFor seed-related traits, the favorable alleles for breeder aredefined as the ones conferring high phenotypic values inpeanut. Overall, there were 9 favorable alleles for SL, 2favorable alleles for SW, 10 favorable alleles for SL/W and 9favorable alleles for HSW (Supplementary Table S3). Amongthese favorable alleles, the favorable allele AHGA44686-259detected in Environment II (P = 6.73 × 10⁻⁴, PVE = 26.23%)and Environment IV (P = 2.44 × 10⁻⁴, PVE = 31.45%)which was present in 18 accessions enabled the SL to become
the highest (1.92 cm) in both environments. A total of47 accessions possessing the favorable allele AHGS1836-274detected in environment II (P = 1.25 × 10⁻³, PVE = 19.60%)had the highest SW (0.97 cm). Eight accessions possessingthe favorable allele AGGS1126-202 detected in environmentIV (P = 1.10 × 10⁻³, PVE = 11.22%) had the highestSL/W (2.18) and 6 accessions possessing the favorable alleleGM1854-115 detected in environment V had the highest HSW(88.76 g).
The 104 accessions were partitioned based on haplotypesbuilt by two associated markers to assess their combined effectson seed-related traits (Supplementary Table S4). AGGS1312(X locus) and AHGA44686 (Y locus) were associated withSL in Environment II and they detected 3 (X01, X02 andX03) and 8 (Y01, Y02, Y03, Y04, Y05, Y06, Y07, and Y08)alleles, respectively. We totally obtained 24 haplotypes betweenAGGS1312 and AHGA44686 across 104 accessions, only leaving7 haplotypes (n> 5) for effect estimation by multiple comparisonanalysis. X03Y04 had the highest SL (1.94 ± 0.17 cm, n = 14),followed by X03Y03 (1.85 ± 0.31 cm, n = 14), X03Y02(1.74 ± 0.10 cm, n = 6), X03Y01 (1.69 ± 0.09 cm, n = 6),X01Y06 (1.56 ± 0.12 cm, n = 5), X01Y07 (1.50 ± 0.19 cm,n = 12), X01Y08 (1.37 ± 0.14 cm, n = 8). For SL/W, thealleles at AGGS1272 (X locus) and AHGS2191 (Y locus) formedeight combined genotypes in Environment I, X1Y1, X1Y2, X2Y1,X2Y2, X3Y1, X3Y2, X4Y1, and X4Y2, among which, X1Y2, X3Y1,X3Y2, and X4Y2 were eliminated because of the little accessions(n< 5). X4Y1 had the highest SL/W (2.18± 0.10, n= 5), followedby X1Y1 (2.10 ± 0.10, n = 23), X2Y1 (1.79 ± 0.20, n = 18), andX2Y2 (1.64± 0.10, n= 28).
Frontiers in Plant Science | www.frontiersin.org 8 December 2017 | Volume 8 | Article 2105

fpls-08-02105 December 7, 2017 Time: 17:34 # 9
Zhao et al. Association Mapping for Seed-Related Traits in Peanut
TABLE 5 | Marker-trait associations detected with four seed-related traits (P < 1.81 × 10⁻³).
Traita Markerb Genetic positionc Environmentd P-value PVE(%)e
LG. Pos. (cM)
SL AGGS1312 B10 19.21 II 1.42E-03 13.32
AGGS1312 B10 19.21 III 1.21E-04 19.41
AGGS1312 B10 19.21 V 2.37E-04 17.34
AGGS1717 B01 71.44 IV 3.03E-04 20.69
AGGS2359 B01 73.60 IV 7.77E-04 11.89
AHGS2466 B01 74.55 IV 7.69E-04 11.64
AHGA44686 II 6.73E-04 26.23
AHGA44686 IV 2.44E-04 31.45
EM88 B04 56.37 II 2.50E-04 12.82
SW AHGS2155 IV 2.46E-04 17.48
AHGS1836 II 1.25E-03 19.60
SL/W AGGS1126 A04 37.50 IV 1.10E-03 11.22
AGGS1272 I 1.38E-03 18.84
AGGS1272 V 7.08E-04 22.02
AGGS2359 B01 73.60 IV 1.39E-03 11.29
AGGS2390 B08 29.81 IV 1.42E-03 19.23
AHGS1625 B01 74.02 IV 1.45E-03 14.12
AHGS1650 IV 3.40E-04 21.54
AHGS2191 B10 18.38 I 9.25E-04 12.77
AHGS2191 B10 18.38 IV 1.31E-03 11.66
ARS590 IV 1.45E-03 13.98
HSW 4F7 III 7.26E-04 11.61
AGGS1802 B10 11.90 I 3.15E-04 18.95
AHGS2561 II 1.69E-03 12.58
AHGS2787 I 8.64E-04 18.78
AHGA44686 I 5.26E-04 32.30
AHGA44686 II 2.93E-04 29.27
AHGA44686 IV 4.80E-04 28.74
AHGA44686 V 1.47E-03 26.46
GM1854 V 2.09E-04 17.96
aSL, seed length; SW, seed width; SL/W, ratio of seed length to width; HSW, hundred-seed weight. bBolds are associated markers detected in at least two environments.cGenetic position of markers on the genetic linkage map constructed by Huang et al. (2016a). d I: Wuhan in 2012; II: Wuhan in 2013; III: Wuhan in 2014; IV: Nanchong in2013; V: Nanchong in 2014. eThe phenotypic variation explained by each significant marker.
DISCUSSION
The Usefulness of Peanut Mini–Mini CoreCollection for Diversity and AssociationMappingPreviously, we developed a peanut mini-core collection of 298accessions that were selected from more than 6,000 accessionsdeposited in genebank of OCRI-CAAS (Jiang et al., 2014).In the present study, we typically used a smaller panel thatincluded a mini–mini core set of 99 accessions (Jiang et al.,2013) and 5 exotically diverse accessions in a comprehensivegenetic analysis. The experimental design is based on severalconsiderations as follows: (1) we want to genotype more markersto better tag LD relations between markers and underlyinggenes; (2) we expect to phenotype the quantitative traits inmore environments to better control the environmental bias. So,given funding and technical limitations, we successfully genotype
largely more markers (nearly sixfold) and collect phenotype inmore environments (5 vs. 3) compared to the previous studybased mini-core collection of 298 accessions. Given the highergenetic diversity of 104 than 298 accessions (0.54 vs. 0.265)(Table 2; Jiang et al., 2014), we expect this delicately assembledpanel may be useful to increase the mapping power becauseit enables to significantly increase marker density and calibrateenvironmental errors. However, we understand that some QTLswith minor effects may be missed due to sample size decrease.The advance of technologies in genotyping and phenotyping willallow us to thoroughly dissect the genetics of quantitative traits inlarger populations.
In the present study, the assembled peanut panel of 104accessions totally detected 1,950 alleles using 554 single-locusSSR markers, with an average of 3.50 alleles per locus. We foundthe number of alleles per locus is slightly lower than that inthe peanut mini core collection of 298 accessions (Jiang et al.,
Frontiers in Plant Science | www.frontiersin.org 9 December 2017 | Volume 8 | Article 2105

fpls-08-02105 December 7, 2017 Time: 17:34 # 10
Zhao et al. Association Mapping for Seed-Related Traits in Peanut
2014), and significantly lower than that identified in United Statespeanut mini core collection (Wang et al., 2011) and ‘ReferenceSet’ comprising 300 genotypes (Pandey et al., 2014). The geneticdrift should be one source for this difference as the smallerpopulation basically has a rare opportunity to sample moreallelic types. The number and type of SSR may be anotherpotential source, because the preference of single-locus SSR incurrent study may underestimate the value after significantlyreducing the genotyping complexity (Vigouroux et al., 2002).The gene diversity of the peanut panel in this study (0.54) wassimilar to that of United States peanut mini core collection(Wang et al., 2011), but significantly lower than ‘Reference Set’(Pandey et al., 2014), which may be caused by the differencebetween their germplasm backgrounds (Fukunaga et al., 2005).Interestingly, we found the present panel showed an apparentlyhigher gene diversity than the peanut mini core collection witha highly similar genetic background (Jiang et al., 2014). Weexpect that the assembly of the current panel may reform theallelic spectrums, largely reducing low-frequency alleles in 104accessions compared to 298 accessions, which would globallyelevate the diversity estimates per locus.
LD Decay in the Peanut PanelIn peanut, LD was roughly estimated to decay within 10 cM using32 SSR primers (Belamkar et al., 2011). In the present study,we updated the decay distance of LD to be 1 cM or 1.3 Mbusing 274 single-locus SSR loci in peanut. Comparatively, LDdecayed apparently slower in peanut than maize (5 Kb) (Yanet al., 2009), this should be driven by differing mating systems;while it was slightly slower than rice (200 Kb) (Huang et al.,2010) perhaps due to lack of sufficient markers to totally coverthe peanut genome. However, we found the decay distances werecomparable between peanut and rapeseed (1.2 Mb) (Wu et al.,2016) although they were mated in different ways. This may beattributed to the relatively narrow genetic background in thatrapeseed population, which could be seen that the estimatedbackground LD extent in rapeseed was as high as in peanut (i.e.,r2= 0.26 and r2
= 0.27). The LD of B subgenome decayedfaster than that of the A subgenome, which gave the clues thathistorical recombination events may more frequently happen in Bsubgenome rather than A subgenome. As shown in LD heatmaps(Supplementary Figure S2), we could not observed any apparentLD block on the neither chromosome, which may be causedby the low LD between pairwise markers. To clearly depict thehaplotype blocks, marker density in the present study is stillinsufficient.
It needs to note that, the limited population size (i.e., 104 lines)would be hard to avoid the statistical bias in estimating LD inpresent study, because of bottleneck effect and genetic drift (Flint-Garcia et al., 2003). The high LD and slowly LD decay maybeattributed to the small population used in this study, whichwill cause the low resolution of association analysis. As fasterLD decay imply the higher mapping resolution, thus we couldexpect that the sufficient resolution may be achieved in evenself-pollinated species if the mapping population was carefullyassembled that specially included diverse genetic backgrounds.
Marker-Trait Associations (MTAs) forSeed-Related Traits in PeanutSeed weight is controlled by a combination seed features suchas SL, SW, and seed thickness. Several genes for seed-relatedtraits have been obtained in many crops using the forwardgenetic strategy and reverse genetic strategies (Li et al., 2011;Liu et al., 2015; Si et al., 2016). In the previous studies, severalQTLs were identified in peanut using SSR markers and F2:3populations for SL, SW, and seed weight (Shirasawa et al.,2012; Huang L. et al., 2015; Chen et al., 2016). However, theutilization of F2:3 populations made it impossible to identifyconsistent and stable QTLs across locations and seasons forseed-related traits and decreased the resolution of linkagemapping due to lack of multiple environments. Therefore, inthis study, we performed association mapping for seed-relatedtraits in multiple environments containing multiple locations andseasons. Eventually, a total of 30 MTAs for seed-related traitswere detected with PVE ranging from 11.22 to 32.30% usingcMLM model which was sufficient to minimize false-positiveassociations. Of these, 5 markers were consistently identified in2, 3, or 4 environments (P < 1.81 × 10⁻³, Table 5), indicatingthat the QTLs associated with these markers were insensitiveto the multi-environments. In the “Reference Set” comprising300 genotypes, 9, 3, and 5 markers were detected for SL, SW,and seed weight, respectively (Pandey et al., 2014). In Chinesepeanut mini core collection, 4, 2, and 8 markers were associatedwith SL, SW, and HSW, respectively (Jiang et al., 2014). Themarkers associated with seed-related traits in our study wereinconsistent with those ones reported in the previous studies onlinkage mapping and association mapping and were consideredas novel markers identified for seed-related traits. The differencesof markers associated with seed-related traits were caused bythe different germplasms and the different SSR markers used inprevious and this study. In addition, the marker AHGA44686was simultaneously and repeatedly associated with SL and HSWin multiple environments with large PVE (26.23 ∼ 32.30%),indicating that AHGA44686 is promising genetic marker whichcan increase HSW via SL.
The combination of alleles from a few significant loci hadthe potential of explaining much larger phenotypic variation(Jia et al., 2012; Cai et al., 2014). In our study, AGGS1312and AHGA44686 explained 13.32 and 26.23% of phenotypicvariation of SL in environment II, respectively, while they jointlyexplained 62.00% of phenotypic variation for SL. This indicatedthat the seed-related traits may be inherited in an additivemanner (He et al., 2010; Cai et al., 2014), which made thebreeding for these traits more complicated. Additionally, theaccession (Zh.h6004_vul) possessing seven favorable alleles ofSL/W associated loci had the highest SL/W (2.56), while theaccession (Zh.h6275_fas) possessing no favorable allele of SL/Wassociated loci had the lowest SL/W (1.33) in environmentIV. For HSW, the accession (Zh.h5302_int) possessing twofavorable alleles of associated loci had the highest HSW(114.50 g), while three accessions (Zh.h3216_fas, Zh.h1312_hyp,and Zh.h0551_hir) containing no favorable alleles had the lowestHSW (21.30, 23.00, and 29.00 g, respectively) in environment V.
Frontiers in Plant Science | www.frontiersin.org 10 December 2017 | Volume 8 | Article 2105

fpls-08-02105 December 7, 2017 Time: 17:34 # 11
Zhao et al. Association Mapping for Seed-Related Traits in Peanut
These results suggested that the accumulation of favorable allelescould effectively enhance trait performance of peanut varietyfor seed-related traits and applicate in peanut yield molecularbreeding.
CONCLUSION
In this study, a highly diverse peanut panel consisting of104 accessions was used to perform association mapping forseed-related traits. It was firstly reported that the LD of Bsubgenome decayed faster than that of the A subgenome.Large phenotypic variation was observed for four seed-relatedtraits in the association panel. Using mixed linear model withpopulation structure and kinship, a total of 30 significant single-locus SSR markers were detected to be associated with fourseed-related traits (P < 1.81 × 10⁻³) across five differentenvironments. The favorable alleles of associated markersfor each seed-related trait and the optimal combination offavorable alleles of associated markers were identified tosignificantly enhance trait performance, revealing a potentialof utilization of these associated markers in peanut breedingprogram.
AUTHOR CONTRIBUTIONS
HJ and BL designed the experiment. XR and YX plantedthe mapping population. BW performed SSR polymorphismdetection. JZ and ZL performed SSR genotyping in the mappingpopulation. LH, XR, YC, XZ, WC, and YX performed seed-related traits evaluation in the mapping population. JZ and
LH assessed the population structure, relative kinship andlinkage disequilibrium level in the peanut panel, and performedassociation analysis. JZ, LH, and MP wrote the manuscript. HL,YL, RV, BL, and HJ helped in interpreting the results and revisedthe manuscript. All of the authors read and approved the finalmanuscript.
ACKNOWLEDGMENTS
This work was supported by the National Natural ScienceFoundations of China (31401420, 31271764, 31371662,31471534, and 31461143022), the National Plan for Scienceand Technology Support (2013BAD01B03-08) and the ChinaAgriculture Research System (CARS-14-peanut germplasmresource evaluation).
SUPPLEMENTARY MATERIAL
The Supplementary Material for this article can be found onlineat: https://www.frontiersin.org/articles/10.3389/fpls.2017.02105/full#supplementary-material
FIGURE S1 | Manhattan plots of association analysis using the mixed linearmodel (MLM) for four traits. (A) Seed length (SL); (B) seed width (SW); (C) ratio ofseed length to width (SL/W); and (D) hundred-seed weight (HSW). The blue plots,red plots, green plots, purple plots, light blue plots represent the associatedsignals for five different environments (Wuhan in 2012, Wuhan in 2013, Wuhan in2014, Nanchong in 2013, and Nanchong in 2014), respectively. The black dashedhorizontal line depict the significant thresholds that is −log101/554 = 2.74.
FIGURE S2 | Linkage disequilibrium (LD) heatmap in 20 linkage groups. Themarkers in red are the significant association signals.
REFERENCESAbdurakhmonov, I. Y., and Abdukarimov, A. (2008). Application of association
mapping to understanding the genetic diversity of plant germplasm resources.Int. J. Plant Genomics 2008, 574927. doi: 10.1155/2008/574927
Belamkar, V., Selvaraj, M. G., Ayers, J. L., Payton, P. R., Puppala, N., andBurow, M. D. (2011). A first insight into population structure and linkagedisequilibrium in the US peanut minicore collection. Genetica 139, 411–429.doi: 10.1007/s10709-011-9556-2
Bertioli, D. J., Cannon, S. B., Froenicke, L., Huang, G., Farmer, A. D., Cannon,E. K., et al. (2016). The genome sequences of Arachis duranensis and Arachisipaensis, the diploid ancestors of cultivated peanut. Nat. Genet. 48, 438–446.doi: 10.1038/ng.3517
Bradbury, P. J., Zhang, Z., Kroon, D. E., Casstevens, T. M., Ramdoss, Y.,and Buckler, E. S. (2007). TASSEL: software for association mapping ofcomplex traits in diverse samples. Bioinformatics 23, 2633–2635. doi: 10.1093/bioinformatics/btm308
Cai, D., Xiao, Y., Yang, W., Ye, W., Wang, B., Younas, M., et al. (2014). Associationmapping of six yield-related traits in rapeseed (Brassica napus L.). Theor. Appl.Genet. 127, 85–96. doi: 10.1007/s00122-013-2203-9
Chen, S., Nelson, M., Ghamkhar, K., Fu, T., and Cowling, W. (2008). Divergentpatterns of allelic diversity from similar origins: the case of oilseed rape(Brassica napus L.) in China and Australia. Genome 51, 1–10. doi: 10.1139/g07-095
Chen, W., Jiao, Y., Cheng, L., Huang, L., Liao, B., Tang, M., et al. (2016).Quantitative trait locus analysis for pod- and kernel-related traits in thecultivated peanut (Arachis hypogaea L.). BMC Genet. 17:25. doi: 10.1186/s12863-016-0337-x
Comadran, J., Thomas, W. T. B., Van Eeuwijk, F. Á, Ceccarelli, S., Grando, S.,Stanca, A. M., et al. (2009). Patterns of genetic diversity and linkagedisequilibrium in a highly structured Hordeum vulgare association-mappingpopulation for the Mediterranean basin. Theor. Appl. Genet. 119, 175–187.doi: 10.1007/s00122-009-1027-0
Cuc, L. M., Mace, E. S., Crouch, J. H., Quang, V. D., Long, T. D., and Varshney,R. K. (2008). Isolation and characterization of novel microsatellite markersand their application for diversity assessment in cultivated groundnut (Arachishypogaea). BMC Plant Biol. 8:55. doi: 10.1186/1471-2229-8-55
Evanno, G., Regnaut, S., and Goudet, J. (2005). Detecting the number of clustersof individuals using the software structure: a simulation study. Mol. Ecol. 14,2611–2620. doi: 10.1111/j.1365-294X.2005.02553.x
Ferguson, M., Burow, M., Schulze, S., Bramel, P., Paterson, A., Kresovich, S.,et al. (2004). Microsatellite identification and characterization in peanut(A. hypogaea L.). Theor. Appl. Genet. 108, 1064–1070. doi: 10.1007/s00122-003-1535-2
Flint-Garcia, S. A., Thornsberry, J. M., and Buckler, E. S. I. V. (2003). Structureof linkage disequilibrium in plants. Annu. Rev. Plant Biol. 54, 357–374.doi: 10.1146/annurev.arplant.54.031902.134907
Fukunaga, K., Hill, J., Vigouroux, Y., Matsuoka, Y., Sanchez, G. J., Liu, K., et al.(2005). Genetic diversity and population structure of teosinte. Genetics 169,2241–2254. doi: 10.1534/genetics.104.031393
Hardy, O. J., and Vekemans, X. (2002). SPAGEDi: a versatile computer programto analyse spatial genetic structure at the individual or population levels. Mol.Ecol. Notes 2, 618–620. doi: 10.1046/j.1471-8286.2002.00305.x
He, G., Meng, R., Newman, M., Gao, G., Pittman, R., and Prakash, C. S. (2003).Microsatellites as DNA markers in cultivated peanut (Arachis hypogaea L.).BMC Plant Biol. 3:3.
Frontiers in Plant Science | www.frontiersin.org 11 December 2017 | Volume 8 | Article 2105

fpls-08-02105 December 7, 2017 Time: 17:34 # 12
Zhao et al. Association Mapping for Seed-Related Traits in Peanut
He, Q., Zhang, K., Xu, C., and Xing, Y. (2010). Additive and additive × additiveinteraction make important contributions to spikelets per panicle in rice nearisogenic (Oryza sativa L.) lines. J. Genet. Genomics 37, 795–803. doi: 10.1016/s1673-8527(09)60097-7
Hirschhorn, J. N., and Daly, M. J. (2005). Genome-wide association studies forcommon diseases and complex traits. Nat. Rev. Genet. 6, 95–108. doi: 10.1038/nrg1521
Huang, L., He, H., Chen, W., Ren, X., Chen, Y., Zhou, X., et al. (2015). Quantitativetrait locus analysis of agronomic and quality-related traits in cultivated peanut(Arachis hypogaea L.).Theor. Appl. Genet. 128, 1103–1115. doi: 10.1007/s00122-015-2493-1
Huang, L., Ren, X., Wu, B., Li, X., Chen, W., Zhou, X., et al. (2016a). Developmentand deployment of a high-density linkage map identified quantitative traitloci for plant height in peanut (Arachis hypogaea L.). Sci. Rep. 6:39478.doi: 10.1038/srep39478
Huang, L., Wu, B., Zhao, J., Li, H., Chen, W., Zheng, Y., et al. (2016b).Characterization and transferable utility of microsatellite markers in the wildand cultivated Arachis species. PLOS ONE 11:e0156633. doi: 10.1371/journal.pone.0156633
Huang, X., Wei, X., Sang, T., Zhao, Q., Feng, Q., Zhao, Y., et al. (2010). Genome-wide association studies of 14 agronomic traits in rice landraces. Nat. Genet. 42,961–967. doi: 10.1038/ng.695
Huang, X., Yang, S., Gong, J., Zhao, Y., Feng, Q., Gong, H., et al. (2015). Genomicanalysis of hybrid rice varieties reveals numerous superior alleles that contributeto heterosis. Nat. Commun. 6:6258. doi: 10.1038/ncomms7258
Jia, L., Yan, W., Zhu, C., Agrama, H. A., Jackson, A., Yeater, K., et al. (2012). Allelicanalysis of sheath blight resistance with association mapping in rice. PLOS ONE7:e32703. doi: 10.1371/journal.pone.0032703.g001
Jiang, H., Duan, N., and Ren, X. (2006). Descriptors and Data Standard for Peanut(Arachis spp.). Beijing: China Agriculture Press.
Jiang, H., Huang, L., Ren, X., Chen, Y., Zhou, X., Xia, Y., et al. (2014). Diversitycharacterization and association analysis of agronomic traits in a Chinesepeanut (Arachis hypogaea L.) mini-core collection. J. Integr. Plant Biol. 56,159–169. doi: 10.1111/jipb.12132
Jiang, H., Ren, X., Chen, Y., Huang, L., Zhou, X., Huang, J., et al. (2013).Phenotypic evaluation of the Chinese mini-mini core collection of peanut(Arachis hypogaea L.) and assessment for resistance to bacterial wilt diseasecaused by Ralstonia solanacearum. Plant Genet. Resour. 11, 77–83. doi: 10.1017/S1479262112000408
Jin, L., Lu, Y., Xiao, P., Sun, M., Corke, H., and Bao, J. (2010). Genetic diversity andpopulation structure of a diverse set of rice germplasm for association mapping.Theor. Appl. Genet. 121, 475–487. doi: 10.1007/s00122-010-1324-7
Kochert, G., Stalker, H. T., Gimenes, M., Galgaro, L., Lopes, C. R., and Moore, K.(1996). RFLP and cytogenetic evidence on the origin and evolution ofallotetraploid domesticated peanut, Arachis hypogaea (Leguminosae). Am. J.Bot. 83, 1282–1291. doi: 10.2307/2446112
Li, H., Younas, M., Wang, X., Li, X., Chen, L., Zhao, B., et al. (2012). Developmentof a core set of single-locus SSR markers for allotetraploid rapeseed (Brassicanapus L.). Theor. Appl. Genet. 126, 937–947. doi: 10.1007/s00122-012-2027-z
Li, Y., Fan, C., Xing, Y., Jiang, Y., Luo, L., Sun, L., et al. (2011). Natural variationin GS5 plays an important role in regulating grain size and yield in rice. Nat.Genet. 43, 1266–1269. doi: 10.1038/ng.977
Liang, X., Chen, X., Hong, Y., Liu, H., Zhou, G., Li, S., et al. (2009). Utility of EST-derived SSR in cultivated peanut (Arachis hypogaea L.) and Arachis wild species.BMC Plant Biol. 9:35. doi: 10.1186/1471-2229-9-35
Liu, J., Hua, W., Hu, Z., Yang, H., Zhang, L., Li, R., et al. (2015). Natural variation inARF18 gene simultaneously affects seed weight and silique length in polyploidrapeseed. Proc. Natl. Acad. Sci. U.S.A. 112, E5123–E5132. doi: 10.1073/pnas.1502160112
Liu, K., and Muse, S. V. (2005). PowerMarker: An Integrated Analysis Environmentfor Genetic Marker Analysis. Oxford: Oxford University Press.
Lquira, E., Humira, S., and Francois, B. (2015). Association mapping of QTLs forsclerotinia stem rot resistance in a collection of soybean plant introductionsusing a genotyping by sequencing (GBS) approach. BMC Plant Biol. 15:5.doi: 10.1186/s12870-014-0408-y
Mather, K. A., Caicedo, A. L., Polato, N. R., Olsen, K. M., McCouch, S., andPurugganan, M. D. (2007). The extent of linkage disequilibrium in rice (Oryzasativa L.). Genetics 177, 2223–2232. doi: 10.1534/genetics.107.079616
Moretzsohn, M., Leoi, L., Proite, K., Guimaraes, P., Leal-Bertioli, S. C. M.,Gimenes, M., et al. (2005). A microsatellite-based, gene-rich linkage map forthe AA genome of Arachis (Fabaceae). Theor. Appl. Genet. 111, 1060–1071.doi: 10.1007/s00122-005-0028-x
Naito, Y., Suzuki, S., Iwata, Y., and Kuboyama, T. (2008). Genetic diversity andrelationship analysis of peanut germplasm using SSR markers. Breed. Sci. 58,293–300. doi: 10.1270/jsbbs.58.293
Pandey, M. K., Upadhyaya, H. D., Rathore, A., Vadez, V., Sheshshayee, M.,Sriswathi, M., et al. (2014). Genomewide association studies for 50 agronomictraits in peanut using the ‘Reference Set’ comprising 300 genotypes from48 countries of the semi-arid tropics of the world. PLOS ONE 9:e105228.doi: 10.1371/journal.pone
Pattee, H. E., Isleib, T. G., Gorbet, D. W., and Giesbrecht, F. G. (2002). Selection ofalternative genetic sources of large-seed size in Virginia-type peanut: evaluationof sensory, composition, and agronomic characteristics. J. Agric. Food Chem. 50,4885–4889. doi: 10.1021/jf025601j
Prathiba, K. M., and Reddy, M. U. (1994). Nutrient composition of groundnutcultures (Arachis hypogaea L.) in relation to their kernel size. Plant Foods Hum.Nutr. 45, 365–369. doi: 10.1007/bf01088086
Pritchard, J., Stephens, M., and Donnelly, P. (2000). Inference of populationstructure using multilocus genotype data. Genetics 155, 945–959.
Qin, H., Feng, S., Chen, C., Guo, Y., Knapp, S., Culbreath, A., et al. (2012).An integrated genetic linkage map of cultivated peanut (Arachis hypogaeaL.) constructed from two RIL populations. Theor. Appl. Genet. 124, 653–664.doi: 10.1007/s00122-011-1737-y
Shirasawa, K., Bertioli, D. J., Varshney, R. K., Moretzsohn, M. C., Leal-Bertioli, S. C.,Thudi, M., et al. (2013). Integrated consensus map of cultivated peanut and wildrelatives reveals structures of the A and B genomes of Arachis and divergence ofthe legume genomes. DNA Res. 20, 173–184. doi: 10.1093/dnares/dss042
Shirasawa, K., Koilkonda, P., Aoki, K., Hirakawa, H., Tabata, S., Watanabe, M., et al.(2012). In silico polymorphism analysis for the development of simple sequencerepeat and transposon markers and construction of linkage map in cultivatedpeanut. BMC Plant Biol. 12:80. doi: 10.1186/1471-2229-12-80
Si, L., Chen, J., Huang, X., Gong, H., Luo, J., Hou, Q., et al. (2016).OsSPL13 controlsgrain size in cultivated rice. Nat. Genet. 48, 447–456. doi: 10.1038/ng.3518
Tang, M., Chen, Y., Ren, X., Huang, L., Zhou, X., Yan, H., et al. (2012). Geneticdiversity of Arachis accessions by EST-SSR from cultivated peanut (Arachishypogaea L.). Acta Agron. Sin. 38, 1221–1231. doi: 10.3724/SP.J.1006.2012.01221
Vigouroux, Y., Jaqueth, J. S., Matsuoka, Y., Smith, O. S., Beavis, W. D., Smith,J. S. C., et al. (2002). Rate and pattern of mutation at microsatellite loci in maize.Mol. Biol. Evol. 19, 1251–1260. doi: 10.1093/oxfordjournals.molbev.a004186
Wang, H., Penmetsa, R. V., Yuan, M., Gong, L., Zhao, Y., Guo, B., et al. (2012).Development and characterization of BAC-end sequence derived SSRs, andtheir incorporation into a new higher density genetic map for cultivated peanut(Arachis hypogaea L.). BMC Plant Biol. 12:10. doi: 10.1186/1471-2229-12-10
Wang, M. L., Sukumaran, S., Barkley, N. A., Chen, Z., Chen, C. Y., Guo, B., et al.(2011). Population structure and marker-trait association analysis of the USpeanut (Arachis hypogaea L.) mini-core collection. Theor. Appl. Genet. 123,1307–1317. doi: 10.1007/s00122-011-1668-7
Wu, Z., Wang, B., Chen, X., Wu, J., King, G. J., Xiao, Y., et al. (2016). Evaluationof linkage disequilibrium pattern and association study on seed oil content inBrassica napus using ddRAD sequencing. PLOSONE 11:e0146383. doi: 10.1371/journal.pone.0146383
Xiao, Y., Cai, D., Yang, W., Ye, W., Younas, M., Wu, J., et al. (2012). Geneticstructure and linkage disequilibrium pattern of a rapeseed (Brassica napus L.)association mapping panel revealed by microsatellites. Theor. Appl. Genet. 125,437–447. doi: 10.1007/s00122-012-1843-5
Xiao, Y., Tong, H., Yang, X., Xu, S., Pan, Q., Qiao, F., et al. (2016). Genome-widedissection of the maize ear genetic architecture using multiple populations. NewPhytol. 210, 1095–1106. doi: 10.1111/nph.13814
Xu, L., Hu, K., Zhang, Z., Guan, C., Chen, S., Hua, W., et al. (2015). Genome-wideassociation study reveals the genetic architecture of flowering time in rapeseed(Brassica napus L.). DNA Res. 23, 43–52. doi: 10.1093/dnares/dsv035
Yan, J., Shah, T., Warburton, M. L., Buckler, E. S., McMullen, M. D., and Crouch, J.(2009). Genetic characterization and linkage disequilibrium estimation of aglobal maize collection using SNP markers. PLOS ONE 4:e8451. doi: 10.1371/journal.pone.0008451
Frontiers in Plant Science | www.frontiersin.org 12 December 2017 | Volume 8 | Article 2105

fpls-08-02105 December 7, 2017 Time: 17:34 # 13
Zhao et al. Association Mapping for Seed-Related Traits in Peanut
Zhang, J., Liang, S., Duan, J., Wang, J., Chen, S., Cheng, Z., et al. (2012). De novoassembly and characterisation of the transcriptome during seed development,and generation of genic-SSR markers in peanut (Arachis hypogaea L.). BMCGenomics 13:90. doi: 10.1186/1471-2164-13-90
Zhang, Z., Ersoz, E., Lai, C. Q., Todhunter, R. J., Tiwari, H. K., Gore, M. A., et al.(2010). Mixed linear model approach adapted for genome-wide associationstudies. Nat. Genet. 42, 355–360. doi: 10.1038/ng.546
Zhou, X., Dong, Y., Zhao, J., Huang, L., Ren, X., Chen, Y., et al. (2016). Genomicsurvey sequencing for development and validation of single-locus SSR markersin peanut (Arachis hypogaea L.). BMC Genomics 17:420. doi: 10.1186/s12864-016-2743-x
Conflict of Interest Statement: The authors declare that the research wasconducted in the absence of any commercial or financial relationships that couldbe construed as a potential conflict of interest.
Copyright © 2017 Zhao, Huang, Ren, Pandey, Wu, Chen, Zhou, Chen, Xia, Li, Luo,Lei, Varshney, Liao and Jiang. This is an open-access article distributed under theterms of the Creative Commons Attribution License (CC BY). The use, distribution orreproduction in other forums is permitted, provided the original author(s) or licensorare credited and that the original publication in this journal is cited, in accordancewith accepted academic practice. No use, distribution or reproduction is permittedwhich does not comply with these terms.
Frontiers in Plant Science | www.frontiersin.org 13 December 2017 | Volume 8 | Article 2105