geneticalgorithmsforthe segmentationand classificationof
TRANSCRIPT
BruHyp, Brugge, 10 October 2006
Genetic algorithms for the segmentation and classification of hyperspectral imagery of Schiermonnikoog – The Netherlands
Lieven Verbeke – Karolien Scheerlinck – Frieke Van Coilli e - Robert De WulfLaboratory of Forest Management and Spatial Information TechniquesDepartment of Forest and Water Management – Ghent University
BruHyp, Brugge, 10 October 2006
Introduction of the HISMAC projectTitle of the project:
“Object-based segmentation and biophysical characterization of saltmarsh vegetation using hyperspectral AHS imagery”
Therefore HISMACHyperspectral Imagery for SaltMArsh Characterization
Study area� Schiermonnikoog, The Netherlands� Coastal ecosystem � Saltmarsh vegetation� Many additional data available
ImageryAHS hyperspectral data (2005)
BruHyp, Brugge, 10 October 2006
HISMAC: partners� Laboratory of Forest Management and Spatial Informa tion Techniques – UG
� Centre for Geo-Information Science, Wageningen Unive rsity and Research Centre, Wageningen, The Netherlands
� The International Institute of Geo-information Scie nce and Earth Observation (ITC), Enschede, The Netherlands
� Rijkswaterstaat (RWS), The Netherlands
BruHyp, Brugge, 10 October 2006
HISMAC: objectivesThe main objectives� to further develop object-based approaches for hyperspectral image analysis� to facilitate a sustainable management of wetland ecosystems
Secondary research objectives are � to evaluate the utility of the developed algorithms to map vegetation changes occurred between 1999 (HyMap hyperspectral imagery) and 2005 (AHS image cube)� to demonstrate the benefits of an object-based analysis of hyperspectral imagery compared to traditional image processing techniques using conventional multi-spectral data
Objective of our research group (this presentation)Development of improved algorithms for the segmentation and classification of hyperspectral imagery, using advanced feature selection and classification approaches
� Genetic algorithms� Neural networks� Support Vector Machines
BruHyp, Brugge, 10 October 2006
The study area (1)Schiermonnikoog, The Netherlands� Waddeneiland� “Recently” formed� Inhabited
BruHyp, Brugge, 10 October 2006
The study area (2)� The “kwelder” (and dunes)� Salt marshes� Partially and periodically inundated� several natural gradients:
– Salinity– Humidity– Elevation– Soil
BruHyp, Brugge, 10 October 2006
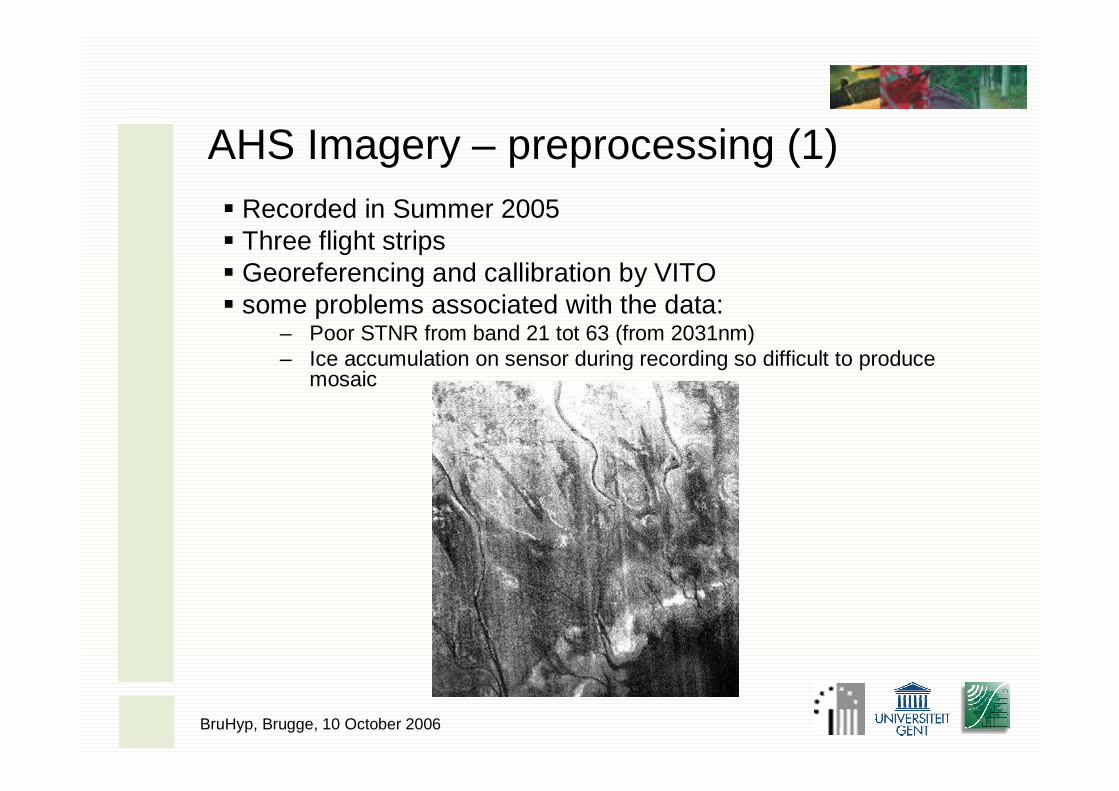
AHS Imagery – preprocessing (1)� Recorded in Summer 2005� Three flight strips� Georeferencing and callibration by VITO� some problems associated with the data:
– Poor STNR from band 21 tot 63 (from 2031nm)– Ice accumulation on sensor during recording so difficult to produce
mosaic
BruHyp, Brugge, 10 October 2006
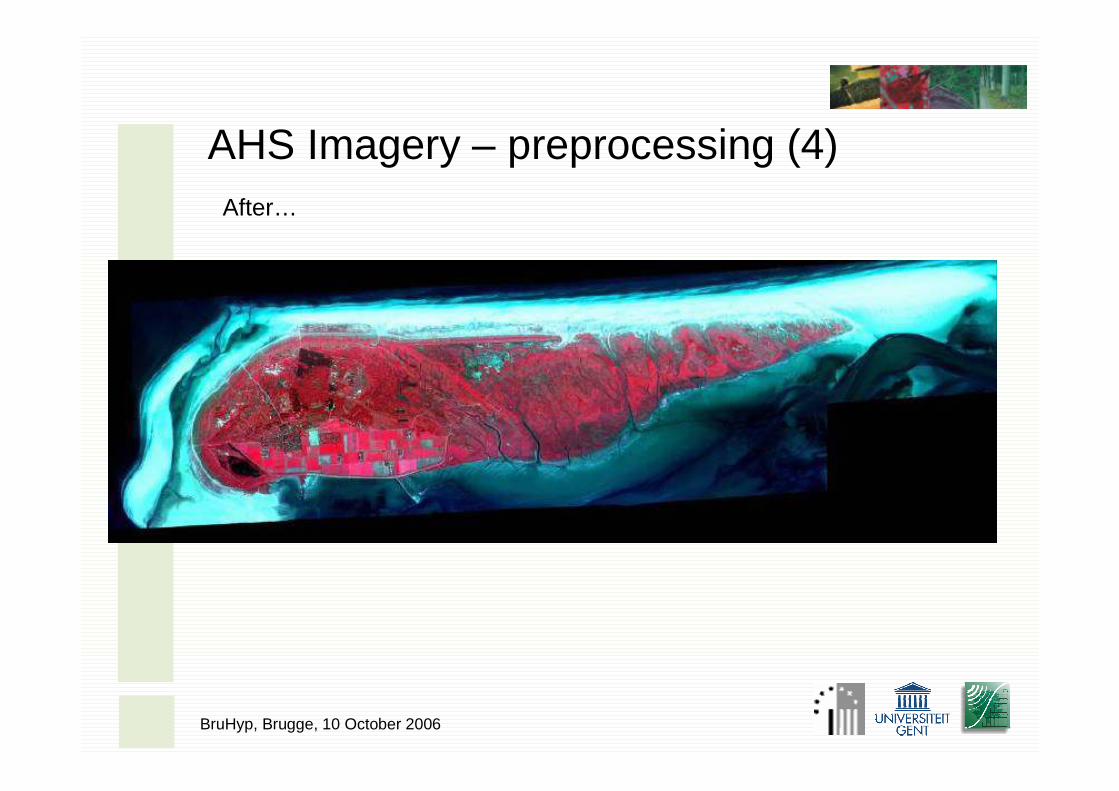
AHS Imagery – preprocessing (2)� Information in “bad” bands might be recovered partially by integrating reflectance over segments established using “good” bands� Ice accumulation: ENVI cross track illumination correction not sufficient, so
– Implementation (IDL) of band matching algorithm– For overlapping regions: match reflectance using multiple
regression:
targetDN=f(x,y,originalDN), with f~linear or quadratic function
- Both x and y were found to contribute statistically significantly to the regression analysis
- Result:

BruHyp, Brugge, 10 October 2006
AHS Imagery – preprocessing (3)Before…
BruHyp, Brugge, 10 October 2006
AHS Imagery – preprocessing (4)After…
BruHyp, Brugge, 10 October 2006
Field survey (1)• Carried out in August 2006• Survey date different from image recording data
– Shouldn't be to much of a problem: we are not collecting field spectra, vegetation is assumed to have changed very little, still potential source of classification errors
– Might be problem for agriculture and grazed areas– Questionnaire for farmers
• Recording of coverage of species– Targeted at remote sensing: 3.5 m spatial resolution– GPS readings of positions– Homogeneous regions– Estimated cover (in %) of individual species that are sufficiently present in
terms of coverage area
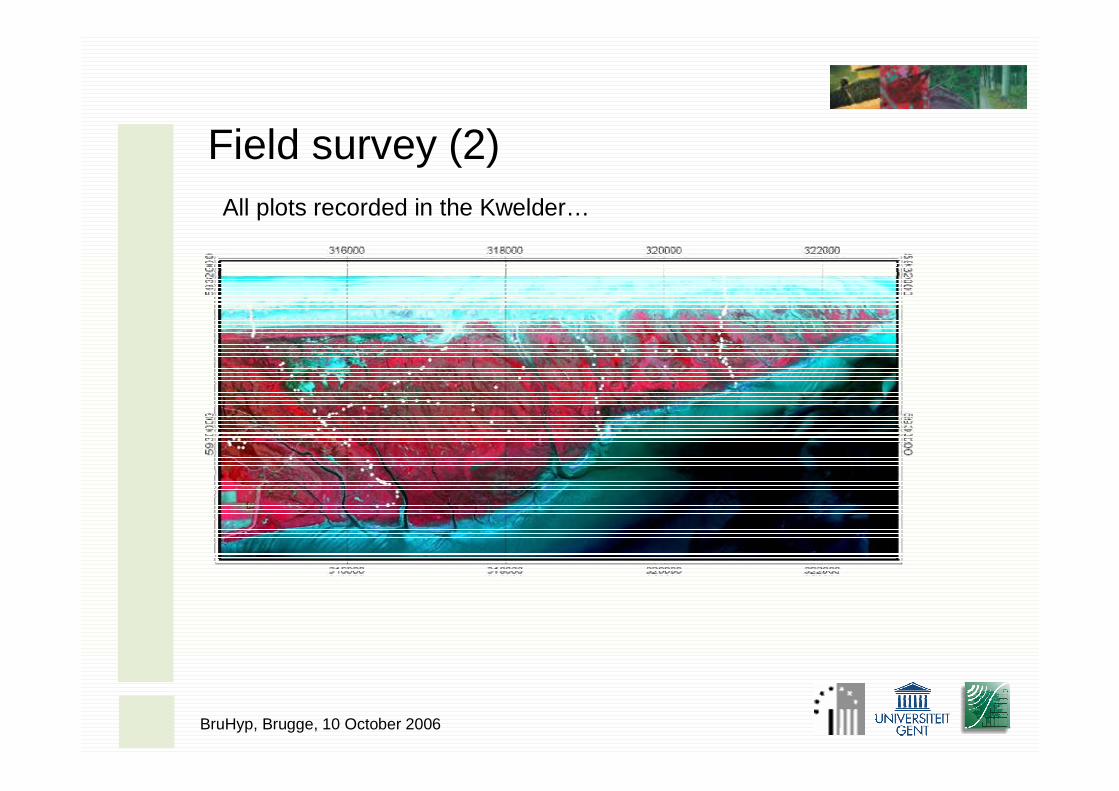
• A total of 315 observations, covering the entire island, with a focus on the “kwelder” and dunes
• Whenever possible, points were recorded on profiles parallel with the ecological gradients
BruHyp, Brugge, 10 October 2006
Field survey (2)All plots recorded in the Kwelder…
BruHyp, Brugge, 10 October 2006
Field survey (3)• For the plots collected in the Kwelder and dunes:
– Ordination using PCA– Clustering– Result: 20 vegetation classes (ecological meaning)– Investigation of the PCA components and loadings reveals that
vegetation classes are largely based on the presence, absence and abundance of salt tolerant species
• Buffer around plots• Add water and man-made structures (roads, bridges)
REFERENCE DATASET
BruHyp, Brugge, 10 October 2006
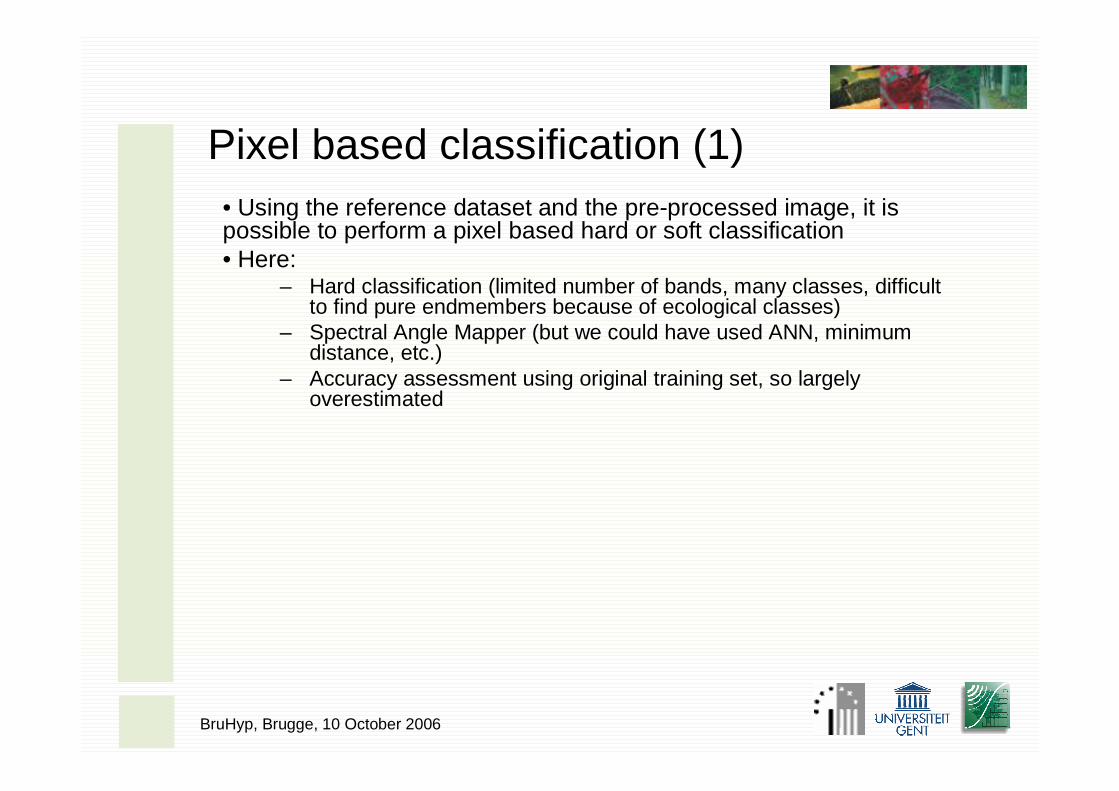
Pixel based classification (1)• Using the reference dataset and the pre-processed image, it is possible to perform a pixel based hard or soft classification• Here:
– Hard classification (limited number of bands, many classes, difficult to find pure endmembers because of ecological classes)
– Spectral Angle Mapper (but we could have used ANN, minimum distance, etc.)
– Accuracy assessment using original training set, so largely overestimated
BruHyp, Brugge, 10 October 2006
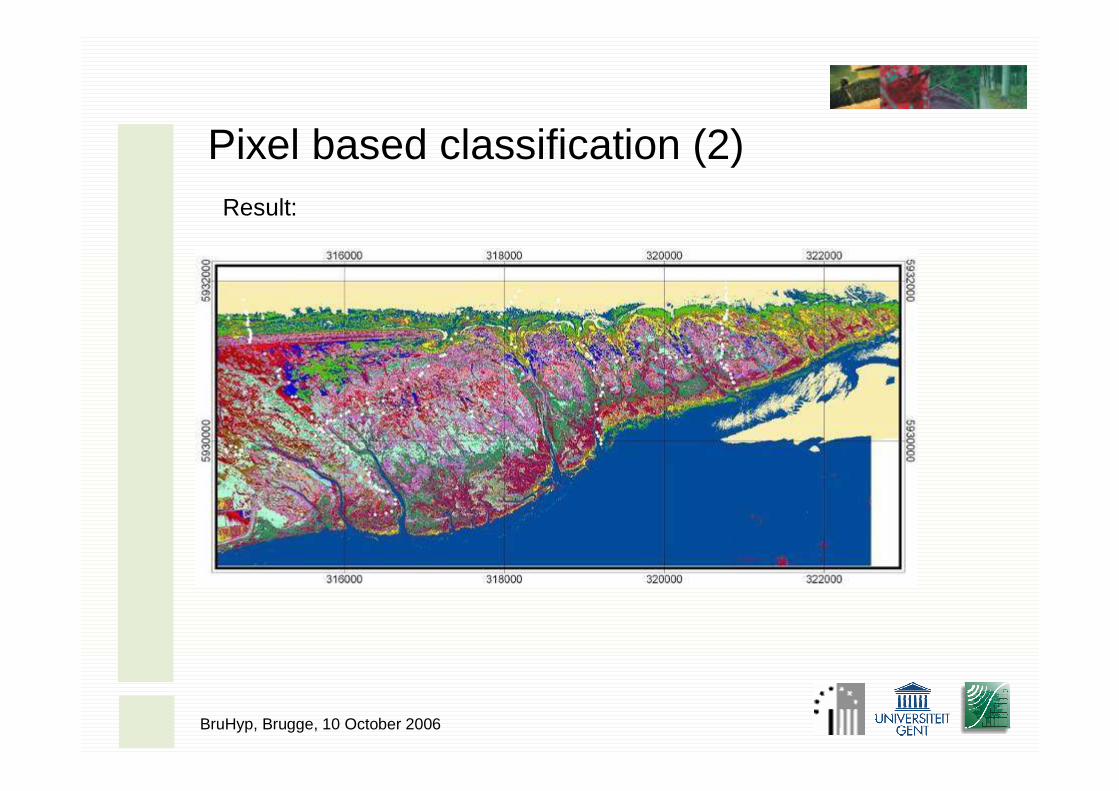
Pixel based classification (2)Result:
BruHyp, Brugge, 10 October 2006
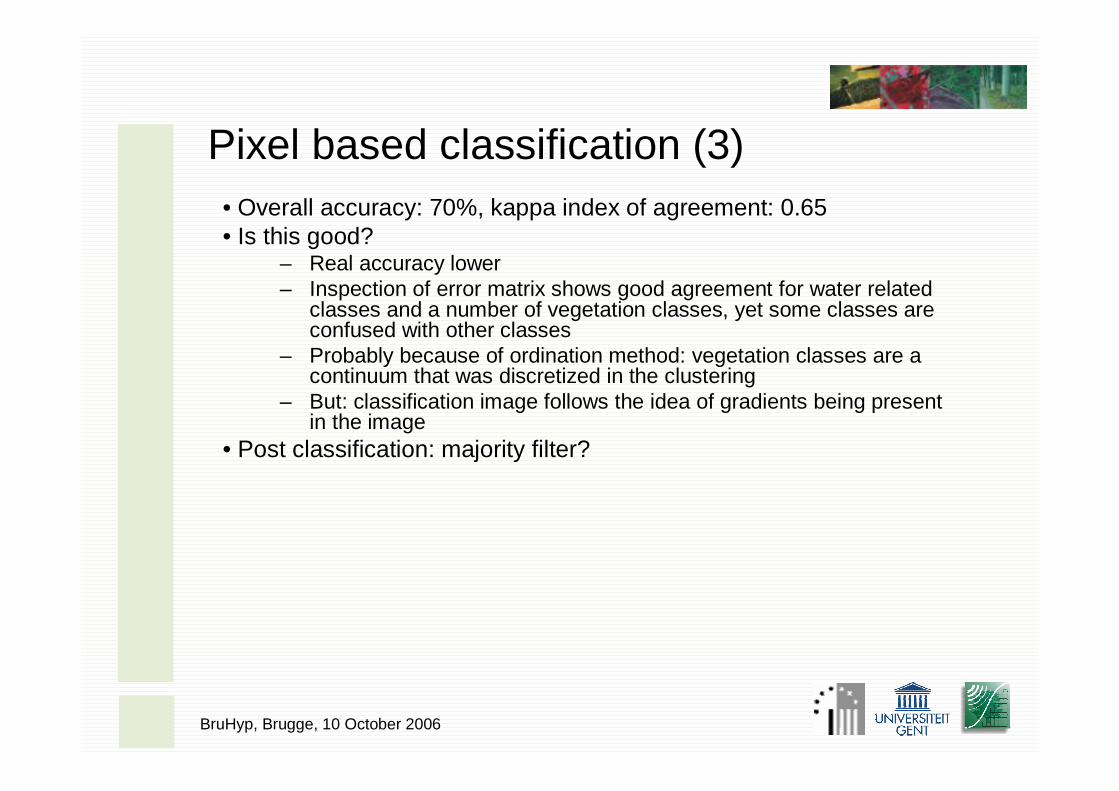
Pixel based classification (3)• Overall accuracy: 70%, kappa index of agreement: 0.65• Is this good?
– Real accuracy lower– Inspection of error matrix shows good agreement for water related
classes and a number of vegetation classes, yet some classes areconfused with other classes
– Probably because of ordination method: vegetation classes are a continuum that was discretized in the clustering
– But: classification image follows the idea of gradients being present in the image
• Post classification: majority filter?
BruHyp, Brugge, 10 October 2006
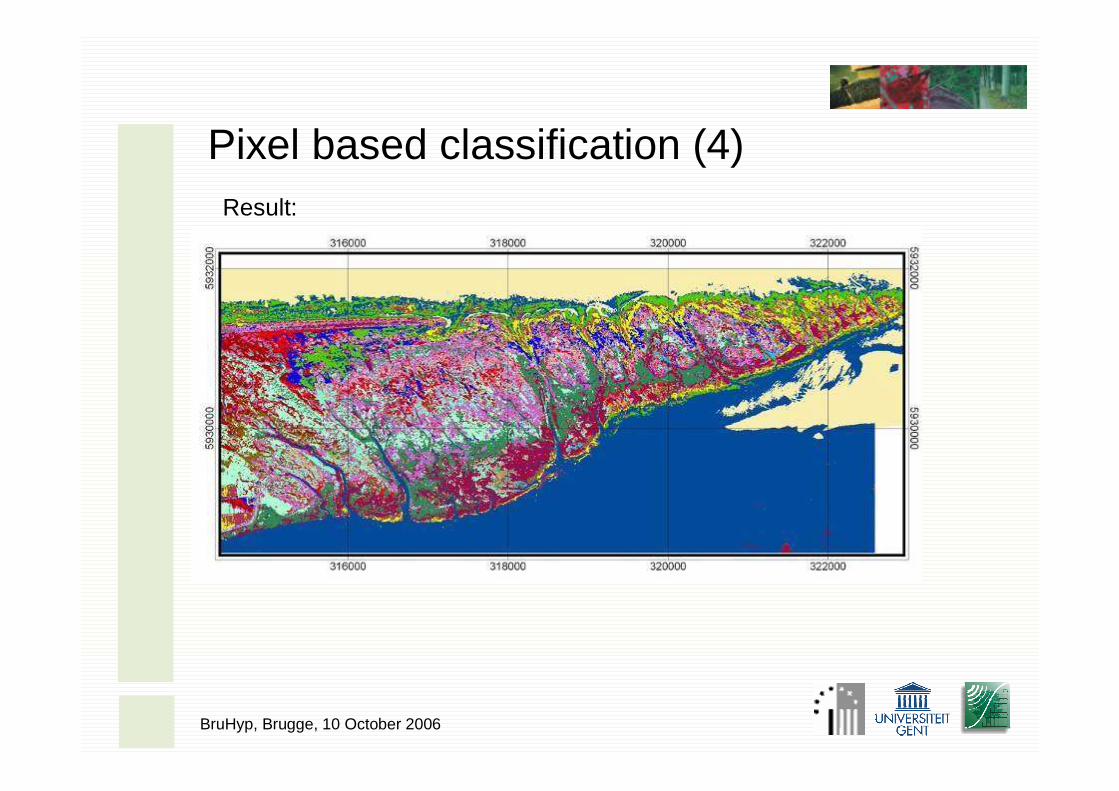
Pixel based classification (4)Result:
BruHyp, Brugge, 10 October 2006
Pixel based classification (5)• Use of majority filter is bad practice (in this case)
– Assignment of vegetation class based on neighbours– Looks better, but introducing errors– If we assume beforehand that groups of similar pixels exist, it’s
better to use a segmentation approach before classification
BruHyp, Brugge, 10 October 2006
Image segmentation (1)• The grouping of pixels (and small segments) that are similar according to some homogeneity criterium
– Could be anything– Spectral distances– Spectral angle– Variance reducing– Centre of gravity
• Two approaches: – eCognition (spectral): a segment is merged with an other segment
if merging the two segments results in a variance that is lower than the variance would be if the initial segment were to be merged with any other candidate neighbour segment
– Our own (be it not too original) approach: segments are merged with any candidate neighbour that is closest according to some distance measure. Implemented in IDL
– Our distance measure is a weighted combination of• Spectral distances (Euclidian distance between spectral vectors)• Spectral angle• Distance between centres of gravity
BruHyp, Brugge, 10 October 2006
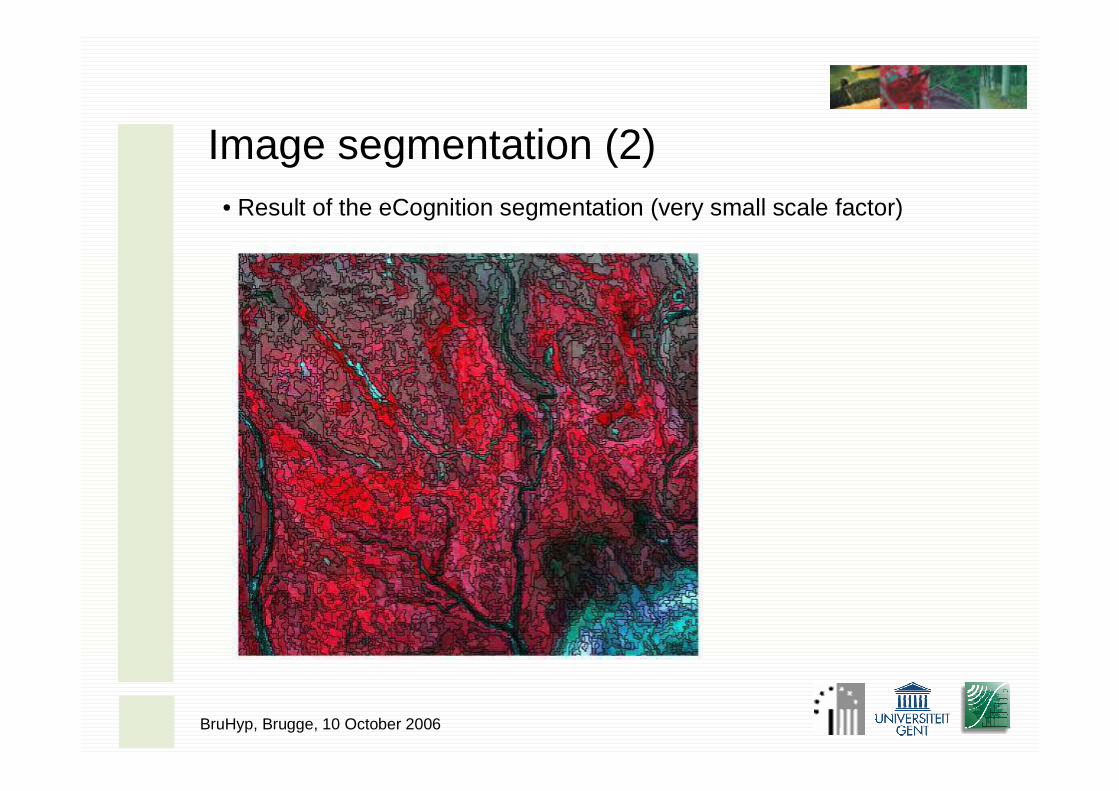
Image segmentation (2)• Result of the eCognition segmentation (very small scale factor)
BruHyp, Brugge, 10 October 2006
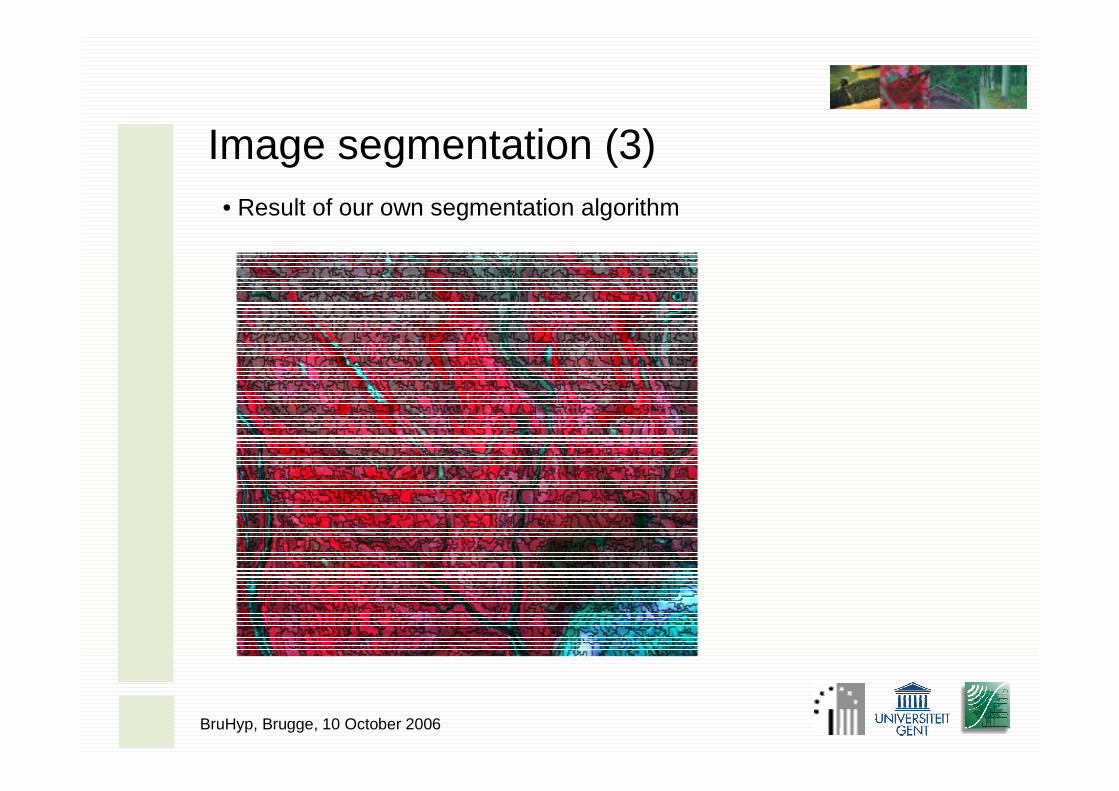
Image segmentation (3)• Result of our own segmentation algorithm
BruHyp, Brugge, 10 October 2006
Image segmentation (4)• Now, which one is best?
– Visually: the eCognition segmentation, because of the larger variety in segment size, and the detailed segments around water
– Still, water is not the issue (easily discerned on hyperspectralimagery
– No established criterion for the assessment of segmentations• Would be possible if reference segments were available• Possibly: reduction of variance as a function of number of segments• Neither measure overall segmentation performances
– Other possibility:• Based on the idea that segments containing homogeneous regions
should have their width aligned with any ecological gradient that induces different vegetation and consequently different spectralresponses
• Measure the angle of the length direction of a segment• How to do this?
– By running a PCA on the coordinates of all pixels contained in the segment– Eigenvalues of the covariance matrix are a measure for the deviation of a
circle– Eigenvectors can be used to calculate the general angle of the segment
BruHyp, Brugge, 10 October 2006
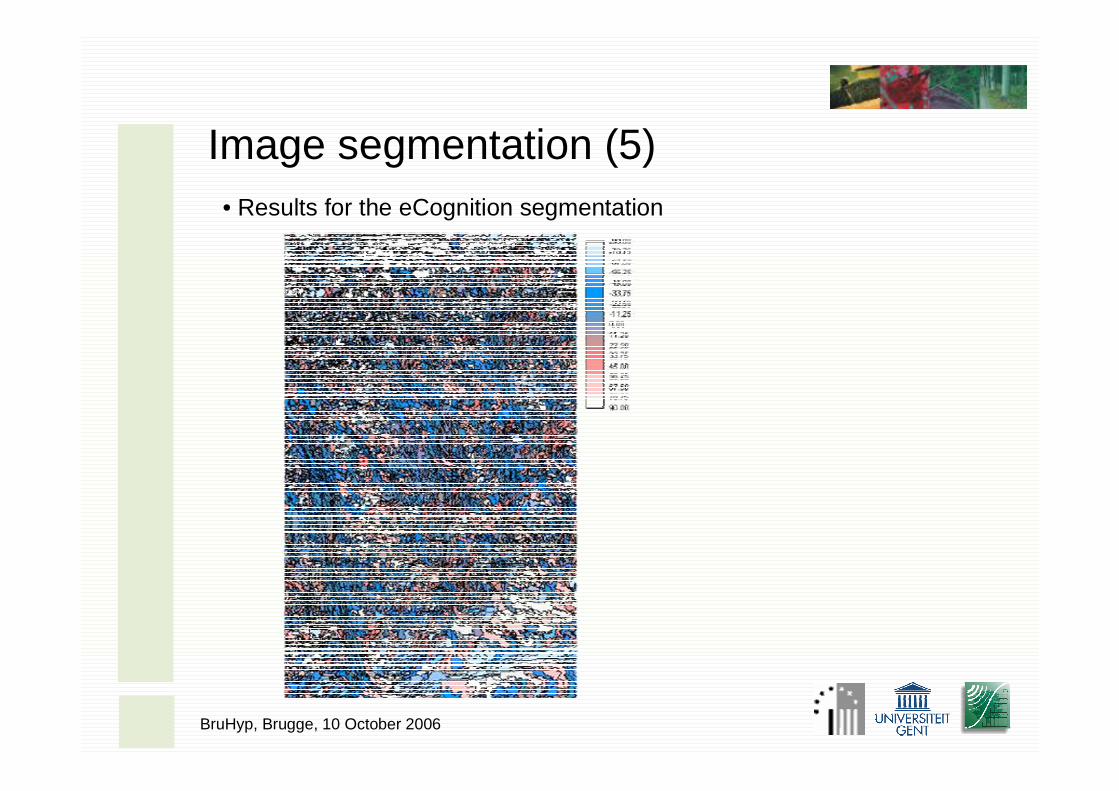
Image segmentation (5)• Results for the eCognition segmentation
BruHyp, Brugge, 10 October 2006
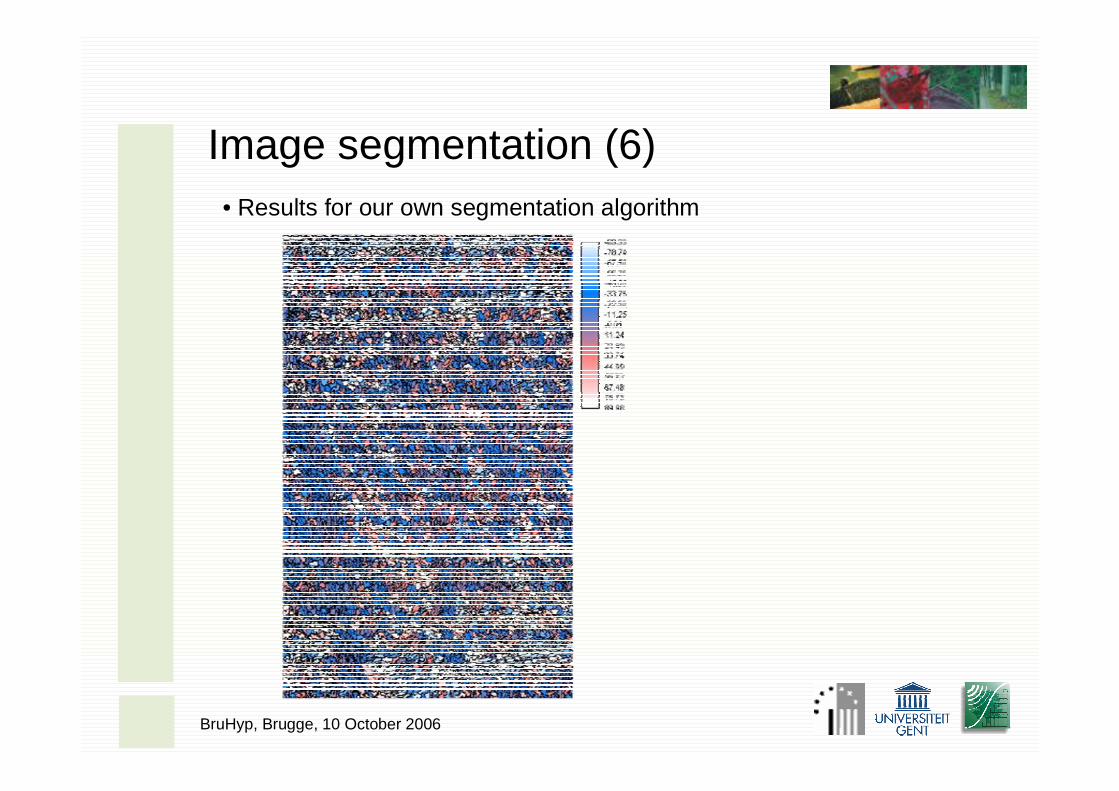
Image segmentation (6)• Results for our own segmentation algorithm
BruHyp, Brugge, 10 October 2006
Image segmentation (7)• What can we learn from all this:
– The calculation of segment orientation allows for the detection of gradients present in the study area
• Perpendicular to height lines• Perpendicular to humidity / salinity (water)• Needs (of course!) further attention
– eCognition is a good program– Still, ours is doing fine– And it can do much better, given its multitude of parameters that
allow for tuning– But that’s a drawback…– But ours is free!
– And it is easily integrated with any feature selection implementation!
BruHyp, Brugge, 10 October 2006
At last! Genetic algorithms (1)• GA are very good at exploring vast multidimensional spaces in an efficient way• Multidimensional?
– Feature space has as many dimensions as spectral bands– Overkill: we don’t need that many dimensions, they can confuse
our classifiers / segmentation approaches– Sometimes, the number of dimensions obstructs the proper
execution of the classifier (think of maximum likelihood with 20input bands)
– Curse of dimensionality: if feature space has enough dimensions,the classification of your training data will be easy, but poor generalization capabilities (unless…)
• So classical: reduce the number of dimensions (bands) before the analysis
– PCA– MNF– GA!
BruHyp, Brugge, 10 October 2006
Genetic algorithms (2)GAs are search and optimization algorithms
• based on natural selection and genetics• basic structure: fixed-length binary string = chromosome• each chromosome ← variables or genes ← values or alleles• set of individuals = population• chromosomes receives a fitness value ← coding of their genes• fitter individuals are enriched in number towards future generations → selection
• if only selection: diversity would not be guaranteed → mutation
Main loop• random parent population• selected group of fitter individuals is chosen → mating pool• reproduction operations: selection , crossover and mutation• yielding next generation• cycle repeated until stopping criterion is met
→ Survival of the fittest
BruHyp, Brugge, 10 October 2006
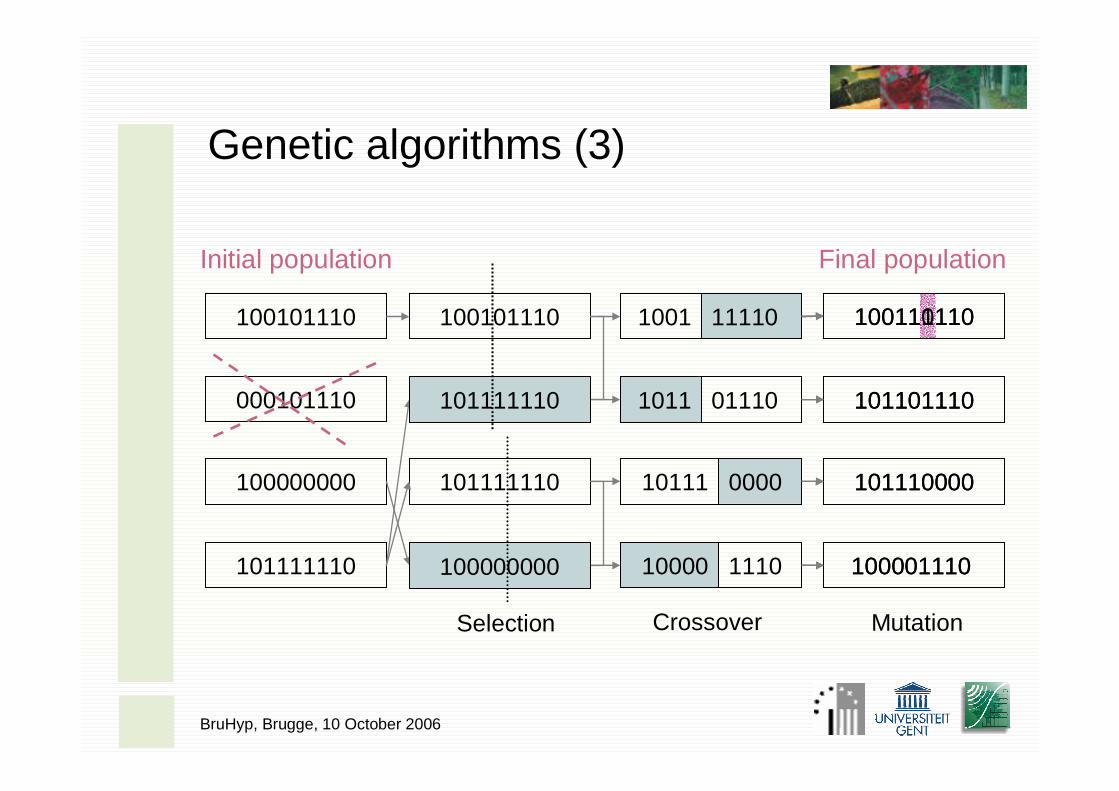
Genetic algorithms (3)
100101110
000101110
100000000
101111110
100101110
100000000
101111110
101111110
100001110
100111110
101101110
101110000
Selection Crossover Mutation
Final populationInitial population
1001 11110
1011 01110
10111 0000
10000 1110 100001110
100110110
101101110
101110000
101111110
100000000
BruHyp, Brugge, 10 October 2006
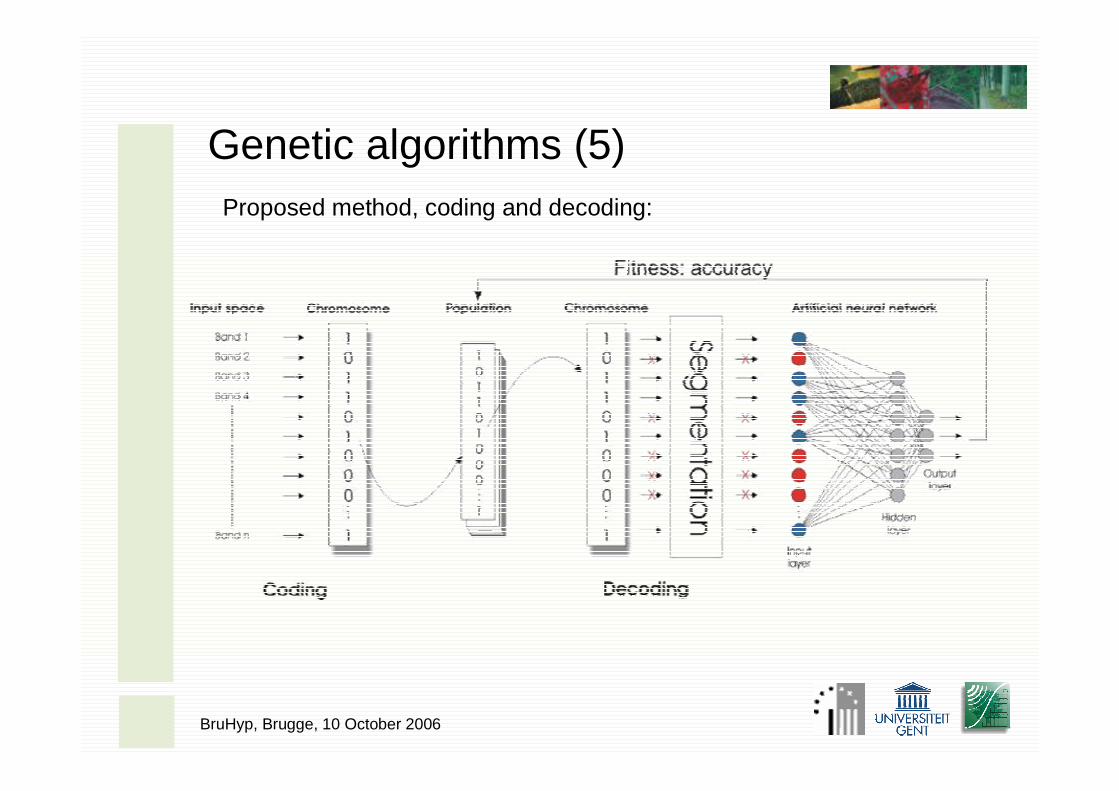
Genetic algorithms (4)• Integration with segmentation and classification• Use GAs to select combination of spectral bands that yields the highest overall accuracy (fitness!)• Previous successful combination of GAs with artificial neural networks for classification (ANN), so entire system becomes
GA + Segmentation + ANN
BruHyp, Brugge, 10 October 2006
Genetic algorithms (5)Proposed method, coding and decoding:
BruHyp, Brugge, 10 October 2006
Genetic algorithms (6)• Why don’t we have any results yet?
– GA coupled with segmentation and neural network classification takes forever: days to weeks
– (So does the implementation, but finished now)– Solution: parallel computation: multiple computers /
processors– Possible advantageous to work on small subset before
anything– Possible replacement of ANN with SAM– Other solution: decouple segmentation from classification,
do GA two times• Problem: what is fitness value in segmentation? • Could be twofold: number of segments vs. the variance
contained in the segments divided by the total variance in the image
• Poses new problem of multi-objective GA• Other fitness: based on reference segments: homogeneous
objects digitized by an operator
BruHyp, Brugge, 10 October 2006
And that’s it…