genomesandcomplexdiseasessssykim/teaching/f14/slides/gwas.pdf · tcgaggtattaac tctaggtattaac...
TRANSCRIPT

Genomes and Complex Diseases
02-‐223 Personalized Medicine:
Understanding Your Own Genome Fall 2014

Genome Polymorphisms

TCGAGGTATTAAC The ancestral chromosome
A Human Genealogy

TCGAGGTATTAAC TCTAGGTATTAAC TCGAGGCATTAAC TCTAGGTGTTAAC TCGAGGTATTAGC TCTAGGTATCAAC
* ** * *
From SNPS …
A disease mutaCon
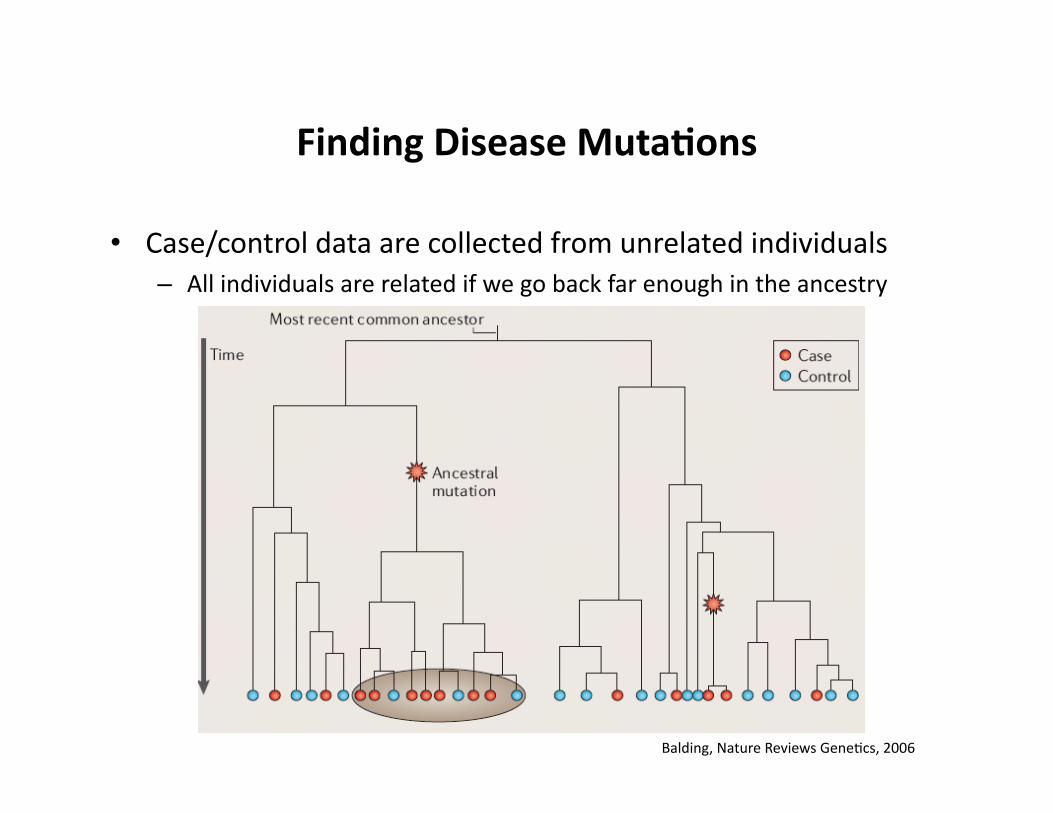
Finding Disease Muta9ons
• Case/control data are collected from unrelated individuals – All individuals are related if we go back far enough in the ancestry
Balding, Nature Reviews GeneCcs, 2006

Family-‐Based and Popula9on-‐Based Studies
• How can we idenCfy disease-‐related geneCc loci? • Linkage analysis
– Data are collected for family members
– Difficult to collect data on a large number of families
– EffecCve for rare diseases
• Genome-‐wide associaCon studies (GWAS) – Data are collected for unrelated individuals – Easier to find a large number of affected individuals
– EffecCve for common diseases, compared to family-‐based method
Family-‐Based and Popula9on-‐Based Studies
• How do the LD pa]erns in genomes differ between family and populaCon data?
• Large or small linked regions? • ResoluCon for pinpoinCng the disease locus?

Linkage Analysis vs. Associa9on Analysis
Strachan & Read, Human Molecular GeneCcs, 2001
(Num
ber of re
combinaCo
n sites)
(shared genome segments among different individuals in the study)
SNP Genotyping vs. Whole Genome Sequencing
• How would you idenCfy disease mutaCons using whole genome sequencing technology?
• How would you idenCfy disease mutaCons using SNP genotyping technology?
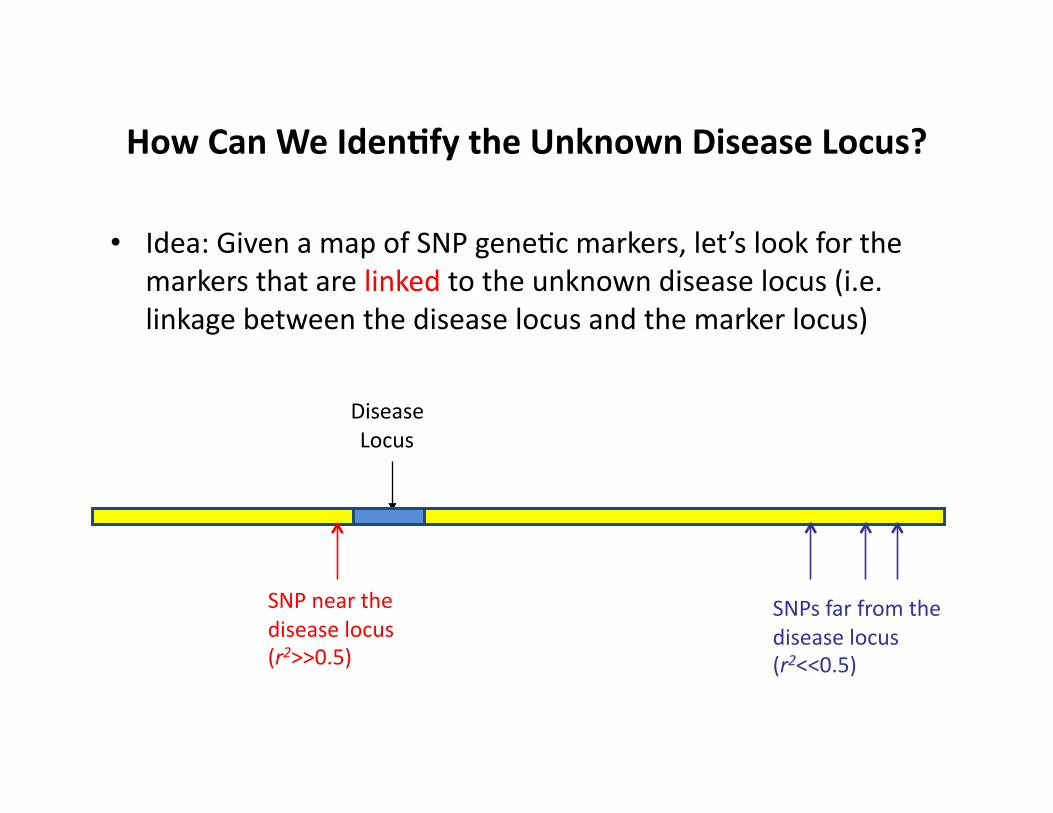
How Can We Iden9fy the Unknown Disease Locus?
• Idea: Given a map of SNP geneCc markers, let’s look for the markers that are linked to the unknown disease locus (i.e. linkage between the disease locus and the marker locus)
Disease Locus
SNP near the disease locus (r2>>0.5)
SNPs far from the disease locus (r2<<0.5)
Genome-‐Wide Associa9on Study (GWAS)
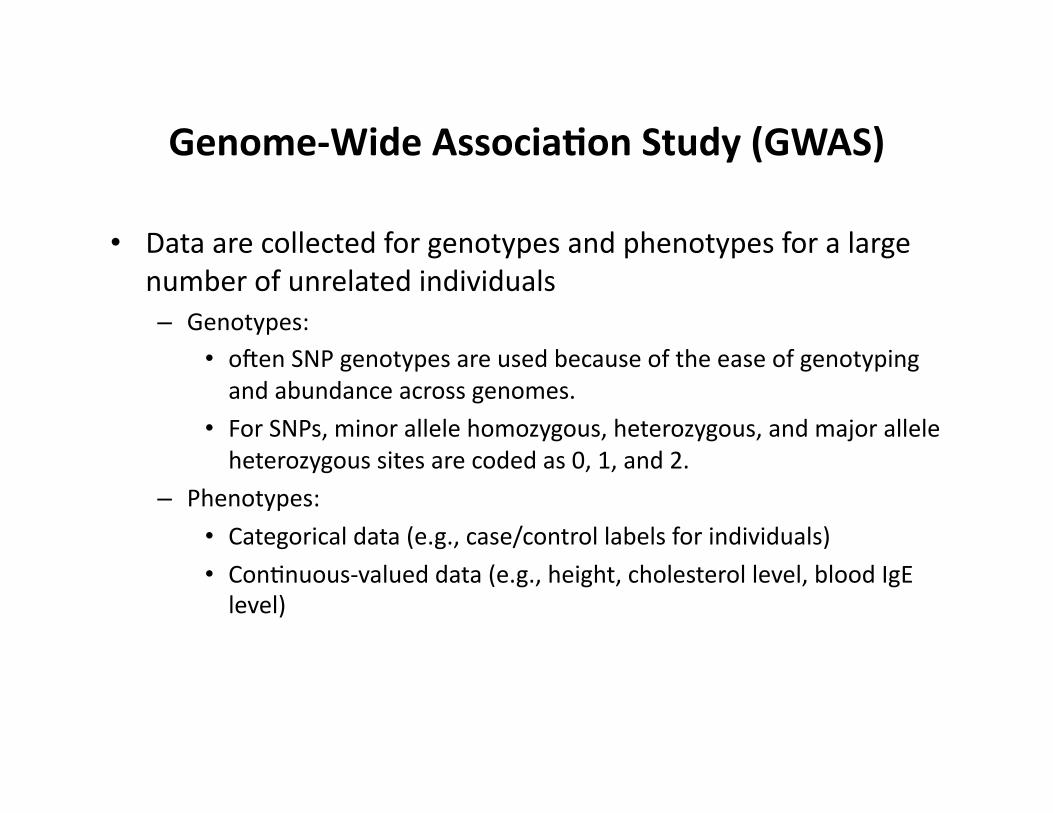
• Data are collected for genotypes and phenotypes for a large number of unrelated individuals – Genotypes:
• ofen SNP genotypes are used because of the ease of genotyping and abundance across genomes.
• For SNPs, minor allele homozygous, heterozygous, and major allele heterozygous sites are coded as 0, 1, and 2.
– Phenotypes: • Categorical data (e.g., case/control labels for individuals) • ConCnuous-‐valued data (e.g., height, cholesterol level, blood IgE level)

Overview
• Case control studies – Discrete phenotype – Are you a healthy normal or a paCent?
• QuanCtaCve trait studies – ConCnuous-‐valued phenotypes – Height, eye color, blood pressure, cholesterol level, body-‐mass index
etc.
Genome-‐Wide Associa9on Study (GWAS)
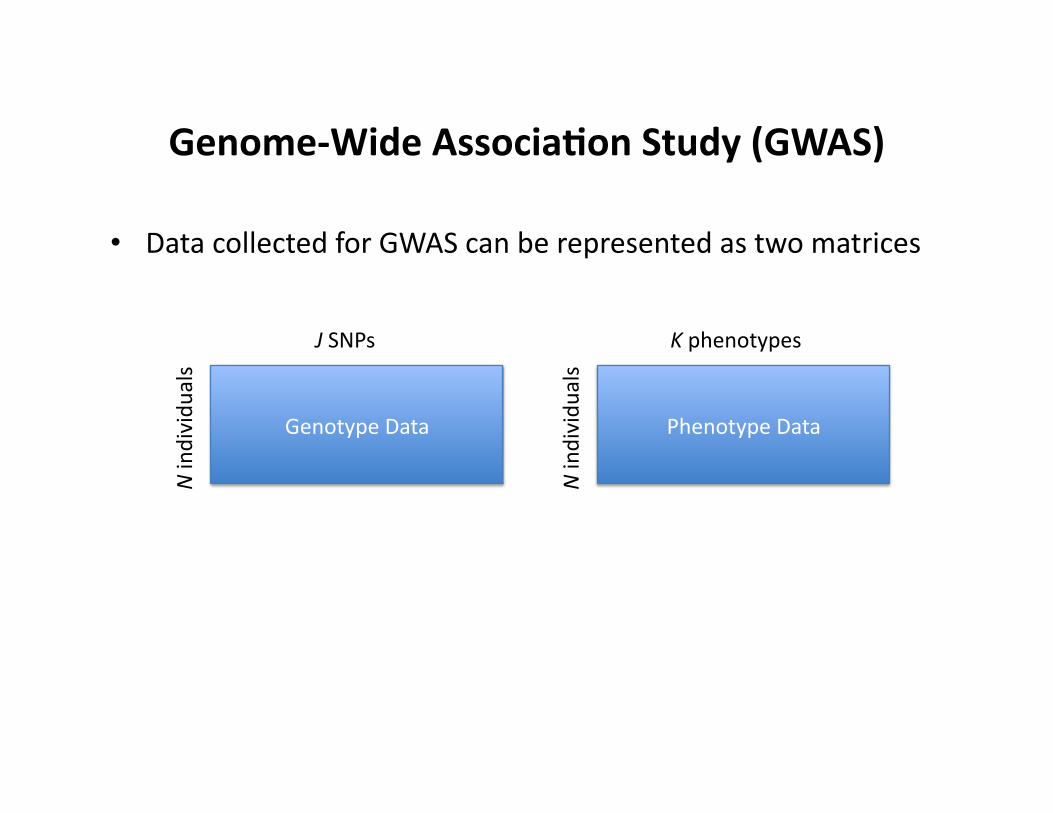
• Data collected for GWAS can be represented as two matrices
Genotype Data Phenotype Data
N individu
als
N individu
als
J SNPs K phenotypes
Genome-‐Wide Associa9on Study (GWAS)
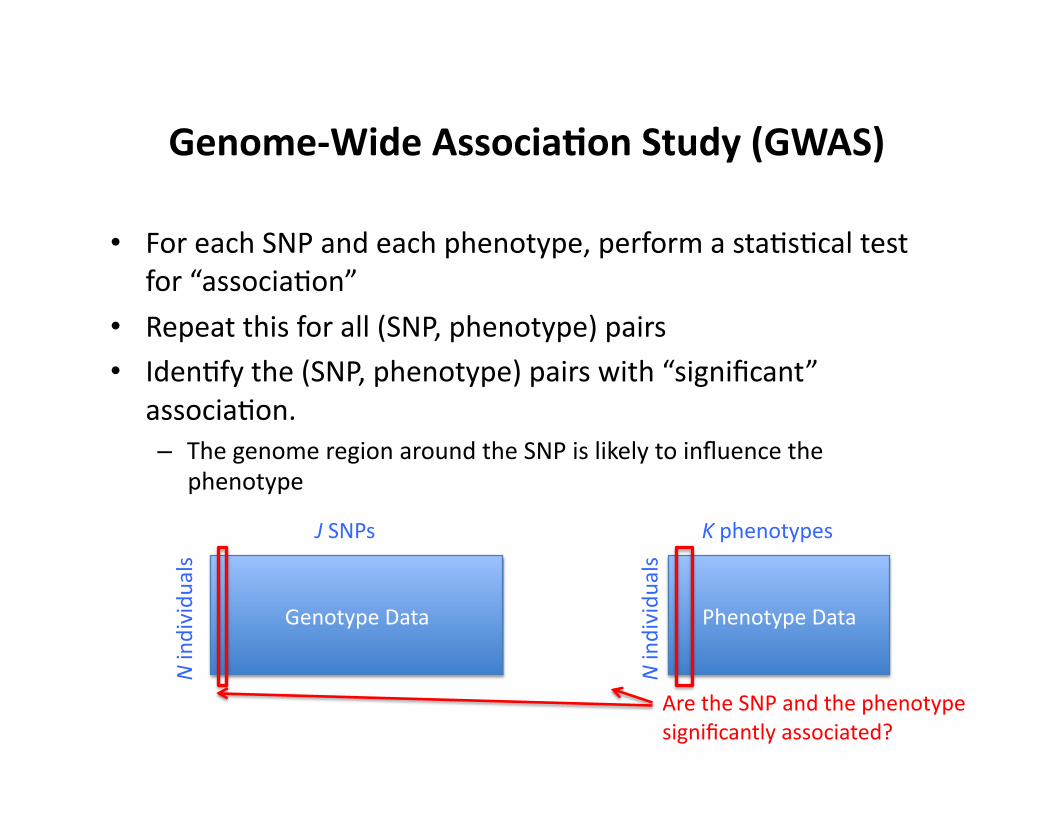
• For each SNP and each phenotype, perform a staCsCcal test for “associaCon”
• Repeat this for all (SNP, phenotype) pairs • IdenCfy the (SNP, phenotype) pairs with “significant”
associaCon. – The genome region around the SNP is likely to influence the
phenotype
Genotype Data Phenotype Data
N individu
als
N individu
als
J SNPs K phenotypes
Are the SNP and the phenotype significantly associated?
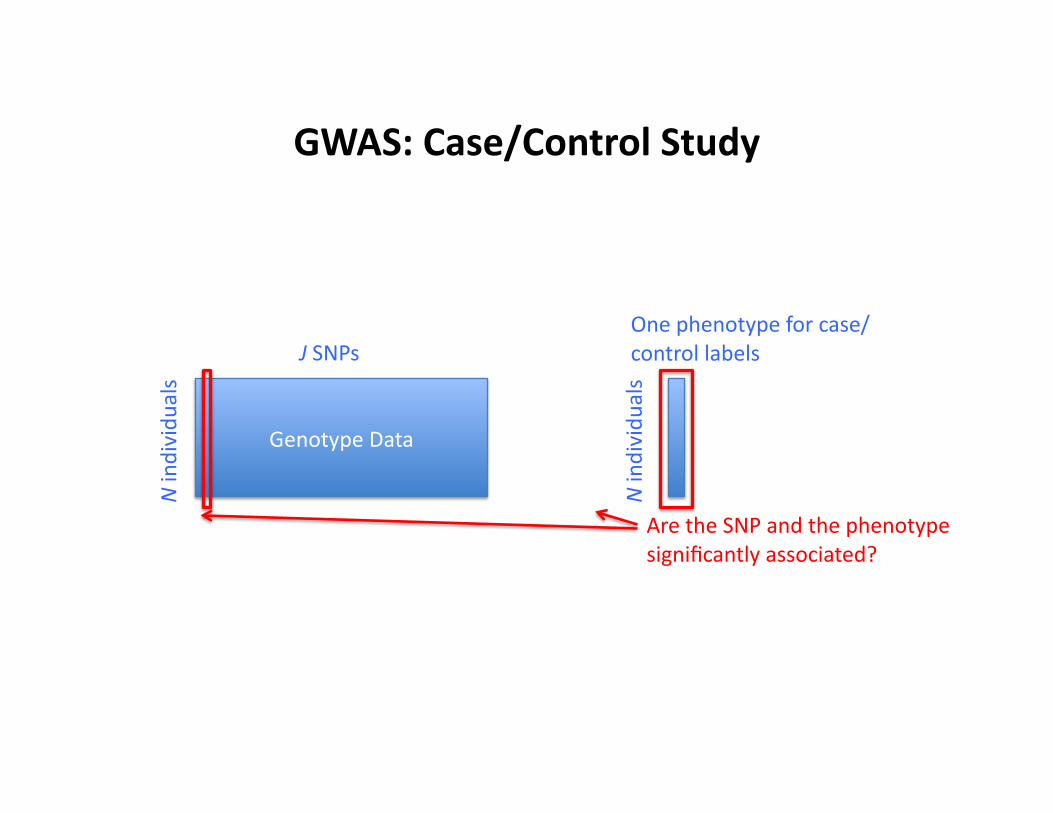
GWAS: Case/Control Study
Genotype Data
N individu
als
N individu
als
J SNPs One phenotype for case/control labels
Are the SNP and the phenotype significantly associated?

GWAS: Case/Control Study
• For each marker locus, find the 3x2 conCngency table containing the counts of three genotypes
• test with 2 df (degree of freedom) under the null hypothesis of no associaCon
Genotype Case Control Total AA Ncase,AA Ncontrol,AA NAA
Aa Ncase,Aa Ncontrol,Aa NAa
aa Ncase,aa Ncontrol,aa Naa
Total Ncase Ncontrol N
Genotype score = the number of minor alleles
€
2χ
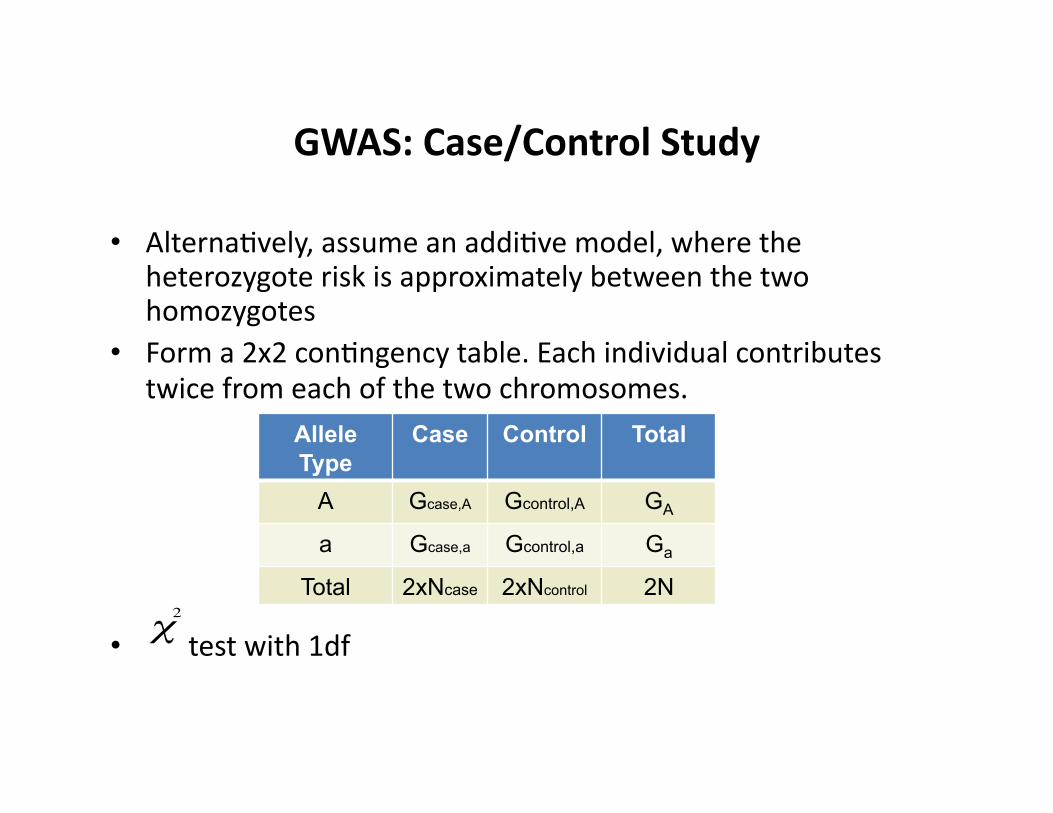
GWAS: Case/Control Study
• AlternaCvely, assume an addiCve model, where the heterozygote risk is approximately between the two homozygotes
• Form a 2x2 conCngency table. Each individual contributes twice from each of the two chromosomes.
• test with 1df
Allele Type
Case Control Total
A Gcase,A Gcontrol,A GA
a Gcase,a Gcontrol,a Ga
Total 2xNcase 2xNcontrol 2N
€
2χ

Test (Chi-‐square Test)
• StaCsCcal test of associaCon
• In case/control associaCon study, the null hypothesis is H0: There is no associaCon between the given marker and disease labels.
• P-‐value = probability of the observed data under the null hypothesis
• Low p-‐value (p-‐value < α, where α is a user-‐specified value) means the observed data are unlikely under the null hypothesis. Thus, we reject the null hypothesis (H0) and declare there is a significant associaCon between the SNP and disease states. – Ofen α=0.01 or 0.05 is used.
€
2χ

Chi-‐Square Test: Null Hypothesis from Con9ngency Table
• We have two random variables: – Y: disease status (Case/Control) – X: allele type (A/a)
• Null hypothesis: the two variables are independent of each other (i.e., the two variables are unrelated)
Allele Type
Case Control Total
A Gcase,A Gcontrol,A GA
a Gcase,a Gcontrol,a Ga
Total 2xNcase 2xNcontrol 2N
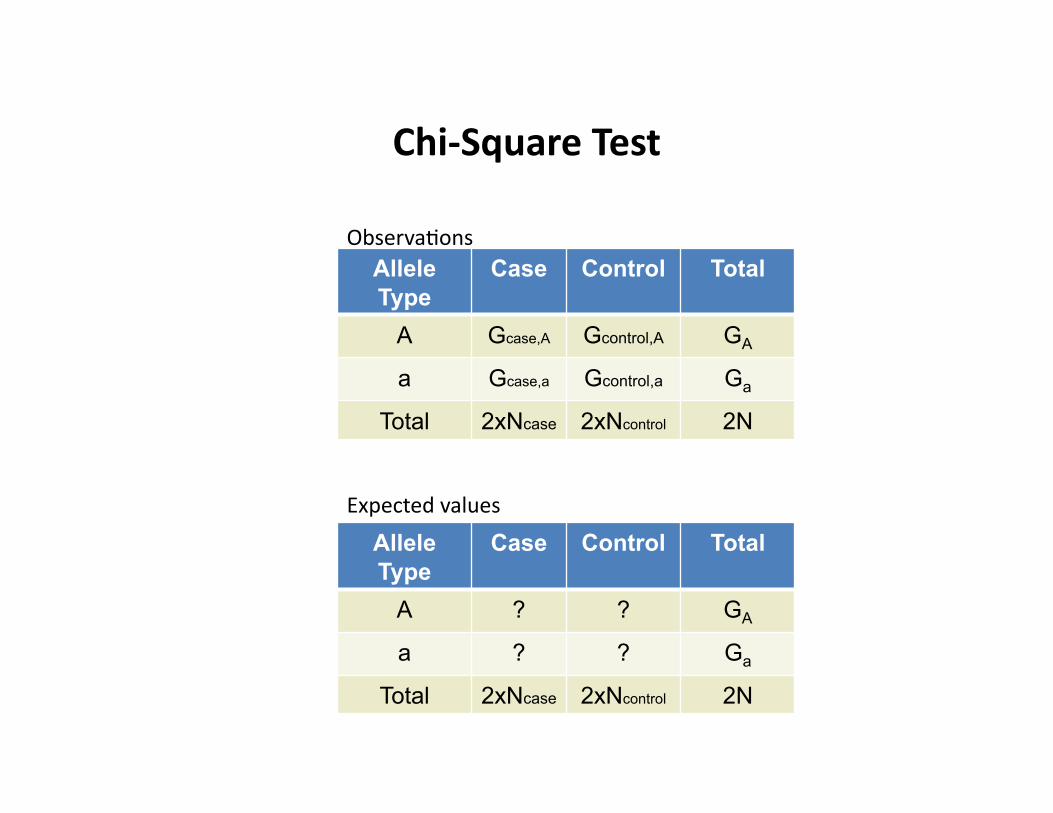
Chi-‐Square Test
Allele Type
Case Control Total
A Gcase,A Gcontrol,A GA
a Gcase,a Gcontrol,a Ga
Total 2xNcase 2xNcontrol 2N
Allele Type
Case Control Total
A ? ? GA
a ? ? Ga
Total 2xNcase 2xNcontrol 2N
ObservaCons
Expected values
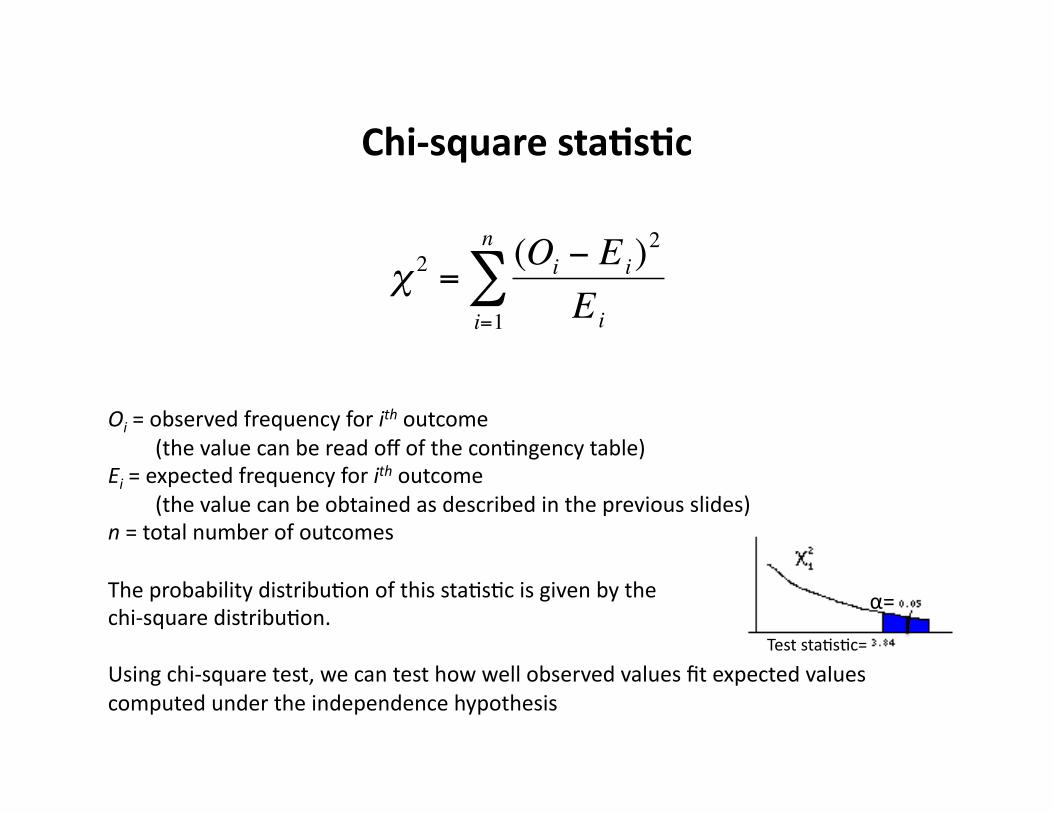
Chi-‐square sta9s9c
€
χ 2 =(Oi − Ei)
2
Eii=1
n
∑
Oi = observed frequency for ith outcome (the value can be read off of the conCngency table) Ei = expected frequency for ith outcome (the value can be obtained as described in the previous slides) n = total number of outcomes
The probability distribuCon of this staCsCc is given by the chi-‐square distribuCon.
Using chi-‐square test, we can test how well observed values fit expected values computed under the independence hypothesis
α=
Test staCsCc=
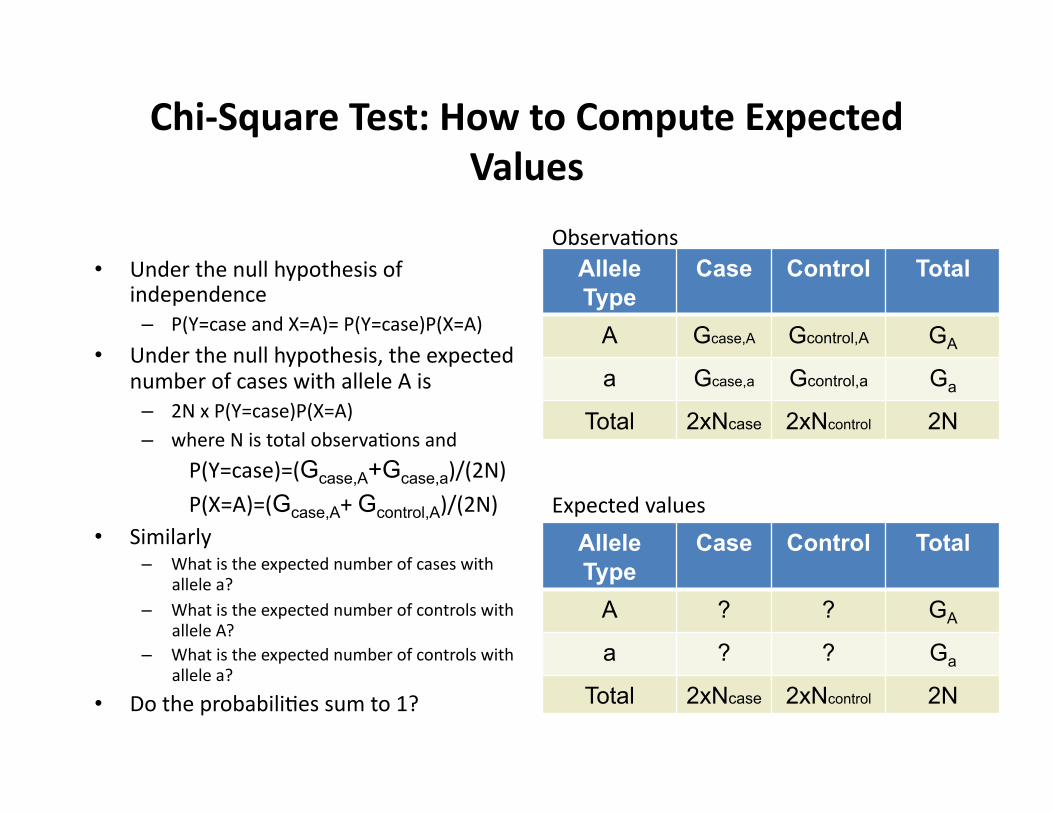
Chi-‐Square Test: How to Compute Expected Values
• Under the null hypothesis of independence
– P(Y=case and X=A)= P(Y=case)P(X=A)
• Under the null hypothesis, the expected number of cases with allele A is
– 2N x P(Y=case)P(X=A) – where N is total observaCons and
P(Y=case)=(Gcase,A+Gcase,a)/(2N)
P(X=A)=(Gcase,A+ Gcontrol,A)/(2N) • Similarly
– What is the expected number of cases with allele a?
– What is the expected number of controls with allele A?
– What is the expected number of controls with allele a?
• Do the probabiliCes sum to 1?
Allele Type
Case Control Total
A Gcase,A Gcontrol,A GA
a Gcase,a Gcontrol,a Ga
Total 2xNcase 2xNcontrol 2N
Allele Type
Case Control Total
A ? ? GA
a ? ? Ga
Total 2xNcase 2xNcontrol 2N
ObservaCons
Expected values
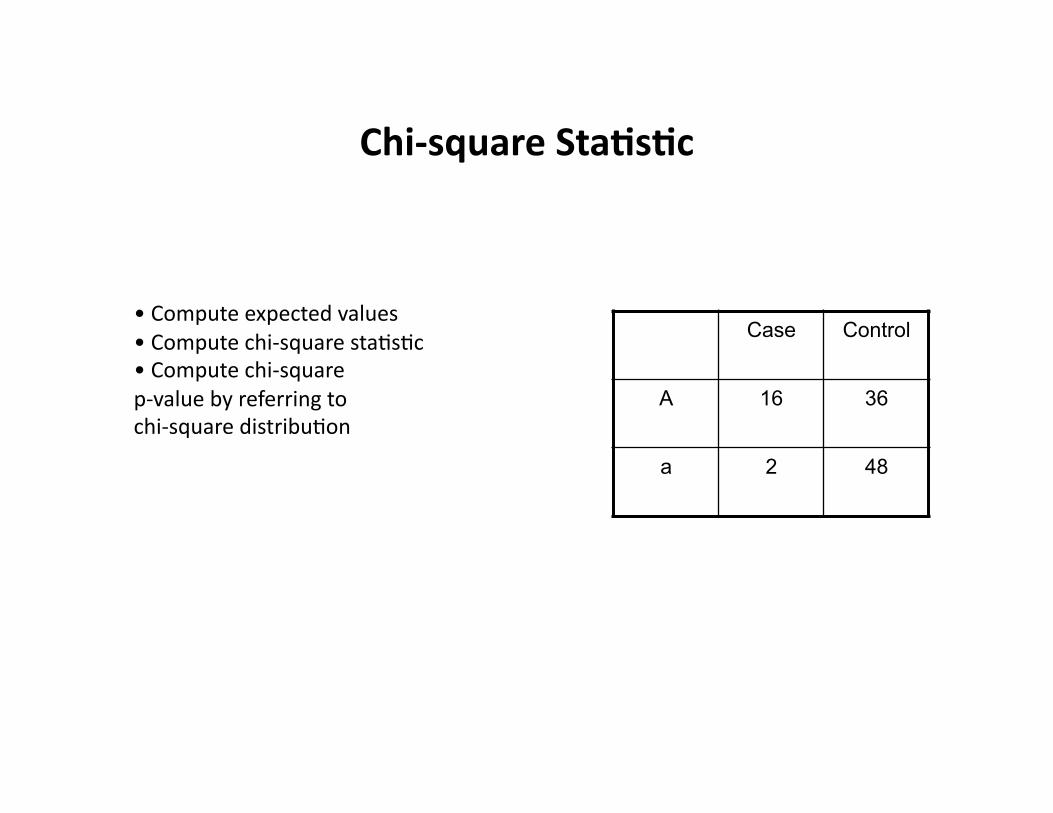
Chi-‐square Sta9s9c
Case Control
A 16 36
a 2 48
• Compute expected values • Compute chi-‐square staCsCc • Compute chi-‐square p-‐value by referring to chi-‐square distribuCon

ManhaUan Plot of p-‐values from Breast Cancer GWAS
• Analysis of 582,886 SNPs for 3,659 cases with family history and 4,897 controls
Nature GeneCcs 42, 504-‐507 (2010)
High associaCon
Ofen –log10 (p-‐value) is plo]ed instead of p-‐value.

Correc9ng for Mul9ple Tes9ng
• What happens when we scan the genome of 1 million markers for associaCon with α = 0.05? – 50,000 (=1 millionx0.05) SNPs are expected to be found significant just
by chance
– We need to be more conservaCve when we decide a given marker is significantly associated with the trait.
• CorrecCon methods – Bonferroni correcCon
Overview
• Case control studies – Discrete phenotype – Are you a healthy normal or a paCent?
• QuanCtaCve trait studies – ConCnuous-‐valued phenotypes – Height, eye color, blood pressure, cholesterol level, body-‐mass index
etc.

Con9nuous-‐Valued Phenotypes
• Clinical data in medicine – Cholesterol level, body-‐mass index, and weight
in obesity, diabetes studies
– Blood IgE anCbody level, lung physiology measurements in asthma studies
• Gene-‐expression data in biology research – Microarray data for gene-‐expression
measurements for tens of thousands of genes
– Can we idenCfy SNPs that influence the gene expression levels?
– Ofen known as expression quanCtaCve trait locus (eQTL) mapping
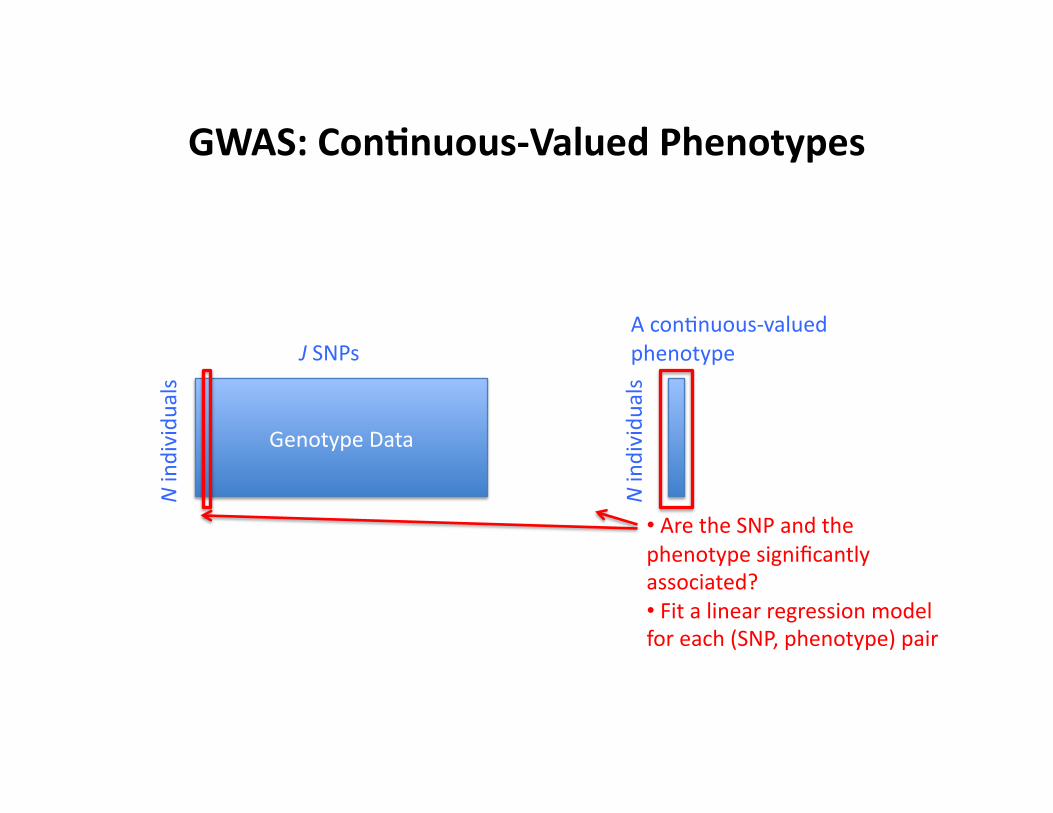
GWAS: Con9nuous-‐Valued Phenotypes
Genotype Data
N individu
als
N individu
als
J SNPs A conCnuous-‐valued phenotype
• Are the SNP and the phenotype significantly associated? • Fit a linear regression model for each (SNP, phenotype) pair
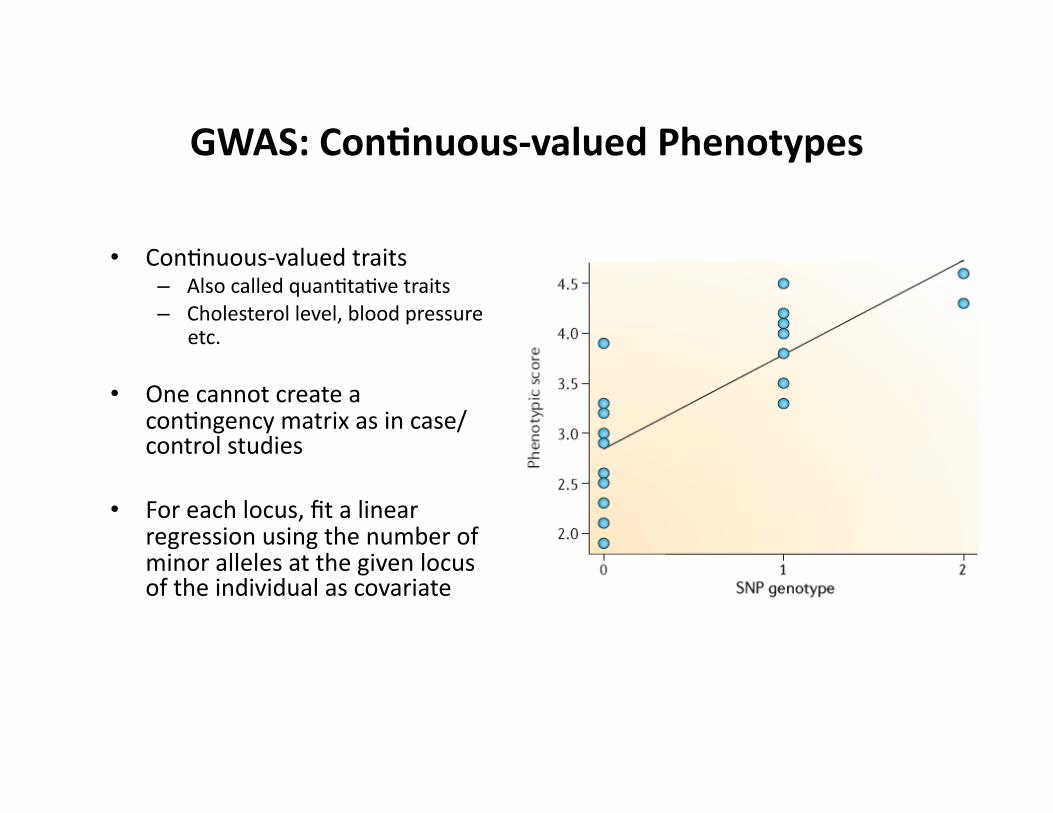
GWAS: Con9nuous-‐valued Phenotypes
• ConCnuous-‐valued traits – Also called quanCtaCve traits – Cholesterol level, blood pressure
etc.
• One cannot create a conCngency matrix as in case/control studies
• For each locus, fit a linear regression using the number of minor alleles at the given locus of the individual as covariate

Linear Regression Model
• Linear regression model is defined as
– Data • y: a conCnuous-‐valued phenotype • x: SNP genotype at a given locus €
y = xβ1 + β0 +ε

Linear Regression Model
• Linear regression model is defined as
– Parameters • β1: regression coefficient or the parameter that represents the strength of associaCon between the SNP x and the phenotype y
• β0: intercept term • ε: noise or the part of y that is not explained by the SNP x (e.g., environmental effect)
€
y = xβ1 + β0 +ε

Linear Regression Model for GWAS
x
y
β1 : slope (associaCon strength)
β0: intercept
ε:noise, the part of y that is not explained by xβ1+β0

Linear Regression Model
• Linear regression model is defined as
– y and x: observed in the dataset – β1 and β0: parameters to be esCmated from the data
€
y = xβ1 + β0 +ε
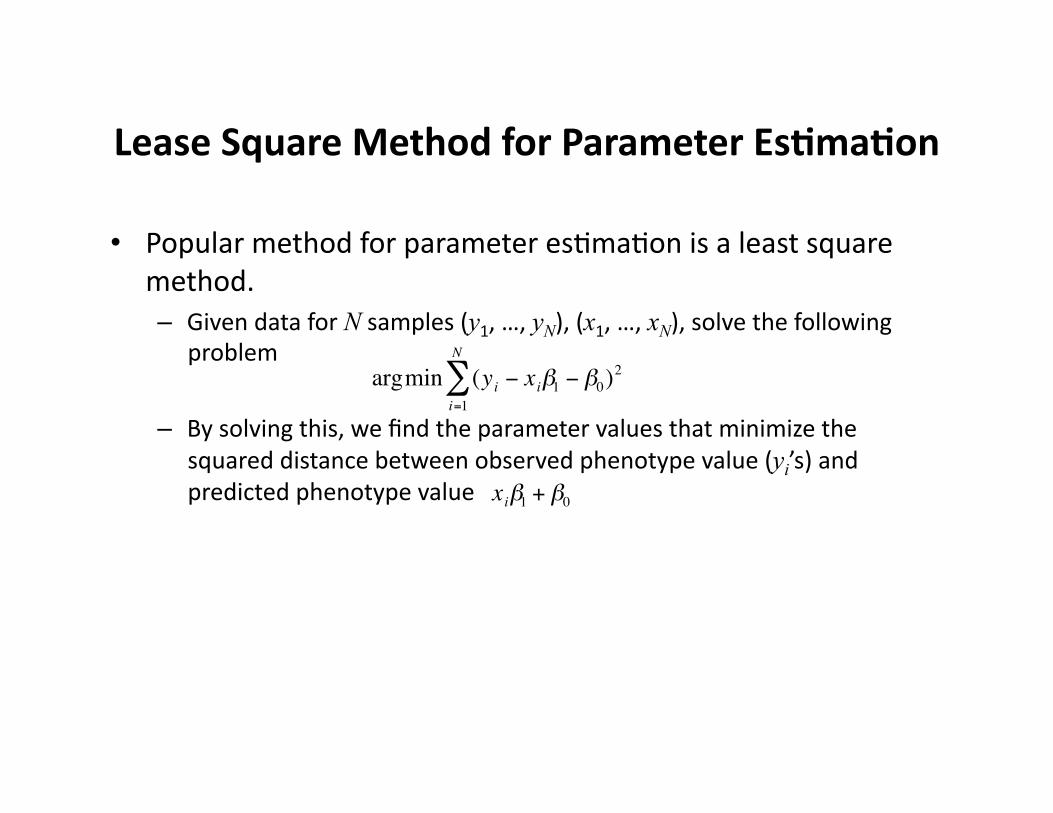
Lease Square Method for Parameter Es9ma9on
• Popular method for parameter esCmaCon is a least square method. – Given data for N samples (y1, …, yN), (x1, …, xN), solve the following
problem
– By solving this, we find the parameter values that minimize the squared distance between observed phenotype value (yi’s) and predicted phenotype value €
argmin (yi − xiβ1 − β0)2
i=1
N
∑
€
xiβ1 + β0
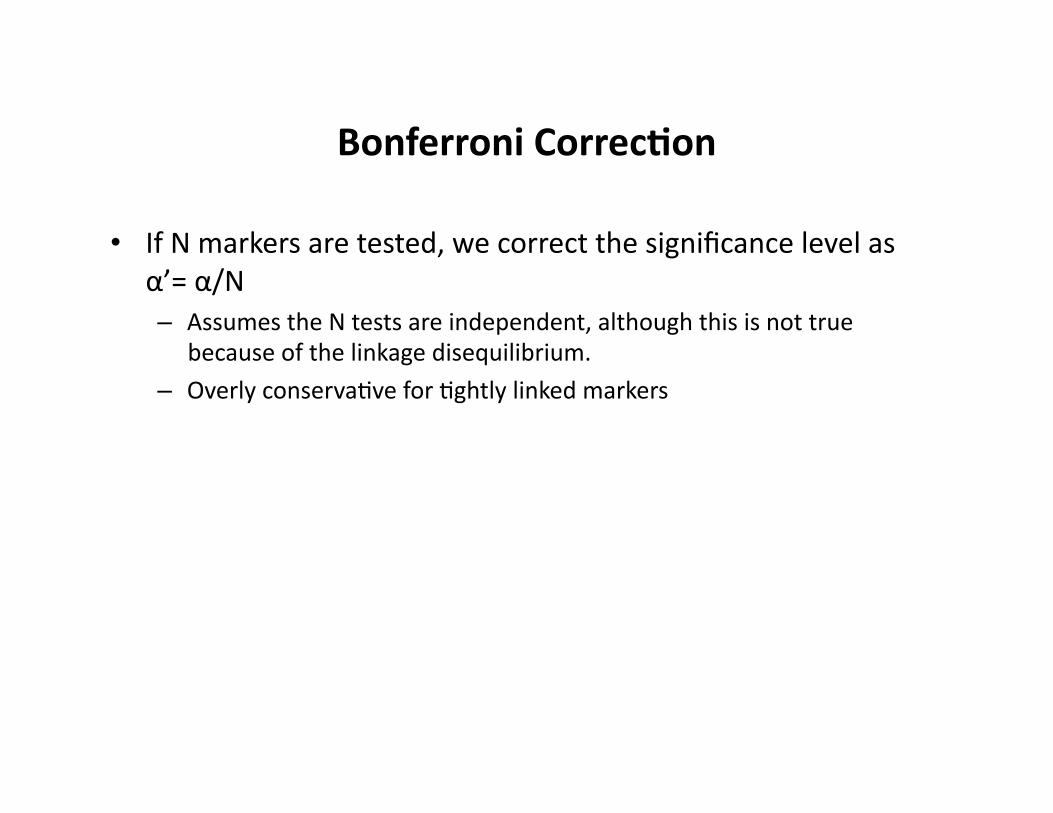
Bonferroni Correc9on
• If N markers are tested, we correct the significance level as α’= α/N – Assumes the N tests are independent, although this is not true
because of the linkage disequilibrium.
– Overly conservaCve for Cghtly linked markers

Popula9on Structure and Genome-‐wide Associa9on Analysis
• The mutaCon that gives the lactose persistence phenotype is more common in Caucasian populaCon than in Asian populaCon
• The allele for blonde hair color is also more common in Caucasian populaCon than in Asian populaCon
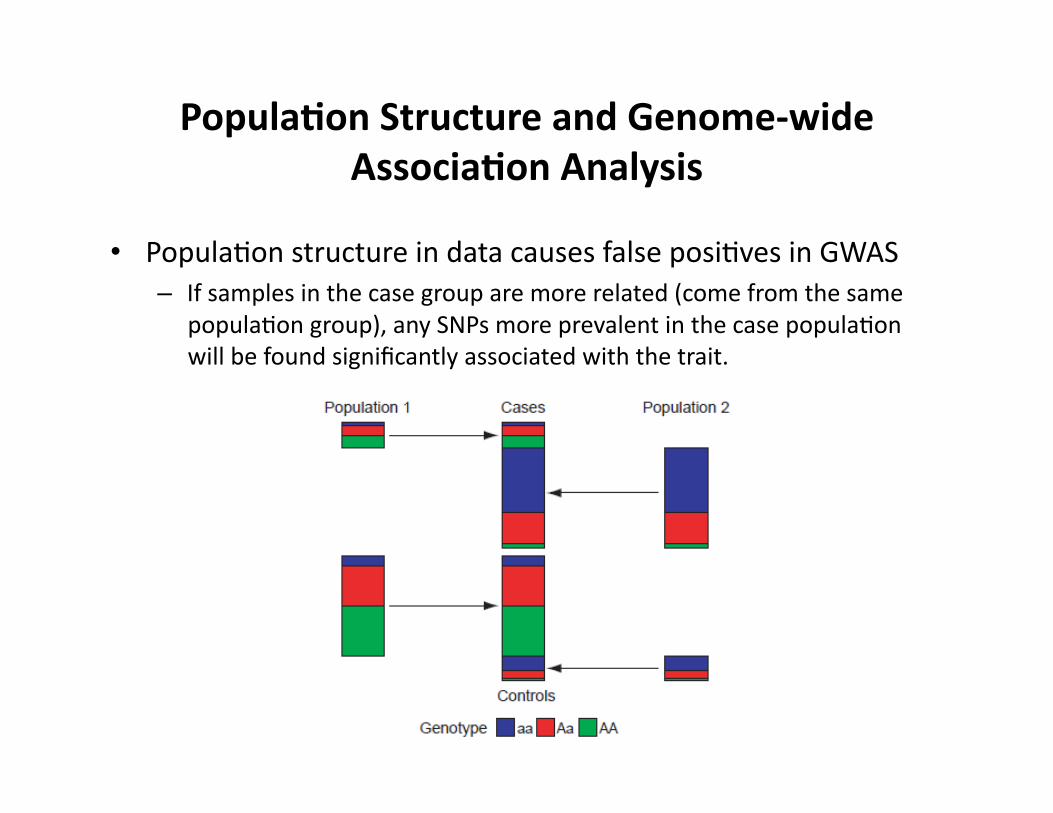
Popula9on Structure and Genome-‐wide Associa9on Analysis
• PopulaCon structure in data causes false posiCves in GWAS – If samples in the case group are more related (come from the same
populaCon group), any SNPs more prevalent in the case populaCon will be found significantly associated with the trait.
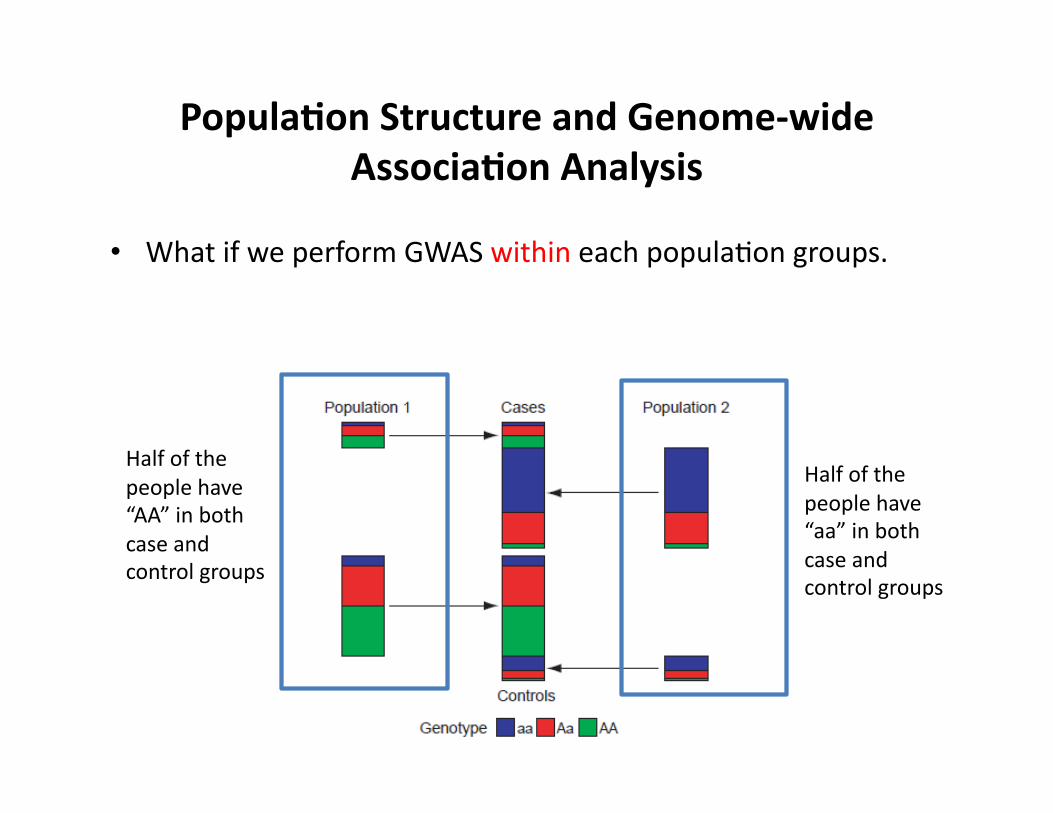
Popula9on Structure and Genome-‐wide Associa9on Analysis
• What if we perform GWAS within each populaCon groups.
Half of the people have “aa” in both case and control groups
Half of the people have “AA” in both case and control groups

Epistasis
• Epistasis: The effect of one locus depends on the genotype of another locus – EpistaCc effects of geneCc loci can be detected only if we consider the
mulCple loci joingly
• In contrast, marginal effects of a locus refers to the geneCc effect of the locus that is independent of other loci – Most studies assume the phenotype can be predicted as a sum of single-‐
locus effects
• Many studies ignore epistasis among mulCple geneCc loci mainly due to the high computaConal cost for detecCng it, but epistasis is believed to be prevalent and thus important.

Epistasis for Mendelian Traits
Carlborg & Haley, Nature Reviews GeneCcs 2004

Subnetworks for lung physiology Subnetwork for
quality of life
GeneCc AssociaCon for Asthma Clinical Traits
TCGACGTTTTACTGTACAATT

Tag SNPs and GWAS: Using Reference Datasets for Genotype Imputa9on
• Reference data: dense SNP data from HapMap III, or 1000 genome project
• New data: SNP data for individuals in a given study
• Data afer imputaCon

Genotype Imputa9on
PHASE can be used for imputaCon!

Tag SNPs and GWAS (Servin & Stephens, 2007)
Tag SNP Non-‐tag SNP
Summary
• How to idenCfy disease-‐related or phenotype-‐related genomic loci – Family-‐based studies – PopulaCon-‐based studies for unrelated individuals
• Genome-‐wide associaCon study – Case/control studies for discrete-‐valued phenotypes
• Chi-‐square test based on conCngency table created from genotype/phenotype data
– ConCnuous-‐valued phenotypes (next lecture) – Bonferroni correcCons for correcCng for mulCple hypothesis tesCng