genome&wide*analysis*of*the*torc1*and*osmotic*stress ...(cytomat)...
TRANSCRIPT

1
Genome-‐wide analysis of the TORC1 and osmotic stress signaling network in S. cerevisiae
Jeremy Worley*†, Arron Sullivan*†, Xiangxia Luo†, Matthew E Kaplan‡, and Andrew P. Capaldi†‡§ † Department of Molecular and Cellular Biology and ‡ the Functional Genomics
Core facility, University of Arizona, Tucson, AZ, 85721-‐0206
* Co-‐first authors
§ Corresponding author: [email protected]
G3: Genes|Genomes|Genetics Early Online, published on December 17, 2015 as doi:10.1534/g3.115.025882
© The Author(s) 2013. Published by the Genetics Society of America.

2
Running title: TORC1 and osmotic stress signaling Key words: TORC1, Osmotic Stress, Yeast knock out collection, High-‐throughput screen Corresponding Author: Andrew Capaldi, Department of Molecular and Cellular Biology. Life Sciences South, Rm 452, 1007 E Lowell St, University of Arizona, Tucson AZ 85721. Email: [email protected], Phone: 520 626 9376

3
ABSTRACT The Target of Rapamycin kinase Complex I (TORC1) is a master regulator of cell growth and metabolism in eukaryotes. Studies in yeast and human cells have shown that nitrogen/amino acid starvation signals act through Npr2/3 and the small GTPases Gtr1/2 (Rags in humans) to inhibit TORC1. However, it is unclear how other stress and starvation stimuli inhibit TORC1, and/or act in parallel with the TORC1 pathway, to control cell growth. To help answer these questions, we developed a novel automated pipeline and used it to measure the expression of a TORC1 dependent ribosome biogenesis gene (NSR1) during osmotic stress in 4700 Saccharomyces cerevisiae strains from the yeast knock-‐out collection. This led to the identification of 440 strains with significant and reproducible defects in NSR1 repression. The cell growth control and stress response proteins deleted in these strains form a highly connected network, including; 56 proteins involved in vesicle trafficking and vacuolar function; 53 proteins that act downstream of TORC1 according to a rapamycin assay-‐-‐including components of the HDAC Rpd3L, Elongator, and the INO80, CAF-‐1 and SWI/SNF chromatin remodeling complexes; over 100 proteins involved in signaling and metabolism; and 17 proteins that directly interact with TORC1. These data provide an important resource for labs studying cell growth control and stress signaling, and demonstrate the utility of our new, and easily adaptable, method for mapping gene regulatory networks.

4
INTRODUCTION The Target of Rapamycin (TOR) kinases are conserved across eukaryotes, where they act as master regulators of cell growth and metabolism (LOEWITH AND HALL 2011; LAPLANTE AND SABATINI 2012). In line with their central role in cell signaling, TOR kinases respond to an enormous array of stimuli and control the activity of hundreds of proteins-‐-‐functions that are supported in part by their recruitment into two distinct complexes, TOR Complex 1 (TORC1) and TOR Complex 2 (TORC2) (BARBET et al. 1996; KIM et al. 2002; LOEWITH et al. 2002; URBAN et al. 2007; HUBER et al. 2009; SOULARD et al. 2010; HSU et al. 2011). TORC1, unlike TORC2, is rapamycin sensitive and in S. cerevisiae is made up of the TOR kinase Tor1 (and in its absence the homolog Tor2), the key regulator Kog1, and two poorly characterized proteins, Lst8 and Tco89 (HEITMAN et al. 1991; LOEWITH et al. 2002; REINKE et al. 2004). In the presence of adequate nutrients, TORC1 drives growth by activating multiple steps in protein and ribosome synthesis. First, TORC1 directly phosphorylates and activates the transcription factor Sfp1 and the AGC kinase Sch9 (URBAN et al. 2007; LEMPIAINEN et al. 2009). Sch9, in turn, then phosphorylates and blocks the activity of the transcriptional repressors Dot6, Tod6 and Stb3, leaving Sfp1 to promote the high level expression of 400 genes involved in ribosome biogenesis (Ribi) and translation (JORGENSEN et al. 2004; MARION et al. 2004; LIKO et al. 2007; LIPPMAN AND BROACH 2009; HUBER et al. 2011). Second, TORC1 acts in cooperation with Yak1 and the cAMP dependent protein kinase (PKA) pathway, to promote the activity of Fhl1 and upregulate expression of the ribosome protein (RP) genes (MARTIN et al. 2004; SCHAWALDER et al. 2004; WADE et al. 2004). Third, TORC1-‐Sch9 phosphorylates and regulates the kinase Maf1, and other factors, to activate Pol I and Pol III and thus rRNA and tRNA synthesis (UPADHYA et al. 2002; HUBER et al. 2009; LEE et al. 2009). Finally, TORC1 promotes translation, in part by blocking phosphorylation of eIF2 (BARBET et al. 1996; LOEWITH AND HALL 2011). In contrast, when cells are starved for energy, amino acids, or nitrogen, or exposed to noxious stress, TORC1 signaling is inhibited, leading to down-‐regulation of Ribi and RP gene expression, rRNA and tRNA synthesis, and consequently cell growth (POWERS AND WALTER 1999; GASCH et al. 2000; URBAN et al. 2007; BRAUER et al. 2008). In particular, dephosphosphorylation of Dot6, Tod6 and Stb3 triggers recruitment of the Class I histone deacetylase Rpd3L to the Ribi and RP genes, leading to a rapid decrease in gene expression levels (ALEJANDRO-‐OSORIO et al. 2009; LIPPMAN AND BROACH 2009; HUBER et al. 2011). The mechanisms underlying TORC1 inhibition in nitrogen and amino acid starvation conditions are starting to come into focus. Specifically, it is now clear that nitrogen and amino acid starvation trigger activation of the GAP Npr2-‐Npr3-‐Iml1 SEAC subcomplex, SEACIT, and this in turn alters the GTP binding state of the small GTPases, Gtr1/2 (KIM et al. 2008; SANCAK et al. 2008; BINDA et al. 2009; NEKLESA AND DAVIS 2009; PANCHAUD et al. 2013). Gtr1/2 then bind TORC1 on the vacuolar membrane and inhibit TORC1 dependent phosphorylation of Sfp1 and Sch9 (URBAN et al. 2007; BINDA et al. 2009; LEMPIAINEN et al. 2009; PANCHAUD et al.

5
2013). At the same time an interaction between Gtr1/2, the small GTPase Rho1, and TORC1 promotes release of Tap42 from the TOR complex, triggering Tap42-‐PP2A dependent reprogramming of nitrogen and amino acid metabolism (CARDENAS et al. 1999; DUVEL et al. 2003; YAN et al. 2006; YAN et al. 2012). At least in humans, Gtr1/2 signaling also depends on interactions with the vacuolar ATPase (V-‐ATPase) and amino acid transporters on the vacuolar membrane (ZONCU et al. 2011; WANG et al. 2015). Outside of nitrogen and amino acid starvation conditions, however, very little is known about TORC1, and TORC1 pathway, regulation. Npr2/3, Gtr1/2, and Rho1 play little-‐to-‐no role in transmitting glucose starvation, osmotic stress, heat stress and oxidative stress signals to TORC1-‐Sch9 (BINDA et al. 2009; HUGHES HALLETT et al. 2014). Instead, the AMP activated protein kinase Snf1 partially inhibits TORC1 and/or TORC1-‐Sch9 signaling during glucose/energy starvation, while the MAPK Hog1 plays a small role in regulating TORC1 and/or TORC1-‐Sch9 signaling in osmotic stress (HUGHES HALLETT et al. 2014). It is also known that TORC1 binds to stress granules during heat shock, but this interaction is not required for the initial stages of TORC1 inhibition (TAKAHARA AND MAEDA 2012). Thus, most of the proteins and pathways that regulate TORC1 and/or TORC1-‐Sch9 signaling in noxious stress and energy starvation remain to be identified. It is also unclear how the TORC1 pathway cooperates with other signaling pathways to regulate cell growth. Numerous studies have shown that the ras/PKA pathway regulates expression of the cell growth genes in glucose, primarily by acting in parallel with Sch9 to phosphorylate and regulate Sfp1 and Dot6/Tod6 (JORGENSEN et al. 2004; MARION et al. 2004; MARTIN et al. 2004; ZURITA-‐MARTINEZ AND CARDENAS 2005; SLATTERY et al. 2008; LIPPMAN AND BROACH 2009). It is also known that the inositol kinases Vip1 and Kcs1, and the inositol pyrophosphates they produce, act in parallel with TORC1 to regulate Rpd3L, and thus the Ribi and RP genes, during stress (WORLEY et al. 2013). However, it is unclear how Kcs1 and Vip1 are regulated and if/how other pathways cooperate with TORC1 to control cell growth. Therefore, to push our understanding of TORC1 signaling and cell growth control forward, we carried out a screen to identify proteins that are required for the downregulation of Ribi gene expression in osmotic stress. Similar screens have been carried out previously to identify proteins involved in the Unfolded Protein Response (UPR), Heat shock factor 1 (Hsf1) response (in log growth conditions), and the amino acid starvation response-‐-‐in each case using a GFP reporter placed under a relevant promoter (JONIKAS et al. 2009; NEKLESA AND DAVIS 2009; BRANDMAN et al. 2012). However, a GFP reporter cannot easily be used to study cell growth control since Ribi and RP genes are only transiently downregulated during stress, leading to relatively small (2-‐fold) changes in Ribi and ribosome protein levels (GASCH et al. 2000; LEE et al. 2011). To get around this problem, we developed a novel automated pipeline that directly measures mRNA levels at the peak of the osmotic stress response (a 32-‐fold change in gene expression), and used it to measure Ribi gene expression in 4700 strains from the yeast knock-‐out (YKO) collection (WINZELER et al. 1999). This led to the identification of 440 strains with a reproducible and highly significant (p<0.001) defect in Ribi gene

6
repression during stress. We then went on to show that 53 of these strains also have a significant defect in the response to rapamycin, and are therefore missing genes that act downstream of TORC1.
Among the genes that act downstream of TORC1, we find numerous factors involved in transcription and chromatin remodeling including 6 subunits of Rpd3L, 3 subunits of the Elongator complex, 3 histone proteins, 2 histone demethylases and components of the SWI/SNF, INO80 and CAF-‐1 chromatin remodeling complexes. We also identified 21 ribosome proteins and translation factors in the screen, 9 of which act downstream of TORC1. Other genes in the growth control network have a wide variety of functions, but include 56 proteins involved in vacuolar function and vesicle transport, including 10 components of the V-‐ATPase, as well as 5 kinases, 5 methyltransferases, and 9 membrane transporters. Finally, 17 genes in the network physically interact with TORC1, suggesting that we have identified numerous direct regulators and effectors of TORC1 signaling.
Overall, the data presented here provide a valuable resource for labs studying TORC1 signaling, cell growth control, or the environmental stress response, and demonstrate the utility of our novel and easily adaptable method for mapping gene regulatory networks in yeast and other organisms.
METHODS
Automated Pipeline Inoculation, growth, treatment, and RNA isolation steps were performed on a Biomek FX liquid handling robot (Beckman Coulter) equipped an integrated plate hotel (Cytomat) and shaking incubator (Liconic). All 96 wells plates were labeled with barcodes, and loaded onto the Biomek using a barcode scanner, to ensure that the plates remained in order and maintained their original orientation. OD600 measurements were taken with a plate reader (BioTek Synergy 2) in sterile 96f well plates (Greiner Biof One) at 30°C. Detailed descriptions of the protocols run on the Biomek are provided in File S1.
Cell Growth and Stress Treatment YKO collection strains were pinned onto YEPD agar plates using a Singer ROTOR robot and grown for two days at 30°C. The yeast were then pinned from the agar plates into 96-‐well plates containing 100µl of YEPD per well and grown for 18-‐22 hours at 30°C. The overnight cultures were then used to inoculate 2.2ml deep-‐well plates (VWR), containing 550µl of YEPD and one sterile 3.2mm stainless steel mixing bead per well, to an OD600 of 0.05 and loaded into the Liconic Incubator (shaking at 1200rpm and 30°C). Once the median OD600 of a plate reached 0.60 (no wells reached an OD600 of >0.8), 150µl of each culture was transferred to a 2.2ml 96-‐well plate containing 850µl of RNAse Inactivation Buffer per well (RI Buffer; 4M Ammonium Sulfate, 100mM MES buffer, and 20mM EDTA, pH 4.6) and mixed thoroughly by pipetting. 100µl of 1.875M KCl or 1µg/ml rapamycin in 30°C YEPD was then added to each remaining culture

7
(yielding final concentration of 0.375M KCl or 200ng/ml rapamycin) and the plate returned to the Incubator for 19min (shaking at 1200rpm and 30°C). The plate was then moved back to the deck of the robot and 150µl of culture removed from each well and added to RI Buffer as described above. The plates containing RI Buffer and yeast were then stored at -‐20°C. RNA Purification Plates containing cells in RI Buffer were defrosted by centrifugation (25min at 3000rpm at room temperature) and the supernatant removed from each well. The pelleted cells were then resuspended in 400µl lysis buffer (4M Guanidine Thiocyanate, 25mM NaCitrate, 0.5% N-‐lauryl Sarcosine) and transferred to a 700µl 96-‐well plate (Griener) containing 300µl of zirconia/silica beads per well. The plates were then sealed with sterile foil and shaken for 5min on a mini-‐Beadbeater-‐96 (Biospec). After a second round of centrifugation (25min at 3000rpm at 4°C) the plates were loaded into the Biomek where 100µl of lysate was transferred to a sterile 96-‐well PCR plate (Thermo Scientific). At this point, 70µl of isopropanol was added to each lysate and mixed for 1min before adding 20µl of MagMax binding beads (50% slurry in binding buffer; Ambion) to each well. The isopropanol, lysate and bead mix was then mixed for 7min to ensure all of the RNA in the sample bound to the beads, the plate moved to a magnetic stand-‐96 (Ambion) for 5min, and the liquid removed from each well. The beads were then washed with 150µl of Wash Buffer 1 for 5min (1.7M Guanidine Thiocyanate, 0.17% N-‐lauryl Sarcosine, 33% isopropanol, 33mM NaCitrate, pH 7.0) followed by 150µl of Wash Buffer 2 for 5min (2M KCl, 80% Ethanol, 2mM Tris, PH 7.0). The DNA in each sample was then cleaved by treatment with Turbo DNAse (0.25µl of 2 U/µL stock in 50µl DNAse buffer from Life Technologies) for 25 minutes at room temperature. The RNA was then bound to the magnetic beads again by adding 100µl of 1.5x Wash Buffer 1 and incubating for 5min, the beads washed two more times with Wash Buffer 2 (5min each), and dried for 10min at room temperature. Finally, the purified RNA was eluted by mixing the beads with 30µl of 55°C elution buffer (1mM sterile-‐filtered RNAse-‐free Tris pH 8.0) for 5min, the plate was then returned to magnetic stand (to remove the beads), and the eluate transferred to a sterile PCR plate and stored at -‐80°C. qPCR 1-‐step qRT-‐PCR reactions were performed using 5µl RNA, TaqMan probes/primers from Lifetech (used at the recommended concentrations; probe and primer sequences not provided by company) and 5µl PerfeCTa qPCR ToughMix, Low ROX (Quanta) in a 96-‐well PCR plate using an Agilent Stratagene Mx3005p cycler. One TaqMan probe bound to the reporter gene Nsr1 (labeled with FAM dye) and the other bound to a control gene, Pex6 or Ntf2 (labeled with JOE dye). The ROX normalized data from each plate was then analyzed using the Stratagene MxPro software and fluorescence thresholds (dRn) of 0.120 for FAM (Nsr1) and 0.60 for JOE (Pex6). Samples that passed the FAM or JOE threshold after >28 cycles were discarded. This filtering caused us to drop data from about 200 strains in the YKO library; most of these strains grew very poorly in the 96 well plates leading to a low RNA yield.

8
qPCR Normalization To calculate the normalized NSR1/PEX6 and NSR1/NTF2 ratios, the FAM minus JOE (F-‐J) value was calculated for every well. The machine learning module, scikit-‐learn, in Python was then used to calculate the average F-‐J value for two populations on each plate-‐-‐strains with expression defects, and strains without expression defects. This was done using Gaussian Mixture Models in the ‘scikit.mixture’ package with a covariance class of type ‘full’ for 2-‐component analysis (http://scikit-‐learn.org/stable/modules/mixture.html#selecting-‐the-‐number-‐of-‐components-‐in-‐a-‐classical-‐gmm). The average F-‐J value for the strains without an expression defect was then subtracted from the F-‐J value of the entire plate, setting the mean of the plate (minus the outliers) to 0.0. All values were then multiplied by -‐1 so that higher RNA concentrations give higher NSR1/PEX6 ratios. This normalization had little impact on the list of strains that we identified as outliers in the screen but adjusts for the 0.3-‐0.6 cycle variation in the average NSR1/PEX6 ratio that we observe in separate runs on the qPCR machine. Application of the Method to Other Organisms and Problems The automated pipeline described here can (in theory) be used to study a wide variety of organisms/cell types. In most cases, this will require knocking down protein targets using siRNA or CRISPRi prior to stress treatment. The lysis step will also have to be optimized for each cell type. However, for organisms that do not have a cell wall it should be possible to perform chemical lysis on the deck of the robot and proceed directly to the RNA purification step. Finally, the primer sets used in the qPCR step will have to be optimized for each pathway and organism. The method described here could also be used to study RNA decay if a transcription inhibitor is added to the cells just prior to stress treatment. Network Reconstruction Interactions between the top 440 genes/proteins in our screen were mapped using the protein-‐protein interaction data from BioGRID (version 3.4.125). TORC1 (Tor1, Kog1, Lst8, Tco89) was also added to our model as one merged node for reference. 275 proteins, including TORC1, form the major network, while 160 genes have no connection to any other of the 440 proteins identified in the screen. Note that the HSP70 family chaperones Ssa1 and Ssb1 and the RNA binding protein Slf1 were removed from the set (along with any proteins that only interact with them) in Fig. 6 to eliminate non-‐specific interactions (leaving 236 genes). The interactions within the osmotic stress response network were mapped and clustered using Cytoscape (version 3.2.1). In Figure 7, node centers are colored based on the rapamycin data, with red nodes indicating a normalized F-‐J score of log2≥ 1, and grey nodes indicating log2< 1, or no data. Node borders are colored based on selected GO Slim data (SGD GO Slim Mapper), where maroon indicates nuclear localization and blue indicates endomembrane or vacuolar localization. Edges are colored based on the type of protein-‐protein data;

9
Affinity Capture-‐Luminescence, Affinity Capture-‐MS, Affinity Capture-‐RNA, Affinity Capture-‐Western, and Reconstituted Complex are black; Two-‐hybrid and Protein-‐Fragment Complementation Assay are orange; finally, Biochemical Activity, Co-‐crystal Structure, Co-‐fractionation, Co-‐localization, Co-‐purification, and FRET are dotted grey. DNA Microarrays of Rpd3L mutants Rpd3L and Rpd3S mutants were constructed using standard methods in an EYO690 (W303) background, as described in detail previously (WORLEY et al. 2013). Overnight cultures of the EY0690 or Rpd3L mutant strains were then used to inoculate 0.75L of YEPD to an OD600 of 0.1 in a 2.8 L conical flask, and grown shaking at 200 rpm and 30°C. Once the cultures reached an OD600 of 0.6, 250 ml of cells were collected by vacuum filtration and frozen in liquid nitrogen. The remaining cells were then subjected to 0.375 M KCl stress for 20min, harvested by vacuum filtration, and frozen in liquid nitrogen. Finally, the mRNA was purified from the frozen cells, converted into cDNA using reverse transcription, labeled with Cy3 or Cy5, and examined using an Agilent microarray, as described previously (CAPALDI 2010; WORLEY et al. 2013)
10
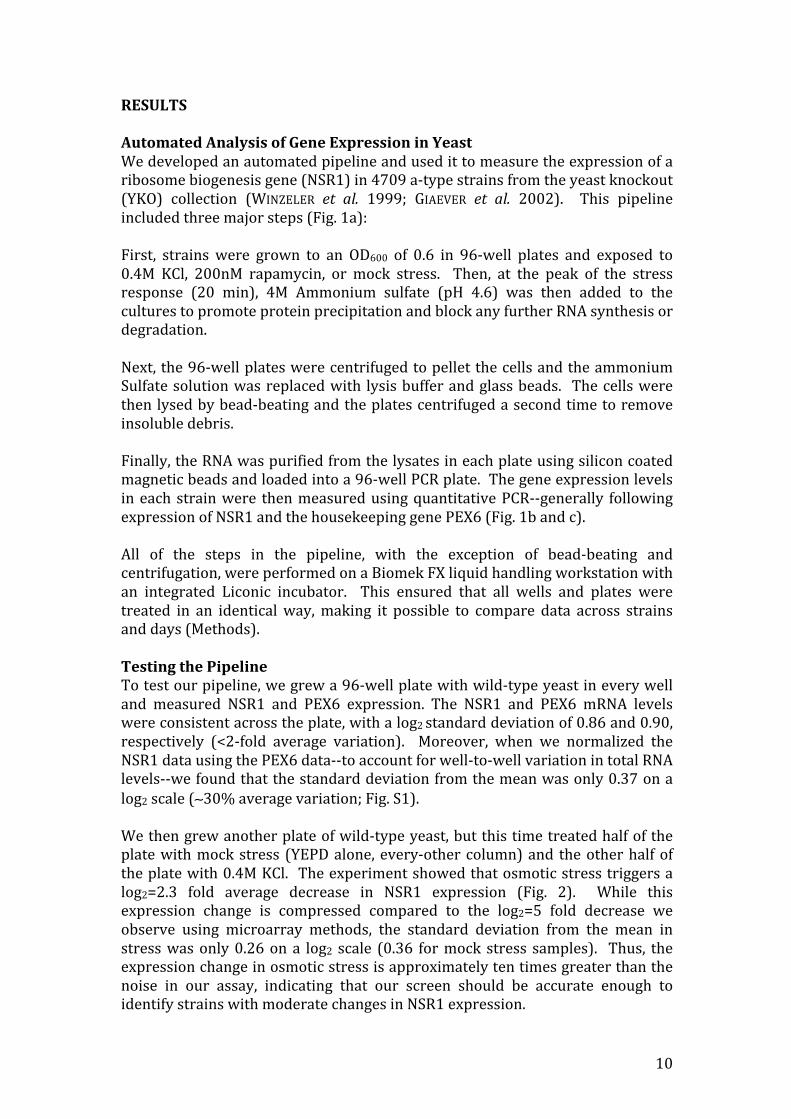
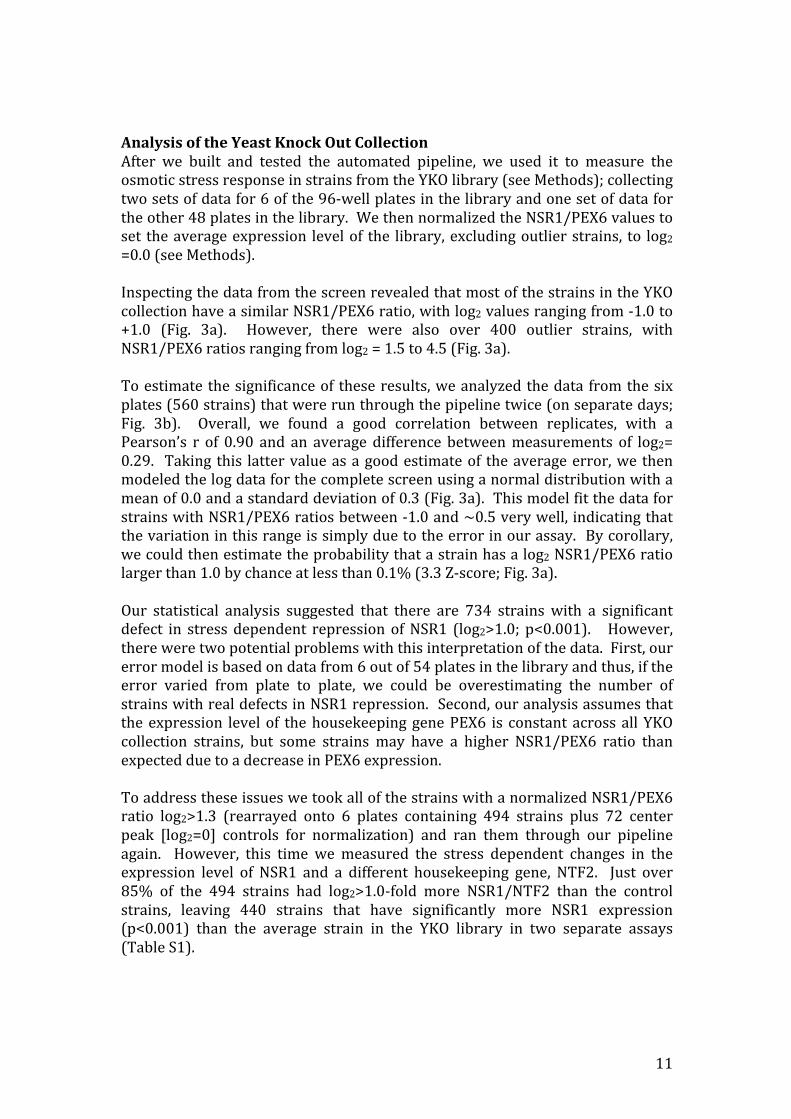
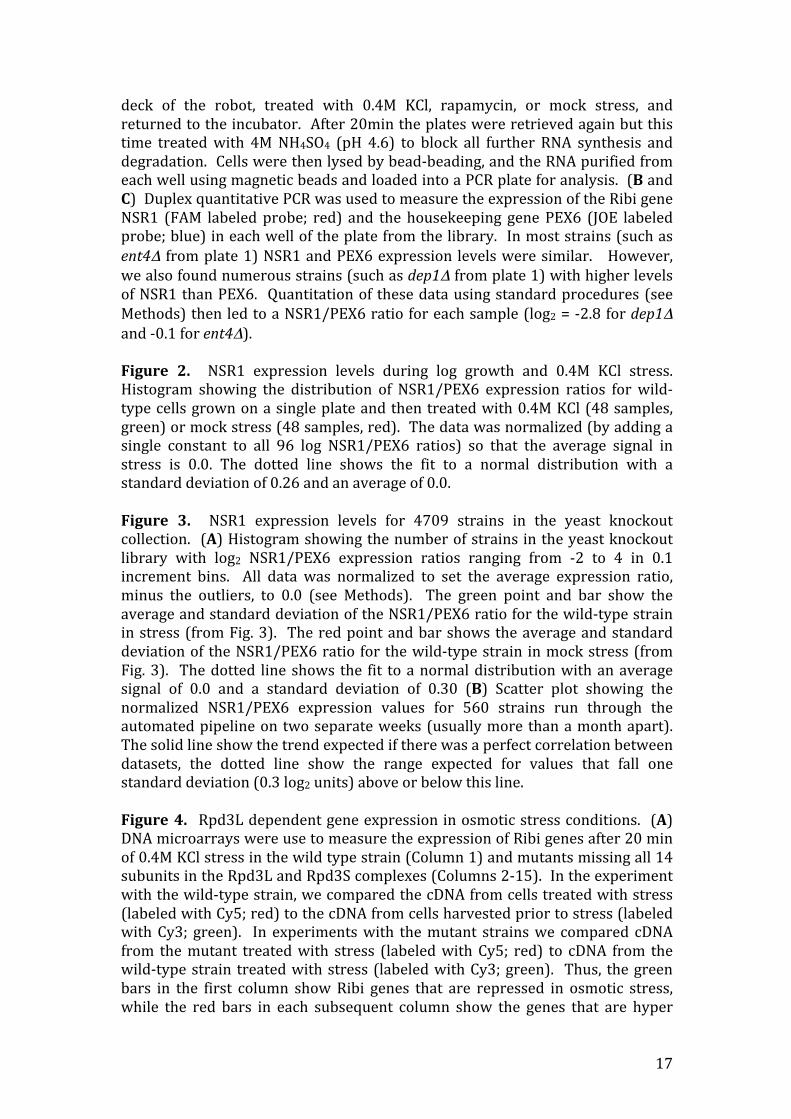
RESULTS Automated Analysis of Gene Expression in Yeast We developed an automated pipeline and used it to measure the expression of a ribosome biogenesis gene (NSR1) in 4709 a-‐type strains from the yeast knockout (YKO) collection (WINZELER et al. 1999; GIAEVER et al. 2002). This pipeline included three major steps (Fig. 1a): First, strains were grown to an OD600 of 0.6 in 96-‐well plates and exposed to 0.4M KCl, 200nM rapamycin, or mock stress. Then, at the peak of the stress response (20 min), 4M Ammonium sulfate (pH 4.6) was then added to the cultures to promote protein precipitation and block any further RNA synthesis or degradation. Next, the 96-‐well plates were centrifuged to pellet the cells and the ammonium Sulfate solution was replaced with lysis buffer and glass beads. The cells were then lysed by bead-‐beating and the plates centrifuged a second time to remove insoluble debris. Finally, the RNA was purified from the lysates in each plate using silicon coated magnetic beads and loaded into a 96-‐well PCR plate. The gene expression levels in each strain were then measured using quantitative PCR-‐-‐generally following expression of NSR1 and the housekeeping gene PEX6 (Fig. 1b and c). All of the steps in the pipeline, with the exception of bead-‐beating and centrifugation, were performed on a Biomek FX liquid handling workstation with an integrated Liconic incubator. This ensured that all wells and plates were treated in an identical way, making it possible to compare data across strains and days (Methods). Testing the Pipeline To test our pipeline, we grew a 96-‐well plate with wild-‐type yeast in every well and measured NSR1 and PEX6 expression. The NSR1 and PEX6 mRNA levels were consistent across the plate, with a log2 standard deviation of 0.86 and 0.90, respectively (<2-‐fold average variation). Moreover, when we normalized the NSR1 data using the PEX6 data-‐-‐to account for well-‐to-‐well variation in total RNA levels-‐-‐we found that the standard deviation from the mean was only 0.37 on a log2 scale (∼30% average variation; Fig. S1). We then grew another plate of wild-‐type yeast, but this time treated half of the plate with mock stress (YEPD alone, every-‐other column) and the other half of the plate with 0.4M KCl. The experiment showed that osmotic stress triggers a log2=2.3 fold average decrease in NSR1 expression (Fig. 2). While this expression change is compressed compared to the log2=5 fold decrease we observe using microarray methods, the standard deviation from the mean in stress was only 0.26 on a log2 scale (0.36 for mock stress samples). Thus, the expression change in osmotic stress is approximately ten times greater than the noise in our assay, indicating that our screen should be accurate enough to identify strains with moderate changes in NSR1 expression.
11
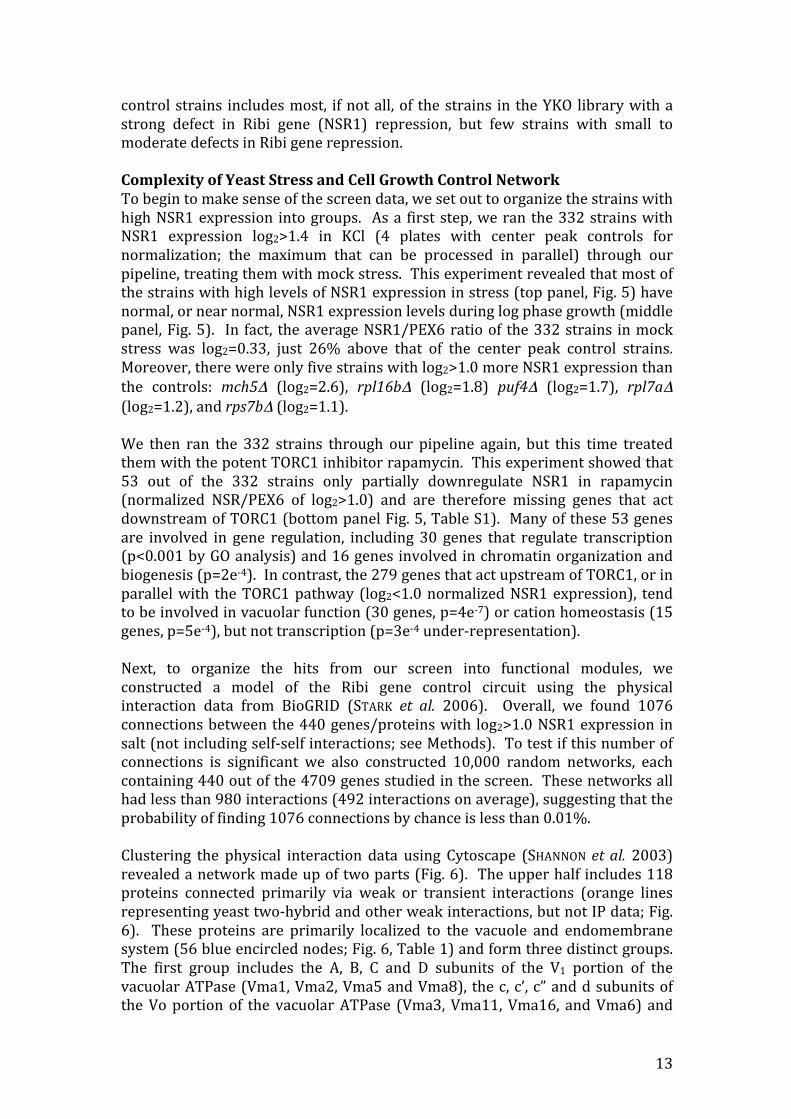
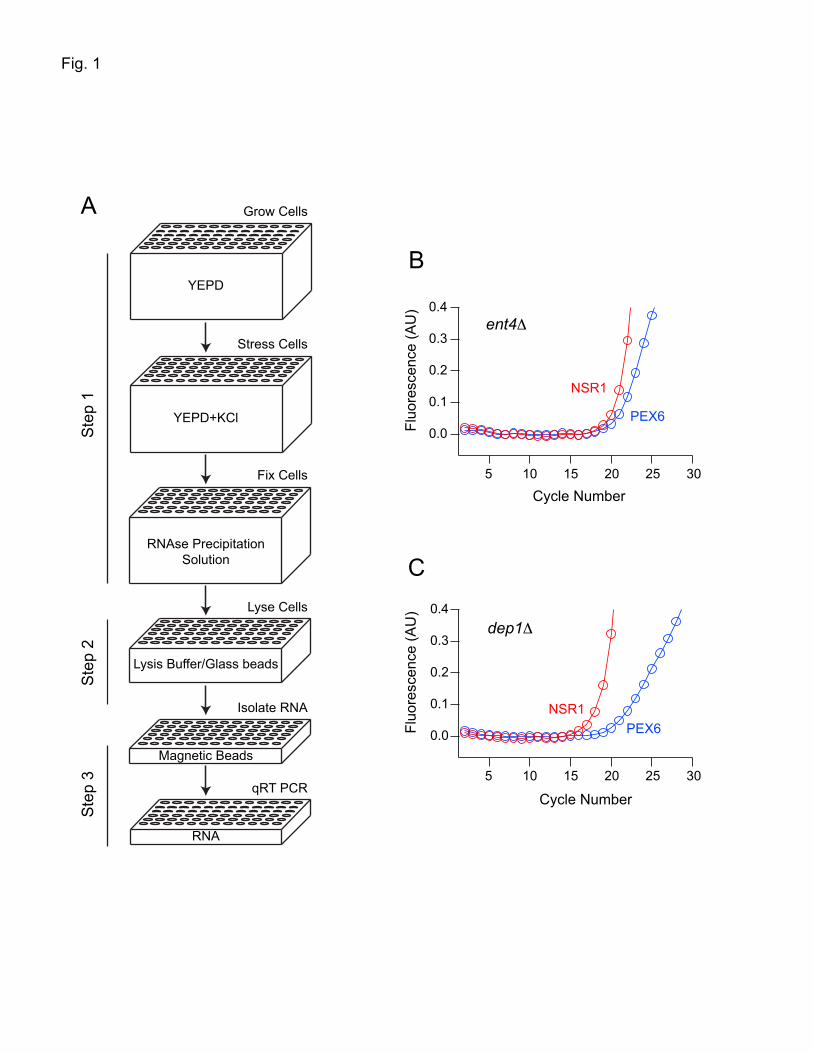
Analysis of the Yeast Knock Out Collection After we built and tested the automated pipeline, we used it to measure the osmotic stress response in strains from the YKO library (see Methods); collecting two sets of data for 6 of the 96-‐well plates in the library and one set of data for the other 48 plates in the library. We then normalized the NSR1/PEX6 values to set the average expression level of the library, excluding outlier strains, to log2 =0.0 (see Methods). Inspecting the data from the screen revealed that most of the strains in the YKO collection have a similar NSR1/PEX6 ratio, with log2 values ranging from -‐1.0 to +1.0 (Fig. 3a). However, there were also over 400 outlier strains, with NSR1/PEX6 ratios ranging from log2 = 1.5 to 4.5 (Fig. 3a). To estimate the significance of these results, we analyzed the data from the six plates (560 strains) that were run through the pipeline twice (on separate days; Fig. 3b). Overall, we found a good correlation between replicates, with a Pearson’s r of 0.90 and an average difference between measurements of log2= 0.29. Taking this latter value as a good estimate of the average error, we then modeled the log data for the complete screen using a normal distribution with a mean of 0.0 and a standard deviation of 0.3 (Fig. 3a). This model fit the data for strains with NSR1/PEX6 ratios between -‐1.0 and ~0.5 very well, indicating that the variation in this range is simply due to the error in our assay. By corollary, we could then estimate the probability that a strain has a log2 NSR1/PEX6 ratio larger than 1.0 by chance at less than 0.1% (3.3 Z-‐score; Fig. 3a). Our statistical analysis suggested that there are 734 strains with a significant defect in stress dependent repression of NSR1 (log2>1.0; p<0.001). However, there were two potential problems with this interpretation of the data. First, our error model is based on data from 6 out of 54 plates in the library and thus, if the error varied from plate to plate, we could be overestimating the number of strains with real defects in NSR1 repression. Second, our analysis assumes that the expression level of the housekeeping gene PEX6 is constant across all YKO collection strains, but some strains may have a higher NSR1/PEX6 ratio than expected due to a decrease in PEX6 expression. To address these issues we took all of the strains with a normalized NSR1/PEX6 ratio log2>1.3 (rearrayed onto 6 plates containing 494 strains plus 72 center peak [log2=0] controls for normalization) and ran them through our pipeline again. However, this time we measured the stress dependent changes in the expression level of NSR1 and a different housekeeping gene, NTF2. Just over 85% of the 494 strains had log2>1.0-‐fold more NSR1/NTF2 than the control strains, leaving 440 strains that have significantly more NSR1 expression (p<0.001) than the average strain in the YKO library in two separate assays (Table S1).

12
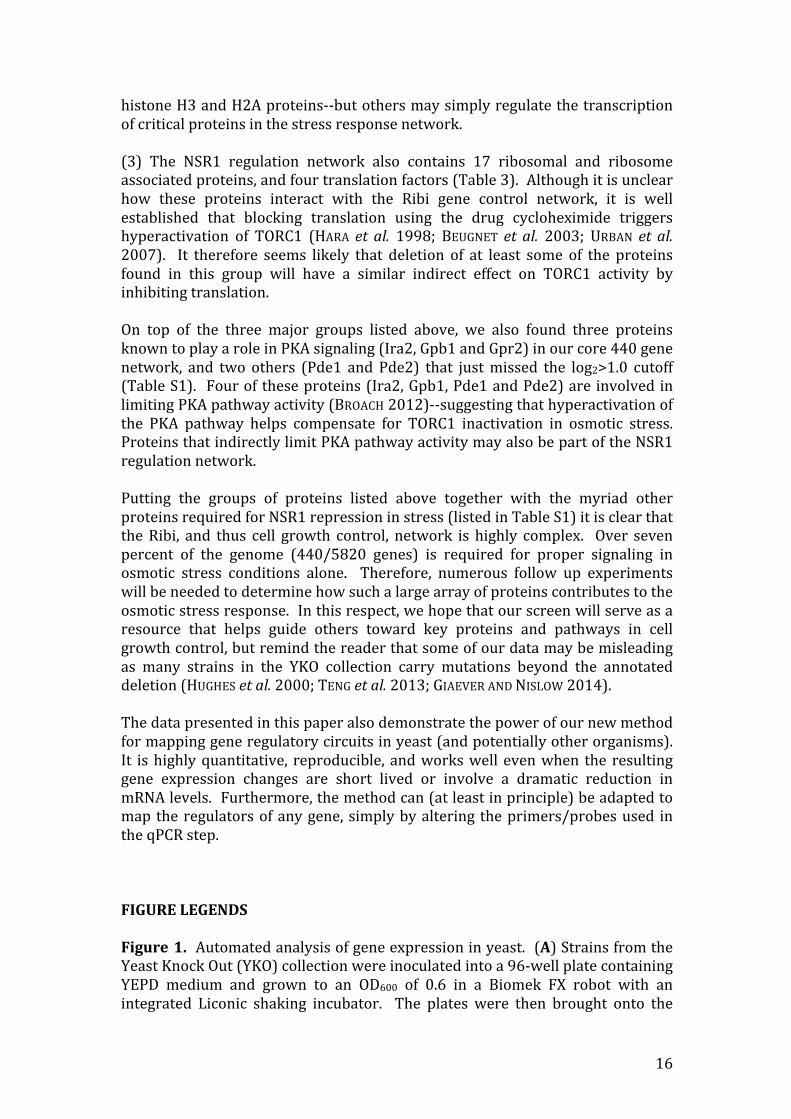
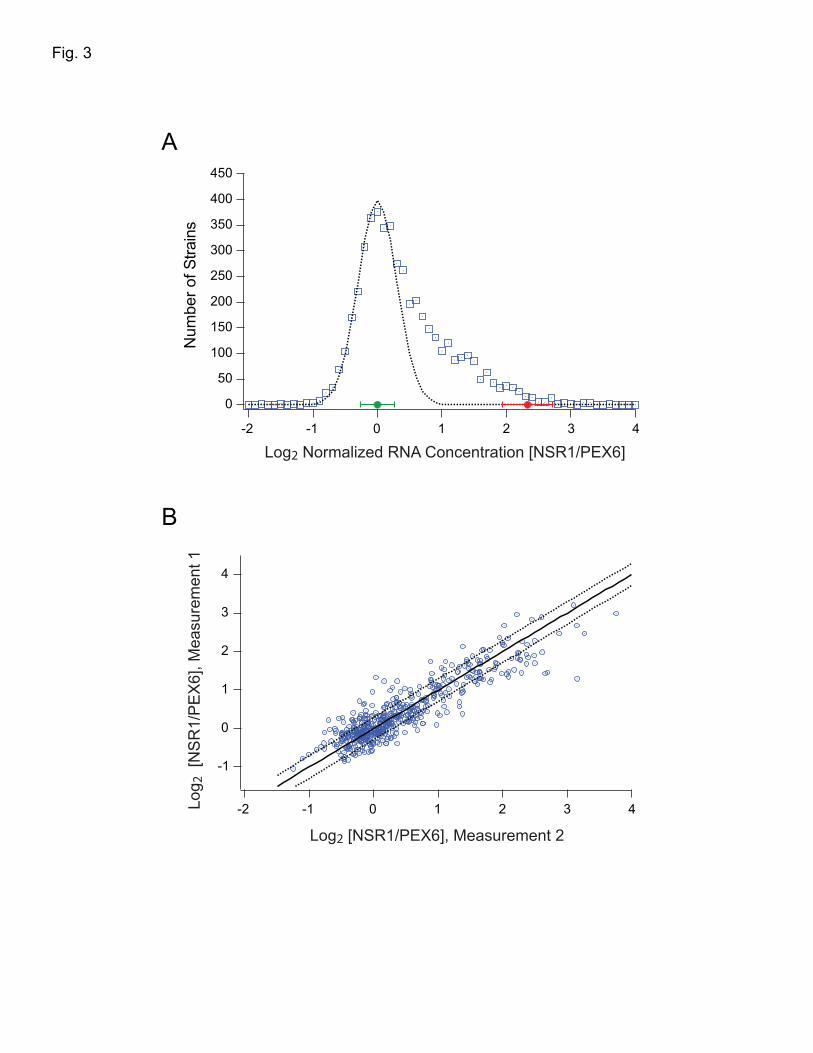
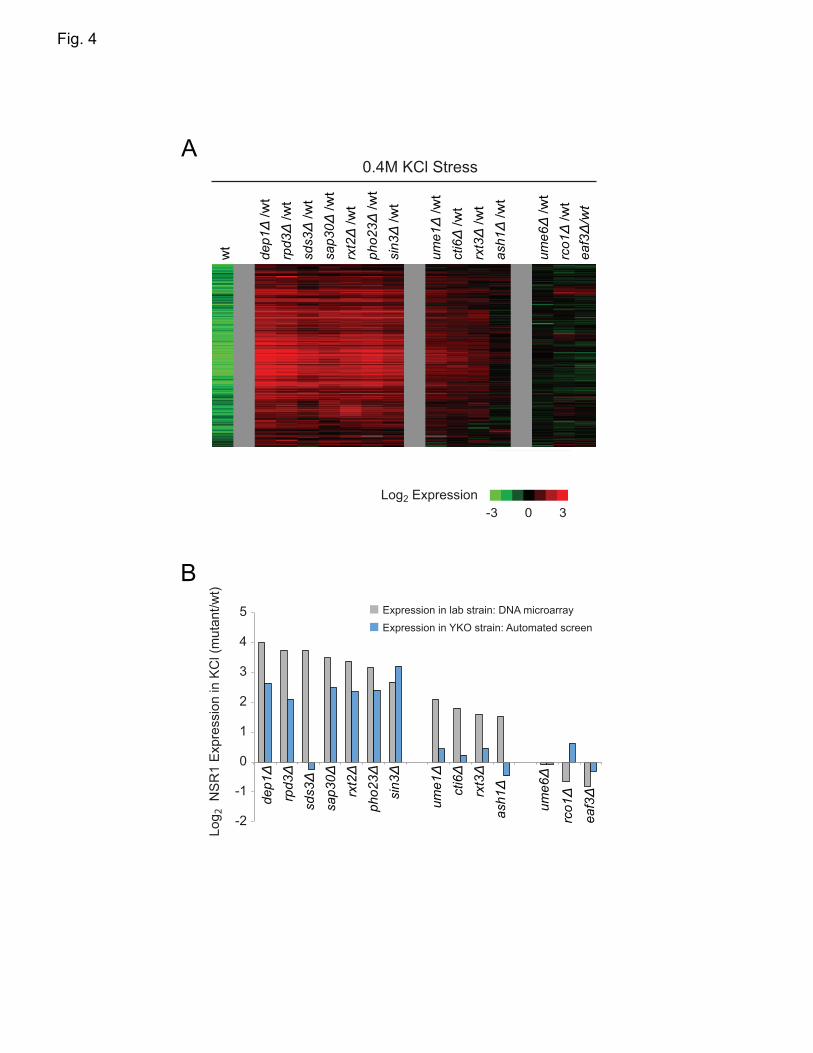
Identification of Known Components in the Cell Growth Control Circuit To estimate the false negative rate in our screen, we examined the screen data for strains missing known components in the Ribi gene control circuit. As described in the introduction, TORC1, Sch9, Kcs1, Vip1, Hog1, and Rpd3L are all known to play a role in downregulating Ribi gene expression during osmotic stress. However, strains missing the TORC1 components Tor1, Kog1, Lst8 and Tco89, and the kinase Sch9 should not (and do not) show up as hits in our screen since; Tor1 acts redundantly with Tor2; Tco89 has a very limited impact on TORC1 signaling; and Kog1, Lst8 and Sch9 are essential genes and thus not in the YKO library (WINZELER et al. 1999; GIAEVER et al. 2002; LOEWITH et al. 2002). We did find a log2= 3.1, 1.1, and 0.6 increase in NSR1 expression in the kcs1Δ, vip1Δ and hog1Δ strains from the YKO collection. These numbers align reasonably well with those from our previous work, where we found that deletion of Kcs1, Vip1 and Hog1 in the W303 background all caused an approximately 2-‐fold increase in Ribi gene expression in osmotic stress (WORLEY et al. 2013; HUGHES HALLETT et al. 2014). The one outlier was the kcs1Δ strain from the YKO library (which has a larger increase in NSR1 expression than expected), but previous work has shown that this strain behaves abnormally and is likely carrying multiple mutations (HUANG AND O'SHEA 2005). We also found expression changes in YKO collection strains missing some, but not all, of the Rpd3L subunits. Previous studies have shown that Rpd3 and Pho23 are required for Ribi gene repression in stress, but little is known about the role that the other subunits in Rpd3L play in stress conditions (ALEJANDRO-‐OSORIO et al. 2009). Therefore, to build a more complete picture of Rpd3L function-‐-‐and calibrate our screen-‐-‐we made 14 strains, each missing one subunit of Rpd3L (Rpd3, Sin3, Ume1, Pho23, Sap30, Sds3, Cti6, Rxt2, Rxt3, Dep1, Ume6 and Ash1), or as a control Rpd3S (Eaf3, Rco1), and measured their response to 0.4M KCl using DNA microarrays (CARROZZA et al. 2005a; CARROZZA et al. 2005b). Our microarray analysis revealed that the 14 strains missing Rpd3L or Rpd3S subunits fall into three groups (Fig. 4a). The first group of strains (rpd3Δ, sin3Δ, pho23Δ, dep1Δ, sds3Δ, sap30Δ, and rxt2Δ) has a large defect in Ribi and RP gene repression; the second group (ume1Δ, cti6Δ, rxt3Δ, ash1Δ) has a weak to moderate defect in Ribi and RP gene repression; while the third group (ume6Δ, rco1Δ, eaf3Δ) has no defect in Ribi or RP gene repression. Comparing the microarray and screen data revealed a clear trend; the screen picked up strains with large defects in NSR1 repression but not strains with small to moderate defects in NSR1 repression (Fig. 4b). In fact, 6/7 gene deletions that caused a strong defect in NSR1 down-‐regulation were identified as hits (log2>1.0) in the screen (Fig. 4b). The only exception was sds3Δ, but in further testing we found that the inconsistency was caused by additional mutations in the strain from the YKO collection (Fig. S2). In contrast, 0/4 gene deletions that caused a small to moderate defect in NSR1 down-‐regulation in the microarray experiments were identified as hits (Fig. 4b). It is therefore likely that the 440 strains with log2>1.0 more NSR1 expression during stress than the
13
control strains includes most, if not all, of the strains in the YKO library with a strong defect in Ribi gene (NSR1) repression, but few strains with small to moderate defects in Ribi gene repression. Complexity of Yeast Stress and Cell Growth Control Network To begin to make sense of the screen data, we set out to organize the strains with high NSR1 expression into groups. As a first step, we ran the 332 strains with NSR1 expression log2>1.4 in KCl (4 plates with center peak controls for normalization; the maximum that can be processed in parallel) through our pipeline, treating them with mock stress. This experiment revealed that most of the strains with high levels of NSR1 expression in stress (top panel, Fig. 5) have normal, or near normal, NSR1 expression levels during log phase growth (middle panel, Fig. 5). In fact, the average NSR1/PEX6 ratio of the 332 strains in mock stress was log2=0.33, just 26% above that of the center peak control strains. Moreover, there were only five strains with log2>1.0 more NSR1 expression than the controls: mch5Δ (log2=2.6), rpl16bΔ (log2=1.8) puf4Δ (log2=1.7), rpl7aΔ (log2=1.2), and rps7bΔ (log2=1.1). We then ran the 332 strains through our pipeline again, but this time treated them with the potent TORC1 inhibitor rapamycin. This experiment showed that 53 out of the 332 strains only partially downregulate NSR1 in rapamycin (normalized NSR/PEX6 of log2>1.0) and are therefore missing genes that act downstream of TORC1 (bottom panel Fig. 5, Table S1). Many of these 53 genes are involved in gene regulation, including 30 genes that regulate transcription (p<0.001 by GO analysis) and 16 genes involved in chromatin organization and biogenesis (p=2e-‐4). In contrast, the 279 genes that act upstream of TORC1, or in parallel with the TORC1 pathway (log2<1.0 normalized NSR1 expression), tend to be involved in vacuolar function (30 genes, p=4e-‐7) or cation homeostasis (15 genes, p=5e-‐4), but not transcription (p=3e-‐4 under-‐representation). Next, to organize the hits from our screen into functional modules, we constructed a model of the Ribi gene control circuit using the physical interaction data from BioGRID (STARK et al. 2006). Overall, we found 1076 connections between the 440 genes/proteins with log2>1.0 NSR1 expression in salt (not including self-‐self interactions; see Methods). To test if this number of connections is significant we also constructed 10,000 random networks, each containing 440 out of the 4709 genes studied in the screen. These networks all had less than 980 interactions (492 interactions on average), suggesting that the probability of finding 1076 connections by chance is less than 0.01%. Clustering the physical interaction data using Cytoscape (SHANNON et al. 2003) revealed a network made up of two parts (Fig. 6). The upper half includes 118 proteins connected primarily via weak or transient interactions (orange lines representing yeast two-‐hybrid and other weak interactions, but not IP data; Fig. 6). These proteins are primarily localized to the vacuole and endomembrane system (56 blue encircled nodes; Fig. 6, Table 1) and form three distinct groups. The first group includes the A, B, C and D subunits of the V1 portion of the vacuolar ATPase (Vma1, Vma2, Vma5 and Vma8), the c, c’, c” and d subunits of the Vo portion of the vacuolar ATPase (Vma3, Vma11, Vma16, and Vma6) and

14
three associated proteins (Vma21, Vma22, and Pkr1). The second group includes two components of the EGO complex (a known regulator of autophagy and TORC1 (BINDA et al. 2009); Slm4 and Meh1), two components of the vacuolar transporter chaperone (VTC) complex, and the transporter Gap1 (EGO and VTC; Fig. 6). The third group includes endosomal and vacuolar SNARE proteins (Syn8, Vam3 and Vam7), the vacuolar Rab family GTPase, Ypt7 (involved in vacuole and endosome fusion; (SCHIMMOLLER AND RIEZMAN 1993)), and a component of the CORVET membrane-‐tethering complex on the vacuole, Pep5. Twenty-‐two other genes, distributed throughout the upper portion of the network, are also involved in vesicle trafficking (bottom, Table 1), including numerous steps in transporting cargo from the ER through the Golgi and to the Vacuole (Gyp5, Yip5, Emp70, Vfa1, Vab2 and Rcr1) and from the Cytoplasm to Vacuole (Snx4, Pfa3 and Vac8). Interestingly, almost all of the proteins in the upper portion of the Ribi gene control network, act upstream of TORC1 or in parallel with the TORC1 pathway (grey nodes Fig. 6 and Table 1). Consistent with this, TORC1 itself (green node; Fig. 6) interacts with several proteins in this portion of the network (Table 2), including Vac8, a part of the CVT pathway and Gyp5 (a GTPase-‐activating protein involved in ER to Golgi transport), and the kinases Nnk1, Fmp48 and Kdx1-‐-‐ forming a total of 17 interactions with proteins in the upper and lower parts of the network (Table 2). In the lower half of the network (also 118 genes) we find two highly connected nodes, the histone H3 proteins, Hht1/2 (merged into one node for simplicity and shown in yellow in Fig. 6). Hht1/2 in turn form strong interactions with three major complexes (black lines showing IP data, Fig. 6). The first includes the six core subunits of Rpd3L (Rpd3, Sin3, Pho23, Sap30, Dep1 and Rxt2) as well another Class I HDAC Hos1 and the Sin3 associated transcription factor Stb4 (Table 3). The second includes three components of the Elongator complex (part of the Pol II holoenzyme responsible for transcriptional elongation; Elp3, Elp6 and Iki3) as well as an associated kinase, Vhs1 (Table 3). The third includes 13 ribosomal proteins and 4 ribosome-‐associated proteins (Table 3). Hht1/2 also interact with numerous other nuclear proteins involved in NSR1 regulation (54 maroon encircled nodes, Fig. 6), including histone 2a, components of the ISW2, INO80 and SWI/SNF chromatin remodeling complexes, as well as numerous factors involved in translation and RNA decay (bottom, Table 3). Interestingly, many of the proteins in the lower half of the network, particularly those involved in chromatin remodeling and transcription, act downstream of TORC1 as per our rapamycin data (34 red nodes, Fig. 6). Outside of the portion of the Ribi gene control network connected by known physical interactions, there are many important proteins/genes (Table S1). The only enriched group includes 21 genes involved in nitrogen metabolism (p=9e-‐5). However, there are also 56 enzymes in the unconnected portion of the network (including 5 kinases; Adk1, Bud17, Dgk1, Lsb6, and Yfh7, and 5 methyltrasferases; Mtq2, Sam4, Trm12, Trm44, and Ymr310c), along with 9 transmembrane transporters (Dip5, Hxt14, Mep1, Mup3, Pdr10, Sit1, Tom7,

15
Ydr387c, and Yfl040w) and 8 DNA binding proteins (Dal82, Hal9, Hcm1, Hop1, Sip4, Sok2, Su2 and Znf1). These proteins may interact with components in the cell growth control network during osmotic stress—a stimulus rarely applied during large-‐scale studies of protein interactions and thus missing from the physical interaction network—or alter network activity by affecting the level of key metabolites in the cell. DISCUSSION We have identified 440 strains from the yeast knockout collection that have a strong and reproducible defect in Ribi gene (NSR1) repression during osmotic stress. The proteins/genes knocked out in these strains fall into three major groups. (1) The NSR1/Ribi regulation network contains 37 proteins involved in vesicle trafficking, 11 components of the vacuolar ATPase, and 50 other proteins that act as part of the endomembrane system (Table 1 and Table S1). These proteins probably influence NSR1 expression in a variety of ways. Some of these proteins may directly, or indirectly, inhibit TORC1 signaling in stress. In line with this hypothesis, we found that strains missing components of the EGO complex (Meh1 and Slm4) and vacuolar ATPase-‐-‐known regulators of TORC1 signaling in other conditions (BINDA et al. 2009; ZONCU et al. 2011)-‐-‐have large defects in NSR1 down-‐regulation. Other vacuole or endomembrane proteins may be important for the transport of proteins that interact with, or support the function of, TORC1 and EGO on the vacuolar membrane. Yet other proteins in this group may be required nutrient transport and storage, and thus deleting them could lead to changes in TORC1 and cell growth signaling. In fact, Cardenas and coworkers have already shown that disruption of the CORVET and HOPS complexes-‐-‐complexes also identified in our study-‐-‐cause partial inactivation of TORC1 signaling during log phase growth by inhibiting the activation of the EGO complex members Gtr1/2 (ZURITA-‐MARTINEZ et al. 2007). This constitutive TORC1 repression may then desensitize the TORC1 pathway to inhibition by osmotic stress (Fig. S3). (2) The NSR1 regulation network contains at least 24 proteins involved in chromatin silencing, 6 proteins involved in general transcription, and 9 other DNA binding proteins (Table 3). Six of these proteins are subunits of the Class I HDAC Rpd3L-‐-‐a complex that deacetylates the nucleosomes in Ribi gene promoters whenever TORC1 is inactivated (HUMPHREY et al. 2004; HUBER et al. 2011). However, the other proteins identified in this group have not been linked to Ribi gene regulation previously. Some of these proteins probably cooperate with Rpd3L to inactivate NSR1 in stress-‐-‐this is almost certainly the case for the
16
histone H3 and H2A proteins-‐-‐but others may simply regulate the transcription of critical proteins in the stress response network. (3) The NSR1 regulation network also contains 17 ribosomal and ribosome associated proteins, and four translation factors (Table 3). Although it is unclear how these proteins interact with the Ribi gene control network, it is well established that blocking translation using the drug cycloheximide triggers hyperactivation of TORC1 (HARA et al. 1998; BEUGNET et al. 2003; URBAN et al. 2007). It therefore seems likely that deletion of at least some of the proteins found in this group will have a similar indirect effect on TORC1 activity by inhibiting translation. On top of the three major groups listed above, we also found three proteins known to play a role in PKA signaling (Ira2, Gpb1 and Gpr2) in our core 440 gene network, and two others (Pde1 and Pde2) that just missed the log2>1.0 cutoff (Table S1). Four of these proteins (Ira2, Gpb1, Pde1 and Pde2) are involved in limiting PKA pathway activity (BROACH 2012)-‐-‐suggesting that hyperactivation of the PKA pathway helps compensate for TORC1 inactivation in osmotic stress. Proteins that indirectly limit PKA pathway activity may also be part of the NSR1 regulation network. Putting the groups of proteins listed above together with the myriad other proteins required for NSR1 repression in stress (listed in Table S1) it is clear that the Ribi, and thus cell growth control, network is highly complex. Over seven percent of the genome (440/5820 genes) is required for proper signaling in osmotic stress conditions alone. Therefore, numerous follow up experiments will be needed to determine how such a large array of proteins contributes to the osmotic stress response. In this respect, we hope that our screen will serve as a resource that helps guide others toward key proteins and pathways in cell growth control, but remind the reader that some of our data may be misleading as many strains in the YKO collection carry mutations beyond the annotated deletion (HUGHES et al. 2000; TENG et al. 2013; GIAEVER AND NISLOW 2014). The data presented in this paper also demonstrate the power of our new method for mapping gene regulatory circuits in yeast (and potentially other organisms). It is highly quantitative, reproducible, and works well even when the resulting gene expression changes are short lived or involve a dramatic reduction in mRNA levels. Furthermore, the method can (at least in principle) be adapted to map the regulators of any gene, simply by altering the primers/probes used in the qPCR step. FIGURE LEGENDS Figure 1. Automated analysis of gene expression in yeast. (A) Strains from the Yeast Knock Out (YKO) collection were inoculated into a 96-‐well plate containing YEPD medium and grown to an OD600 of 0.6 in a Biomek FX robot with an integrated Liconic shaking incubator. The plates were then brought onto the
17
deck of the robot, treated with 0.4M KCl, rapamycin, or mock stress, and returned to the incubator. After 20min the plates were retrieved again but this time treated with 4M NH4SO4 (pH 4.6) to block all further RNA synthesis and degradation. Cells were then lysed by bead-‐beading, and the RNA purified from each well using magnetic beads and loaded into a PCR plate for analysis. (B and C) Duplex quantitative PCR was used to measure the expression of the Ribi gene NSR1 (FAM labeled probe; red) and the housekeeping gene PEX6 (JOE labeled probe; blue) in each well of the plate from the library. In most strains (such as ent4Δ from plate 1) NSR1 and PEX6 expression levels were similar. However, we also found numerous strains (such as dep1Δ from plate 1) with higher levels of NSR1 than PEX6. Quantitation of these data using standard procedures (see Methods) then led to a NSR1/PEX6 ratio for each sample (log2 = -‐2.8 for dep1Δ and -‐0.1 for ent4Δ). Figure 2. NSR1 expression levels during log growth and 0.4M KCl stress. Histogram showing the distribution of NSR1/PEX6 expression ratios for wild-‐type cells grown on a single plate and then treated with 0.4M KCl (48 samples, green) or mock stress (48 samples, red). The data was normalized (by adding a single constant to all 96 log NSR1/PEX6 ratios) so that the average signal in stress is 0.0. The dotted line shows the fit to a normal distribution with a standard deviation of 0.26 and an average of 0.0. Figure 3. NSR1 expression levels for 4709 strains in the yeast knockout collection. (A) Histogram showing the number of strains in the yeast knockout library with log2 NSR1/PEX6 expression ratios ranging from -‐2 to 4 in 0.1 increment bins. All data was normalized to set the average expression ratio, minus the outliers, to 0.0 (see Methods). The green point and bar show the average and standard deviation of the NSR1/PEX6 ratio for the wild-‐type strain in stress (from Fig. 3). The red point and bar shows the average and standard deviation of the NSR1/PEX6 ratio for the wild-‐type strain in mock stress (from Fig. 3). The dotted line shows the fit to a normal distribution with an average signal of 0.0 and a standard deviation of 0.30 (B) Scatter plot showing the normalized NSR1/PEX6 expression values for 560 strains run through the automated pipeline on two separate weeks (usually more than a month apart). The solid line show the trend expected if there was a perfect correlation between datasets, the dotted line show the range expected for values that fall one standard deviation (0.3 log2 units) above or below this line. Figure 4. Rpd3L dependent gene expression in osmotic stress conditions. (A) DNA microarrays were use to measure the expression of Ribi genes after 20 min of 0.4M KCl stress in the wild type strain (Column 1) and mutants missing all 14 subunits in the Rpd3L and Rpd3S complexes (Columns 2-‐15). In the experiment with the wild-‐type strain, we compared the cDNA from cells treated with stress (labeled with Cy5; red) to the cDNA from cells harvested prior to stress (labeled with Cy3; green). In experiments with the mutant strains we compared cDNA from the mutant treated with stress (labeled with Cy5; red) to cDNA from the wild-‐type strain treated with stress (labeled with Cy3; green). Thus, the green bars in the first column show Ribi genes that are repressed in osmotic stress, while the red bars in each subsequent column show the genes that are hyper

18
expressed in stress. (B) Graph showing the change in NSR1 expression caused by deletion of each subunit in Rpd3L/S as measured by DNA microarray analysis of strains made in the W303 background (grey bars) and the automated analysis of the YKO collection (blue bars).
Figure 5. NSR1 expression levels in KCl, mock stress and rapamycin. The top 332 strains in the screen were analyzed to measure the NSR1/PEX6 ratio after 20min in 0.4M KCl stress (upper panel), mock stress conditions (middle panel), or 200nM Rapamycin (lower panel). In all of these experiments the 332 strains were distributed across four 96-‐well plates, together with 48 strains from the center of the peak in the original screen. The average NSR1/PEX6 expression level in these control strains was set to 0.0 in each experiment. Strains with defects in repressing NSR1 expression in each condition should therefore have log2 NSR1/PEX6 expression ratios >1.0. The dotted lines show a normal distribution with an average and standard deviation of 0.0 and 0.3 for reference.
Figure 6. Physical interaction map for genes involved in stress regulated growth control. The network map drawn using Cytoscape (SHANNON et al. 2003) shows physical interactions between the 440 proteins required for robust NSR1 repression in stress, along with TORC1 for reference. Each node shows a single protein, and each edge a single physical interaction from BioGRID (STARK et al. 2006) colored black if it represents affinity capture or reconstituted complex data; orange if it represents two-‐hybrid or protein-‐fragment complementation data; and dotted grey if it represents FRET, biochemical activity, co-‐purification, or other types of data. The center of each node is colored red if deletion of the protein causes a defect in rapamycin dependent down-‐regulation of NSR1 (log2>1)-‐-‐and the r efore act s dow n stream of TOR C 1-‐-‐and grey i f it does not. Node edges are colored maroon if the protein is the nucleus and blue if it localizes to the endomembrane system or vacuole. The green node is TORC1 and the yellow node Hht1/2. Colored regions highlight key complexes discussed in the text and listed in Tables 1-‐3. Only proteins with one or more physical interaction (250 in total) are shown in this figure. The highly connected protein chaperones Ssa1 and Ssb1, the RNA binding protein Slf1 and all genes that only connected to them are removed from the network for clarity. The Cytoscape file containing the full network, and all relevant information, is included in the supplementary materials, as File S2
TABLE LEGENDS
Table 1. Vacuolar, endomembrane and vesicle trafficking genes required for the down regulation of the Ribi gene NSR1 in stress. The top three groups of genes encode proteins highlighted in the top portion of the physical interaction network shown in Fig. 7; V-‐ATPase, EGO/VTC and CORVET/SNARE respectively. The fourth group lists other genes found in our screen encoding vacuolar, vesicle transport of endomembrane proteins. The third column (Loc) lists the

19
localization of each protein; V is vacuole, ER is endoplasmic reticulum, G is Golgi, and Endo is other parts of the Endomembrane system. The fourth column [NSR1] lists the log2 NSR1/PEX6 expression ratio from the screen. The fifth column notes if the gene acts downstream of TORC1 (has log2 >1 normalized NSR1/PEX6 ratio in rapamycin). The sixth column (Phys Net) states whether the genes is part of the physical interaction network shown in Fig. 6. Table 2. Proteins required for the downregulation of the Ribi gene NSR1 in stress that physically interact with TORC1. The third column (Loc) lists the localization of each protein; C is cytosol, M is membrane, N is nucleus. The fourth column [NSR1] lists the log2 NSR1/PEX6 expression ratio from the screen. The fifth column notes if the gene/protein acts downstream of TORC1 (has log2 >1 normalized NSR1/PEX6 ratio in rapamycin). A question mark means that the protein/gene was not analyzed in the rapamycin subscreen. Table 3. Ribosomal and nuclear genes required for the down regulation of the Ribi gene NSR1 in stress. The top three groups of genes encode proteins highlighted in the bottom portion of the physical interaction network shown in Fig. 7; VElongator, Rpd3L and Ribosome respectively. Note that three ribosomal proteins not connected to the others by physical interactions were included in the list. The fourth group lists other genes found in our screen involved in transcription and chromatin remodeling, all of which are part of the lower half of the physical interaction network in Fig. 7. The third column (Loc) lists the localization of each protein; R is ribosome, N is nuclear. The fourth column [NSR1] lists the log2 NSR1/PEX6 expression ratio from the screen. The fifth column notes if the gene acts downstream of TORC1 (has log2 >1 normalized NSR1/PEX6 ratio in rapamycin). The sixth column (Phys Net) states whether the genes is part of the physical interaction network shown in Fig. 6. ACKNOWLEDGEMENTS We would like to thank Christopher Martinez and Gabrielle Martinez for help programming and running the Biomek robot. This work was supported by the National Institutes of Health (NIH) grants 1R01GM097329 and 5T32GM008659. REFERENCES Alejandro-‐Osorio, A. L., D. J. Huebert, D. T. Porcaro, M. E. Sonntag, S.
Nillasithanukroh et al., 2009 The histone deacetylase Rpd3p is required for transient changes in genomic expression in response to stress. Genome Biol 10: R57.

20
Barbet, N. C., U. Schneider, S. B. Helliwell, I. Stansfield, M. F. Tuite et al., 1996 TOR controls translation initiation and early G1 progression in yeast. Mol Biol Cell 7: 25-‐42.
Beugnet, A., X. Wang and C. G. Proud, 2003 Target of rapamycin (TOR)-‐signaling and RAIP motifs play distinct roles in the mammalian TOR-‐dependent phosphorylation of initiation factor 4E-‐binding protein 1. J Biol Chem 278: 40717-‐40722.
Binda, M., M. P. Peli-‐Gulli, G. Bonfils, N. Panchaud, J. Urban et al., 2009 The Vam6 GEF controls TORC1 by activating the EGO complex. Mol Cell 35: 563-‐573.
Brandman, O., J. Stewart-‐Ornstein, D. Wong, A. Larson, C. C. Williams et al., 2012 A ribosome-‐bound quality control complex triggers degradation of nascent peptides and signals translation stress. Cell 151: 1042-‐1054.
Brauer, M. J., C. Huttenhower, E. M. Airoldi, R. Rosenstein, J. C. Matese et al., 2008 Coordination of growth rate, cell cycle, stress response, and metabolic activity in yeast. Mol Biol Cell 19: 352-‐367.
Broach, J. R., 2012 Nutritional control of growth and development in yeast. Genetics 192: 73-‐105.
Capaldi, A. P., 2010 Analysis of gene function using DNA microarrays. Methods Enzymol 470: 3-‐17.
Cardenas, M. E., N. S. Cutler, M. C. Lorenz, C. J. Di Como and J. Heitman, 1999 The TOR signaling cascade regulates gene expression in response to nutrients. Genes Dev 13: 3271-‐3279.
Carrozza, M. J., L. Florens, S. K. Swanson, W. J. Shia, S. Anderson et al., 2005a Stable incorporation of sequence specific repressors Ash1 and Ume6 into the Rpd3L complex. Biochim Biophys Acta 1731: 77-‐87; discussion 75-‐76.
Carrozza, M. J., B. Li, L. Florens, T. Suganuma, S. K. Swanson et al., 2005b Histone H3 methylation by Set2 directs deacetylation of coding regions by Rpd3S to suppress spurious intragenic transcription. Cell 123: 581-‐592.
Duvel, K., A. Santhanam, S. Garrett, L. Schneper and J. R. Broach, 2003 Multiple roles of Tap42 in mediating rapamycin-‐induced transcriptional changes in yeast. Mol Cell 11: 1467-‐1478.
Gasch, A. P., P. T. Spellman, C. M. Kao, O. Carmel-‐Harel, M. B. Eisen et al., 2000 Genomic expression programs in the response of yeast cells to environmental changes. Mol Biol Cell 11: 4241-‐4257.
Giaever, G., A. M. Chu, L. Ni, C. Connelly, L. Riles et al., 2002 Functional profiling of the Saccharomyces cerevisiae genome. Nature 418: 387-‐391.
Giaever, G., and C. Nislow, 2014 The yeast deletion collection: a decade of functional genomics. Genetics 197: 451-‐465.
Hara, K., K. Yonezawa, Q. P. Weng, M. T. Kozlowski, C. Belham et al., 1998 Amino acid sufficiency and mTOR regulate p70 S6 kinase and eIF-‐4E BP1 through a common effector mechanism. J Biol Chem 273: 14484-‐14494.
Heitman, J., N. R. Movva and M. N. Hall, 1991 Targets for cell cycle arrest by the immunosuppressant rapamycin in yeast. Science 253: 905-‐909.
Hsu, P. P., S. A. Kang, J. Rameseder, Y. Zhang, K. A. Ottina et al., 2011 The mTOR-‐regulated phosphoproteome reveals a mechanism of mTORC1-‐mediated inhibition of growth factor signaling. Science 332: 1317-‐1322.
Huang, S., and E. K. O'Shea, 2005 A systematic high-‐throughput screen of a yeast deletion collection for mutants defective in PHO5 regulation. Genetics 169: 1859-‐1871.

21
Huber, A., B. Bodenmiller, A. Uotila, M. Stahl, S. Wanka et al., 2009 Characterization of the rapamycin-‐sensitive phosphoproteome reveals that Sch9 is a central coordinator of protein synthesis. Genes Dev 23: 1929-‐1943.
Huber, A., S. L. French, H. Tekotte, S. Yerlikaya, M. Stahl et al., 2011 Sch9 regulates ribosome biogenesis via Stb3, Dot6 and Tod6 and the histone deacetylase complex RPD3L. EMBO J 30: 3052-‐3064.
Hughes Hallett, J. E., X. Luo and A. P. Capaldi, 2014 State transitions in the TORC1 signaling pathway and information processing in Saccharomyces cerevisiae. Genetics 198: 773-‐786.
Hughes, T. R., C. J. Roberts, H. Dai, A. R. Jones, M. R. Meyer et al., 2000 Widespread aneuploidy revealed by DNA microarray expression profiling. Nat Genet 25: 333-‐337.
Humphrey, E. L., A. F. Shamji, B. E. Bernstein and S. L. Schreiber, 2004 Rpd3p relocation mediates a transcriptional response to rapamycin in yeast. Chem Biol 11: 295-‐299.
Jonikas, M. C., S. R. Collins, V. Denic, E. Oh, E. M. Quan et al., 2009 Comprehensive characterization of genes required for protein folding in the endoplasmic reticulum. Science 323: 1693-‐1697.
Jorgensen, P., I. Rupes, J. R. Sharom, L. Schneper, J. R. Broach et al., 2004 A dynamic transcriptional network communicates growth potential to ribosome synthesis and critical cell size. Genes Dev 18: 2491-‐2505.
Kim, D. H., D. D. Sarbassov, S. M. Ali, J. E. King, R. R. Latek et al., 2002 mTOR interacts with raptor to form a nutrient-‐sensitive complex that signals to the cell growth machinery. Cell 110: 163-‐175.
Kim, E., P. Goraksha-‐Hicks, L. Li, T. P. Neufeld and K. L. Guan, 2008 Regulation of TORC1 by Rag GTPases in nutrient response. Nat Cell Biol 10: 935-‐945.
Laplante, M., and D. M. Sabatini, 2012 mTOR signaling in growth control and disease. Cell 149: 274-‐293.
Lee, J., R. D. Moir and I. M. Willis, 2009 Regulation of RNA polymerase III transcription involves SCH9-‐dependent and SCH9-‐independent branches of the target of rapamycin (TOR) pathway. J Biol Chem 284: 12604-‐12608.
Lee, M. V., S. E. Topper, S. L. Hubler, J. Hose, C. D. Wenger et al., 2011 A dynamic model of proteome changes reveals new roles for transcript alteration in yeast. Mol Syst Biol 7: 514.
Lempiainen, H., A. Uotila, J. Urban, I. Dohnal, G. Ammerer et al., 2009 Sfp1 interaction with TORC1 and Mrs6 reveals feedback regulation on TOR signaling. Mol Cell 33: 704-‐716.
Liko, D., M. G. Slattery and W. Heideman, 2007 Stb3 binds to ribosomal RNA processing element motifs that control transcriptional responses to growth in Saccharomyces cerevisiae. J Biol Chem 282: 26623-‐26628.
Lippman, S. I., and J. R. Broach, 2009 Protein kinase A and TORC1 activate genes for ribosomal biogenesis by inactivating repressors encoded by Dot6 and its homolog Tod6. Proc Natl Acad Sci U S A 106: 19928-‐19933.
Loewith, R., and M. N. Hall, 2011 Target of rapamycin (TOR) in nutrient signaling and growth control. Genetics 189: 1177-‐1201.
Loewith, R., E. Jacinto, S. Wullschleger, A. Lorberg, J. L. Crespo et al., 2002 Two TOR complexes, only one of which is rapamycin sensitive, have distinct roles in cell growth control. Mol Cell 10: 457-‐468.

22
Marion, R. M., A. Regev, E. Segal, Y. Barash, D. Koller et al., 2004 Sfp1 is a stress-‐ and nutrient-‐sensitive regulator of ribosomal protein gene expression. Proc Natl Acad Sci U S A 101: 14315-‐14322.
Martin, D. E., A. Soulard and M. N. Hall, 2004 TOR regulates ribosomal protein gene expression via PKA and the Forkhead transcription factor FHL1. Cell 119: 969-‐979.
Neklesa, T. K., and R. W. Davis, 2009 A genome-‐wide screen for regulators of TORC1 in response to amino acid starvation reveals a conserved Npr2/3 complex. PLoS Genet 5: e1000515.
Panchaud, N., M. P. Peli-‐Gulli and C. De Virgilio, 2013 Amino acid deprivation inhibits TORC1 through a GTPase-‐activating protein complex for the Rag family GTPase Gtr1. Sci Signal 6: ra42.
Powers, T., and P. Walter, 1999 Regulation of ribosome biogenesis by the rapamycin-‐sensitive TOR-‐signaling pathway in Saccharomyces cerevisiae. Mol Biol Cell 10: 987-‐1000.
Reinke, A., S. Anderson, J. M. McCaffery, J. Yates, 3rd, S. Aronova et al., 2004 TOR complex 1 includes a novel component, Tco89p (YPL180w), and cooperates with Ssd1p to maintain cellular integrity in Saccharomyces cerevisiae. J Biol Chem 279: 14752-‐14762.
Sancak, Y., T. R. Peterson, Y. D. Shaul, R. A. Lindquist, C. C. Thoreen et al., 2008 The Rag GTPases bind raptor and mediate amino acid signaling to mTORC1. Science 320: 1496-‐1501.
Schawalder, S. B., M. Kabani, I. Howald, U. Choudhury, M. Werner et al., 2004 Growth-‐regulated recruitment of the essential yeast ribosomal protein gene activator Ifh1. Nature 432: 1058-‐1061.
Schimmoller, F., and H. Riezman, 1993 Involvement of Ypt7p, a small GTPase, in traffic from late endosome to the vacuole in yeast. J Cell Sci 106 ( Pt 3): 823-‐830.
Shannon, P., A. Markiel, O. Ozier, N. S. Baliga, J. T. Wang et al., 2003 Cytoscape: a software environment for integrated models of biomolecular interaction networks. Genome Res 13: 2498-‐2504.
Slattery, M. G., D. Liko and W. Heideman, 2008 Protein kinase A, TOR, and glucose transport control the response to nutrient repletion in Saccharomyces cerevisiae. Eukaryot Cell 7: 358-‐367.
Soulard, A., A. Cremonesi, S. Moes, F. Schutz, P. Jeno et al., 2010 The rapamycin-‐sensitive phosphoproteome reveals that TOR controls protein kinase A toward some but not all substrates. Mol Biol Cell 21: 3475-‐3486.
Stark, C., B. J. Breitkreutz, T. Reguly, L. Boucher, A. Breitkreutz et al., 2006 BioGRID: a general repository for interaction datasets. Nucleic Acids Res 34: D535-‐539.
Takahara, T., and T. Maeda, 2012 Transient sequestration of TORC1 into stress granules during heat stress. Mol Cell 47: 242-‐252.
Teng, X., M. Dayhoff-‐Brannigan, W. C. Cheng, C. E. Gilbert, C. N. Sing et al., 2013 Genome-‐wide consequences of deleting any single gene. Mol Cell 52: 485-‐494.
Upadhya, R., J. Lee and I. M. Willis, 2002 Maf1 is an essential mediator of diverse signals that repress RNA polymerase III transcription. Mol Cell 10: 1489-‐1494.

23
Urban, J., A. Soulard, A. Huber, S. Lippman, D. Mukhopadhyay et al., 2007 Sch9 is a major target of TORC1 in Saccharomyces cerevisiae. Mol Cell 26: 663-‐674.
Wade, J. T., D. B. Hall and K. Struhl, 2004 The transcription factor Ifh1 is a key regulator of yeast ribosomal protein genes. Nature 432: 1054-‐1058.
Wang, S., Z. Y. Tsun, R. L. Wolfson, K. Shen, G. A. Wyant et al., 2015 Metabolism. Lysosomal amino acid transporter SLC38A9 signals arginine sufficiency to mTORC1. Science 347: 188-‐194.
Winzeler, E. A., D. D. Shoemaker, A. Astromoff, H. Liang, K. Anderson et al., 1999 Functional characterization of the S. cerevisiae genome by gene deletion and parallel analysis. Science 285: 901-‐906.
Worley, J., X. Luo and A. P. Capaldi, 2013 Inositol pyrophosphates regulate cell growth and the environmental stress response by activating the HDAC Rpd3L. Cell Rep 3: 1476-‐1482.
Yan, G., Y. Lai and Y. Jiang, 2012 The TOR complex 1 is a direct target of Rho1 GTPase. Mol Cell 45: 743-‐753.
Yan, G., X. Shen and Y. Jiang, 2006 Rapamycin activates Tap42-‐associated phosphatases by abrogating their association with Tor complex 1. EMBO J 25: 3546-‐3555.
Zoncu, R., L. Bar-‐Peled, A. Efeyan, S. Wang, Y. Sancak et al., 2011 mTORC1 senses lysosomal amino acids through an inside-‐out mechanism that requires the vacuolar H(+)-‐ATPase. Science 334: 678-‐683.
Zurita-‐Martinez, S. A., and M. E. Cardenas, 2005 Tor and cyclic AMP-‐protein kinase A: two parallel pathways regulating expression of genes required for cell growth. Eukaryot Cell 4: 63-‐71.
Zurita-‐Martinez, S. A., R. Puria, X. Pan, J. D. Boeke and M. E. Cardenas, 2007 Efficient Tor signaling requires a functional class C Vps protein complex in Saccharomyces cerevisiae. Genetics 176: 2139-‐2150.
YEPD
YEPD+KCl
RNAse PrecipitationSolution
Lysis Buffer/Glass beads
Magnetic Beads
RNA
Grow Cells
Stress Cells
Fix Cells
Lyse Cells
Isolate RNA
qRT PCR
ent4Δ
NSR1
PEX6
0.4
0.3
0.2
0.1
0.0Fluo
resc
ence
(AU
)
30252015105
Cycle Number
dep1Δ
NSR1PEX6
0.4
0.3
0.2
0.1
0.0Fluo
resc
ence
(AU
)
30252015105
Cycle Number
A
B
C
Fig. 1S
tep
1S
tep
2S
tep
3

10
8
6
4
2
0
Num
ber o
f Wel
ls
43210-1-2
Log2 Normalized RNA Concentration [NSR1/PEX6]
Fig. 2
450
400
350
300
250
200
150
100
50
0
43210-1-2
Num
ber o
f Stra
ins
Log2 Normalized RNA Concentration [NSR1/PEX6]
Log2 [NSR1/PEX6], Measurement 2
Log 2
[N
SR
1/P
EX
6], M
easu
rem
ent 1
A
B
Fig. 3
4
3
2
1
0
-1
43210-1-2
5
4
3
2
1
0
-1
-2
Expression in lab strain: DNA microarrayExpression in YKO strain: Automated screen
wt
dep1
Δ /w
trp
d3Δ
/wt
sds3
Δ /w
tsa
p30Δ
/wt
rxt2
Δ /w
tph
o23Δ
/wt
ume1
Δ /w
tct
i6Δ
/wt
rxt3
Δ /w
t
ume6
Δ /w
trc
o1Δ
/wt
eaf3
Δ/w
t
ash1
Δ /w
t
sin3
Δ /w
t
Log 2
NS
R1
Exp
ress
ion
in K
Cl (
mut
ant/w
t)
0.4M KCl StressA
B
Fig. 4
dep1
Δrp
d3Δ
sds3
Δsa
p30Δ
rxt2
Δph
o23Δ
ume1
Δct
i6Δ
rxt3
Δ
ume6
Δ
rco1
Δ
eaf3
Δ
ash1
Δ
sin3
Δ
Log2 Expression-3 30

80
60
40
20
0
43210-1-2
80
60
40
20
0
80
60
40
20
0
Num
ber o
f Stra
ins
Log2 Normalized RNA Concentration [NSR1/PEX6]
Num
ber o
f Stra
ins
Num
ber o
f Stra
ins
Control Strains
Control Strains
Control Strains
KCl Stress
Mock Stress
Rapamycin
Fig. 5

Elongator
Rpd3LComplex
CORVET/SNARE
Ribosome
V-ATPase
EGO/VTC
Fig. 6

Table 1
Name Description Loc [NSR1] Down TOR Phys Net
VMA1 Subunit A of the V1 peripheral membrane domain of V-ATPase V 2.2 NO YES VMA2 Subunit B of V1 peripheral membrane domain of vacuolar H+-ATPase V 2.3 YES YES VMA3 Proteolipid subunit c of the V0 domain of vacuolar H(+)-ATPase V 1.9 NO YES VMA5 Subunit C of the V1 peripheral membrane domain of V-ATPase V 2.2 NO YES VMA6 Subunit d of the V0 integral membrane domain of V-ATPase V 2.1 NO YES VMA8 Subunit D of the V1 peripheral membrane domain of V-ATPase V 2.1 NO YES VMA11 Vacuolar ATPase V0 domain subunit c' V 1.5 NO YES VMA16 Subunit c'' of the vacuolar ATPase V 1.9 NO YES VMA21 Integral membrane protein required for V-ATPase function ER 1.5 NO YES VMA22 Protein that is required for vacuolar H+-ATPase (V-ATPase) function ER 1.9 NO YES PKR1 V-ATPase assembly factor ER 1.9 NO YES
SLM4 Component of the EGO and GSE complexes V 3.7 NO YES MEH1 Component of the EGO and GSE complexes V 1.5 NO YES VTC1 Subunit of the vacuolar transporter chaperone (VTC) complex ER/V 1.4 NO YES VTC4 Vacuolar membrane polyphosphate polymerase ER/V 2.3 NO YES GAP1 General amino acid permease V 1.9 NO YES
SYN8 Endosomal SNARE related to mammalian syntaxin 8
1.8 NO YES VAM3 Syntaxin-like vacuolar t-SNARE V 2.6 NO YES VAM7 Vacuolar SNARE protein V 2.4 NO YES YPT7 Rab family GTPase V 2.5 YES YES PEP5 Histone E3 ligase, component of CORVET membrane tethering complex V 1.9 NO YES
RCR1 Involved in chitin deposition; may function in endosomal-vacuolar trafficking ER 2.0 NO NO YOP1 Membrane protein that interacts with Yip1p to mediate membrane traffic ER 1.7 NO YES GYP5 GTPase-activating protein (GAP) for yeast Rab family members G 1.8 NO YES RGP1 Subunit of a Golgi membrane exchange factor (Ric1p-Rgp1p) G 1.4 NO NO SYS1 Integral membrane protein of the Golgi G 1.8 NO YES TVP15 Integral membrane protein; localized to late Golgi vesicles G 1.8 NO YES TVP38 Integral membrane protein; localized to late Golgi vesicles G 1.9 NO YES VPS52 Component of the GARP (Golgi-associated retrograde protein) complex G 1.3 NO NO YIP5 Protein that interacts with Rab GTPases; localized to late Golgi vesicles G 1.6 NO YES EMP70 Endosome-to-vacuole sorting V 1.6 NO YES SNX4 Sorting nexin; involved in the retrieval of late-Golgi SNAREs Endo 2.0 NO YES SNX41 Sorting nexin; involved in the retrieval of late-Golgi SNAREs Endo 2.0 NO YES VFA1 Protein that interacts with Vps4p and has a role in vacuolar sorting Endo 1.8 NO YES VPS5 Nexin-1 homolog; moves proteins from endosomal compartment to Golgi Endo 1.7 NO YES PFA3 Palmitoyltransferase for Vac8p V 2.4 NO YES VAC8 Phosphorylated and palmitoylated vacuolar membrane protein V 2.9 NO YES LST4 Protein possibly involved in a post-Golgi secretory pathway
2.7 YES NO
EDE1 Scaffold protein involved in the formation of early endocytic sites
1.6 NO YES ENT2 Epsin-like protein required for endocytosis and actin patch assembly
1.8 NO YES
KIN2 Serine/threonine protein kinase involved in regulation of exocytosis
1.7 ? YES VAB2 Subunit of the BLOC-1 complex involved in endosomal maturation
2.4 ? YES
MDR1 Cytoplasmic GTPase-activating protein; regulation of Golgi secretory function 2.4 NO NO APL4 Gamma-adaptin Endo 1.8 NO YES APM1 Mu1-like medium subunit of the AP-1 complex G 1.8 NO YES CHC1 Clathrin heavy chain
1.5 ? YES
DYN1 Cytoplasmic heavy chain dynein
1.7 ? YES
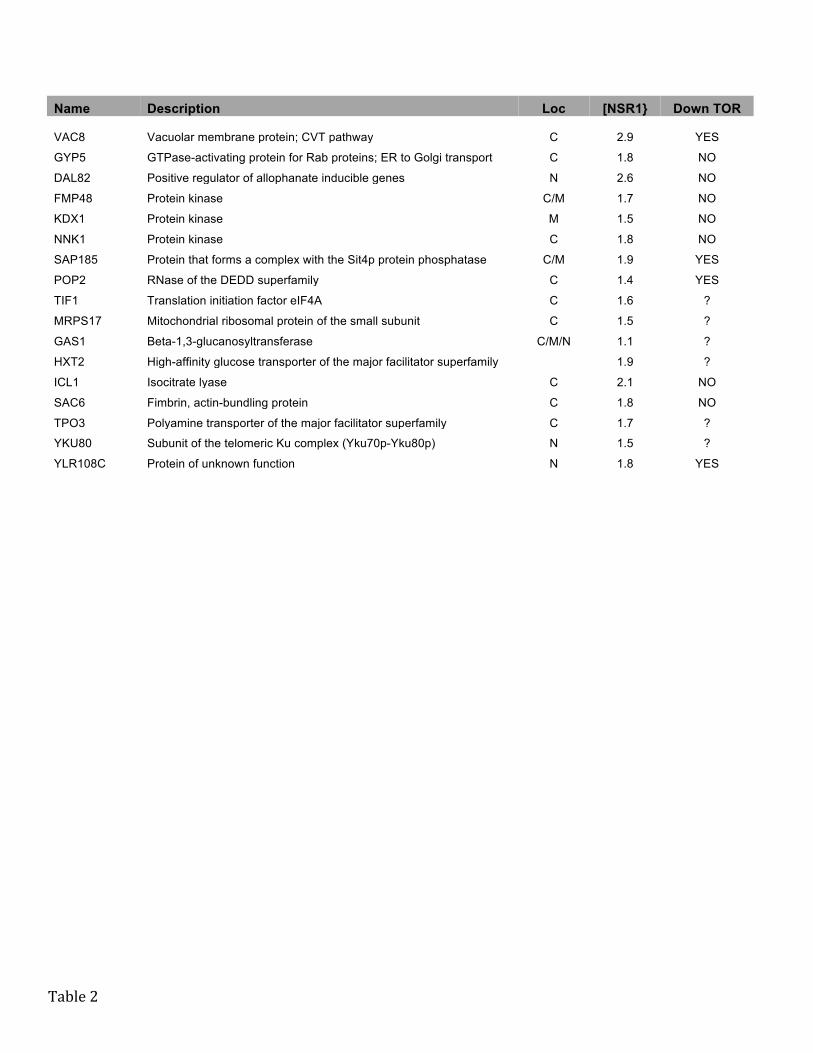
Table 2
Name Description Loc [NSR1} Down TOR VAC8 Vacuolar membrane protein; CVT pathway C 2.9 YES
GYP5 GTPase-activating protein for Rab proteins; ER to Golgi transport C 1.8 NO
DAL82 Positive regulator of allophanate inducible genes N 2.6 NO
FMP48 Protein kinase C/M 1.7 NO
KDX1 Protein kinase M 1.5 NO
NNK1 Protein kinase C 1.8 NO
SAP185 Protein that forms a complex with the Sit4p protein phosphatase C/M 1.9 YES
POP2 RNase of the DEDD superfamily C 1.4 YES
TIF1 Translation initiation factor eIF4A C 1.6 ?
MRPS17 Mitochondrial ribosomal protein of the small subunit C 1.5 ?
GAS1 Beta-1,3-glucanosyltransferase C/M/N 1.1 ?
HXT2 High-affinity glucose transporter of the major facilitator superfamily
1.9 ?
ICL1 Isocitrate lyase C 2.1 NO
SAC6 Fimbrin, actin-bundling protein C 1.8 NO
TPO3 Polyamine transporter of the major facilitator superfamily C 1.7 ?
YKU80 Subunit of the telomeric Ku complex (Yku70p-Yku80p) N 1.5 ?
YLR108C Protein of unknown function N 1.8 YES

Name Description Loc [NSR1] Down TOR Ph Net ELP3 Subunit of Elongator complex N 2.8 YES YES ELP6 Subunit of Elongator complex
1.8 YES YES
IKI3 Subunit of Elongator complex N 1.8 YES YES VHS1 Cytoplasmic serine/threonine protein kinase
2.5 NO YES
RPD3 Histone deacetylase, component of Rpd3S and Rpd3L N 2.1 NO YES SIN3 Component of Rpd3S and Rpd3L N 2.6 YES YES PHO23 Component of Rpd3L N 2.4 YES YES SAP30 Component of Rpd3L N 2.2 YES YES DEP1 Component of the Rpd3L N 2.6 YES YES RXT2 Component of Rpd3L N 2.4 YES YES HOS1 Class I histone deacetylase N 1.9 NO YES STB4 Putative transcription factor N 2.4 NO YES
RPS6A Protein component of the small (40S) ribosomal subunit R 2.4 YES YES RPS7B Protein component of the small (40S) ribosomal subunit R 1.4 YES YES RPS9A Protein component of the small (40S) ribosomal subunit R 1.9 NO YES RPS22A Protein component of the small (40S) ribosomal subunit R 1.4 NO YES RPS17A Protein component of the small (40S) ribosomal subunit R 2.4 YES YES RPL2B Ribosomal 60S subunit protein L2B R 1.3 NO YES RPL6A Ribosomal 60S subunit protein L6A R 2.1 NO YES RPL6B Ribosomal 60S subunit protein L6B R 2.6 YES YES RPL7A Ribosomal 60S subunit protein L7A R 2.1 NO YES RPL13A Ribosomal 60S subunit protein L13A R 1.8 NO YES RPL16B Ribosomal 60S subunit protein L16B R 1.8 NO YES RPL22A Ribosomal 60S subunit protein L22A R 1.9 NO YES RPL24A Ribosomal 60S subunit protein L24A R 2.0 YES YES SSZ1 Hsp70 protein that interacts with Zuo1p (a DnaJ homolog)
2.0 YES YES
ZUO1 Ribosome-‐associated chaperone R/N 1.9 YES YES NOP12 Nucleolar protein involved in pre-‐25S rRNA processing N 2.1 NO YES RQC1 Component of the ribosome quality control complex (RQC) R 2.0 NO YES RPL38 Ribosomal 60S subunit protein L38 R 2.0 YES NO RPL43B Ribosomal 60S subunit protein L43B R 1.6 NO NO RPS27A Protein component of the small (40S) ribosomal subunit R 2.1 NO NO
CLU1 Subunit of the eukaryotic translation initiation factor 3 (eIF3) 2.3 YES YES EFT1 Elongation factor 2 (EF-‐2), also encoded by EFT2 R 1.6 NO YES TIF1 Translation initiation factor eIF4A R 1.6 NO YES YGR054W Eukaryotic initiation factor (eIF) 2A R 2.2 NO YES CAF20 Phosphoprotein of the mRNA cap-‐binding complex
2.0 NO YES
ASK10 Component of RNA polymerase II holoenzyme N 2.4 NO YES CAF130 Subunit of the CCR4-‐NOT transcriptional regulatory complex
1.6 NO YES
ELA1 Elongin A; Required for Pol II degredation N 2.6 NO YES ELC1 Elongin C; Required for Pol II degredation N 1.5 NO YES PGD1 Subunit of the RNA polymerase II mediator complex N 2.0 NO YES NUT1 Component of the RNA polymerase II mediator complex N 1.7 NO YES GIS1 Histone demethylase and transcription factor N 1.7 NO YES HIR2 Subunit of HIR nucleosome assembly complex N 2.0 NO YES HIR3 Subunit of the HIR complex N 2.5 NO YES HPA2 Tetrameric histone acetyltransferase
1.9 NO YES
HTA1 Histone H2A N 2.4 YES YES IES4 Component of the INO80 chromatin remodeling complex N 1.8 YES YES ITC1 Subunit of Isw2p-‐Itc1p chromatin remodeling complex N 1.6 NO YES DPB4 Subunit of ISW2 chromatin accessibility complex N 2.0 NO YES JHD2 JmjC domain family histone demethylase N 2.2 YES YES RLF2 Largest subunit (p90) of the Chromatin Assembly Complex (CAF-‐1) N 2.5 YES YES SAS5 Subunit of the SAS complex (Sas2p, Sas4p, Sas5p) N 2.2 NO YES SWI3 Subunit of the SWI/SNF chromatin remodeling complex N 2.5 YES YES
Table 3