genomic insights into the conservation status of the
TRANSCRIPT
ARTICLE
Genomic insights into the conservation status ofthe world’s last remaining Sumatran rhinocerospopulationsJohanna von Seth 1,2,3,21✉, Nicolas Dussex 1,2,3,21✉, David Díez-del-Molino 1,2,3, Tom van der Valk 1,2,4,
Verena E. Kutschera 5, Marcin Kierczak 6, Cynthia C. Steiner 7, Shanlin Liu8, M. Thomas P. Gilbert 8,9,
Mikkel-Holger S. Sinding 8,10, Stefan Prost 11,12, Katerina Guschanski 4,13, Senthilvel K. S. S. Nathan14,
Selina Brace 15, Yvonne L. Chan1,2, Christopher W. Wheat3, Pontus Skoglund16, Oliver A. Ryder7,
Benoit Goossens14,17,18,19, Anders Götherström1,20 & Love Dalén 1,2,3✉
Small populations are often exposed to high inbreeding and mutational load that can increase
the risk of extinction. The Sumatran rhinoceros was widespread in Southeast Asia, but is now
restricted to small and isolated populations on Sumatra and Borneo, and most likely extinct
on the Malay Peninsula. Here, we analyse 5 historical and 16 modern genomes from these
populations to investigate the genomic consequences of the recent decline, such as increased
inbreeding and mutational load. We find that the Malay Peninsula population experienced
increased inbreeding shortly before extirpation, which possibly was accompanied by purging.
The populations on Sumatra and Borneo instead show low inbreeding, but high mutational
load. The currently small population sizes may thus in the near future lead to inbreeding
depression. Moreover, we find little evidence for differences in local adaptation among
populations, suggesting that future inbreeding depression could potentially be mitigated by
assisted gene flow among populations.
https://doi.org/10.1038/s41467-021-22386-8 OPEN
1 Centre for Palaeogenetics, Stockholm, Sweden. 2 Department of Bioinformatics and Genetics, Swedish Museum of Natural History, Stockholm, Sweden.3 Department of Zoology, Stockholm University, Stockholm, Sweden. 4Department of Ecology and Genetics, Animal Ecology, Uppsala University,Uppsala, Sweden. 5 Department of Biochemistry and Biophysics, National Bioinformatics Infrastructure Sweden, Science for Life Laboratory, StockholmUniversity, Solna, Sweden. 6Department of Cell and Molecular Biology, National Bioinformatics Infrastructure Sweden, Science for Life Laboratory, UppsalaUniversity, Uppsala, Sweden. 7 San Diego Zoo Wildlife Alliance, Beckman Center for Conservation Research, Escondido, CA, USA. 8 The GLOBE Institute,University of Copenhagen, Copenhagen, Denmark. 9 Norwegian University of Science and Technology, University Museum, Trondheim, Norway. 10 SmurfitInstitute of Genetics, Trinity College Dublin, Dublin, Ireland. 11 LOEWE-Centre for Translational Biodiversity Genomics, Senckenberg, Frankfurt, Germany.12 South African National Biodiversity Institute, National Zoological Garden, Pretoria, South Africa. 13 Institute of Evolutionary Biology, School of BiologicalSciences, University of Edinburgh, Edinburgh, UK. 14 Sabah Wildlife Department, Kota Kinabalu, Sabah, Malaysia. 15 Department of Earth Sciences, NaturalHistory Museum, London, UK. 16 Francis Crick Institute, London, UK. 17 Organisms and Environment Division, Cardiff School of Biosciences, Cardiff, UK.18 Sustainable Places Research Institute, Cardiff University, Cardiff, UK. 19 Danau Girang Field Centre, c/o Sabah Wildlife Department, Kota Kinabalu, Sabah,Malaysia. 20Department of Archaeology and Classical Studies, Stockholm University, Stockholm, Sweden. 21These authors contributed equally: Johanna vonSeth, Nicolas Dussex. ✉email: [email protected]; [email protected]; [email protected]
NATURE COMMUNICATIONS | (2021) 12:2393 | https://doi.org/10.1038/s41467-021-22386-8 | www.nature.com/naturecommunications 1
1234
5678
90():,;
Small and fragmented populations are vulnerable to severalextrinsic and intrinsic threats, such as environmental effects(e.g., disease, habitat destruction), demographic stochasti-
city and detrimental genetic effects1. Over the past few decades,the role of genetic factors in the long-term viability of smallpopulations has gained considerable attention2,3. A growing bodyof empirical studies on critically endangered species4,5 indicatesthat small populations are often exposed to genomic erosion,which reduces species viability via loss of genetic diversity,increase in inbreeding and in genetic load (i.e., decrease inaverage individual fitness relative to the fittest genotype due todeleterious mutations) through genetic drift6–8.
The magnitude of these processes can vary among populationsand species due to their different demographic histories (e.g.,population fluctuations and founder effects), sensitivity toenvironmental changes or life-history traits. Moreover, popula-tion fitness and viability will also vary depending on the pro-portion of rare large-effect deleterious alleles and numeroussmall-effect deleterious alleles among the founding individuals ofthese populations9. Predicting the degree of genomic erosion thatthreatened populations are exposed to is thus challenging, but hasimportant implications for conservation, since quantifying levelsof inbreeding and genetic load is crucial for developing man-agement strategies aimed at mitigating the effects of genomicerosion9.
Genetic data can, for instance, help define management units10,contribute to breeding programmes by estimating relatednessamong individuals and help identify the individuals most likely tolead to genetic rescue in translocation programmes11. Enhancinggene flow is considered a powerful conservation tool for reducinggenomic erosion in a range of threatened species, because it canreduce the expression of recessive or partially-recessive deleter-ious alleles in hybrids of the receiving population11,12. There isempirical evidence for genetic rescue resulting in increased fit-ness, population growth, and increased heterozygosity in the firsttwo or three hybrid generations13–16. Furthermore, while geno-mic data on the long-term effects of gene flow are currentlylimited, hybrid vigour can persist at least beyond the F3 gen-eration and as far as the F16 generation17–20.
Populations that have evolved in isolation for thousands ofgenerations may show evidence for positive selection and distinctallelic frequencies for genes under strong directional selection,which could indicate local adaptation21. Thus, assisted gene flowamong long-term isolated populations represents a risk of dis-rupting locally adapted gene complexes, a process referred to asoutbreeding depression3,6. Previous work has highlighted factorslikely to affect the risk of outbreeding depression, where adaptivedifferentiation has been identified as one of the major riskfactors22. Indeed, concerns over potential disruption of localadaptation has been one of the main reasons why assisted geneflow has only rarely been used in conservation biology(~34 studies19).
While populations can become locally adapted23, they may alsoaccumulate different levels of genetic load, and potentially carryprivate deleterious mutations that affect different genes. Conse-quently, gene flow from outbred populations into isolatedpopulations could increase the genetic load of recipient popula-tions and elevate their risk of extinction24,25. This is especiallylikely if the recipient population has purged a portion of itsgenetic load but remains small and inbred for several generations.Such a population will be vulnerable to the expression of dele-terious alleles in homozygous state, and the effects of newlyintroduced deleterious alleles may not become apparent untilseveral generations later24,26. In such situations, it could thus bepreferable to avoid genetic rescue attempts or to select individualswith a lower genetic load from partially-inbred sources24,25.
However, some have criticised this approach and argue that thebenefits of genetic rescue (i.e., hybrid vigour and maintenance ofadaptive potential) by far outweigh the risks of increase in geneticload27. It is therefore essential to weigh the positive and negativeeffects of this alternative approach when assessing the need forgenetic rescue27.
Recent advances in genomics have allowed the detection ofgenomic regions affected by natural selection and can also helpidentify genetic threats such as elevated inbreeding and geneticload in natural populations28. However, estimating genetic load ischallenging without information on the fitness effects of dele-terious mutations. An alternative approach is to estimate changesin mutational load (i.e., number of deleterious mutations), and touse it as a proxy for individual and population fitness. Deter-mining individual inbreeding levels as well as mutational load canthus potentially be used to identify individuals particularly wellsuited for assisted gene flow.
The Sumatran rhinoceros (Dicerorhinus sumatrensis) is abrowser that inhabits the rainforest of Southeast (SE) Asia and iscurrently listed as critically endangered by the InternationalUnion for Conservation of Nature (IUCN)29. Mitogenomic andgenome-wide data indicate that periods of sea-level rise duringthe Pleistocene led to repeated isolation among populations30,31.A recent study using complete mitochondrial genomes estimatedthe divergence of the three main Sumatran rhinoceros popula-tions at ~360 ka BP31 and additional substructure within the threemain populations are roughly coinciding with the Toba super-eruption some 71 ka BP32, which may have restricted Sumatranrhinoceros populations to refugia after the eruption. At the end ofthe last glaciation, the species experienced a severe decline ineffective population size (Ne), which may have eroded a largeportion of its ancestral genetic diversity30.
Sumatran rhinoceroses were until recently widespread in SEAsia, from as far as the foothills of the Himalayas or Assam downto the islands of Sumatra and Borneo33,34. It has been estimatedthat the census population size has decreased by ~70% over thepast 20 years as a result of poaching and habitat change, butpopulation declines had already been reported in 193931,34–37.However, it is difficult to obtain accurate estimates of the his-torical and contemporary population sizes since Sumatran rhi-noceroses are solitary and live in dense rainforests. As of 2019, thespecies likely numbers fewer than 100 individuals and only small,fragmented populations survive on Sumatra (D. s. sumatrensis)and Borneo (D. s. harrissoni), whereas the Malay Peninsula (D. s.sumatrensis) population is most likely extinct38,39. Moreover, thespecies’ low breeding rate, in the wild due to low populationdensity and due to female reproductive pathologies in captivity,makes it one of the most endangered rhinoceros species in theworld40. On Borneo, the situation is especially dire since only onefemale survives in captivity and < 10 wild individuals remain inEast Kalimantan41.
Consistent with the historical demographic decline since the1930s, corresponding to approximately seven generations, theSumatran rhinoceros is thought to have experienced a loss ofgenetic diversity both in the wild and in captivity35,36. Conse-quently, the remaining populations may be exposed to intrinsicgenetic threats such as reduced adaptive potential and inbreedingdepression, which could accelerate its decline2,3.
With fewer than 100 individuals remaining, there have beenrecent proposals to manage the species as a single unit and toincrease gene flow by translocation or exchange of gametes fromdifferent populations40. However, the differentiation of thesethree genetic lineages possibly indicates a risk for outbreedingdepression as a result of mixing populations, which implies thatthere may be a need to treat Sumatran rhinoceros subspecies asdifferent conservation units (e.g., Steiner et al.31). The risks of
ARTICLE NATURE COMMUNICATIONS | https://doi.org/10.1038/s41467-021-22386-8
2 NATURE COMMUNICATIONS | (2021) 12:2393 | https://doi.org/10.1038/s41467-021-22386-8 | www.nature.com/naturecommunications
outbreeding depression may be outweighed by the risk ofextinction due to inbreeding, demographic stochasticity, orenvironmental effects such as disease31, but concerns aboutoutbreeding depression and the introduction of new deleteriousalleles have not yet been addressed31,35,36. Thus, from a geneticperspective, the management of the remaining Sumatran rhino-ceros populations represents a conundrum to conservation biol-ogists, where the risks (i.e., introduction of maladapted ordeleterious alleles) have to be weighed against the benefits (i.e.,increase of population fitness via genetic rescue).
Here, we aim to gain insights into the effects of populationdecline on the genetic conservation status of Sumatran rhinocerosby examining five historical and 16 modern whole-genomes fromthe two remaining populations on Sumatra and Borneo, and themost likely extinct population on the Malay Peninsula. We firstinvestigate the population structure, past demography and timingof divergence among these three populations. Second, we estimatedifferences in genomic diversity and mutational load among thethree populations, as well as temporal changes within two of thepopulations (Borneo and Malay Peninsula) using museum sam-ples up to 140 years old. Finally, to evaluate the potential risksassociated with assisted gene flow among modern populations, weexamine the extent of private mutational load within eachpopulation, and whether signatures of positive selection, poten-tially associated with local adaptation, differ among thepopulations.
ResultsPopulation structure and demographic history. In order toestimate genomic diversity and mutational load in modern andhistorical populations, we mapped paired-end data from 18 re-sequenced genomes (four historical and 14 modern) Sumatranrhinoceros specimens from Sumatra, Borneo and the MalayPeninsula to a de novo assembly reference genome for Sumatranrhinoceros (Supplementary Table 1, Genbank: GCA_014189135.1.Genome coverage ranged from 9X to 29X (mean: 19X; Supple-mentary Table 2; see ‘Methods’). For population structure analyseswe also included three additional genomes that had lower coverage(mean: 3X).
Consistent with previous analyses of mitogenome data31, ourphylogenetic tree based on pairwise genetic distances andprincipal component analysis (PCA) revealed three distinct andreciprocally monophyletic clusters corresponding to the Suma-tran, Malay Peninsula and Bornean populations (Fig. 1b,Supplementary Fig. 1, Supplementary Table 1; see ‘Methods’).Interestingly, the phylogenetic tree and a clustering analysisshowed further distinction between two lineages within the islandof Sumatra, roughly corresponding to the northeastern Sumatraand southwestern Sumatra clades described in Steiner et al.31
(Supplementary Fig. 2, Supplementary Table 3; see ‘Methods’).However, in contrast to Steiner et al.31, all individuals from theMalay Peninsula grouped together and formed a sister lineage tothe Sumatran lineage.
Using the PSMC42, we estimated temporal fluctuations in Ne
for the Sumatran rhinoceros (see ‘Methods’). All three popula-tions experienced similar demographic trajectories characterisedby a decrease in Ne, with the most severe decline starting some700–500 ka BP and by a subsequent more gradual decline to a Ne
of ~2,000–1,000 at the end of the last glaciation (Fig. 2). Althoughthere was some individual variation in the amplitude of thesetrajectories, the declines were consistent among all individuals ofthe three populations (Supplementary Figs. 3 and 4). However,our analyses also revealed one important difference among thethree populations. The Sumatran and Malay Peninsula popula-tions showed nearly identical demographic trajectories
characterised by a slight recovery ca. 200–100 ka BP andpopulation stability in the following 60 ka. The Borneanpopulation instead continued to decline after 200 ka BP, butmight have experienced some population stability around 60–20ka BP.
To further investigate Sumatran rhinoceros demography, weinvestigated gene flow and split times (T) among the threepopulations using pseudodiploid X chromosome genomes foreach pair of populations (see ‘Methods’)42,43. The PSMCindicated that the Bornean population started diverging fromthe Sumatran and Malay Peninsula populations ~300 ka BP(Fig. 2, Supplementary Fig. 5, Supplementary Table 4). However,the curves showed several steps between 300 ka and 30–50 ka BP,when Ne finally reached infinity, indicating a gradual isolation ofthe Bornean population. In contrast, the divergence among thepopulations on the Malay Peninsula and Sumatra occurred muchlater, sometime between 9 and 13 ka BP, with Ne reaching infinitybetween 6 and 3 ka BP (Supplementary Fig. 5).
Genetic diversity and inbreeding in modern-day populations.We estimated the Sumatran rhinoceros’ spatial differences ingenome-wide heterozygosity (θ) measured as the number ofheterozygous sites per 1000 bp44 and inbreeding as the propor-tion of the genome found in runs of homozygostity45,46 (FROH)using 4,656,534 high-quality SNP calls (see ‘Methods’).
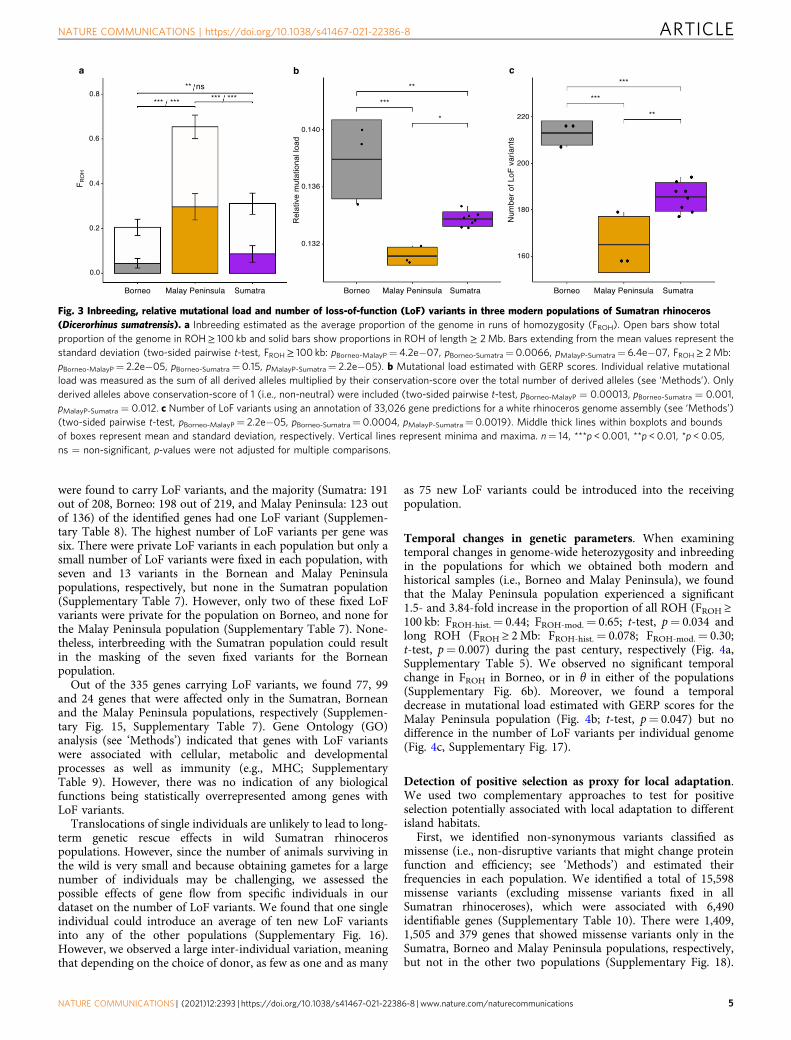
We found significant differences in heterozygosity andinbreeding (FROH ≥ 2Mb) among populations, with Sumatraand Borneo having ~71 and 78% higher heterozygosity (θSumatra
= 1.42; θBorneo= 1.48; t-test, p= 4.67e−07; SupplementaryFig. 6a), as well as ~71 and 85% lower inbreeding levels (FROH-
Sumatra= 0.086; FROH-Borneo= 0.045; t-test, p= 1.03e−05) com-pared to the recently extinct Malay Peninsula population (θMalayP.
= 0.83; FROH-MalayP.= 0.30; Fig. 3a, Supplementary Figs. 6a–9,Supplementary Table 5). While the Bornean and Sumatranpopulations have on average < 10% of the genome containedwithin long (FROH ≥ 2Mb) ROH segments, the Malay Peninsulapopulation had 30% shortly prior to its extinction.
Mutational load in modern-day populations. Because geneticload is challenging to estimate without any information on thefitness effects of deleterious variants, we here focus on quantifyingdifferences in mutational load (i.e., number of potentially dele-terious variants). We estimated mutational load using two com-plementary approaches. First, we estimated individual relativemutational load as the number of homozygous and heterozygousderived alleles at sites that are under strict evolutionary con-straints using genomic evolutionary rate profiling scores (i.e.,GERP scores; see ‘Methods’). Genomic sites that have beenstrongly conserved for millions of years of evolution (i.e., acrossseveral taxonomic groups) are expected to be functionallyimportant, and thus the fraction of mutations at such sites canserve as a proxy for mutational load (Supplementary Figs. 11 and12, Supplementary Note 1)47,48. The resulting GERP scoresindicated a significantly higher relative mutational load on Bor-neo compared to Sumatra (t-test, p= 0.001) as well as MalayPeninsula (t-test, p= 0.0001), and a significantly higher relativemutational load on Sumatra compared to Malay Peninsula (t-test,p= 0.012, Fig. 3b, Supplementary Fig. 13). Moreover, we foundthat 18% of deleterious alleles in highly conserved regions (i.e.,GERP-score > 4) are shared among the three populations,whereas 30%, 20% and 14% are unique to the Bornean, Sumatranand Malay Peninsula populations, respectively (SupplementaryTable 6).
Second, we estimated mutational load in coding regionsusing an annotation of 33,026 genes, based on the white
NATURE COMMUNICATIONS | https://doi.org/10.1038/s41467-021-22386-8 ARTICLE
NATURE COMMUNICATIONS | (2021) 12:2393 | https://doi.org/10.1038/s41467-021-22386-8 | www.nature.com/naturecommunications 3

rhinoceros genome (Ceratotherium simum simum; Genbank:GCF_000283155.1 see ‘Methods’). We identified sites carryingnon-synonymous loss-of-function (LoF) variants, which are likelyto be deleterious with a disruptive impact on protein function, andcompiled a list of genes with such LoF variants. In total, we found373 LoF variant sites across all three populations (SupplementaryTable 7), that individuals on Borneo have a significantly higher
number of LoF variants (naverage= 213) compared to the other twomodern populations (t-test, p= 2.78e−05), and that individualson Sumatra have a significantly higher number of LoF variants(naverage= 186) compared to Malay Peninsula (naverage= 165;t-test, p= 0.0019, Fig. 3c). Significant differences among popula-tions were only found for LoF variants in heterozygous state(t-test, p= 3.21e−06, Supplementary Fig. 14). In total, 335 genes
b
Borneo
Malay Peninsula
Sumatra
aCaptive born
Sumatra Malay PeninsulaBorneo
Specific location unknown
3
3
2
2
2
2
11
1 1
1
1
1 SR01*
SR12
kertamim
an
KB619
6
KB6197
SR08
SR09
KB9342
KB7902
KB9218
KB8031
KB6198
KB20219
SR22
Gelugob*
OR214
2*
puntung
KB14999KB8126KB9200
Fig. 1 Sampling, current range, and phylogeny for Sumatran rhinoceros (Dicerorhinus sumatrensis). a Geographical origin of the 21 Sumatran rhinocerosgenomes analysed in this study. Current distribution is depicted in green40. Triangles and circles represent approximate geographical sampling locations ofhistorical and modern samples, respectively. The numbers within the geometric symbols depict the number of samples from the corresponding location.b Unrooted phylogeny (100 bootstrap replicates). Asterisks denote low coverage (< 9X) genomes.
0
0.5
1
1.5
2
2.5
3
3.5
4
103 104 105 106
Effe
ctiv
e po
pula
tion
size
(x1
04 )
Years (g=12, �=2.3x10⁻⁸)
Holocene0-10 kya
Last glaciation10-120 kya
BorneoMalay PeninsulaSumatraChrXBorneo-Sumatra
ChrXBorneo-Malay P.
ChrXSumatra-Malay P.
Fig. 2 Population history and timing of population divergence for Sumatran rhinoceros (Dicerorhinus sumatrensis). Thick coloured lines depict temporalfluctuations in effective population size (Ne) for the three populations with each coloured line representing one individual from each population. Dotted/dashed black curves represent the pseudodiploid sex chromosomes (i.e., X chromosome) used to infer pairwise population divergence times, with thecurves going to infinity at the respective time of divergence. The X-axis corresponds to time before present in years on a log scale, assuming a substitutionrate (μ) of 2.34 × 10⁻⁸ substitutions/site/generation30,82 and a generation time (g) of 12 years76. The y-axis corresponds to Ne. The grey rectangle depictsthe last glaciation. Bootstrap tests were conducted with 100 replicates (Supplementary Fig. 4).
ARTICLE NATURE COMMUNICATIONS | https://doi.org/10.1038/s41467-021-22386-8
4 NATURE COMMUNICATIONS | (2021) 12:2393 | https://doi.org/10.1038/s41467-021-22386-8 | www.nature.com/naturecommunications
were found to carry LoF variants, and the majority (Sumatra: 191out of 208, Borneo: 198 out of 219, and Malay Peninsula: 123 outof 136) of the identified genes had one LoF variant (Supplemen-tary Table 8). The highest number of LoF variants per gene wassix. There were private LoF variants in each population but only asmall number of LoF variants were fixed in each population, withseven and 13 variants in the Bornean and Malay Peninsulapopulations, respectively, but none in the Sumatran population(Supplementary Table 7). However, only two of these fixed LoFvariants were private for the population on Borneo, and none forthe Malay Peninsula population (Supplementary Table 7). None-theless, interbreeding with the Sumatran population could resultin the masking of the seven fixed variants for the Borneanpopulation.
Out of the 335 genes carrying LoF variants, we found 77, 99and 24 genes that were affected only in the Sumatran, Borneanand the Malay Peninsula populations, respectively (Supplemen-tary Fig. 15, Supplementary Table 7). Gene Ontology (GO)analysis (see ‘Methods’) indicated that genes with LoF variantswere associated with cellular, metabolic and developmentalprocesses as well as immunity (e.g., MHC; SupplementaryTable 9). However, there was no indication of any biologicalfunctions being statistically overrepresented among genes withLoF variants.
Translocations of single individuals are unlikely to lead to long-term genetic rescue effects in wild Sumatran rhinocerospopulations. However, since the number of animals surviving inthe wild is very small and because obtaining gametes for a largenumber of individuals may be challenging, we assessed thepossible effects of gene flow from specific individuals in ourdataset on the number of LoF variants. We found that one singleindividual could introduce an average of ten new LoF variantsinto any of the other populations (Supplementary Fig. 16).However, we observed a large inter-individual variation, meaningthat depending on the choice of donor, as few as one and as many
as 75 new LoF variants could be introduced into the receivingpopulation.
Temporal changes in genetic parameters. When examiningtemporal changes in genome-wide heterozygosity and inbreedingin the populations for which we obtained both modern andhistorical samples (i.e., Borneo and Malay Peninsula), we foundthat the Malay Peninsula population experienced a significant1.5- and 3.84-fold increase in the proportion of all ROH (FROH ≥100 kb: FROH-hist.= 0.44; FROH-mod.= 0.65; t-test, p= 0.034 andlong ROH (FROH ≥ 2Mb: FROH-hist.= 0.078; FROH-mod.= 0.30;t-test, p= 0.007) during the past century, respectively (Fig. 4a,Supplementary Table 5). We observed no significant temporalchange in FROH in Borneo, or in θ in either of the populations(Supplementary Fig. 6b). Moreover, we found a temporaldecrease in mutational load estimated with GERP scores for theMalay Peninsula population (Fig. 4b; t-test, p= 0.047) but nodifference in the number of LoF variants per individual genome(Fig. 4c, Supplementary Fig. 17).
Detection of positive selection as proxy for local adaptation.We used two complementary approaches to test for positiveselection potentially associated with local adaptation to differentisland habitats.
First, we identified non-synonymous variants classified asmissense (i.e., non-disruptive variants that might change proteinfunction and efficiency; see ‘Methods’) and estimated theirfrequencies in each population. We identified a total of 15,598missense variants (excluding missense variants fixed in allSumatran rhinoceroses), which were associated with 6,490identifiable genes (Supplementary Table 10). There were 1,409,1,505 and 379 genes that showed missense variants only in theSumatra, Borneo and Malay Peninsula populations, respectively,but not in the other two populations (Supplementary Fig. 18).
Fig. 3 Inbreeding, relative mutational load and number of loss-of-function (LoF) variants in three modern populations of Sumatran rhinoceros(Dicerorhinus sumatrensis). a Inbreeding estimated as the average proportion of the genome in runs of homozygosity (FROH). Open bars show totalproportion of the genome in ROH≥ 100 kb and solid bars show proportions in ROH of length ≥ 2Mb. Bars extending from the mean values represent thestandard deviation (two-sided pairwise t-test, FROH≥ 100 kb: pBorneo-MalayP= 4.2e−07, pBorneo-Sumatra= 0.0066, pMalayP-Sumatra= 6.4e−07, FROH≥ 2Mb:pBorneo-MalayP= 2.2e−05, pBorneo-Sumatra= 0.15, pMalayP-Sumatra= 2.2e−05). b Mutational load estimated with GERP scores. Individual relative mutationalload was measured as the sum of all derived alleles multiplied by their conservation-score over the total number of derived alleles (see ‘Methods’). Onlyderived alleles above conservation-score of 1 (i.e., non-neutral) were included (two-sided pairwise t-test, pBorneo-MalayP = 0.00013, pBorneo-Sumatra = 0.001,pMalayP-Sumatra = 0.012. c Number of LoF variants using an annotation of 33,026 gene predictions for a white rhinoceros genome assembly (see ‘Methods’)(two-sided pairwise t-test, pBorneo-MalayP= 2.2e−05, pBorneo-Sumatra= 0.0004, pMalayP-Sumatra= 0.0019). Middle thick lines within boxplots and boundsof boxes represent mean and standard deviation, respectively. Vertical lines represent minima and maxima. n= 14, ***p < 0.001, **p < 0.01, *p < 0.05,ns = non-significant, p-values were not adjusted for multiple comparisons.
NATURE COMMUNICATIONS | https://doi.org/10.1038/s41467-021-22386-8 ARTICLE
NATURE COMMUNICATIONS | (2021) 12:2393 | https://doi.org/10.1038/s41467-021-22386-8 | www.nature.com/naturecommunications 5

Among these, there were zero, 103 and 107 genes that had fixedvariants in the Sumatra, Borneo and Malay Peninsula popula-tions, respectively (Supplementary Table 10).
Next, we used population branch statistics (PBS), whichincorporate the FST distance between a population of interestand two other populations49, to estimate the amount ofdivergence specific to the branch and for each gene (see‘Methods’). Out of 33,026 high-quality gene models, we found61 genes with PBS values larger than the 99.8th percentile of thedistribution of the PBS values of all genes (Supplementary Fig. 19,Supplementary Table 11). We found seven and two genes with asignal of positive selection unique to the Bornean and MalayPeninsula populations, respectively, and none in the Sumatranpopulation (Supplementary Fig. 20). Twelve genes were identifiedwith an infinite PBS value (i.e., FST= 1; Supplementary Table 11)over all pairwise population comparisons, indicating fixed allelicdifferences among our samples. Although this could indicate thatthe populations represent lineages that have evolved uniqueadaptive differences in these genes, we caution that analysis ofadditional individuals would be necessary to ascertain that thesevariants are truly fixed among the populations. Finally, out of the61 genes detected as positively selected with PBS, two hadmissense variants (Supplementary Table 11).
Gene Ontology (GO) categories of all genes with missensevariants (n= 6,490) and genes identified as under positiveselection in the PBS analysis (n= 61) were related to variousbiological functions including cellular processes, biologicalregulation and metabolic processes (Supplementary Table 12).However, no GO categories were overrepresented in eitherpopulation.
DiscussionThe Sumatran rhinoceros has inhabited Southeast Asia since thebeginning of the Pleistocene50,51. Our demographic reconstruc-tions show that the histories of the populations on Sumatra,Borneo and the Malay Peninsula are characterized by a con-tinuous decline for several hundred thousand years. However,even though these three regions were connected during the Late
Pleistocene (ca. 110–12 ka BP) due to lowered sea levels52, ouranalyses of pseudodiploid X chromosomes suggest that the Bor-nean population started to become isolated already 300 ka BP,which is consistent with previous estimates based on mitogenomedata31. At that time, the Sunda shelf was not completely sub-merged, with land linking mainland Asia with Sumatra andBorneo53. However, even though these regions were connected, asavannah corridor could have formed a geographical barrier foreast-west dispersal of rainforest species such as Sumatranrhinoceros54, thereby limiting gene flow between Borneo andSumatran/Malay Peninsula. In contrast, the populations onSumatra and the Malay Peninsula appear to have become isolatedfrom each other more recently, during the past 13–3 ka BP.
While it may be difficult to distinguish between populationstructure and population decline with the PSMC approach55, therelatively small Ne during the Holocene shown in the PSMCanalysis, are consistent with a strong differentiation among thepopulations and with each population being reciprocally mono-phyletic. We also find evidence for a divergence between thenortheastern and southwestern parts of Sumatra, most likely dueto isolation caused by a mountain range stretching along the westcoast of Sumatra. This subdivision is geographically differentfrom the genetic divergence identified in Sumatran orangutans(Pongo abelii and Pongo tapanuliensis)32,56, with an initialdivergence among orangutan populations north and south ofLake Toba starting ~3.38 mya and gene flow ceasing as a result ofa volcanic eruption some 71 ka BP56. Additional sampling ofrhinoceros specimens from north of Lake Toba would be neededto investigate the possibility of a similar deep subdivision in theSumatran rhinoceros.
Our PSMC analysis indicates that the Sumatran and MalayPeninsula lineages separated around 13 ka BP, whereas the Bor-nean and Sumatran lineages started separating much earlier,some 300 ka BP. Moreover, there are indications of body sizedifferences among populations, with individuals from the Bor-nean population being smaller than individuals from otherpopulations57,58. These size differences and our results are thusconsistent with the current taxonomy and subspecies delimita-tion. The level of genetic divergence in Sumatran rhinoceros is
Fig. 4 Temporal changes in inbreeding, relative mutational load and number of loss-of-function (LoF) variants in two populations of Sumatranrhinoceros (Dicerorhinus sumatrensis). a Inbreeding estimated as the average proportion of the genome in runs of homozygosity (FROH). Open bars showthe total proportion of the genome in ROH ≥100 kb and solid bars show proportions in ROH of length ≥ 2Mb. Bars extending from the mean valuesrepresent the standard deviation (two-sided t-test, FROH ≥ 100 kb: p= 0.034, FROH ≥ 2Mb: p= 0.007). b Mutational load estimated with GERP scores.Individual relative mutational load was measured as the sum of all derived alleles multiplied by their conservation-score over the total number of derivedalleles (see ‘Methods’). Only derived alleles above conservation-score of 1 (i.e., non-neutral) were included (two-sided t-test, p= 0.047). c Number ofLoF variants using an annotation of 33,026 genes for white rhinoceros (see ‘Methods’) (two-sided t-test, p= 0.35). Middle thick lines within boxplotsand bounds of boxes represent mean and standard deviation, respectively. Vertical lines represent minima and maxima. n= 6, **p < 0.01, *p < 0.05,ns = non-significant, p-values were not adjusted for multiple comparisons.
ARTICLE NATURE COMMUNICATIONS | https://doi.org/10.1038/s41467-021-22386-8
6 NATURE COMMUNICATIONS | (2021) 12:2393 | https://doi.org/10.1038/s41467-021-22386-8 | www.nature.com/naturecommunications
similar to what has recently been described for the white rhino-ceros (C. simum sp.), where evidence for long-term divergence(80–10 ka BP) and limited post-divergence gene flow, as well aslocal adaptation, have been identified for the northern andsouthern subspecies59. However, it is worth noting that whilelong-term geographical isolation in Sumatran rhinoceros couldlead to local adaptation, adaptive changes may not always occur,as indicated by our tests for positive selection in the threepopulations.
Consistent with the inferred small Ne over the past 10 ka BP,we also observe a large number of short ROH (< 2Mb) within allthree populations. Such a pattern is expected in populations witha long-term small population size due to repeated random matingbetween distant relatives, but is also common in populations thathave experienced historical bottlenecks, since recombinationbreaks down long ROH into smaller ones60.
However, even though the Sumatran rhinoceros has gonethrough a major decline in the past century, to the extent thatfewer than 100 individuals currently remain39, we find relativelylittle evidence for recent inbreeding in the populations on Borneoand Sumatra. When estimating inbreeding levels based on ROH≥ 2Mb, we found that, on average, < 10% of the genomes containlonger ROH segments. In addition, individual genome-wideheterozygosity was higher than in some other endangered taxa(e.g., Amur tiger, crested ibis, Grauer’s gorilla9), as well as inwhite rhinoceros59. While these comparatively low levels ofinbreeding and high levels of genetic diversity imply that the twosurviving populations have not yet been affected by stronginbreeding depression3, even a small number of lethal equivalentscould in theory lead to reductions in fitness61,62. Moreover, wenote that there is a considerable amount of mutational load inthese populations, especially on Borneo. In light of the currentsmall census population sizes on Sumatra and Borneo, a futureincrease in inbreeding seems highly likely. This could, in turn,lead to increased exposure of recessive mutations in homozygousstate63, which could pose a serious threat to the long-term per-sistence of these populations.
In contrast to the extant populations, the recently extinctpopulation on the Malay Peninsula had lower mutational load,but a higher proportion of the genome contained within longerROH segments (30%). The comparatively low mutational load inthe Malay Peninsula population could be a consequence of long-term small Ne, consistent with the observations of a long-termsmall Ne in mountain gorillas4 and island foxes64, which couldhave favoured purging of strongly deleterious alleles. We findsome support for this in the PSMC, which indicated a slightlysmaller Ne in the population over the past 30 ka in comparison tothe two extant populations. Alternatively, since our temporalcomparison with ca. 100-year-old samples from the MalayPeninsula indicates that inbreeding increased and mutational loaddecreased during the past century, the Malay Peninsula popula-tion may have experienced inbreeding depression during thisperiod, which could have resulted in purging of mutational loadprior to its extinction65,66. We caution here that even though wefound a temporal decrease in mutational load, additional gen-omes from the Malay Peninsula population would be needed tofully resolve the timing and extent of temporal changes inmutational load in this population.
The recent discovery of a wild female on Borneo (Indonesianprovince of East Kalimantan) has intensified the discussions onassisted gene flow and the role of genetic rescue between Borneoand Sumatra in order to alleviate the negative consequencesassociated with small and isolated populations40. Moreover, sincethe death of the last known captive male (Kertam) on Borneo,artificial insemination from its frozen sperm has been proposed
as a promising tool to introduce new genetic diversity into theSumatran population (John Payne, pers. comm.).
Gene flow can improve the genetic status of an endangeredspecies and result in an increase in fitness, known as hybridvigour, through the masking of deleterious alleles12,16. For theextant Sumatran rhinoceros populations, since most of theidentified LoF variants were in heterozygous state, gene flowwould probably not lead to a marked increase in the masking ofdeleterious alleles. However, if inbreeding increases in the nearfuture, gene flow could counteract the increased risk for fixationof the existing LoF variants.
One of the major risks of assisted gene flow is the disruption oflocal adaptation in the receiving population, which can causeoutbreeding depression21,22. While we found several genes withfixed missense variants in the populations on Borneo and MalayPeninsula, such mutations can also lead to a reduced proteineffectiveness or even loss of protein function. Yet, it is worthnoting that even if these missense variants have a negative effecton fitness, these would be masked in heterozygous state and atlower frequency in the recipient population, thereby reducingthese potentially negative fitness effects. Nevertheless, it is unclearwhether these variants represent any specific selective advantagein the local environment. Because of this, we also estimatedpopulation branch statistic (PBS) scores, which have been shownto have a high power to detect recent natural selection49 andshould not be confounded by deleterious mutations. The resultssuggest that seven, two and zero genes have been uniquelyselected in the Bornean, Malay Peninsula and Sumatran popu-lations, respectively.
Thus, we do not find strong support for local adaptation inthese three populations, suggesting that the introduction of locallymaladapted genes via gene flow from other populations is notvery likely. The overall high genomic divergence between the twoextant Sumatran rhinoceros populations instead suggests thatgene flow could lead to an increase in adaptive potential byincreasing the allelic diversity of the receiving population16,67. Wecaution, however, that behavioural changes in relation to captivityand/or translocation, or the risk of disease transmission, have notbeen considered in this study, but might also have an impact onthe outcome of assisted gene flow. Despite the lack of evidence forlocal adaptation, long-term isolation between populations, withthe estimated divergence between the Bornean population andthe two other populations being at least 30 times older than thedivergence between the Sumatra and the Malay Peninsulapopulations, suggests that the three populations could representdistinct evolutionary significant units (ESUs68,69). From theperspective of maintaining evolutionary processes, these shouldbe ideally conserved as separate historically isolated ESUs68,69.However, given the high risk of extinction for the Sumatranrhinoceros, one could argue that the remaining populationsshould be managed as a metapopulation40, since increasing theevolutionary potential and chances of survival for the speciesthrough genetic rescue might outweigh the value of maintainingdistinct evolutionary lineages12,70.
While there seems to be little risk of introducing locallymaladapted alleles, a potential by-product of gene flow could bean introduction of new deleterious variants into the recipientpopulation25. We found evidence for private mutational load inthe form of specific genes having deleterious alleles in onepopulation but not in the other two populations. Furthermore,our estimates suggested that gene flow of one individual from onepopulation to the other would, on average, introduce ten new LoFvariants into the recipient population. However, we also showedthat the choice of donor would have a marked effect on howmany deleterious alleles would be introduced, with estimates
NATURE COMMUNICATIONS | https://doi.org/10.1038/s41467-021-22386-8 ARTICLE
NATURE COMMUNICATIONS | (2021) 12:2393 | https://doi.org/10.1038/s41467-021-22386-8 | www.nature.com/naturecommunications 7

ranging from one to 75 new LoF variants depending on whichindividual was selected for assisted gene flow. Similarly, there isan asymmetry in the cost and benefit of gene flow amongpopulations. For instance, gene flow from the Sumatran to theBornean population would reduce the frequency of LoF variantsin Borneo, whereas gene flow from Borneo to Sumatra wouldintroduce new LoF variants in Sumatra. It is, however, note-worthy that in the absence of fitness effect estimates associatedwith these LoF variants, our estimates should only be consideredas approximations of individual mutational load.
Recent genomic studies indicate that attempts at genetic rescuefrom outbred populations can have detrimental effects byincreasing mutational load of small and inbred populations24,25,which suggest that genetic rescue attempts should be avoided insome cases. However, this claim is in conflict with a large numberof studies showing that assisted gene flow most often results in agenetic rescue effect27. Our analyses highlight the usefulness ofgenomic data to estimate individual mutational load, whichsubsequently can be used to assess the genetic consequences ofassisted gene flow27.
In summary, our results suggest that from a conservationperspective, the current genetic status of Sumatran rhinoceros isat odds with the extremely small extant populations and asso-ciated concerns about inbreeding depression. However, thetemporal changes observed in the Malay Peninsula populationmay serve as a warning of what might occur in the near future inthe two surviving populations. Our results suggest that during the20th century, the Malay Peninsula population experienced anincrease in inbreeding, and probably also inbreeding depressionfollowed by purging of mutational load as indicated by thecomparatively low level of mutational load shortly prior to itsextinction. With little evidence for recent inbreeding in the twosurviving populations and with few fixed deleterious alleles, thelong-term survival of the Sumatran rhinoceros does not seem tobe immediately threatened by detrimental genetic factors char-acteristic of small populations. However, given the extremelysmall sizes of the surviving populations on Borneo and Sumatra,it appears inevitable that inbreeding will increase in the nearfuture, which in turn is likely to also expose the recessive dele-terious alleles in homozygous state, thus reducing populationviability even further. Assisted gene flow guided by genomesequencing has the potential to help mitigate such a process.
MethodsBioinformatics processing of de novo assembly. The de novo reference genomefor Sumatran rhinoceros (D. sumatrensis harrissoni GCA_014189135.171) was usedto map all re-sequencing data (see Supplementary Methods). By blasting thegenome against the horse X chromosome, two sex-linked scaffolds were identified.In addition, repeats and transposable elements were predicted from the genomeassembly, and the assembly was masked using the predicted repeat library as input.Finally, CpG sites (all sites where a C nucleotide is followed by a G nucleotide inthe reference genome) were identified using a custom script (https://github.com/tvdvalk/find_CpG).
Sample and library preparation for re-sequencing. Thirty-one historical bone,skin and tooth samples from Borneo, Sumatra and the Malay Peninsula collectedbetween 1868 and 1921 were obtained from five European natural history muse-ums (Supplementary Table 1). Based on high endogenous DNA content (i.e.,36–89%; Supplementary Table 2), double-stranded libraries from five specimensfrom Borneo and the Malay Peninsula, were re-sequenced on an Illumina HiSeqXwith a 2 × 150 bp setup in the High Output mode at the National GenomicsInfrastructure (NGI), the sequencing facility of Science for Life Laboratories(SciLifeLab) in Stockholm, Sweden (see Supplementary Methods)72,73. Sixteenmodern DNA extracts were sent to NGI Stockholm for library preparation and re-sequencing on an Illumina HiSeqX with a 2 × 150 bp setup in High Output mode.Utilization of samples was compliant with applicable regulatory procedures forCITES and the US Endangered Species Act. Export of blood and tissue samples forDNA extraction and genome sequencing from Sumatran rhinoceros individualsfrom Sabah to the Swedish Museum of Natural History, Stockholm, Sweden, wasapproved by The Sabah Biodiversity Council and the director of Sabah Wildlife
Department in 2014 (Licence Ref JKM/MBS.1000-2/2 (373, CITES import/exportpermit numbers 51138-14/0736)). Exports of DNA extracts for genome sequencingfrom the San Diego Zoo Global Frozen Zoo®, USA, to the Swedish Museum ofNatural History, Stockholm, Sweden, was between two CITES-registered institu-tions (COSE transfer, CITES exemption reference number 30-3314/99), as well asunder Mutual Transfer Agreement (request number BR2016005).
Bioinformatics processing of re-sequencing data. Adapter-trimmed historicaland modern sequencing reads were mapped against the reference genome forSumatran rhinoceros and subsequently coordinate sorted, indexed, and PCRduplicates were removed from the alignments (see Supplementary Methods).
Read group information, including library, lane and sample identity, wasassigned to each bam file (see Supplementary Methods). Reads were then re-aligned around indels, and only read alignments with mapping quality ≥ 30 werekept for subsequent analysis. Three specimens (SR01, OR2142 and Gelugob) hadvery low coverage of 3X, 5X and 2X, respectively (Supplementary Table 2). For theremaining dataset, the average genome coverage ranged from 17X to 29X inmodern and from 9X to 13X for historical genomes.
Variant calling was done in historical and modern genomes, and resulting vcffiles were filtered for a minimum depth of coverage of 1/3X of the average coverage,base quality ≥ 30 and SNPs within ± 5 bp of indels were removed. CpG sites andrepeat regions identified in the reference genome (see ‘Bioinformatics processing ofde novo assembly’ section) and two X chromosome-linked scaffolds were excludedfrom the vcf files. All 21 rhinoceroses were included for population structureanalyses (i.e., PCA, ADMIXTURE), using 3,568,319 high-quality SNP calls. For allother analyses (genome-wide diversity, inbreeding, mutational load, variants incoding regions, tests of positive selection) the 18 rhinoceroses with coverage ≥ 9Xwere included, using 4,656,534 high-quality SNP.
Data analysisPopulation structure. An unrooted phylogeny was built by inferring genotypeposterior probabilities for each individual, estimating pairwise genetic distances,and then estimating phylogeny from the distance matrix (see SupplementaryMethods). Second, a principal component analysis (PCA)74 was performed, andgenetic clusters K ranging from 1 to 675 were identified.
Demographic reconstruction and population divergence. The pairwise sequentiallyMarkovian coalescent42 model was used to infer fluctuations in Ne of the threemajor lineages of Sumatran rhinoceros over time (see Supplementary Methods).100 bootstrap replicates were conducted per individual, using the intermediatesubstitution rate of 2.34 × 10⁻⁸ substitutions/site/generation from the ones com-pared in Mays et al.30 and a generation time of 12 years76. The split time (T)between each population pair of the Sumatran rhinoceros populations was esti-mated by assuming no coalescent events since divergence between the populationsand using the PSMC approach applied to a pseudodiploid X chromosome genome.
Genome-wide heterozygosity and runs of homozygosity (ROH). Individual genome-wide autosomal heterozygosity was estimated using mlRho, which uses the esti-mated population mutation rate (θ) to approximate heterozygosity (i.e., hetero-zygous sites per 1000 bp) under the infinite sites model44. Two-sided pairwise t-tests were used in R77 to statistically compare θ between groups.
Two different approaches were used to identify runs of homozygosity(ROH)78,79. Based on these results, the individual inbreeding coefficient FROHwas estimated as the overall proportion of the genome contained in ROH for (1)ROH ≥ 100 kb and (2) ROH ≥ 2Mb. To statistically compare FROH betweengroups, two-sided pairwise t-tests were used in R77.
Mutational load based on evolutionary constrained regions. An estimate of genomeconservation across evolutionary time was used as a proxy for the deleteriousnessof genomic variants. For each individual, the total number of homozygous andheterozygous derived alleles were obtained and stratified by GERP-score47 withinhighly conserved regions of the genome (excluding sites with missing genotypes;see Supplementary Methods). Individual relative mutational load was measured asthe sum of all derived alleles multiplied by their GERP-score, only includingderived alleles above a GERP-score of 4, divided by the total number of derivedalleles per individual. The percentage of derived alleles unique to each populationor shared between populations at high GERP scores (> 4; i.e., those putativelydeleterious), was also calculated. This was done by randomly subsampling sixalleles at each genomic site with a GERP-score above 4 from each of the modernpopulations (thus three samples per population to exclude sample biases), andcounting how often a derived allele was unique to a specific population or sharedwith one or both of the other populations. Two-sided pairwise t-tests were used inR77 to statistically compare individual relative mutational load between groups.
Mutational load in coding regions and missense variants. Synonymous and non-synonymous nucleotide substitutions within coding regions as well as substitutionsin proximity of coding regions were annotated for the 18 high-coverage modernand historical Sumatran rhinoceros genomes, by mapping the genomes to the whiterhinoceros (C. simum simum) genome assembly and using its annotation of 33,026
ARTICLE NATURE COMMUNICATIONS | https://doi.org/10.1038/s41467-021-22386-8
8 NATURE COMMUNICATIONS | (2021) 12:2393 | https://doi.org/10.1038/s41467-021-22386-8 | www.nature.com/naturecommunications
genes (GCF_000283155.1 see Supplementary Methods)80. Variants were identifiedin three different categories: (a) Synonymous: mostly harmless or unlikely tochange protein behaviour; (b) Missense: non-disruptive variants that might changeprotein effectiveness; and (c) LoF: variants assumed to have high (disruptive)impact on the protein, probably causing protein truncation, LoF or triggeringnonsense-mediated decay (e.g., stop codons, splice donor variant and spliceacceptor)80. The variants in these four categories were also differentiated byhomozygous and heterozygous state.
Two types of comparisons were performed: (1) between the modern andhistorical specimens for the Bornean (n= 5) and the Malay Peninsula (n= 6)populations, and (2) among modern samples from the Bornean (n= 4), MalayPeninsula (n= 3) and Sumatran (n= 8) populations. The number of variantsamong populations was then compared using two-sided pairwise t-tests in R77. Forthe comparison among modern samples, the number of LoF variants shared amongand unique to each population, as well as the estimated difference in frequency ofLoF variants among populations were reported.
Finally, the per-individual identified LoF variants were used to predict the riskof introducing new LoF variants in a receiving population in the case oftranslocation of individuals. This was done by counting the number of LoF variantsin each individual, then estimating how many of them were absent (allelefrequency= 0) in the other two populations.
Detecting positive selection. First, for each population, the frequency of variantscharacterised as missense to identify genes potentially involved in local adaptationin modern populations was estimated and the number of variants among popu-lations statistically compared as described in the previous section. We also reportedthe number of missense variants common or unique to each population.
Second, the population branch statistic (PBS) was estimated to investigateadaptation to local environments in the three Sumatran rhinoceros populations(see Supplementary Methods). Given the limited sample size, PBS values can getlarge due to extreme allele frequency differences. For example, if a gene’s FSTbetween the target and the sister population is 1, with both populations fixed for adifferent allele, the PBS value can be infinite. Thus, infinite PBS values werereplaced with the maximum value of the distribution of PBS values for thatpopulation. Finally, all genes with a PBS value larger than 3, ca. the 99.8th quartileof the distribution of the PBS values of all genes for each population, werereported.
Gene Ontology analysis. We assessed the biological functions associated with LoFand missense variants as well as for genes identified with the PBS approach andtested for statistical overrepresentation for each of these categories using horse(Equus caballus) as reference set (see Supplementary Methods).
Reporting summary. Further information on research design is available in the NatureResearch Reporting Summary linked to this article.
Data availabilityThe D. sumatrensis harrissoni assembly and the C. simum simum assembly are availableat NCBI (D. sumatrensis harrissoni: BioProjectID: PRJNA638009, assembly:GCA_014189135.1, C. simum simum:, BioProjectID: PRJNA74583, assembly:GCF_000283155.1). Modern and historical re-sequencing data (fastq files) generated forthis project are available at the European Nucleotide Archive (project accession numberPRJEB35511). Source data are provided with this paper.
Code availabilityThe three Python scripts used in this study and are available on GitHub: https://github.com/tvdvalk/find_CpG4, https://github.com/pontussk/samremovedup81, and https://github.com/mathii/gdc.git.
Received: 25 August 2020; Accepted: 1 March 2021;
References1. Caughley, G. Directions in conservation biology. J. Anim. Ecol. 63, 215 (1994).2. Kohn, M. H., Murphy, W. J., Ostrander, E. A. & Wayne, R. K. Genomics and
conservation genetics. Trends Ecol. Evol. 21, 629–637 (2006).3. Frankham, R. Genetics and extinction. Biol. Conserv. 126, 131–140 (2005).4. van der Valk, T., Díez-Del-Molino, D., Marques-Bonet, T., Guschanski, K.
& Dalén, L. Historical genomes reveal the genomic consequences ofrecent population decline in eastern gorillas. Curr. Biol. 29, 165–170.e6(2019).
5. Feng, S. et al. The genomic footprints of the fall and recovery of the crestedibis. Curr. Biol. 29, 340–349.e7 (2019).
6. Keller, L. Inbreeding effects in wild populations. Trends Ecol. Evol. 17,230–241 (2002).
7. Lande, R. & Shannon, S. The role of genetic variation in adaptation andpopulation persistence in a changing environment. Evolution 50, 434–437(1996).
8. Bijlsma, R. & Loeschcke, V. Genetic erosion impedes adaptive responses tostressful environments. Evolut. Appl. 5, 117–129 (2012).
9. Díez-del-Molino, D., Sánchez-Barreiro, F., Barnes, I., Gilbert, M. T. P. &Dalén, L. Quantifying temporal genomic erosion in endangered species.Trends Ecol. Evol. 33, 176–185 (2018).
10. Palsboll, P., Berube, M. & Allendorf, F. Identification of management unitsusing population genetic data. Trends Ecol. Evol. 22, 11–16 (2007).
11. Whiteley, A. R., Fitzpatrick, S. W., Funk, W. C. & Tallmon, D. A. Geneticrescue to the rescue. Trends Ecol. Evol. 30, 42–49 (2015).
12. Frankham, R. Genetic rescue of small inbred populations: meta-analysisreveals large and consistent benefits of gene flow. Mol. Ecol. 24, 2610–2618(2015).
13. Robinson, Z. L. et al. Experimental test of genetic rescue in isolatedpopulations of brook trout. Mol. Ecol. 26, 4418–4433 (2017).
14. Johnson, W. E. et al. Genetic restoration of the Florida panther. Science 329,1641–1645 (2010).
15. Madsen, T., Shine, R., Olsson, M. & Wittzell, H. Restoration of an inbredadder population. Nature 402, 34–35 (1999).
16. Edmands, S. Does parental divergence predict reproductive compatibility?Trends Ecol. Evol. 17, 520–527 (2002).
17. Bell, D. A. et al. The exciting potential and remaining uncertainties of geneticrescue. Trends Ecol. Evol. 34, 1070–1079 (2019).
18. Tallmon, D. A., Luikart, G. & Waples, R. S. The alluring simplicity andcomplex reality of genetic rescue. Trends Ecol. Evol. 19, 489–496 (2004).
19. Frankham, R. et al. A Practical Guide for Genetic Management of FragmentedAnimal and Plant Populations 15–30 (2019).
20. Frankham, R. Genetic rescue benefits persist to at least the F3 generation,based on a meta-analysis. Biol. Conserv. 195, 33–36 (2016).
21. Edmands, S. Heterosis and outbreeding depression in interpopulation crossesspanning a wide range of divergence. Evolution 53, 1757 (1999).
22. Frankham, R. et al. Predicting the probability of outbreeding depression.Conserv. Biol. 25, 465–475 (2011).
23. Savolainen, O., Lascoux, M. & Merilä, J. Ecological genomics of localadaptation. Nat. Rev. Genet. 14, 807–820 (2013).
24. Robinson, J. A. et al. Genomic signatures of extensive inbreeding in Isle Royalewolves, a population on the threshold of extinction. Sci. Adv. 5, eaau0757(2019).
25. Kyriazis, C. C., Wayne, R. K. & Lohmueller, K. E. Strongly deleteriousmutations are a primary determinant of extinction risk due to inbreedingdepression. Evol. Lett. 5, 33–47 (2021).
26. Hedrick, P. W., Peterson, R. O., Vucetich, L. M., Adams, J. R. & Vucetich, J. A.Genetic rescue in Isle Royale wolves: genetic analysis and the collapse of thepopulation. Conserv. Genet. 15, 1111–1121 (2014).
27. Ralls, K., Sunnucks, P., Lacy, R. C. & Frankham, R. Genetic rescue: a critiqueof the evidence supports maximizing genetic diversity rather than minimizingthe introduction of putatively harmful genetic variation. Biol. Conserv. 251,108784 (2020).
28. Allendorf, F. W. Genetics and the conservation of natural populations:allozymes to genomes. Mol. Ecol. 26, 420–430 (2017).
29. Ellis, S. & Talukdar, B. Dicerorhinus sumatrensis. IUCN Red List of ThreatenedSpecies (2020).
30. Mays, H. L. Jr et al. Genomic analysis of demographic history and ecologicalniche modeling in the endangered sumatran rhinoceros Dicerorhinussumatrensis. Curr. Biol. 28, 70–76.e4 (2018).
31. Steiner, C. C., Houck, M. L. & Ryder, O. A. Genetic variation of completemitochondrial genome sequences of the Sumatran rhinoceros (Dicerorhinussumatrensis). Conserv. Genet. 19, 397–408 (2018).
32. Zielinski, G. A. et al. Potential atmospheric impact of the Toba Mega-Eruption∼71,000 years ago. Geophys. Res. Lett. 23, 837–840 (1996).
33. Corbet, G. B., & Hill, J. E. The Mammals of the Indomalayan Region: ASystematic Review (Oxford University Press, 1992).
34. Zafir, A. W. A. et al. Now or never: what will it take to save the Sumatranrhinoceros Dicerorhinus sumatrensis from extinction? Oryx 45, 225–233(2011).
35. Amato, G., Wharton, D., Zainuddin, Z. Z. & Powell, J. R. Assessment ofconservation units for the Sumatran rhinoceros (Dicerorhinus sumatrensis).Zoo. Biol. 14, 395–402 (1995).
36. Morales, J. C. et al. Variability and conservation genetics of the Sumatranrhinoceros. Conserv. Biol. 11, 539–543 (1997).
37. Hubback, T. The Asiatic two-horned rhinoceros. J. Mammal. 20, 1 (1939).38. Havmøller, R. G. et al. Will current conservation responses save the critically
endangered Sumatran rhinoceros Dicerorhinus sumatrensis? Oryx 50, 355–359(2016).
NATURE COMMUNICATIONS | https://doi.org/10.1038/s41467-021-22386-8 ARTICLE
NATURE COMMUNICATIONS | (2021) 12:2393 | https://doi.org/10.1038/s41467-021-22386-8 | www.nature.com/naturecommunications 9

39. Miller, P. S., et al Population Viability Analysis for the Sumatran Rhino inIndonesia (IUCN/SSC Conservation Breeding Specialist Group).
40. Goossens, B. et al. Genetics and the last stand of the Sumatran rhinocerosDicerorhinus sumatrensis. Oryx 47, 340–344 (2013).
41. Only a dozen Sumatran rhinos left in East Kalimantan, experts believe. TheJakarta Post https://newgelora.thejakartapost.com/life/2019/03/30/only-a-dozen-sumatran-rhinos-left-in-east-kalimantan-experts-believe.html (2019).
42. Li, H. & Durbin, R. Inference of human population history from individualwhole-genome sequences. Nature 475, 493–496 (2011).
43. Prado-Martinez, J. et al. Great ape genetic diversity and population history.Nature 499, 471–475 (2013).
44. Haubold, B., Pfaffelhuber, P. & Lynch, M. mlRho—a program for estimatingthe population mutation and recombination rates from shotgun-sequenceddiploid genomes. Mol. Ecol. 19(Suppl 1), 277–284 (2010).
45. Curik, I., Ferenčaković, M. & Sölkner, J. Inbreeding and runs of homozygosity:a possible solution to an old problem. Livest. Sci. 166, 26–34 (2014).
46. McQuillan, R. et al. Runs of homozygosity in European populations. Am. J.Hum. Genet. 83, 359–372 (2008).
47. Davydov, E. V. et al. Identifying a high fraction of the human genome to beunder selective constraint using GERP++. PLoS Comput. Biol. 6, e1001025(2010).
48. Cooper, G. M. & Shendure, J. Needles in stacks of needles: finding disease-causal variants in a wealth of genomic data. Nat. Rev. Genet. 12, 628–640(2011).
49. Yi, X. et al. Sequencing of 50 human exomes reveals adaptation to highaltitude. Science 329, 75–78 (2010).
50. Zin-Maung-Maung-Thein et al. A review of fossil rhinoceroses from theNeogene of Myanmar with description of new specimens from the IrrawaddySediments. J. Asian Earth Sci. 37, 154–165 (2010).
51. Chen, N. et al. Ancient genomes reveal tropical bovid species in the TibetanPlateau contributed to the prevalence of hunting game until the late Neolithic.Proc. Natl. Acad. Sci. USA https://doi.org/10.1073/pnas.2011696117 (2020).
52. Bird, M. I., Taylor, D. & Hunt, C. Palaeoenvironments of insular SoutheastAsia during the Last Glacial Period: a savanna corridor in Sundaland? Quat.Sci. Rev. 24, 2228–2242 (2005).
53. Suraprasit, K., Jongautchariyakul, S., Yamee, C., Pothichaiya, C. & Bocherens,H. New fossil and isotope evidence for the Pleistocene zoogeographictransition and hypothesized savanna corridor in peninsular Thailand. Quat.Sci. Rev. 221, 105861 (2019).
54. Wurster, C. M., Rifai, H., Zhou, B., Haig, J. & Bird, M. I. Savanna in equatorialBorneo during the late Pleistocene. Sci. Rep. 9, 1–7 (2019).
55. Nadachowska‐Brzyska, K., Burri, R., Smeds, L. & Ellegren, H. PSMC analysisof effective population sizes in molecular ecology and its application to black‐and‐white Ficedula flycatchers. Mol. Ecol. 25, 1058–1072 (2016).
56. Nater, A. et al. Morphometric, behavioral, and genomic evidence for a neworangutan species. Curr. Biol. 27, 3576–3577 (2017).
57. Groves, C. P. Description of a new subspecies of rhinoceros, from Borneo,Didermocerus sumatrensis harrissoni. Saugetierkd. Mitt. 13, 128–131 (1965).
58. Groves, C. P. & Kurt, F. Dicerorhinus sumatrensis. Mammalian Species 1–6(1972).
59. Tunstall, T. et al. Evaluating recovery potential of the northern whiterhinoceros from cryopreserved somatic cells. Genome Res. 28, 780–788 (2018).
60. Pemberton, T. J. et al. Genomic patterns of homozygosity in worldwidehuman populations. Am. J. Hum. Genet. 91, 275–292 (2012).
61. O’Grady, J. J. et al. Realistic levels of inbreeding depression strongly affectextinction risk in wild populations. Biol. Conserv. 133, 42–51 (2006).
62. Frankham, R. et al. Genetic Management of Fragmented Animal and PlantPopulations(Oxford University Press, 2017).
63. Morton, N. E., Crow, J. F. & Muller, H. J. An estimate of the mutationaldamage in man from data on consanguineous marriages. Proc. Natl Acad. Sci.USA 42, 855–863 (1956).
64. Robinson, J. A. et al. Genomic flatlining in the endangered island fox. Curr.Biol. 26, 1183–1189 (2016).
65. Hedrick, P. W. & Garcia-Dorado, A. Understanding inbreeding depression,purging, and genetic rescue. Trends Ecol. Evol. 31, 940–952 (2016).
66. Caballero, A., Bravo, I. & Wang, J. Inbreeding load and purging: implicationsfor the short-term survival and the conservation management of smallpopulations. Heredity 118, 177–185 (2017).
67. Vilas, A., Pérez-Figueroa, A., Quesada, H. & Caballero, A. Allelic diversity forneutral markers retains a higher adaptive potential for quantitative traits thanexpected heterozygosity. Mol. Ecol. 24, 4419–4432 (2015).
68. Moritz, C. Defining ‘Evolutionarily Significant Units’ for conservation. TrendsEcol. Evol. 9, 373–375 (1994).
69. Crandall, K. A., Bininda-Emonds, O. R. P., Mace, G. M. & Wayne, R. K.Considering evolutionary processes in conservation biology. Trends Ecol. Evol.15, 290–295 (2000).
70. Hedrick, P. W. Gene flow and genetic restoration: the Florida panther as acase study. Conserv. Biol. 9, 996–1007 (1995).
71. Lord, E. et al. Pre-extinction demographic stability and genomic signatures ofadaptation in the woolly rhinoceros. Curr. Biol. https://doi.org/10.1016/j.cub.2020.07.046 (2020).
72. Meyer, M. & Kircher, M. Illumina sequencing library preparation for highlymultiplexed target capture and sequencing. Cold Spring Harb. Protoc. 2010,db.prot5448 (2010).
73. Ersmark, E. et al. Population demography and genetic diversity in thePleistocene cave lion. Open Quat. 1, 4 (2015).
74. Patterson, N., Price, A. L. & Reich, D. Population structure and eigenanalysis.PLoS Genet. 2, e190 (2006).
75. Raj, A., Stephens, M. & Pritchard, J. K. fastSTRUCTURE: variational inferenceof population structure in large SNP data sets. Genetics 197, 573–589 (2014).
76. Roth, T. L. et al. Sexual maturation in the Sumatran rhinoceros (Dicerorhinussumatrensis). Zoo. Biol. 32, 549–555 (2013).
77. R Development Core Team. The R Reference Manual: Base Package (NetworkTheory, 1999).
78. Purcell, S. et al. PLINK: a tool set for whole-genome association andpopulation-based linkage analyses. Am. J. Hum. Genet. 81, 559–575 (2007).
79. Renaud, G., Hanghøj, K., Korneliussen, T. S., Willerslev, E. & Orlando, L. Jointestimates of heterozygosity and runs of homozygosity for modern and ancientsamples. Genetics 212, 587–614 (2019).
80. Cingolani, P. et al. A program for annotating and predicting the effects ofsingle nucleotide polymorphisms, SnpEff: SNPs in the genome of Drosophilamelanogaster strain w1118; iso-2; iso-3. Fly 6, 80–92 (2012).
81. Palkopoulou, E. et al. Complete genomes reveal signatures of demographicand genetic declines in the woolly mammoth. Curr. Biol. https://doi.org/10.1016/j.cub.2015.04.007 (2015).
82. Liu, G. E., Matukumalli, L. K., Sonstegard, T. S., Shade, L. L. & Van Tassell, C.P. Genomic divergences among cattle, dog and human estimated from large-scale alignments of genomic sequences. BMC Genomics 7, 140 (2006).
AcknowledgementsL.D. and J.vS. acknowledge support from FORMAS (grant 2015-676). N.D. was fundedby the Swiss National Science Foundation (Early Postdoc Mobility grant P2SKP3_165031and Advanced Postdoc Mobility grant P300PA_177845) and the Carl Tryggers Foun-dation (CTS 19:257). D.D.dM. was supported through a Carl Tryggers scholarship (grantCTS17:109). K.G. acknowledges support from FORMAS (grant 2016-00835). P.S.acknowledges the European Research Council (grant 852558), the Wellcome Trust(217223/Z/19/Z) and Francis Crick Institute core funding (FC001595). M.T.P.G.acknowledges ERC Consolidator Grant 681396 ‘Extinction Genomics’. Y.C. acknowl-edges support from the EU Marie Curie Action (FP7-MC-IIF project 301572). V.K. andM.K. are financially supported by the Knut and Alice Wallenberg Foundation as partof the National Bioinformatics Infrastructure Sweden at Science for Life Laboratories.C.W.W. acknowledges the Swedish Research Council (2017-04386). We thank RobertoPortela-Miguez, Tom Geerinckx, Daniela Kalthoff, Frank Zachos, Alexander Bibl, andEline Lorenzen for assisting with sampling of museum specimens from the NHMLondon, RBINS Brussels, NRM Stockholm, NMW Vienna, and NHM Denmark,respectively. We also thank Zainal Zainuddin and John Payne from Borneo RhinoAlliance (BORA) and the late Diana Angeles Ramirez Saldivar from the Wildlife RescueUnit for providing modern samples. We thank the Sabah Biodiversity Centre and theSabah Wildlife Department for allowing us to export samples from Sumatran rhinocerosindividuals from Sabah. We thank the Zoological Society of San Diego and San DiegoZoo Global Frozen Zoo® for allowing us to utilize frozen samples from Sumatran rhi-noceros individuals from Malay Peninsula, Sumatra, and Borneo. Sequencing was per-formed by the Swedish National Genomics Infrastructure (NGI) at the Science for LifeLaboratory, which is supported by the Swedish Research Council and the Knut and AliceWallenberg Foundation. The data handling was enabled by resources provided by theSwedish National Infrastructure for Computing (SNIC) at the Uppsala MultidisciplinaryCentre for Advanced Computational Science (UPPMAX) partially funded by the SwedishResearch Council through grant agreement no. 2018-05973, under projects SNIC 2020/5-3 and 2019/8-331. Finally, we thank Eleftheria Palkopoulou for providing advice onbioinformatics analyses.
Author contributionsJ.vS., L.D., Y.C. and B.G. conceived the study, with N.D. and D.D.dM. contributingadvice on the study design. S.K.S.S.N., B.G., S.B., O.R., M.T.P.G., L.D. and A.G. con-tributed with samples, important materials and/or resources. J.vS., L.D., C.S. andM.-H.S.S. performed DNA extractions and library preparation. J.vS., N.D., D.D.dM.,T.vV., V.E.K, M.K. and S.L. performed bioinformatics and computational analyses of thedata. L.D., C.W.W., K.G., P.S. and S.P. provided advice on the data analyses. J.vS. andN.D. drafted the manuscript. All authors contributed to the final version of themanuscript.
Competing interestsThe authors declare no competing interests.
ARTICLE NATURE COMMUNICATIONS | https://doi.org/10.1038/s41467-021-22386-8
10 NATURE COMMUNICATIONS | (2021) 12:2393 | https://doi.org/10.1038/s41467-021-22386-8 | www.nature.com/naturecommunications

Additional informationSupplementary information The online version contains supplementary materialavailable at https://doi.org/10.1038/s41467-021-22386-8.
Correspondence and requests for materials should be addressed to J.v.S., N.D. or L.D.
Peer review information Nature Communications thanks Warren Johnson and theother, anonymous, reviewers for their contribution to the peer review of this work. Peerreviewer reports are available.
Reprints and permission information is available at http://www.nature.com/reprints.
Publisher’s note Springer Nature remains neutral with regard to jurisdictional claims inpublished maps and institutional affiliations.
Open Access This article is licensed under a Creative CommonsAttribution 4.0 International License, which permits use, sharing,
adaptation, distribution and reproduction in any medium or format, as long as you giveappropriate credit to the original author(s) and the source, provide a link to the CreativeCommons license, and indicate if changes were made. The images or other third partymaterial in this article are included in the article’s Creative Commons license, unlessindicated otherwise in a credit line to the material. If material is not included in thearticle’s Creative Commons license and your intended use is not permitted by statutoryregulation or exceeds the permitted use, you will need to obtain permission directly fromthe copyright holder. To view a copy of this license, visit http://creativecommons.org/licenses/by/4.0/.
© The Author(s) 2021
NATURE COMMUNICATIONS | https://doi.org/10.1038/s41467-021-22386-8 ARTICLE
NATURE COMMUNICATIONS | (2021) 12:2393 | https://doi.org/10.1038/s41467-021-22386-8 | www.nature.com/naturecommunications 11