genomma lab internacional reports third quarter 2018 results · initiatives at the point of sale,...
TRANSCRIPT

1
Q3-2018 Results
www.genommalab.com/inversionistas/
Genomma Lab Internacional Reports Third Quarter 2018 Results
Mexico City, October 24, 2018 – Genomma Lab Internacional, S.A.B. de C.V. (BMV: LAB B)
(“Genomma Lab” or “the Company”), today announced its results for the third quarter
ended September 30, 2018. All figures included herein are stated in nominal Mexican
pesos and have been prepared in accordance with International Financial Reporting
Standards (IFRS).
The following table provides an abridged Income Statement, in millions of Mexican pesos.
The margin for each figure represents its ratio to net sales and the percentage change in
the third quarter 2018 as compared with the same period in 2017:
Q3-2018 % Sales Q3-2017 % Sales Var. %
Net Sales 3,020.6 100.0% 3,079.5 100.0% (1.9)%
Gross Profit 2,020.9 66.9% 2,088.3 67.8% (3.2)%
Operating Income 603.9 20.0% 687.5 22.3% (12.2)%
EBITDA(2) 621.0 20.6% 703.3 22.8% (11.7)%
Net Income(3) 213.1 7.1% 230.5 7.5% (7.6)%
(2) EBITDA is defined as operating income before depreciation and amortization. (3) Net Income of Majority Shareholders for Q3-2017.
Comments from the CEO
Mr. Jorge Brake, Chief Executive Officer, commented: “I am very pleased to take the helm at Genomma Lab, a company with leading OTC and Personal Care brands present in millions of homes throughout Mexico, Latin America and increasingly in the U.S. Over the last 45 days I have visited most of our markets and met with experienced, agile and engaged leaders who are well-positioned to work together to launch our Company into its next phase of growth. Important steps have been taken over the last few years to initiate the Company’s transformational process. Based on what I have seen so far, it is clear to me that today we have a strong platform in place to fully capitalize on our Company’s potential: a very strong team, a highly effective GTM model, a product innovation pipeline which will expand our presence in key consumer segments, a right-sized and efficient operating structure, an improved financial model and structure, and a strong plan to fully optimize our supply chain to now drive profitable near-term growth.”
Mr. Brake continued: “During my first 100 days leading Genomma, I have committed to developing a five-year strategic plan focusing primarily on accelerating our top-line growth. So far, I have seen clear opportunities to leverage and expand our presence in the current categories we manage in those countries in which we operate, while adding new adjacent categories with considerable growth potential. Importantly, innovation will be a key component of this strategy. We will also review our pricing strategy and assess opportunities to expand our footprint within our markets via the right portfolio of products. I am encouraged by the success achieved with the turnaround process to date, which focused primarily on cost efficiency. We now will fine-tune Genomma’s business model to establish a solid performance for the years to come. Genomma Lab is well positioned for the future, driven by our
KEY DATA
Net Sales reached
Ps. 9.15 billion, for the first nine months
ended September 30, 2018
Net Revenues grew +4.9% as expressed in local currency for Q3 2018
EBITDA margin for the first nine months of
2018 closed at 21.2%
SGM&A(1) for the first nine months ended September 30, 2018 closed at 46.0%, a 130 bps year-on-year
improvement
Free Cash Flow of Ps. 97.9 million
by September 30, 2018
Capex Investments for the first nine months of 2018
reached Ps. 839.4 million allocated to: - New Plant
-Brand acquisitions
Ps. 121.1 million invested in
Share Buy-backs year-to-date.
(1) Selling, General, Marketing and Administrative Expenses.

2
Q3-2018 Results
www.genommalab.com/inversionistas/
Company’s ability to capitalize on our many strengths and competitive advantages. I am looking forward to optimizing shareholder value building from our solid foundation, through the achievement of our long term top-line growth plan.”
Business Review
During the third quarter 2018, the Company’s topline grew by +4.9% as expressed in
local currency, yet faced major foreign exchange and macroeconomic headwinds that
impacted growth as expressed in Mexican pesos. The 1.9% year on year contraction
in net sales that affected third quarter results was mainly due to hyperinflation and
exchange rate depreciation in Argentina. To a lesser extent, Genomma’s Brazil
operations were also affected by FX and political volatility, impacting consumer
demand across different segments. These negative effects were partially offset by
innovation and execution initiatives at the point of sale in the U.S., Colombia and
Central America.
The 2.2 percentage point decrease in EBITDA margin for the quarter is primarily
attributed to the above-mentioned impacts on Genomma’s Argentina operations, and
to a lesser extent by a short-term product mix effect, as well as pre-production and
pre-operating expenses associated with the new manufacturing plant.
As part of Genomma’s transformation process, the Board of Directors appointed Jorge
Luis Brake as Genomma Lab Internacional’s new Chief Executive Officer, effective
September 10, 2018. Mr. Brake will focus on top-line growth, and will continue
executing those strategic initiatives previously outlined by Max Juda, including
Genomma Lab’s Mexico manufacturing plant.
Mexico
During the quarter, the top-line for Genomma’s Mexican operations increased by
2.0%, year on year. Net Sales were primarily driven by the execution of innovation
initiatives at the point of sale, with a positive sell-out trend in brands such as: Suerox®
hydration beverage, Asepxia® Carbón facial cleanser and Cicatricure® cream, which
helped offset high year on year comparables due to aggressive promotional activities
during the third quarter 2017 winter season.
EBITDA margin for Genomma’s Mexico operations contracted by 1.3 percentage
points, year on year, due to pre-operating and pre-production expenses associated
with the Company’s new manufacturing plant. EBITDA margin improved by 220 basis
points on a sequential basis, as the Company recovers from the short-term effect of
high margin SKU supply shortages on the sales mix.
In the third quarter 2018, the Company reached more than 30,000 additional points of
sale within the Mom & Pop channel, engaging 6 new direct Distribution Business
Partners, and attained direct distribution to more than 98,000 POS in this channel.
During the quarter, the Company invested Ps. 344.4 million in the new manufacturing
project and incurred pre-operating and pre-production expenses in the amount of Ps.
24.5 million.
Presence in 19 Countries
and over 270,000 POS*
KEY DATA Q3
% Sales by Segment:
OTC 50.4%
PC 49.6%

3
Q3-2018 Results
www.genommalab.com/inversionistas/
The Company is in the process of obtaining the required permits to begin
manufacturing its Over-the-Counter (OTC) product line in the first quarter of 2019, and
for its Personal Care plant during the second quarter of 2019. To accelerate the
learning curve ahead of full production, the Company initiated trial production runs of
a limited number of SKU’s at its Mexico City pilot plant.
U.S.
During the third quarter of 2018, Genomma’s U.S. operations continued its successful
transformation process to drive top line growth. Net sales increased by a solid 10.5%
in local currency, and by 17.7% in Mexican pesos. During the quarter, sales growth
accelerated in brands including Genomma’s Cicatricure® and Teatrical® facial creams
in the Personal Care segment, and Lagicam® antifungal cream, Dragón® pain relief
cream and Nikzon® hemorrhoidal cream in the OTC segment, supported by enhanced
TV & Digital advertising as well as by ongoing efforts to increase distribution and
visibility at the point of sale.
The Company’s continued focus on cost and expense reduction throughout the
organization resulted in an 830 basis point EBITDA margin expansion, closing with
16.8% margin.
Latin America
Genomma’s Central and South America operations achieved a 10.0% increase in
sales when expressed in local currency, primarily driven by pricing strategies as well
as by outstanding performance by Genomma’s Teatrical® facial cream in Argentina
and Cicatricure® facial cream and Asepxia® Carbón cleanser throughout Latin
America. When expressed in Mexican Pesos, top-line for the Latin America region
contracted by 8.6% year on year, primarily due to hyperinflation and foreign exchange
headwinds in Argentina and Brazil, reflected in a Ps. 228.4 million revenue decrease
in both countries despite growing 12.0% and 11.9%, respectively, when expressed in
local currency.
The Company launched a very successful Cicatricure® TV and advertising campaign
across the region, which allowed the brand to achieve a double-digit growth year on
year in sell-out.
Genomma’s Colombia, Chile, Peru and Central America operations achieved double-
digit year on year increases, enabling the Company to partially offset the negative top-
line impact due to foreign exchange impacts in Argentina.
Genomma’s continuous efforts to increase penetration through new customers,
allowed us to sign a new agreement with Coopidrogas, one of the largest pharma
distributors in Colombia, to reach more than 8,000 independent pharmacies, which
contributed to the double-digit growth in that country.
From a margin and profitability perspective, the Company’s pricing strategies,
innovation initiatives and cost and expense controls played an important role across
the region, mitigating the 4.3 percentage point EBITDA margin contraction.
3Q-2018 brand introduction
#1 skincare brand in Argentina
Successful brand
execution across all regions
3Q-2018 innovation for US Market
4
Q3-2018 Results
www.genommalab.com/inversionistas/
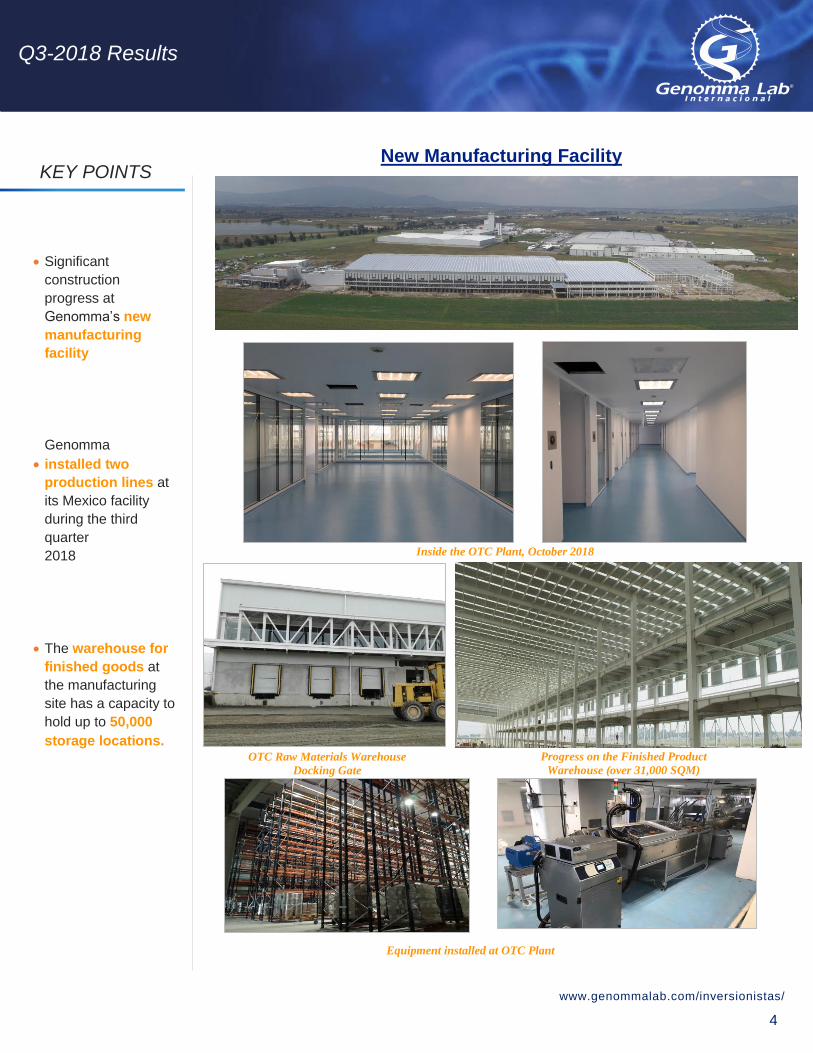
New Manufacturing Facility
Inside the OTC Plant, October 2018
Equipment installed at OTC Plant
Progress on the Finished Product
Warehouse (over 31,000 SQM) OTC Raw Materials Warehouse
Docking Gate
KEY POINTS
Significant
construction
progress at
Genomma’s new
manufacturing
facility
Genomma
installed two
production lines at
its Mexico facility
during the third
quarter
2018
The warehouse for
finished goods at
the manufacturing
site has a capacity to
hold up to 50,000
storage locations.

5
Q3-2018 Results
www.genommalab.com/inversionistas/
Sales by Category & Region (Figures in million Mexican Pesos)
Consolidated Results for 3Q-2018
Third Quarter 2018 Net Sales reached Ps. 3.02 billion; a 1.9% year on year decrease.
This decrease is primarily due to the negative foreign exchange impact from Argentina,
which was partially offset by innovation and execution initiatives at the point of sale
throughout the different regions in which Genomma has a presence.
Third Quarter 2018 EBITDA closed at Ps. 621.0 million, as compared to 703.3 million
for the same period of 2017. Third quarter 2018 EBITDA margin reached 20.6%; a
220 year on year bps contraction. The EBITDA margin decrease was due to the
previously mentioned impacts from Argentina macro headwinds, as well as by short-
term product mix effect and Ps. 24.5 million in pre-operating expenses associated with
the new manufacturing plant.
Results by Region
Mexico
Net Sales for the third quarter 2018 reached Ps. 1.31 billion; a 2.0% year on year
increase. The Ps. 25.9 million increase is primarily due by “perfect store” visibility-
focused initiatives at the point of sale and by an enhanced emphasis on innovation.
The increase in sales was partially offset by the aforementioned effect as discussed
in the business review section.
EBITDA for the quarter reached Ps. 209.1 million; a 16.0% margin reflecting a 1.3
percentage point year on year contraction and a 2.2 percentage point sequential
increase. Third quarter 2018 EBITDA was impacted by Ps. 24.5 million in expenses
associated with pre-production and pre-operating processes related to Genomma’s
new manufacturing facility.
U.S.
Third quarter 2018 Net Sales for Genomma’s U.S. operations increased by 17.7%, to
Ps. 313.0 million; a Ps. 47.0 million year on year increase. Expressed in U.S. dollars,
top-line growth increased by 10.5%, year on year.
Q3-2017 Q3-2018 %Var Q3-2017 Q3-2018 %Var Q3-2017 Q3-2018 %Var
Mexico 686.6 808.6 17.8% 597.8 501.7 (16.1)% 1,284.4 1,310.3 2.0%
Latam 531.8 532.0 0.0% 997.3 865.3 (13.2)% 1,529.1 1,397.3 (8.6)%
U.S. 107.4 182.5 70.0% 158.6 130.5 (17.7)% 266.0 313.0 17.7%
Total 1,325.8 1,523.1 14.9% 1,753.7 1,497.5 (14.6)% 3,079.5 3,020.6 (1.9)%
Over-the-Counter (OTC) Personal Care (PC) Total
MEXICO Sales: Ps. 1.31 billion
EBITDA Margin: 16.0%
U.S. Sales: Ps. 313.0 million
EBITDA Margin: 16.8%
3Q-2018 Net Sales of Ps. 3.02 billion
Sales by Region*
*Percentage of Consolidated Net
Sales by Region as of Q3-2018.
3Q-2018
Latam46.2%
Mexico 43.4%
U.S.A. 10.4%
6
Q3-2018 Results
www.genommalab.com/inversionistas/
Third quarter 2018 EBITDA amounted to Ps. 52.7 million; a Ps. 30.1 million year on
year increase. Third quarter 2018 EBITDA margin closed at 16.8%. The 8.3
percentage point variation in margin as compared to the 8.5% EBITDA margin of the
third quarter 2017 is a reflection of the Company’s ongoing focus on cost and expense
containment throughout Genomma’s U.S. operations over the last twelve months.
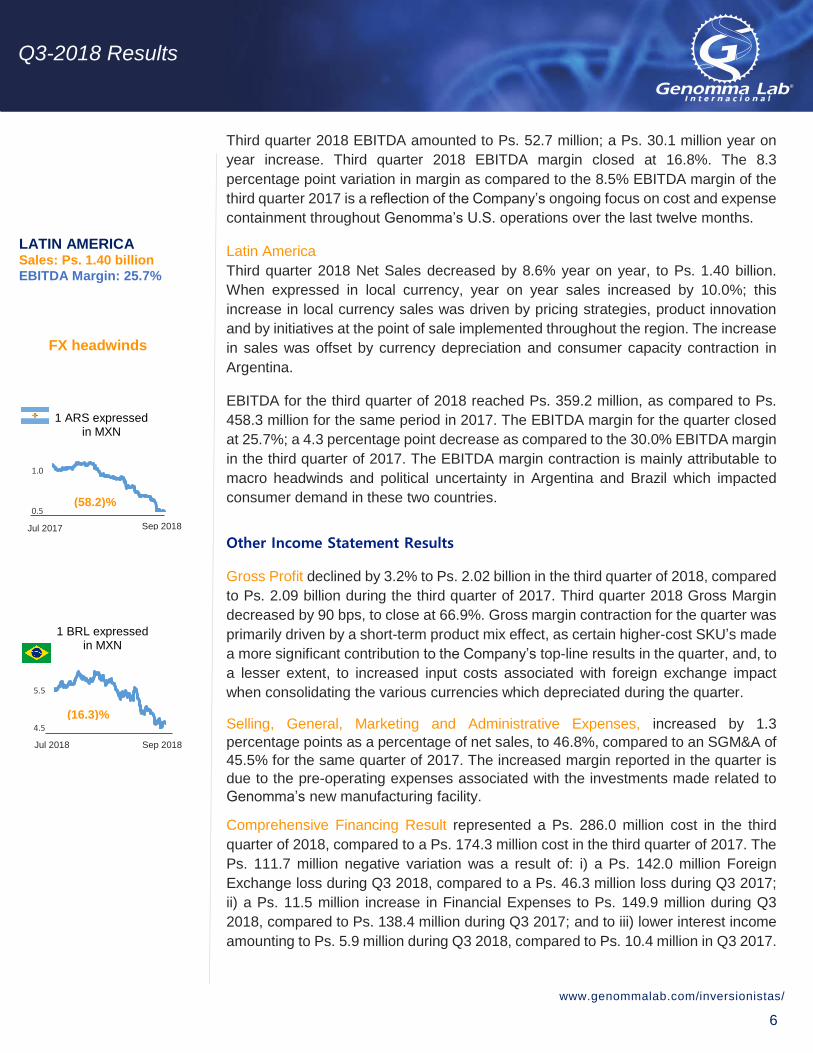
Latin America
Third quarter 2018 Net Sales decreased by 8.6% year on year, to Ps. 1.40 billion.
When expressed in local currency, year on year sales increased by 10.0%; this
increase in local currency sales was driven by pricing strategies, product innovation
and by initiatives at the point of sale implemented throughout the region. The increase
in sales was offset by currency depreciation and consumer capacity contraction in
Argentina.
EBITDA for the third quarter of 2018 reached Ps. 359.2 million, as compared to Ps.
458.3 million for the same period in 2017. The EBITDA margin for the quarter closed
at 25.7%; a 4.3 percentage point decrease as compared to the 30.0% EBITDA margin
in the third quarter of 2017. The EBITDA margin contraction is mainly attributable to
macro headwinds and political uncertainty in Argentina and Brazil which impacted
consumer demand in these two countries.
Other Income Statement Results
Gross Profit declined by 3.2% to Ps. 2.02 billion in the third quarter of 2018, compared
to Ps. 2.09 billion during the third quarter of 2017. Third quarter 2018 Gross Margin
decreased by 90 bps, to close at 66.9%. Gross margin contraction for the quarter was
primarily driven by a short-term product mix effect, as certain higher-cost SKU’s made
a more significant contribution to the Company’s top-line results in the quarter, and, to
a lesser extent, to increased input costs associated with foreign exchange impact
when consolidating the various currencies which depreciated during the quarter.
Selling, General, Marketing and Administrative Expenses, increased by 1.3
percentage points as a percentage of net sales, to 46.8%, compared to an SGM&A of
45.5% for the same quarter of 2017. The increased margin reported in the quarter is
due to the pre-operating expenses associated with the investments made related to
Genomma’s new manufacturing facility.
Comprehensive Financing Result represented a Ps. 286.0 million cost in the third
quarter of 2018, compared to a Ps. 174.3 million cost in the third quarter of 2017. The
Ps. 111.7 million negative variation was a result of: i) a Ps. 142.0 million Foreign
Exchange loss during Q3 2018, compared to a Ps. 46.3 million loss during Q3 2017;
ii) a Ps. 11.5 million increase in Financial Expenses to Ps. 149.9 million during Q3
2018, compared to Ps. 138.4 million during Q3 2017; and to iii) lower interest income
amounting to Ps. 5.9 million during Q3 2018, compared to Ps. 10.4 million in Q3 2017.
(16.3)%
Jul 2018
Sep 2018
4.5
5.5
1 BRL expressed in MXN
0.5
1.0
1 ARS expressed in MXN
FX headwinds
Jul 2017
Sep 2018
(58.2)%
LATIN AMERICA Sales: Ps. 1.40 billion
EBITDA Margin: 25.7%

7
Q3-2018 Results
www.genommalab.com/inversionistas/
Income Tax Expense for the third quarter 2018 reached Ps. 122.9 million as compared
to the Ps. 257.7 million of Income Tax Expense during the third quarter of 2017. The
Ps. 134.8 million variation is due to a lower amount of dividends repatriated from
international operations.
Net Income amounted to Ps. 213.1 million in the third quarter of 2018, compared to a
Ps. 230.5 million net income of majority shareholders in the third quarter of 2017. The
Ps. 17.4 million decrease in Net Income is due to the lower income before income
taxes resulting from the decline in Operating Income. These negative impacts in Net
Income were offset by eliminating minority stockholders in any of the Company’s
subsidiaries, which last year earned Ps. 27.8 million during the third quarter of 2017.
Financial Position
Working Capital was optimized during the quarter and cash conversion cycle was
reduced from 91 days at the end September 2017 to 79 days at the end of September
2018:
Accounts Receivable amounted to Ps. 2.76 billion as of September 30, 2018.
The days of consolidated accounts receivable amounted to 83; a two-day
improvement as compared to September 30, 2017.
Inventories closed at Ps. 1.49 billion as of September 30, 2018. Days of
Inventories amounted to 130; an 8-day increase compared to September 30,
2017.
Trade Payables amounted to Ps. 1.53 billion as of September 30, 2018. As of
the third quarter 2018, Days Payable Outstanding (DPO) increased to 134
days, from 116 days as of September 30, 2017.
Fixed Assets. The Company invested Ps. 344.4 million in the three months ended
September 30, 2018, primarily related to the construction of the Company’s new
manufacturing facility located in the State of Mexico.
Recoverable Taxes. The position is comprised of claims against the tax authorities
relating mostly to VAT (IVA) and income taxes. The position increased by Ps. 186.1
million year-to-date. As compared with the second quarter of 2018, recoverable taxes
for the quarter declined by Ps. 78.6 million.
Net Financial Debt increased slightly during the quarter due to the significant
investments made into the new plant and the resumption of the Company’s share
buyback program:
Cash and Equivalents amounted to Ps. 1.13 billion as of September 30, 2018,
representing a 10.1% year on year increase; primarily due to an improved
collection process.
Gross Financial Debt amounted to Ps. 5.30 billion as of September 30, 2018,
compared to Ps. 4.91 billion as of September 2017; a Ps. 389.2 million
91 9786
76 79
Q3'17 Q4'17 Q1'18 Q2'18 Q3'18
Cash Conversion
Cycle (Days)
Q3'17 Q2'18 Q3'18
Mexico 83 91 99
LatAm 94 77 75
U.S. 57 60 56
Consolidated 85 81 83
Days of Accounts Receivable (DSO)

8
Q3-2018 Results
www.genommalab.com/inversionistas/
increase derived from the proceeds partially obtained from a long-term loan
with the IDB Invest and IFC associated with the investments in the new
manufacturing facility.
Net Financial Debt amounted to Ps. 4.17 billion; a Ps. 286.0 million increase
as compared to September 30, 2017. The Company’s long-term debt
represented 98. 4% of gross financial debt at the end of the third quarter 2018.
Share Buyback Program. During the three months ended on September 30, 2018, the
Company operated its share buyback program, repurchasing 7,226,900 shares
representing a total investment of Ps. 109.6 million.
Free Cash Flow from Operations. Genomma generated Ps. 97.9 million during the first
nine months of 2018. Excluding investments made in the Company’s new
manufacturing facility and brands acquisition, free cash flow would have reached Ps.
937.3 million for the third quarter of 2018.
Key Financial Metrics
Q3-2018
EBITDA / Interest Paid 4.74x
Net Debt / EBITDA 1.63x
Shares Outstanding (as of September 30, 2018) 1,048,000,000
7,916,900 shares re-purchased in the first nine months of 2018,
for a total investment of Ps. 121.1 million

9
Q3-2018 Results
www.genommalab.com/inversionistas/
Q3-2018 Other Relevant Corporate Events
Genomma Lab Announces Management Changes – Mr. Jorge Luis Brake
Valderrama has been appointed as Chief Executive Officer, in line with the
Company’s ongoing long-term strategic and succession planning, effective
September 10, 2018. In addition, Mr. Marco Sparvieri has been named
Executive Vice President of Operations
Sell-side Analyst Coverage
As of the end of September, 2018 LAB B is covered by 13 sell-side analysts at the following
brokerages: Casa de Bolsa Credit Suisse; Banco Itaú BBA; Santander Investment Securities;
BBVA Bancomer.; UBS Casa de Bolsa; Vector Casa de Bolsa; Barclays Bank; BTG Pactual
US Capital; GBM Grupo Bursátil Mexicano.; Grupo Financiero Banorte; HSBC Securities
(USA); Bradesco BBI and JP Morgan Securities.
About Genomma
Genomma Lab Internacional, S.A.B. de C.V. is one of the leading pharmaceutical and personal care products companies in Mexico with an increasing international presence. Genomma Lab develops, sells and markets a broad range of premium branded products, many of which are leaders in the categories in which they compete in terms of sales and market share. Genomma Lab relies on the combination of a successful new product development process, a consumer-oriented marketing, a broad retail distribution network and a low-cost, highly flexible operating model.
Genomma Lab’s shares are listed on the Mexican Stock Exchange under the ticker “LAB B” (Bloomberg: LABB:MM).
Note on Forward-Looking Statements This report may contain certain forward-looking statements and information relating to the Company that reflect the current views and/or expectations of the Company and its management with respect to its performance, business and future events. Forward looking statements include, without limitation, any statement that may predict, forecast, indicate or imply future results, performance or achievements, and may contain words like “believe,” “anticipate,” “expect,” “envisages,” “will likely result,” or any other words or phrases of similar meaning. Such statements are subject to a number of risks, uncertainties and assumptions. We caution you that a number of important factors could cause actual results to differ materially from the plans, objectives, expectations, estimates and intentions expressed in this presentation and in oral statements made by authorized officers of the Company. Readers are cautioned not to place undue reliance on these forward-looking statements, which speak only as of their dates. The Company undertakes no obligation to update or revise any forward-looking statements, whether as a result of new information, future events or otherwise.
Contact Information:
Enrique González, Head of IR
Tel: +52 (55) 5081-0000
CONFERENCE CALL
Q3-2018
Thursday, October 25 2018
at 12:00 p.m. ET /
11:00 a.m. CST
Led by:
Jorge Luis Brake
CEO
Antonio Zamora
CFO
Enrique González
IRO
Webcast:
Genomma Lab Q3 ’18 Results Call
To participate, please dial-in:
United States:
+1 877-407-8031
International:
+1 201-689-8031
Barbara Cano, InspIR Group
Tel: +1 (646) 452-2334

10
Q3-2018 Results
www.genommalab.com/inversionistas/
Thousands of Mexican pesos
2018 % Sales 2017 % Sales 2018 % Sales 2017 % Sales
Net Sales 3,020,553 100.0% 3,079,518 100.0% 9,145,314 100.0% 9,193,233 100.0%
Cost of goods sold 999,635 33.1% 991,197 32.2% 3,041,499 33.3% 2,869,952 31.2%
Gross Profit 2,020,918 66.9% 2,088,321 67.8% 6,103,815 66.7% 6,323,281 68.8%
Selling, general and administrative expenses 1,413,183 46.8% 1,399,845 45.5% 4,205,714 46.0% 4,346,792 47.3%
Other expenses 7,044 0.2% 7,035 0.2% 21,887 0.2% 46,109 0.5%
Other income 20,300 0.7% 21,858 0.7% 65,957 0.7% 56,721 0.6%
EBITDA 620,991 20.6% 703,299 22.8% 1,942,171 21.2% 1,987,101 21.6%
Depreciation and amortization 17,095 0.6% 15,772 0.5% 50,790 0.6% 51,612 0.6%
Income from operations 603,896 20.0% 687,527 22.3% 1,891,381 20.7% 1,935,489 21.1%
Interest expense (149,934) (5.0)% (138,400) (4.5)% (394,509) (4.3)% (339,458) (3.7)%
Interest income 5,916 0.2% 10,387 0.3% 25,980 0.3% 28,371 0.3%
Exchange (expense) income (141,995) (4.7)% (46,326) (1.5)% (239,670) (2.6)% (90,774) (1.0)%
Comprehensive financing income (cost) (286,013) (9.5)% (174,339) (5.7)% (608,199) (6.7)% (401,861) (4.4)%
Associated company 18,079 0.6% 2,925 0.1% 34,174 0.4% 17,018 0.2%
Income before income taxes 335,962 11.1% 516,113 16.8% 1,317,356 14.4% 1,550,646 16.9%
Income tax expense 122,909 4.1% 257,753 8.4% 426,612 4.7% 530,321 5.8%
Consolidated net income 213,053 7.1% 258,360 8.4% 890,744 9.7% 1,020,325 11.1%
Net income of minority stockholders - 0.0% 27,843 0.9% - 0.0% 79,754 0.9%
Net income of majority stockholders 213,053 7.1% 230,517 7.5% 890,744 9.7% 940,571 10.2%
THIRD QUARTER ACCUMULATED
GENOMMA LAB INTERNACIONAL, S.A.B. DE C.V. AND SUBSIDIARIES
CONSOLIDATED STATEMENT OF COMPREHENSIVE INCOME
For the three and nine months ended September 30, 2018 and 2017

11
Q3-2018 Results
www.genommalab.com/inversionistas/
GENOMMA LAB INTERNACIONAL, S.A.B. DE C.V. AND SUBSIDIARIES
CONSOLIDATED STATEMENT OF FINANCIAL POSITION
Thousands of Mexican pesos
As of
December 31,
2018 2017
ASSETS
CURRENT ASSETS
Cash and equivalents and restricted fund 1,128,873 1,025,684 1,092,741
Clients - Net 2,764,848 2,824,796 2,745,173
Recoverable Taxes 1,502,058 1,315,999 1,385,360
Other accounts receivable 997,361 1,018,147 875,085
Inventory - Net 1,490,160 1,360,307 1,264,211
Prepaid expenses 843,591 545,173 478,069
Total current assets 8,726,891 8,090,106 7,840,639
Non-current assets
Trademarks 5,189,663 5,065,826 5,149,632
Investment in shares 1,525,846 1,437,498 1,472,805
Building, properties and equipment – Net 1,149,171 356,498 548,649
Deferred income tax 503,859 666,110 681,992
Deferred assets and others 210,713 251,274 191,989 843,591
Total non-current assets 8,579,252 7,777,206 8,045,067
TOTAL ASSETS 17,306,143 15,867,312 15,885,706
LIABILITIES AND STOCKHOLDERS' EQUITY
Current Liabilities
Current portion of long-term debt 85,428 3,201,451 3,013,055
Suppliers 1,534,980 1,290,817 1,098,471
Due to related parties 7,803 4,963 1,238
Other current liabilities 1,703,634 1,920,356 1,852,869
Income tax payable 262,729 300,202 336,373
Statutory employee profit sharing 2,360 2,290 3,017
Total current liabilities 3,596,934 6,720,079 6,305,023
Non-current liabilities
Long-term debt securities 3,926,479 1,499,559 1,500,000
Long-term loans with financial institutions 1,287,395 209,060 190,054
Other long term liabilities 36,645 33,738 36,422
Deferred income tax 51,135 1,613 1,692
Employee retirement obligations 11,331 3,848 3,848
Payable dividends to shareholders 800,000 800,000 800,000
Total liabilities 9,709,919 9,267,897 8,837,039
Stockholders' equity
Capital stock 1,914,306 1,914,306 1,914,306
Retained earnings 5,993,327 4,714,121 4,714,121
Net income 890,744 940,571 1,279,206
Cumulative translation effects of foreing subsidiaries 105,327 200,958 332,609
Share buy back fund (871,044) (1,657,060) (1,660,094)
Share-based payments 226,869 226,869 226,869
Net premium in placement of repurchased shares (663,305) 39,749 39,749
Minority interest - 219,901 201,901
Total stockholders' equity 7,596,224 6,599,415 7,048,667
TOTAL EQUITY AND LIABILITIES 17,306,143 15,867,312 15,885,706
As of
September 30,
2017

12
Q3-2018 Results
www.genommalab.com/inversionistas/
GENOMMA LAB INTERNACIONAL, S.A.B. DE C.V. AND SUBSIDIARIES
CONSOLIDATED STATEMENT OF CASH FLOWS
For the three months ended September 30, 2018
Thousands of Mexican pesos 2018
Cash and cash equivalents beginning of period 1,187,029
Consolidated Net Income 213,054
Charges to results with no cash flow:
Depreciation and amortization 18,476
Income tax 122,909
Accrued interest and others 125,836
480,275
Changes in Working Capital:
Clients - Net (50,539)
Recoverable taxes (101,093)
Inventories (291,718)
Suppliers 276,144
Other current assets 148,577
Paid income tax (117,509)
Other current liabilities (38,750)
(174,888)
Net cash generated (used) in operating activities 305,387
Investing activities:
Investment in fixed assets (307,591)
Sales of equipment 566
Brand acquisitions and others (17,867)
Disposals of assets available for sale 84,963
Other assets acquisitions (93,396)
Net cash generated (used) in investing activities (352,192)
Financing activities:
Payments of borrowings with financial institutions (369,005)
Loans with financial and securities institutions 737,357
Interest paid (124,212)
Stock repurchase (110,266)
Net cash used in financing activities 133,874
Net increase in cash and cash equivalents before foreign exchange
adjustments coming from international operations and inflationary
affects cash 87,069
(145,225)
Accumulated cash flow at the end of the period 1,128,873
Less - restricted fund 23,269
Cash and cash equivalents at end of period balance for operation 1,105,604
Foreign exchange and inflationary effects from international
operations