genuine parts 4q20 earnings presentation
TRANSCRIPT
Genuine Parts 4Q20 Earnings PresentationFebruary 17, 2021
2GPC 4Q20 EARNINGS PRESENTATION |
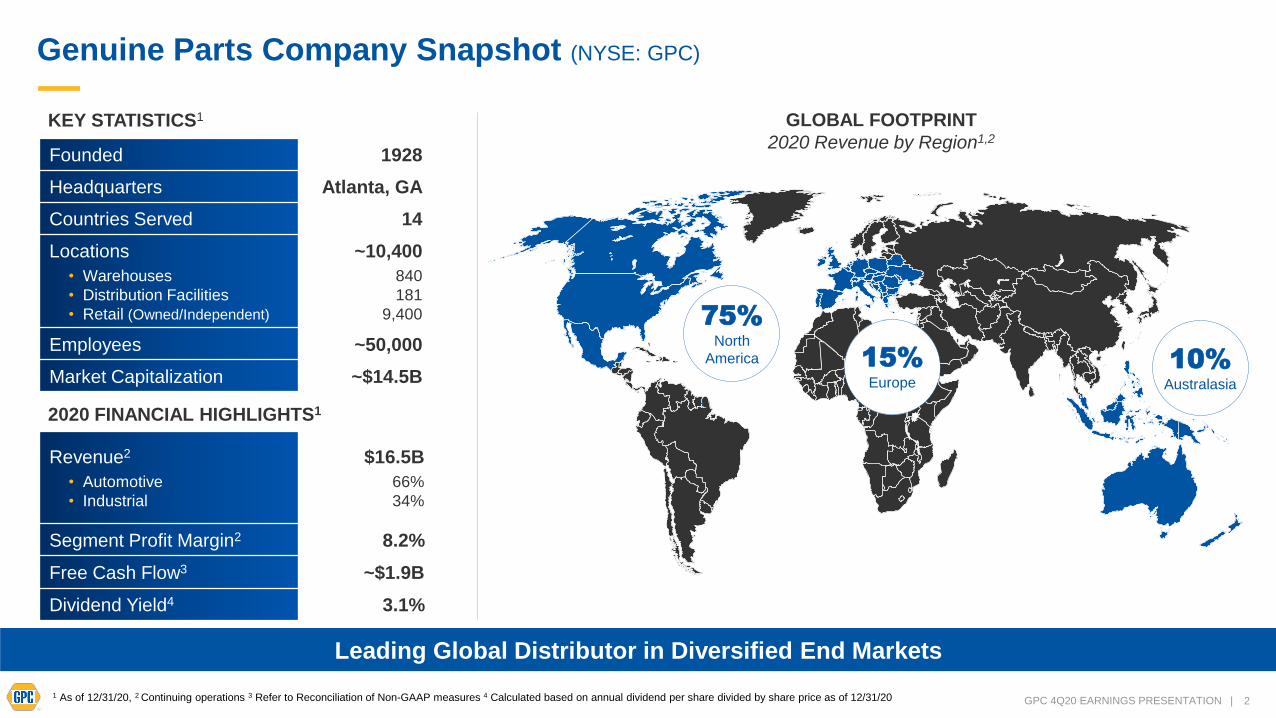
Genuine Parts Company Snapshot (NYSE: GPC)
Leading Global Distributor in Diversified End Markets
GLOBAL FOOTPRINT
2020 Revenue by Region1,2
KEY STATISTICS1
Founded 1928
Headquarters Atlanta, GA
Countries Served 14
Locations
• Warehouses
• Distribution Facilities
• Retail (Owned/Independent)
~10,400
840
181
9,400
Employees ~50,000
Market Capitalization ~$14.5B
2020 FINANCIAL HIGHLIGHTS1
Revenue2
• Automotive
• Industrial
$16.5B
66%
34%
Segment Profit Margin2 8.2%
Free Cash Flow3 ~$1.9B
Dividend Yield4 3.1%
75%North
America 10%Australasia
15%Europe
1 As of 12/31/20, 2 Continuing operations 3 Refer to Reconciliation of Non-GAAP measures 4 Calculated based on annual dividend per share divided by share price as of 12/31/20
3GPC 4Q20 EARNINGS PRESENTATION |
Safe Harbor Statement
FORWARD-LOOKING STATEMENTS: Some of the comments made during this conference call and information contained in our presentation constitute forward-looking statements that are
subject to the safe harbor provisions of the Private Securities Litigation Reform Act of 1995. All statements in the future tense and all statements accompanied by words such as “expect,”
“likely,” “outlook,” “forecast,” “preliminary,” “would,” “could,” “should,”, “position”, “will,” “project,” “intend,” “plan,” “on track,” “anticipate,” “to come,” “may,” “possible,” “assume,” and variations of
such words and similar expressions are intended to identify such forward-looking statements. These forward-looking statements include, without limitation, our expected ability to operate and
protect our workforce during the COVID-19 pandemic, our strategies for growing our automotive and industrial businesses, the execution and effect of our cost savings initiatives, our efforts
and initiatives to help us emerge from the pandemic well-positioned, our ongoing efforts to maintain compliance and flexibility under our debt covenants, our liquidity position and actions to
maximize cash flow to continue to operate during these highly uncertain times and plans for future cost savings. The Company cautions that its forward-looking statements involve risks and
uncertainties, and while we believe that our expectations for the future are reasonable in view of currently available information, you are cautioned not to place undue reliance on our forward-
looking statements. Actual results or events may differ materially from those indicated as a result of various important factors. Such factors may include, among other things, the extent and
duration of the disruption to our business operations caused by the global health crisis associated with the COVID-19 outbreak, including the effects on the financial health of our business
partners and customers, on supply chains and our suppliers, on vehicle miles driven as well as other metrics that affect our business, and on access to capital and liquidity provided by the
financial and capital markets; the Company’s ability to maintain compliance with its debt covenants; the Company's ability to successfully integrate acquired businesses into the Company and
to realize the anticipated synergies and benefits; the Company's ability to successfully divest businesses and realize the expected benefits of those divestitures; the Company's ability to
successfully implement its business initiatives in its two business segments; changes in demand for the Company's products; the ability to maintain favorable supplier arrangements and
relationships; disruptions in our suppliers' operations, including the impact of COVID-19 on our suppliers as well as our supply chain; changes in national and international legislation or
government regulations or policies, including changes to import tariffs, short term government subsidies, and the unpredictability of such changes and their impact to the Company and its
suppliers and customers, data security policies and requirements as well as privacy legislation; changes in general economic conditions, including unemployment, inflation (including the impact
of tariffs) or deflation and the United Kingdom's exit from the European Union and the unpredictability of the impact following such exit; changes in tax laws, regulations, treaties and policies,
including the interpretation and enforcement of any of the foregoing; volatile exchange rates; volatility in oil prices; significant cost increases, such as rising fuel and freight expenses; the
Company's ability to successfully attract and retain employees in the current labor market; uncertain credit markets and other macroeconomic conditions; competitive product, service and
pricing pressures; failure or weakness in our disclosure controls and procedures and internal controls over financial reporting, including as a result of the work from home environment; the
uncertainties and costs of litigation; disruptions caused by a failure or breach of the Company's information systems, and the other risks and uncertainties discussed in the Company’s latest
SEC filings. The statements are only as of the date they are made, and the Company undertakes no duty to update its forward-looking statements made during this presentation or in these
materials except as required by law. Actual results may vary materially and, as such, you are cautioned not to place undue reliance on these forward-looking statements.
NON-GAAP MEASURES: This presentation contains adjusted net income from continuing operations, adjusted diluted earnings per share from continuing operations, adjusted tax rate,
adjusted gross profit, adjusted operating and non-operating expenses, net sales excluding divestitures, segment profit excluding divestitures, segment profit margin excluding divestitures, and
free cash flow, which are financial measures that are not derived in accordance with United States generally accepted accounting principles ("GAAP"). The Company considers these non-
GAAP measures useful to investors because they provide greater transparency into management’s view and assessment of the Company’s core operating performance. These measures are
widely used by analysts, investors and competitors in our industry, although our calculation of the measure may not be comparable to similar measures disclosed by other companies, because
not all companies and analysts calculate these measures in the same manner. The Company does not, nor does it suggest investors should, consider non-GAAP financial measures superior
to, in isolation from, or as a substitute for, GAAP financial information. The Company has included reconciliations of this additional information to the most comparable GAAP measure in the
appendix of this presentation.

4GPC 4Q20 EARNINGS PRESENTATION |
4Q20 HighlightsPaul DonahueChairman & CEO
5GPC 4Q20 EARNINGS PRESENTATION |
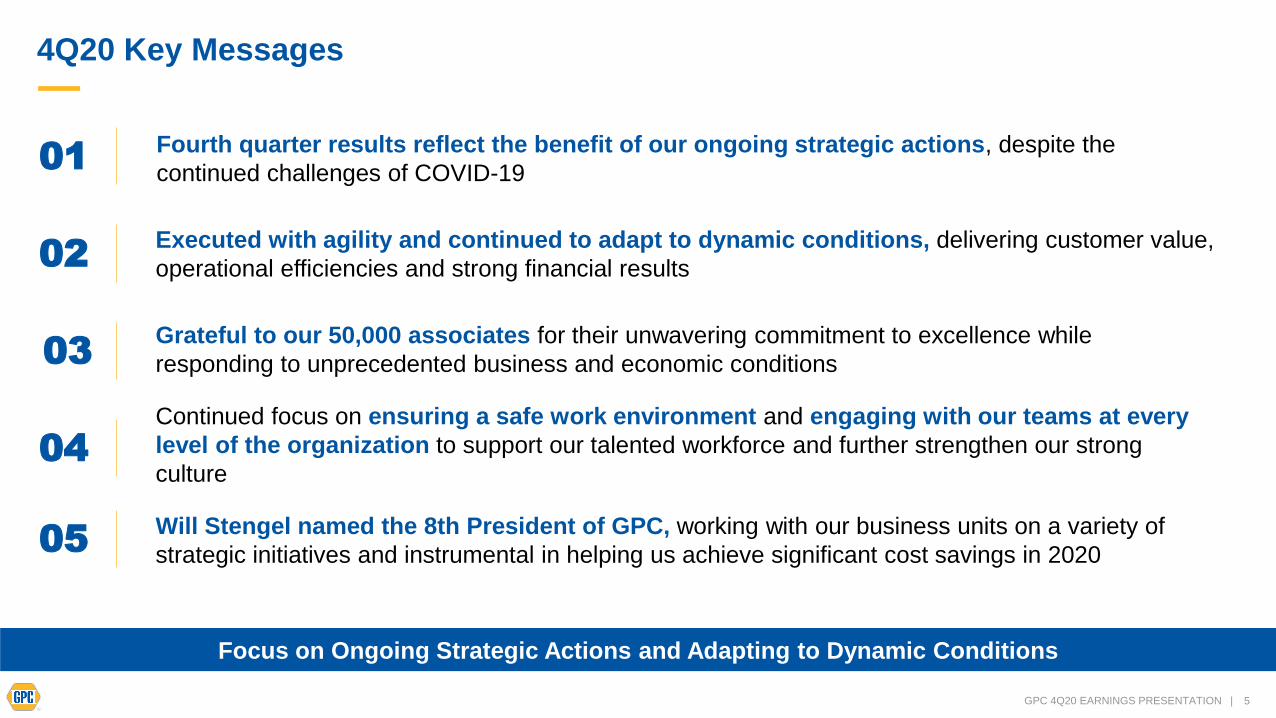
4Q20 Key Messages
Focus on Ongoing Strategic Actions and Adapting to Dynamic Conditions
01
Executed with agility and continued to adapt to dynamic conditions, delivering customer value,
operational efficiencies and strong financial results
03
Continued focus on ensuring a safe work environment and engaging with our teams at every
level of the organization to support our talented workforce and further strengthen our strong
culture
02
Grateful to our 50,000 associates for their unwavering commitment to excellence while
responding to unprecedented business and economic conditions
04
Will Stengel named the 8th President of GPC, working with our business units on a variety of
strategic initiatives and instrumental in helping us achieve significant cost savings in 202005
Fourth quarter results reflect the benefit of our ongoing strategic actions, despite the
continued challenges of COVID-19
6GPC 4Q20 EARNINGS PRESENTATION |
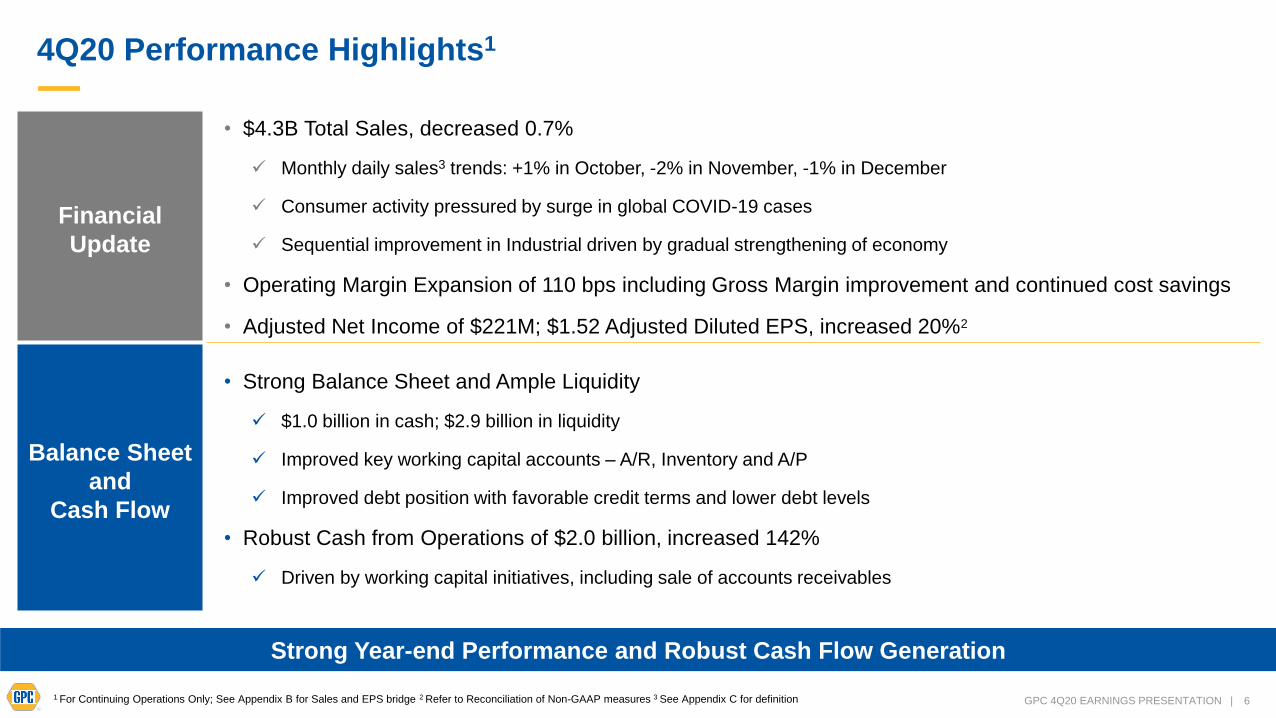
4Q20 Performance Highlights1
Strong Year-end Performance and Robust Cash Flow Generation
1 For Continuing Operations Only; See Appendix B for Sales and EPS bridge 2 Refer to Reconciliation of Non-GAAP measures 3 See Appendix C for definition
Financial
Update
• $4.3B Total Sales, decreased 0.7%
✓ Monthly daily sales3 trends: +1% in October, -2% in November, -1% in December
✓ Consumer activity pressured by surge in global COVID-19 cases
✓ Sequential improvement in Industrial driven by gradual strengthening of economy
• Operating Margin Expansion of 110 bps including Gross Margin improvement and continued cost savings
• Adjusted Net Income of $221M; $1.52 Adjusted Diluted EPS, increased 20%2
Balance Sheet
and
Cash Flow
• Strong Balance Sheet and Ample Liquidity
✓ $1.0 billion in cash; $2.9 billion in liquidity
✓ Improved key working capital accounts – A/R, Inventory and A/P
✓ Improved debt position with favorable credit terms and lower debt levels
• Robust Cash from Operations of $2.0 billion, increased 142%
✓ Driven by working capital initiatives, including sale of accounts receivables
7GPC 4Q20 EARNINGS PRESENTATION |
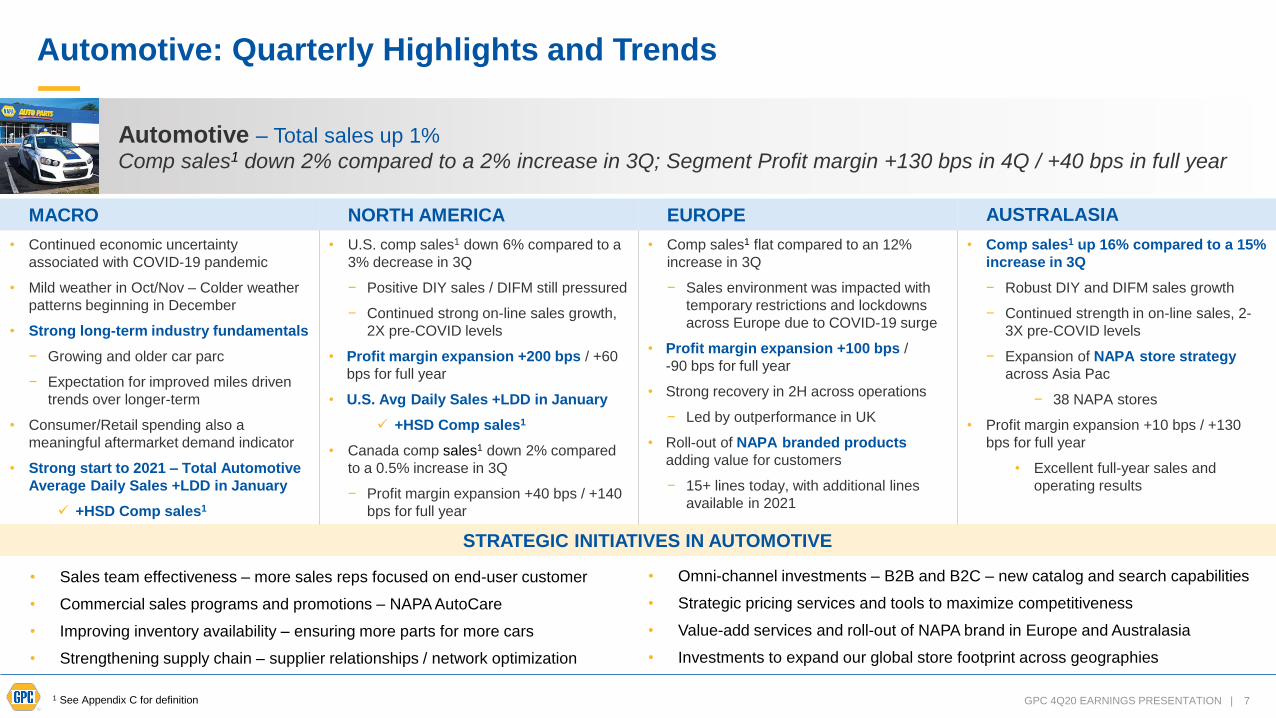
Automotive: Quarterly Highlights and Trends
1 See Appendix C for definition
Automotive – Total sales up 1%
Comp sales1 down 2% compared to a 2% increase in 3Q; Segment Profit margin +130 bps in 4Q / +40 bps in full year
MACRO NORTH AMERICA EUROPE AUSTRALASIA
• Continued economic uncertainty
associated with COVID-19 pandemic
• Mild weather in Oct/Nov – Colder weather
patterns beginning in December
• Strong long-term industry fundamentals
− Growing and older car parc
− Expectation for improved miles driven
trends over longer-term
• Consumer/Retail spending also a
meaningful aftermarket demand indicator
• Strong start to 2021 – Total Automotive
Average Daily Sales +LDD in January
✓ +HSD Comp sales1
• U.S. comp sales1 down 6% compared to a
3% decrease in 3Q
− Positive DIY sales / DIFM still pressured
− Continued strong on-line sales growth,
2X pre-COVID levels
• Profit margin expansion +200 bps / +60
bps for full year
• U.S. Avg Daily Sales +LDD in January
✓ +HSD Comp sales1
• Canada comp sales1 down 2% compared
to a 0.5% increase in 3Q
− Profit margin expansion +40 bps / +140
bps for full year
• Comp sales1 flat compared to an 12%
increase in 3Q
− Sales environment was impacted with
temporary restrictions and lockdowns
across Europe due to COVID-19 surge
• Profit margin expansion +100 bps /
-90 bps for full year
• Strong recovery in 2H across operations
− Led by outperformance in UK
• Roll-out of NAPA branded products
adding value for customers
− 15+ lines today, with additional lines
available in 2021
• Comp sales1 up 16% compared to a 15%
increase in 3Q
− Robust DIY and DIFM sales growth
− Continued strength in on-line sales, 2-
3X pre-COVID levels
− Expansion of NAPA store strategy
across Asia Pac
− 38 NAPA stores
• Profit margin expansion +10 bps / +130
bps for full year
• Excellent full-year sales and
operating results
STRATEGIC INITIATIVES IN AUTOMOTIVE
• Sales team effectiveness – more sales reps focused on end-user customer
• Commercial sales programs and promotions – NAPA AutoCare
• Improving inventory availability – ensuring more parts for more cars
• Strengthening supply chain – supplier relationships / network optimization
• Omni-channel investments – B2B and B2C – new catalog and search capabilities
• Strategic pricing services and tools to maximize competitiveness
• Value-add services and roll-out of NAPA brand in Europe and Australasia
• Investments to expand our global store footprint across geographies
8GPC 4Q20 EARNINGS PRESENTATION |
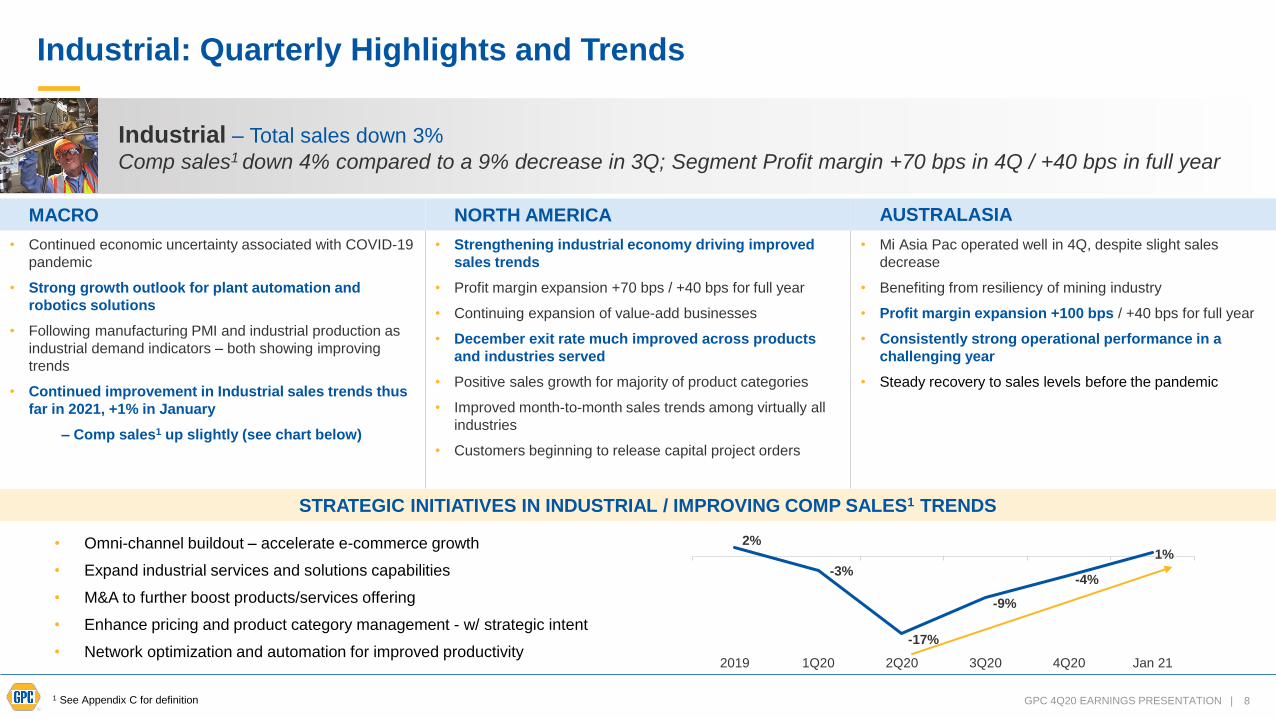
Industrial: Quarterly Highlights and Trends
1 See Appendix C for definition
Industrial – Total sales down 3%
Comp sales1 down 4% compared to a 9% decrease in 3Q; Segment Profit margin +70 bps in 4Q / +40 bps in full year
MACRO NORTH AMERICA AUSTRALASIA
• Continued economic uncertainty associated with COVID-19
pandemic
• Strong growth outlook for plant automation and
robotics solutions
• Following manufacturing PMI and industrial production as
industrial demand indicators – both showing improving
trends
• Continued improvement in Industrial sales trends thus
far in 2021, +1% in January
– Comp sales1 up slightly (see chart below)
• Strengthening industrial economy driving improved
sales trends
• Profit margin expansion +70 bps / +40 bps for full year
• Continuing expansion of value-add businesses
• December exit rate much improved across products
and industries served
• Positive sales growth for majority of product categories
• Improved month-to-month sales trends among virtually all
industries
• Customers beginning to release capital project orders
• Mi Asia Pac operated well in 4Q, despite slight sales
decrease
• Benefiting from resiliency of mining industry
• Profit margin expansion +100 bps / +40 bps for full year
• Consistently strong operational performance in a
challenging year
• Steady recovery to sales levels before the pandemic
STRATEGIC INITIATIVES IN INDUSTRIAL / IMPROVING COMP SALES1 TRENDS
• Omni-channel buildout – accelerate e-commerce growth
• Expand industrial services and solutions capabilities
• M&A to further boost products/services offering
• Enhance pricing and product category management - w/ strategic intent
• Network optimization and automation for improved productivity
2%
-3%
-17%
-9%
-4%
1%
2019 1Q20 2Q20 3Q20 4Q20 Jan 21
9GPC 4Q20 EARNINGS PRESENTATION |
Engrained ESG Best Practices Throughout Organization
Responsibility to innovate and provide for our environment, our
employees and the communities in which we operate
ESG practices, such as human capital management and diversity and
inclusion, discussed in 2020 Corporate Sustainability Report
Adoption of Human Rights Policy, communicating the Company’s
commitment to upholding human rights
GPC expects it suppliers, partners and affiliates to also respect
human rights
Company-wide commitment to sustainability integral to corporate
growth strategy
Commitment to Sustainability and ESG Best Practices

10GPC 4Q20 EARNINGS PRESENTATION |
Introduction and Focus AreasWill StengelPresident
11GPC 4Q20 EARNINGS PRESENTATION |
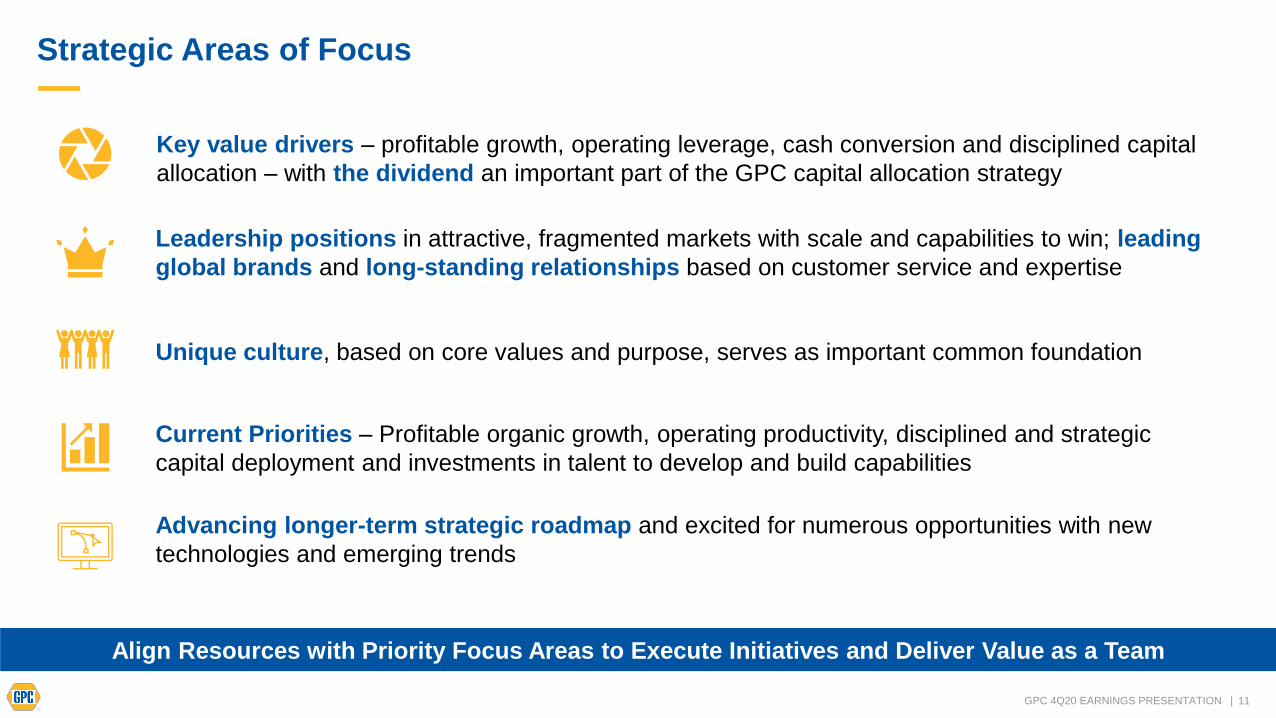
Strategic Areas of Focus
Align Resources with Priority Focus Areas to Execute Initiatives and Deliver Value as a Team
Advancing longer-term strategic roadmap and excited for numerous opportunities with new
technologies and emerging trends
Unique culture, based on core values and purpose, serves as important common foundation
Leadership positions in attractive, fragmented markets with scale and capabilities to win; leading
global brands and long-standing relationships based on customer service and expertise
Current Priorities – Profitable organic growth, operating productivity, disciplined and strategic
capital deployment and investments in talent to develop and build capabilities
Key value drivers – profitable growth, operating leverage, cash conversion and disciplined capital
allocation – with the dividend an important part of the GPC capital allocation strategy
12GPC 4Q20 EARNINGS PRESENTATION |
4Q20 Financial PerformanceCarol YanceyEVP and CFO
13GPC 4Q20 EARNINGS PRESENTATION |
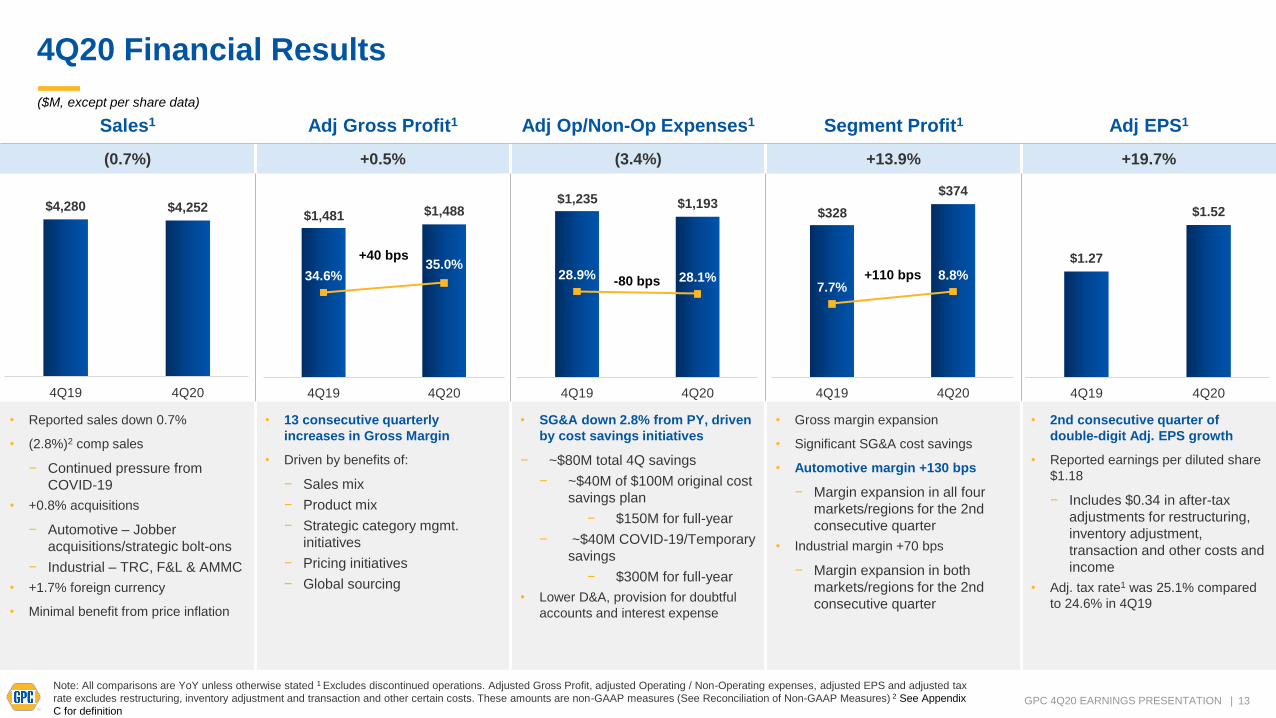
4Q20 Financial Results
Sales1 Adj Gross Profit1 Adj Op/Non-Op Expenses1 Segment Profit1 Adj EPS1
(0.7%) +0.5% (3.4%) +13.9% +19.7%
• Reported sales down 0.7%
• (2.8%)2 comp sales
− Continued pressure from
COVID-19
• +0.8% acquisitions
− Automotive – Jobber
acquisitions/strategic bolt-ons
− Industrial – TRC, F&L & AMMC
• +1.7% foreign currency
• Minimal benefit from price inflation
• 13 consecutive quarterly
increases in Gross Margin
• Driven by benefits of:
− Sales mix
− Product mix
− Strategic category mgmt.
initiatives
− Pricing initiatives
− Global sourcing
• SG&A down 2.8% from PY, driven
by cost savings initiatives
− ~$80M total 4Q savings
− ~$40M of $100M original cost
savings plan
− $150M for full-year
− ~$40M COVID-19/Temporary
savings
− $300M for full-year
• Lower D&A, provision for doubtful
accounts and interest expense
• Gross margin expansion
• Significant SG&A cost savings
• Automotive margin +130 bps
− Margin expansion in all four
markets/regions for the 2nd
consecutive quarter
• Industrial margin +70 bps
− Margin expansion in both
markets/regions for the 2nd
consecutive quarter
• 2nd consecutive quarter of
double-digit Adj. EPS growth
• Reported earnings per diluted share
$1.18
− Includes $0.34 in after-tax
adjustments for restructuring,
inventory adjustment,
transaction and other costs and
income
• Adj. tax rate1 was 25.1% compared
to 24.6% in 4Q19
$4,280 $4,252
4Q19 4Q20
($M, except per share data)
$1,481 $1,488
34.6%35.0%
31.0%
32.0%
33.0%
34.0%
35.0%
36.0%
37.0%
38.0%
39.0%
40.0%
$1,200
$1,250
$1,300
$1,350
$1,400
$1,450
$1,500
$1,550
$1,600
4Q19 4Q20
+40 bps
$1,235 $1,193
28.9% 28.1%
0.0%
1.0%
2.0%
3.0%
4.0%
5.0%
6.0%
7.0%
8.0%
9.0%
10.0%
11.0%
12.0%
13.0%
14.0%
15.0%
16.0%
17.0%
18.0%
19.0%
20.0%
21.0%
22.0%
23.0%
24.0%
25.0%
26.0%
27.0%
28.0%
29.0%
30.0%
31.0%
32.0%
33.0%
34.0%
35.0%
36.0%
37.0%
38.0%
39.0%
40.0%
41.0%
42.0%
43.0%
44.0%
45.0%
46.0%
47.0%
48.0%
49.0%
50.0%
51.0%
52.0%
53.0%
54.0%
55.0%
56.0%
57.0%
58.0%
59.0%
60.0%
61.0%
62.0%
63.0%
64.0%
65.0%
66.0%
67.0%
68.0%
69.0%
70.0%
$0
$200
$400
$600
$800
$1,000
$1,200
$1,400
4Q19 4Q20
-80 bps
$328
$374
7.7%8.8%
1.0%
2.0%
3.0%
4.0%
5.0%
6.0%
7.0%
8.0%
9.0%
10.0%
11.0%
12.0%
13.0%
14.0%
15.0%
16.0%
17.0%
18.0%
19.0%
20.0%
$0
$50
$100
$150
$200
$250
$300
$350
$400
$450
4Q19 4Q20
+110 bps
Note: All comparisons are YoY unless otherwise stated 1 Excludes discontinued operations. Adjusted Gross Profit, adjusted Operating / Non-Operating expenses, adjusted EPS and adjusted tax
rate excludes restructuring, inventory adjustment and transaction and other certain costs. These amounts are non-GAAP measures (See Reconciliation of Non-GAAP Measures) 2 See Appendix
C for definition
$1.27
$1.52
4Q19 4Q20
14GPC 4Q20 EARNINGS PRESENTATION |
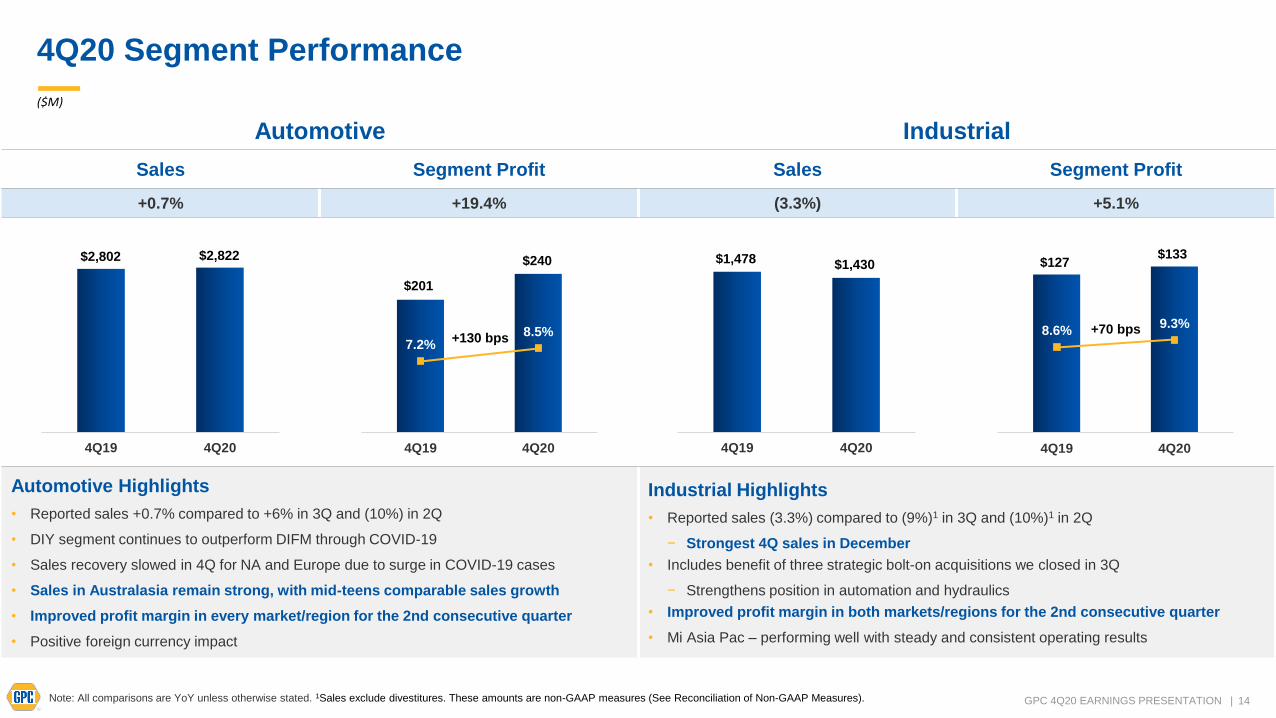
4Q20 Segment Performance
($M)
Note: All comparisons are YoY unless otherwise stated. 1Sales exclude divestitures. These amounts are non-GAAP measures (See Reconciliation of Non-GAAP Measures).
Automotive Industrial
Sales Segment Profit Sales Segment Profit
+0.7% +19.4% (3.3%) +5.1%
Automotive Highlights
• Reported sales +0.7% compared to +6% in 3Q and (10%) in 2Q
• DIY segment continues to outperform DIFM through COVID-19
• Sales recovery slowed in 4Q for NA and Europe due to surge in COVID-19 cases
• Sales in Australasia remain strong, with mid-teens comparable sales growth
• Improved profit margin in every market/region for the 2nd consecutive quarter
• Positive foreign currency impact
Industrial Highlights
• Reported sales (3.3%) compared to (9%)1 in 3Q and (10%)1 in 2Q
− Strongest 4Q sales in December
• Includes benefit of three strategic bolt-on acquisitions we closed in 3Q
− Strengthens position in automation and hydraulics
• Improved profit margin in both markets/regions for the 2nd consecutive quarter
• Mi Asia Pac – performing well with steady and consistent operating results
4Q19 4Q20
$2,802 $2,822
7.2%8.5%
0.0%
2.0%
4.0%
6.0%
8.0%
10.0%
12.0%
14.0%
16.0%
18.0%
20.0%
$0
$50
$100
$150
$200
$250
$300
4Q19 4Q20
$201
$240
4Q19 4Q20
$1,478 $1,430
8.6%9.3%
0.0%
2.0%
4.0%
6.0%
8.0%
10.0%
12.0%
14.0%
16.0%
18.0%
20.0%
$0
$20
$40
$60
$80
$100
$120
$140
$160
4Q19 4Q20
$127$133
+130 bps+70 bps
15GPC 4Q20 EARNINGS PRESENTATION |
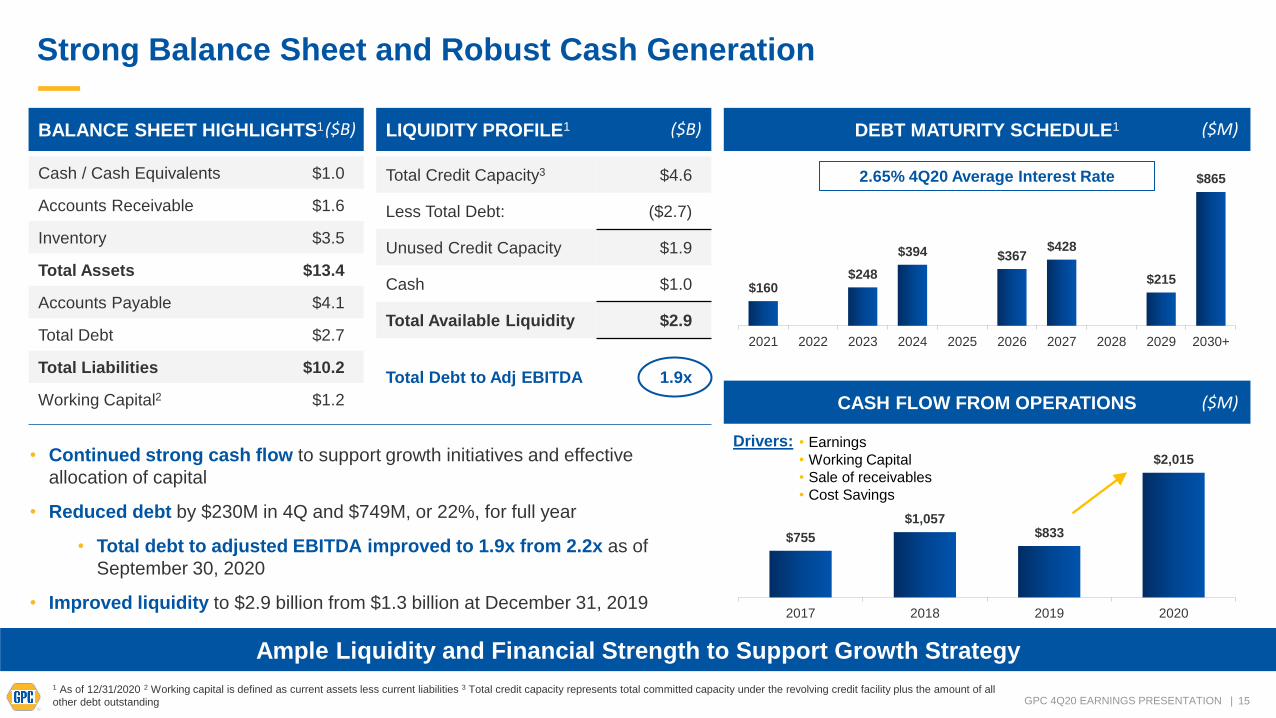
Strong Balance Sheet and Robust Cash Generation
• Continued strong cash flow to support growth initiatives and effective
allocation of capital
• Reduced debt by $230M in 4Q and $749M, or 22%, for full year
• Total debt to adjusted EBITDA improved to 1.9x from 2.2x as of
September 30, 2020
• Improved liquidity to $2.9 billion from $1.3 billion at December 31, 2019
DEBT MATURITY SCHEDULE1BALANCE SHEET HIGHLIGHTS1 LIQUIDITY PROFILE1
Cash / Cash Equivalents $1.0
Accounts Receivable $1.6
Inventory $3.5
Total Assets $13.4
Accounts Payable $4.1
Total Debt $2.7
Total Liabilities $10.2
Working Capital2 $1.2
$160$248
$394 $367$428
$215
$865
2021 2022 2023 2024 2025 2026 2027 2028 2029 2030+
Ample Liquidity and Financial Strength to Support Growth Strategy
2.65% 4Q20 Average Interest Rate
($B)
1 As of 12/31/2020 2 Working capital is defined as current assets less current liabilities 3 Total credit capacity represents total committed capacity under the revolving credit facility plus the amount of all
other debt outstanding
Total Credit Capacity3 $4.6
Less Total Debt: ($2.7)
Unused Credit Capacity $1.9
Cash $1.0
Total Available Liquidity $2.9
Total Debt to Adj EBITDA 1.9x
($B) ($M)
$755
$1,057$833
$2,015
2017 2018 2019 2020
CASH FLOW FROM OPERATIONS
Drivers: • Earnings
• Working Capital
• Sale of receivables
• Cost Savings
($M)
16GPC 4Q20 EARNINGS PRESENTATION |
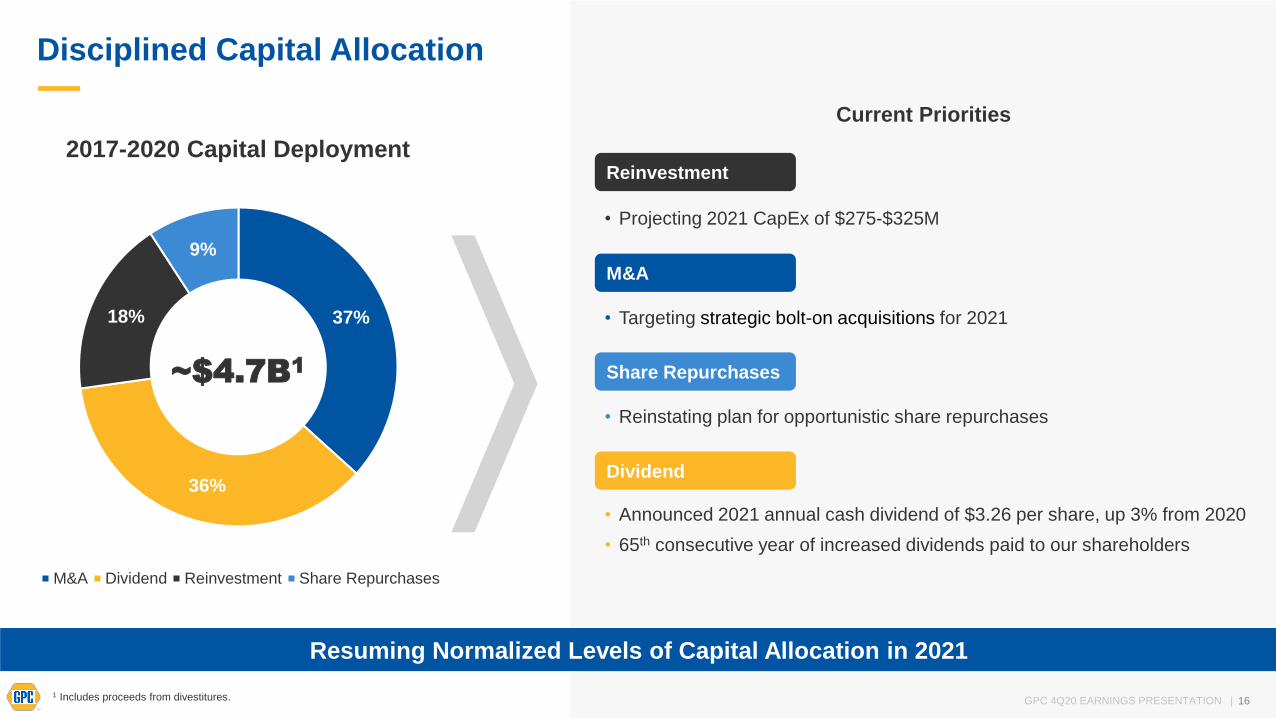
Disciplined Capital Allocation
Resuming Normalized Levels of Capital Allocation in 2021
37%
36%
18%
9%
M&A Dividend Reinvestment Share Repurchases
2017-2020 Capital Deployment
16
Current Priorities
Dividend
• Announced 2021 annual cash dividend of $3.26 per share, up 3% from 2020
• 65th consecutive year of increased dividends paid to our shareholders
Reinvestment
• Projecting 2021 CapEx of $275-$325M
M&A
• Targeting strategic bolt-on acquisitions for 2021
Share Repurchases
• Reinstating plan for opportunistic share repurchases
1 Includes proceeds from divestitures.
~$4.7B1
17GPC 4Q20 EARNINGS PRESENTATION |
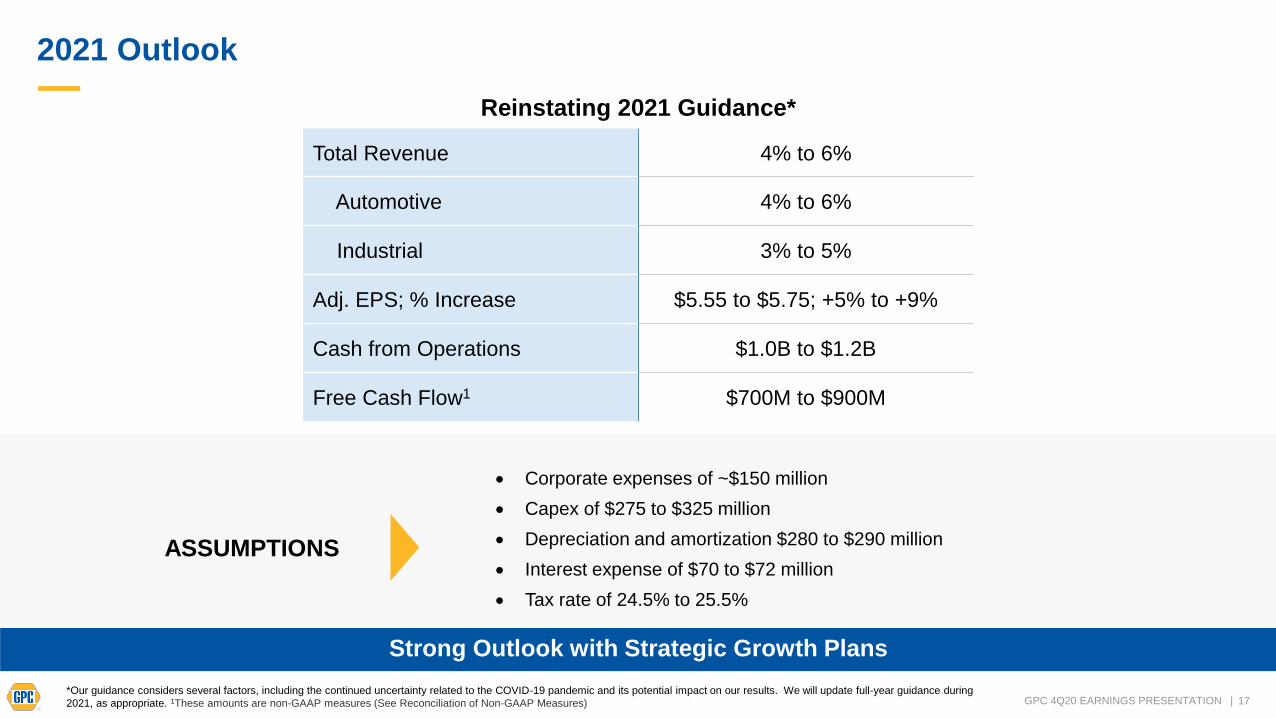
2021 Outlook
Reinstating 2021 Guidance*
Total Revenue 4% to 6%
Automotive 4% to 6%
Industrial 3% to 5%
Adj. EPS; % Increase $5.55 to $5.75; +5% to +9%
Cash from Operations $1.0B to $1.2B
Free Cash Flow1 $700M to $900M
• Corporate expenses of ~$150 million
• Capex of $275 to $325 million
• Depreciation and amortization $280 to $290 million
• Interest expense of $70 to $72 million
• Tax rate of 24.5% to 25.5%
ASSUMPTIONS
*Our guidance considers several factors, including the continued uncertainty related to the COVID-19 pandemic and its potential impact on our results. We will update full-year guidance during
2021, as appropriate. 1These amounts are non-GAAP measures (See Reconciliation of Non-GAAP Measures)
Strong Outlook with Strategic Growth Plans
18GPC 4Q20 EARNINGS PRESENTATION |
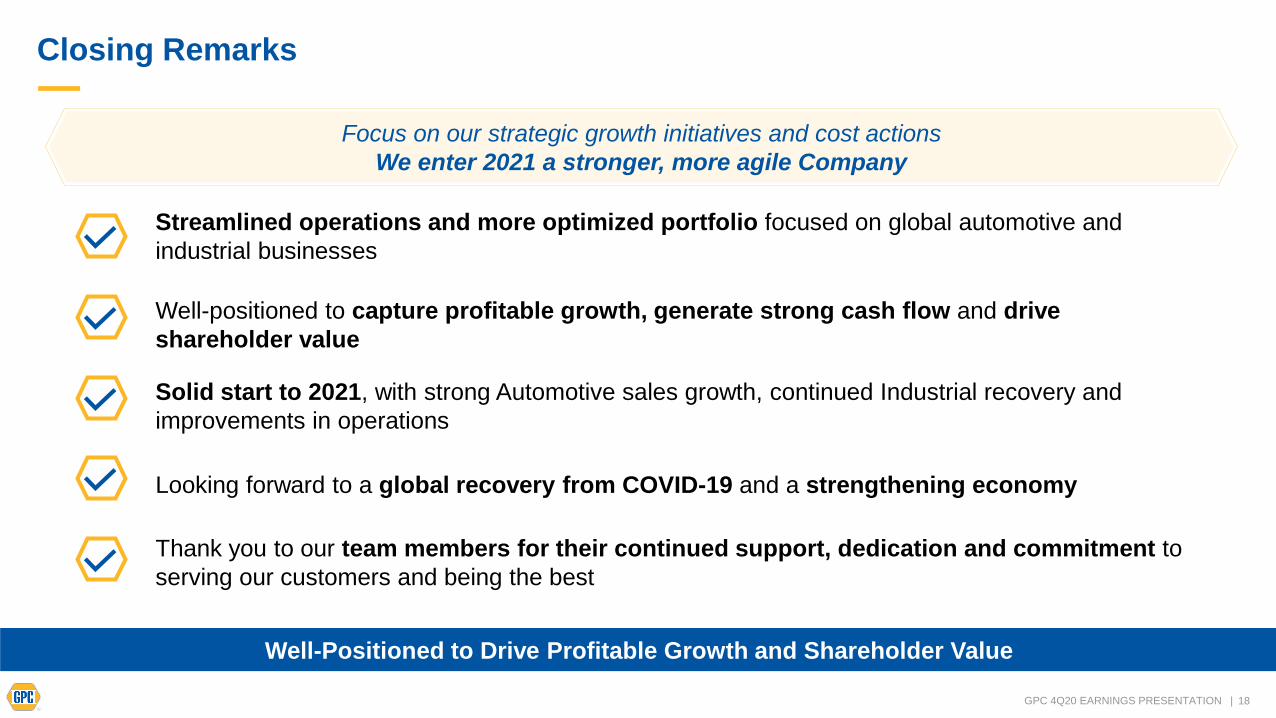
Closing Remarks
Well-Positioned to Drive Profitable Growth and Shareholder Value
Streamlined operations and more optimized portfolio focused on global automotive and
industrial businesses
Well-positioned to capture profitable growth, generate strong cash flow and drive
shareholder value
Solid start to 2021, with strong Automotive sales growth, continued Industrial recovery and
improvements in operations
Looking forward to a global recovery from COVID-19 and a strengthening economy
Thank you to our team members for their continued support, dedication and commitment to
serving our customers and being the best
Focus on our strategic growth initiatives and cost actions
We enter 2021 a stronger, more agile Company

19GPC 4Q20 EARNINGS PRESENTATION |
Q&A

20GPC 4Q20 EARNINGS PRESENTATION |
Appendix
21GPC 4Q20 EARNINGS PRESENTATION |
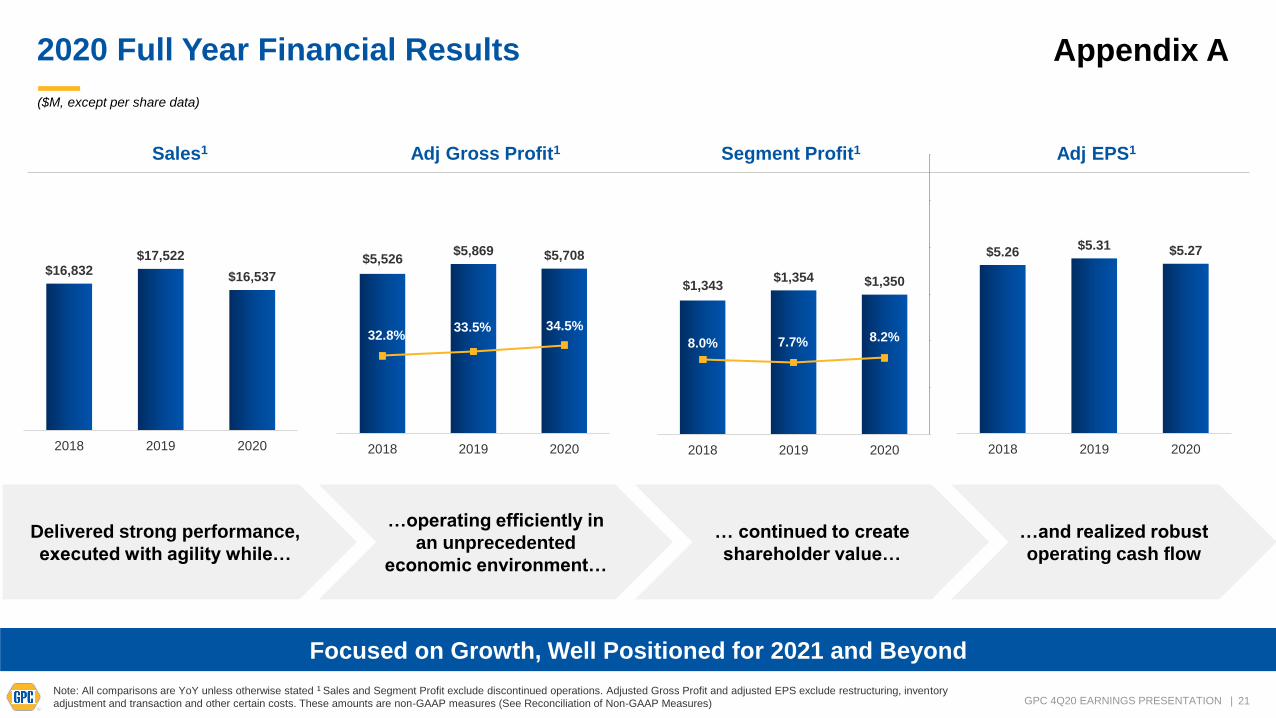
2020 Full Year Financial Results
Focused on Growth, Well Positioned for 2021 and Beyond
$16,832 $17,522
$16,537
2018 2019 2020
$5,526$5,869 $5,708
32.8%33.5% 34.5%
20.0%
21.0%
22.0%
23.0%
24.0%
25.0%
26.0%
27.0%
28.0%
29.0%
30.0%
31.0%
32.0%
33.0%
34.0%
35.0%
36.0%
37.0%
38.0%
39.0%
40.0%
41.0%
42.0%
43.0%
44.0%
45.0%
46.0%
47.0%
48.0%
49.0%
50.0%
$0
$300
$600
$900
$1,200
$1,500
$1,800
$2,100
$2,400
$2,700
$3,000
$3,300
$3,600
$3,900
$4,200
$4,500
$4,800
$5,100
$5,400
$5,700
$6,000
$6,300
2018 2019 2020
($M, except per share data)
$5.26 $5.31 $5.27
2018 2019 2020
Delivered strong performance,
executed with agility while…
…operating efficiently in
an unprecedented
economic environment…
… continued to create
shareholder value…
…and realized robust
operating cash flow
Sales1 Adj Gross Profit1 Segment Profit1 Adj EPS1
Note: All comparisons are YoY unless otherwise stated 1 Sales and Segment Profit exclude discontinued operations. Adjusted Gross Profit and adjusted EPS exclude restructuring, inventory
adjustment and transaction and other certain costs. These amounts are non-GAAP measures (See Reconciliation of Non-GAAP Measures)
$1,343$1,354 $1,350
8.0% 7.7% 8.2%
0.0%
5.0%
10.0%
15.0%
20.0%
25.0%
30.0%
$1,200
$1,500
2018 2019 2020
Appendix A
22GPC 4Q20 EARNINGS PRESENTATION |
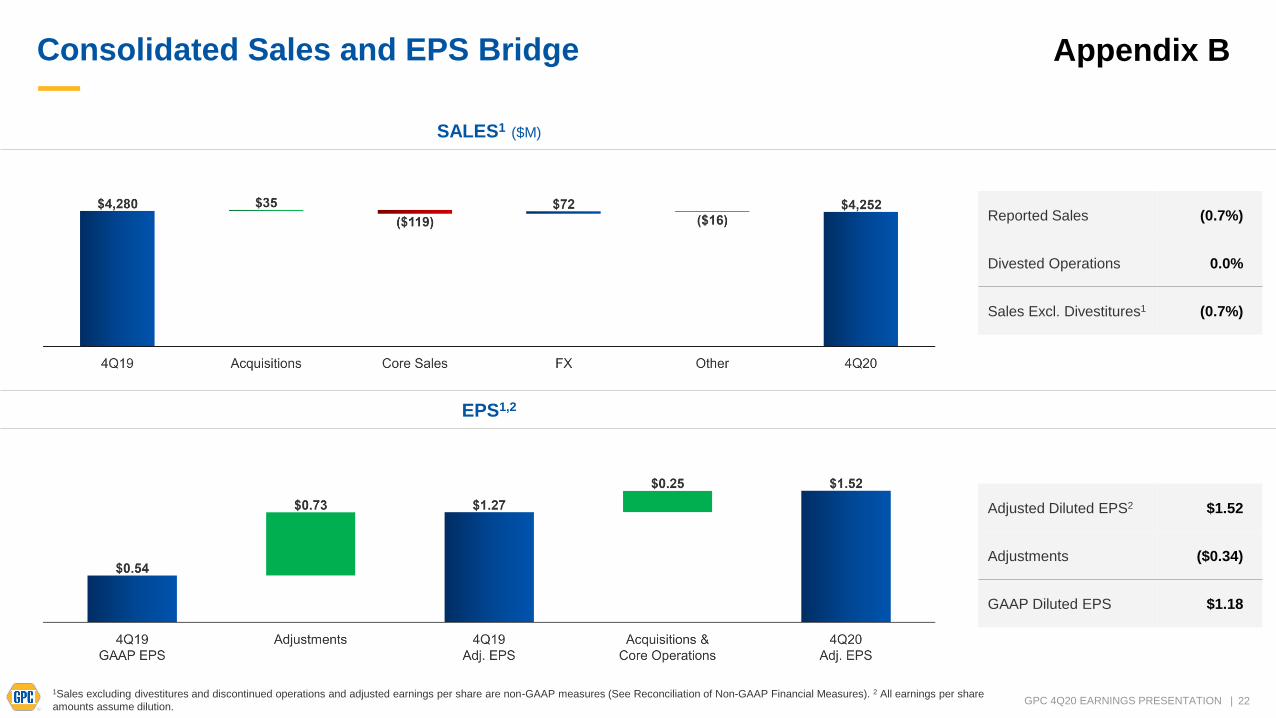
Consolidated Sales and EPS Bridge
Reported Sales (0.7%)
Divested Operations 0.0%
Sales Excl. Divestitures1 (0.7%)
EPS1,2
SALES1 ($M)
Appendix B
Adjusted Diluted EPS2 $1.52
Adjustments ($0.34)
GAAP Diluted EPS $1.18
1Sales excluding divestitures and discontinued operations and adjusted earnings per share are non-GAAP measures (See Reconciliation of Non-GAAP Financial Measures). 2 All earnings per share
amounts assume dilution.
23GPC 4Q20 EARNINGS PRESENTATION |
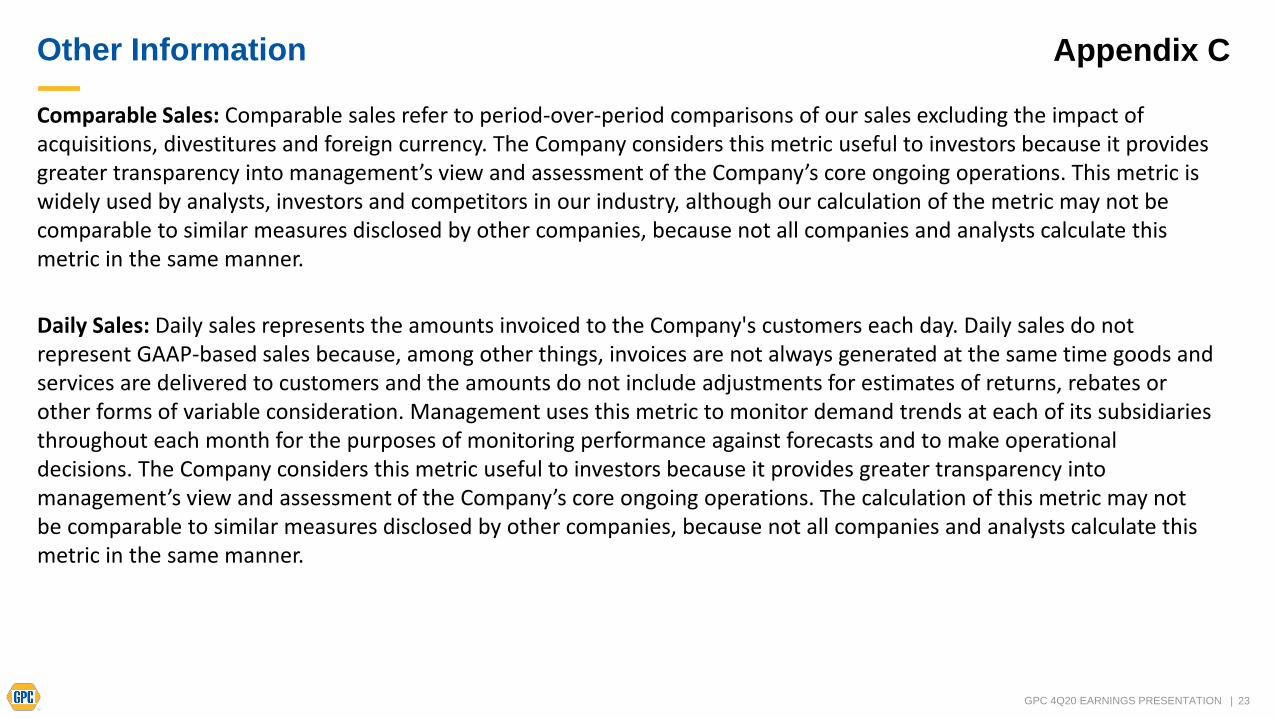
Other Information Appendix C
Comparable Sales: Comparable sales refer to period-over-period comparisons of our sales excluding the impact of acquisitions, divestitures and foreign currency. The Company considers this metric useful to investors because it provides greater transparency into management’s view and assessment of the Company’s core ongoing operations. This metric is widely used by analysts, investors and competitors in our industry, although our calculation of the metric may not be comparable to similar measures disclosed by other companies, because not all companies and analysts calculate this metric in the same manner.
Daily Sales: Daily sales represents the amounts invoiced to the Company's customers each day. Daily sales do not represent GAAP-based sales because, among other things, invoices are not always generated at the same time goods and services are delivered to customers and the amounts do not include adjustments for estimates of returns, rebates or other forms of variable consideration. Management uses this metric to monitor demand trends at each of its subsidiaries throughout each month for the purposes of monitoring performance against forecasts and to make operational decisions. The Company considers this metric useful to investors because it provides greater transparency into management’s view and assessment of the Company’s core ongoing operations. The calculation of this metric may not be comparable to similar measures disclosed by other companies, because not all companies and analysts calculate this metric in the same manner.
24GPC 4Q20 EARNINGS PRESENTATION |
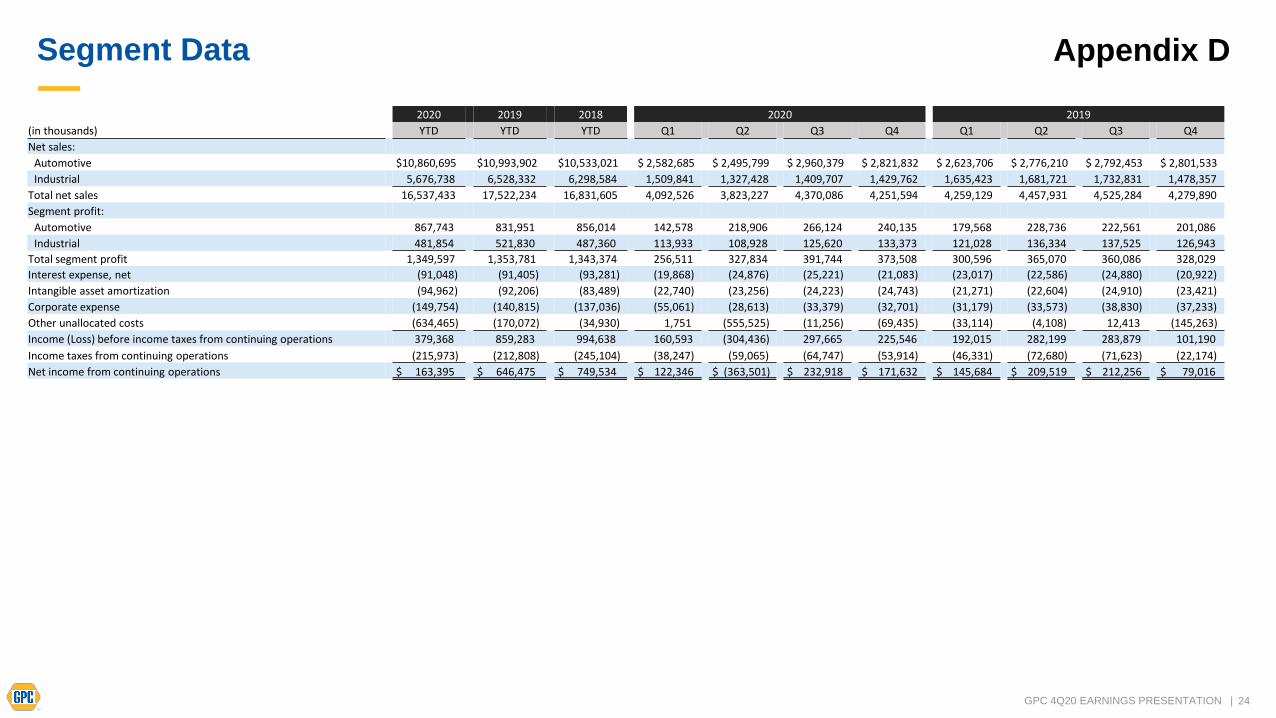
Segment Data Appendix D
2020 2019 2018 2020 2019
(in thousands) YTD YTD YTD Q1 Q2 Q3 Q4 Q1 Q2 Q3 Q4
Net sales:
Automotive $10,860,695 $10,993,902 $10,533,021 $ 2,582,685 $ 2,495,799 $ 2,960,379 $ 2,821,832 $ 2,623,706 $ 2,776,210 $ 2,792,453 $ 2,801,533
Industrial 5,676,738 6,528,332 6,298,584 1,509,841 1,327,428 1,409,707 1,429,762 1,635,423 1,681,721 1,732,831 1,478,357
Total net sales 16,537,433 17,522,234 16,831,605 4,092,526 3,823,227 4,370,086 4,251,594 4,259,129 4,457,931 4,525,284 4,279,890
Segment profit:
Automotive 867,743 831,951 856,014 142,578 218,906 266,124 240,135 179,568 228,736 222,561 201,086
Industrial 481,854 521,830 487,360 113,933 108,928 125,620 133,373 121,028 136,334 137,525 126,943
Total segment profit 1,349,597 1,353,781 1,343,374 256,511 327,834 391,744 373,508 300,596 365,070 360,086 328,029
Interest expense, net (91,048) (91,405) (93,281) (19,868) (24,876) (25,221) (21,083) (23,017) (22,586) (24,880) (20,922)
Intangible asset amortization (94,962) (92,206) (83,489) (22,740) (23,256) (24,223) (24,743) (21,271) (22,604) (24,910) (23,421)
Corporate expense (149,754) (140,815) (137,036) (55,061) (28,613) (33,379) (32,701) (31,179) (33,573) (38,830) (37,233)
Other unallocated costs (634,465) (170,072) (34,930) 1,751 (555,525) (11,256) (69,435) (33,114) (4,108) 12,413 (145,263)
Income (Loss) before income taxes from continuing operations 379,368 859,283 994,638 160,593 (304,436) 297,665 225,546 192,015 282,199 283,879 101,190
Income taxes from continuing operations (215,973) (212,808) (245,104) (38,247) (59,065) (64,747) (53,914) (46,331) (72,680) (71,623) (22,174)
Net income from continuing operations $ 163,395 $ 646,475 $ 749,534 $ 122,346 $ (363,501) $ 232,918 $ 171,632 $ 145,684 $ 209,519 $ 212,256 $ 79,016
25GPC 4Q20 EARNINGS PRESENTATION |
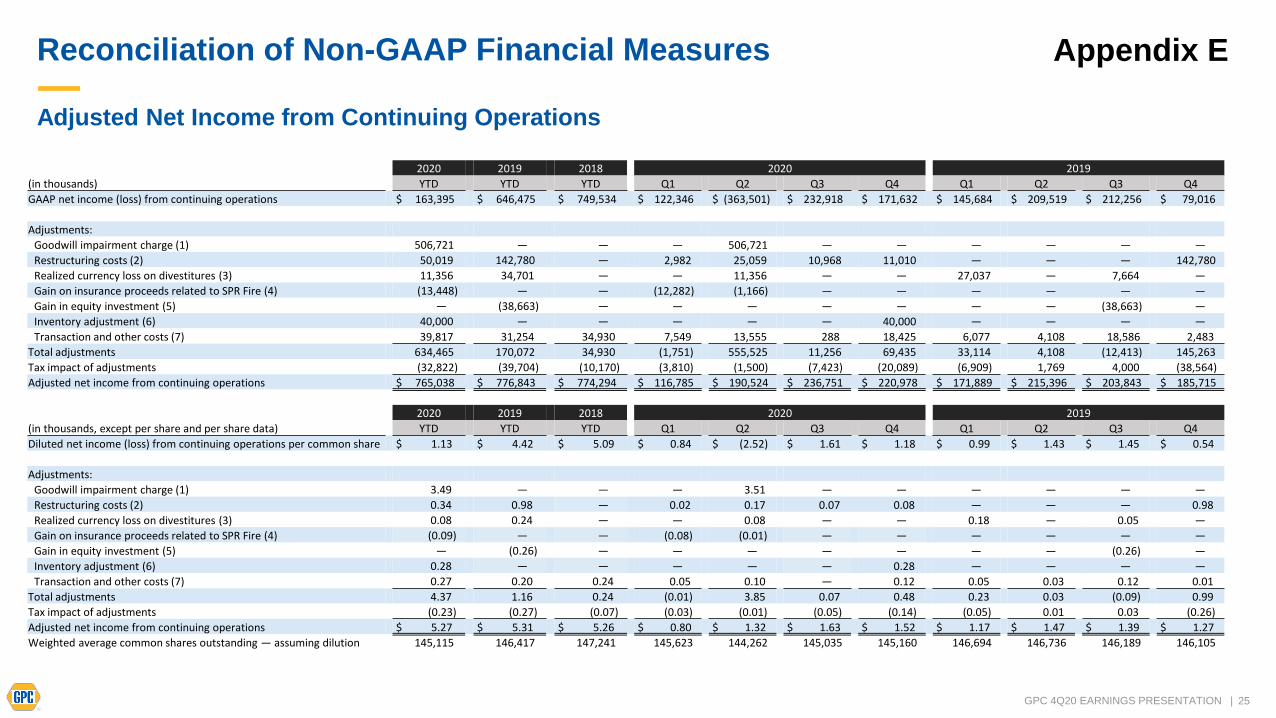
Reconciliation of Non-GAAP Financial Measures Appendix E
Adjusted Net Income from Continuing Operations
2020 2019 2018 2020 2019
(in thousands) YTD YTD YTD Q1 Q2 Q3 Q4 Q1 Q2 Q3 Q4
GAAP net income (loss) from continuing operations $ 163,395 $ 646,475 $ 749,534 $ 122,346 $ (363,501) $ 232,918 $ 171,632 $ 145,684 $ 209,519 $ 212,256 $ 79,016
Adjustments:
Goodwill impairment charge (1) 506,721 — — — 506,721 — — — — — —
Restructuring costs (2) 50,019 142,780 — 2,982 25,059 10,968 11,010 — — — 142,780
Realized currency loss on divestitures (3) 11,356 34,701 — — 11,356 — — 27,037 — 7,664 —
Gain on insurance proceeds related to SPR Fire (4) (13,448) — — (12,282) (1,166) — — — — — —
Gain in equity investment (5) — (38,663) — — — — — — — (38,663) —
Inventory adjustment (6) 40,000 — — — — — 40,000 — — — —
Transaction and other costs (7) 39,817 31,254 34,930 7,549 13,555 288 18,425 6,077 4,108 18,586 2,483
Total adjustments 634,465 170,072 34,930 (1,751) 555,525 11,256 69,435 33,114 4,108 (12,413) 145,263
Tax impact of adjustments (32,822) (39,704) (10,170) (3,810) (1,500) (7,423) (20,089) (6,909) 1,769 4,000 (38,564)
Adjusted net income from continuing operations $ 765,038 $ 776,843 $ 774,294 $ 116,785 $ 190,524 $ 236,751 $ 220,978 $ 171,889 $ 215,396 $ 203,843 $ 185,715
2020 2019 2018 2020 2019
(in thousands, except per share and per share data) YTD YTD YTD Q1 Q2 Q3 Q4 Q1 Q2 Q3 Q4
Diluted net income (loss) from continuing operations per common share $ 1.13 $ 4.42 $ 5.09 $ 0.84 $ (2.52) $ 1.61 $ 1.18 $ 0.99 $ 1.43 $ 1.45 $ 0.54
Adjustments:
Goodwill impairment charge (1) 3.49 — — — 3.51 — — — — — —
Restructuring costs (2) 0.34 0.98 — 0.02 0.17 0.07 0.08 — — — 0.98
Realized currency loss on divestitures (3) 0.08 0.24 — — 0.08 — — 0.18 — 0.05 —
Gain on insurance proceeds related to SPR Fire (4) (0.09) — — (0.08) (0.01) — — — — — —
Gain in equity investment (5) — (0.26) — — — — — — — (0.26) —
Inventory adjustment (6) 0.28 — — — — — 0.28 — — — —
Transaction and other costs (7) 0.27 0.20 0.24 0.05 0.10 — 0.12 0.05 0.03 0.12 0.01
Total adjustments 4.37 1.16 0.24 (0.01) 3.85 0.07 0.48 0.23 0.03 (0.09) 0.99
Tax impact of adjustments (0.23) (0.27) (0.07) (0.03) (0.01) (0.05) (0.14) (0.05) 0.01 0.03 (0.26)
Adjusted net income from continuing operations $ 5.27 $ 5.31 $ 5.26 $ 0.80 $ 1.32 $ 1.63 $ 1.52 $ 1.17 $ 1.47 $ 1.39 $ 1.27
Weighted average common shares outstanding — assuming dilution 145,115 146,417 147,241 145,623 144,262 145,035 145,160 146,694 146,736 146,189 146,105
26GPC 4Q20 EARNINGS PRESENTATION |
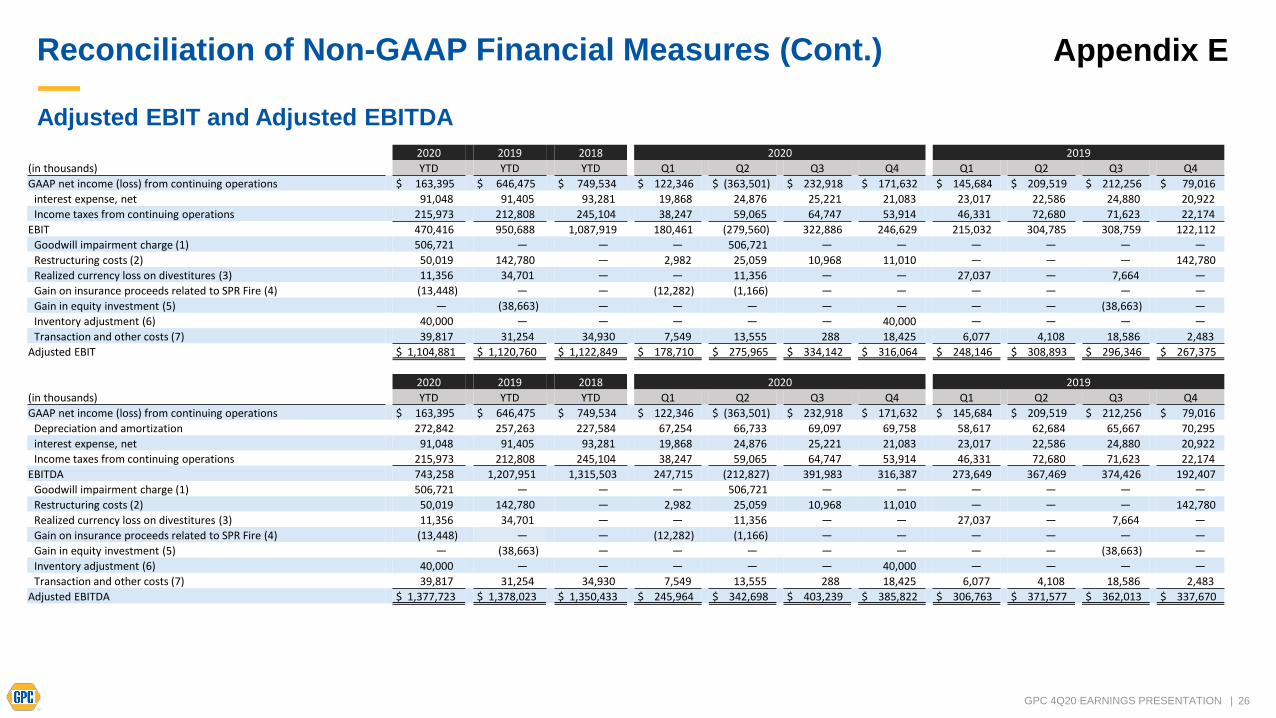
Reconciliation of Non-GAAP Financial Measures (Cont.) Appendix E
Adjusted EBIT and Adjusted EBITDA
2020 2019 2018 2020 2019
(in thousands) YTD YTD YTD Q1 Q2 Q3 Q4 Q1 Q2 Q3 Q4
GAAP net income (loss) from continuing operations $ 163,395 $ 646,475 $ 749,534 $ 122,346 $ (363,501) $ 232,918 $ 171,632 $ 145,684 $ 209,519 $ 212,256 $ 79,016
interest expense, net 91,048 91,405 93,281 19,868 24,876 25,221 21,083 23,017 22,586 24,880 20,922
Income taxes from continuing operations 215,973 212,808 245,104 38,247 59,065 64,747 53,914 46,331 72,680 71,623 22,174
EBIT 470,416 950,688 1,087,919 180,461 (279,560) 322,886 246,629 215,032 304,785 308,759 122,112
Goodwill impairment charge (1) 506,721 — — — 506,721 — — — — — —
Restructuring costs (2) 50,019 142,780 — 2,982 25,059 10,968 11,010 — — — 142,780
Realized currency loss on divestitures (3) 11,356 34,701 — — 11,356 — — 27,037 — 7,664 —
Gain on insurance proceeds related to SPR Fire (4) (13,448) — — (12,282) (1,166) — — — — — —
Gain in equity investment (5) — (38,663) — — — — — — — (38,663) —
Inventory adjustment (6) 40,000 — — — — — 40,000 — — — —
Transaction and other costs (7) 39,817 31,254 34,930 7,549 13,555 288 18,425 6,077 4,108 18,586 2,483
Adjusted EBIT $ 1,104,881 $ 1,120,760 $ 1,122,849 $ 178,710 $ 275,965 $ 334,142 $ 316,064 $ 248,146 $ 308,893 $ 296,346 $ 267,375
2020 2019 2018 2020 2019
(in thousands) YTD YTD YTD Q1 Q2 Q3 Q4 Q1 Q2 Q3 Q4
GAAP net income (loss) from continuing operations $ 163,395 $ 646,475 $ 749,534 $ 122,346 $ (363,501) $ 232,918 $ 171,632 $ 145,684 $ 209,519 $ 212,256 $ 79,016
Depreciation and amortization 272,842 257,263 227,584 67,254 66,733 69,097 69,758 58,617 62,684 65,667 70,295
interest expense, net 91,048 91,405 93,281 19,868 24,876 25,221 21,083 23,017 22,586 24,880 20,922
Income taxes from continuing operations 215,973 212,808 245,104 38,247 59,065 64,747 53,914 46,331 72,680 71,623 22,174
EBITDA 743,258 1,207,951 1,315,503 247,715 (212,827) 391,983 316,387 273,649 367,469 374,426 192,407
Goodwill impairment charge (1) 506,721 — — — 506,721 — — — — — —
Restructuring costs (2) 50,019 142,780 — 2,982 25,059 10,968 11,010 — — — 142,780
Realized currency loss on divestitures (3) 11,356 34,701 — — 11,356 — — 27,037 — 7,664 —
Gain on insurance proceeds related to SPR Fire (4) (13,448) — — (12,282) (1,166) — — — — — —
Gain in equity investment (5) — (38,663) — — — — — — — (38,663) —
Inventory adjustment (6) 40,000 — — — — — 40,000 — — — —
Transaction and other costs (7) 39,817 31,254 34,930 7,549 13,555 288 18,425 6,077 4,108 18,586 2,483
Adjusted EBITDA $ 1,377,723 $ 1,378,023 $ 1,350,433 $ 245,964 $ 342,698 $ 403,239 $ 385,822 $ 306,763 $ 371,577 $ 362,013 $ 337,670
27GPC 4Q20 EARNINGS PRESENTATION |
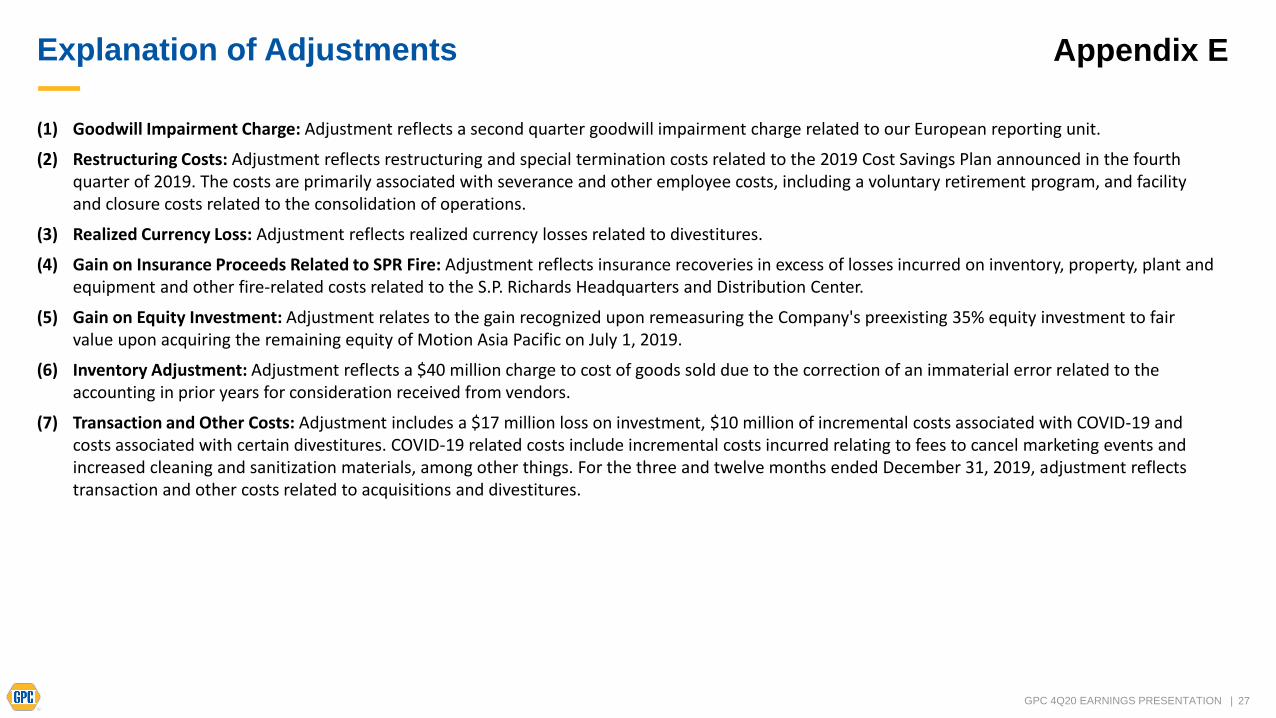
Explanation of Adjustments Appendix E
(1) Goodwill Impairment Charge: Adjustment reflects a second quarter goodwill impairment charge related to our European reporting unit.
(2) Restructuring Costs: Adjustment reflects restructuring and special termination costs related to the 2019 Cost Savings Plan announced in the fourthquarter of 2019. The costs are primarily associated with severance and other employee costs, including a voluntary retirement program, and facility and closure costs related to the consolidation of operations.
(3) Realized Currency Loss: Adjustment reflects realized currency losses related to divestitures.
(4) Gain on Insurance Proceeds Related to SPR Fire: Adjustment reflects insurance recoveries in excess of losses incurred on inventory, property, plant and equipment and other fire-related costs related to the S.P. Richards Headquarters and Distribution Center.
(5) Gain on Equity Investment: Adjustment relates to the gain recognized upon remeasuring the Company's preexisting 35% equity investment to fair value upon acquiring the remaining equity of Motion Asia Pacific on July 1, 2019.
(6) Inventory Adjustment: Adjustment reflects a $40 million charge to cost of goods sold due to the correction of an immaterial error related to the accounting in prior years for consideration received from vendors.
(7) Transaction and Other Costs: Adjustment includes a $17 million loss on investment, $10 million of incremental costs associated with COVID-19 and costs associated with certain divestitures. COVID-19 related costs include incremental costs incurred relating to fees to cancel marketing events and increased cleaning and sanitization materials, among other things. For the three and twelve months ended December 31, 2019, adjustment reflects transaction and other costs related to acquisitions and divestitures.
28GPC 4Q20 EARNINGS PRESENTATION |
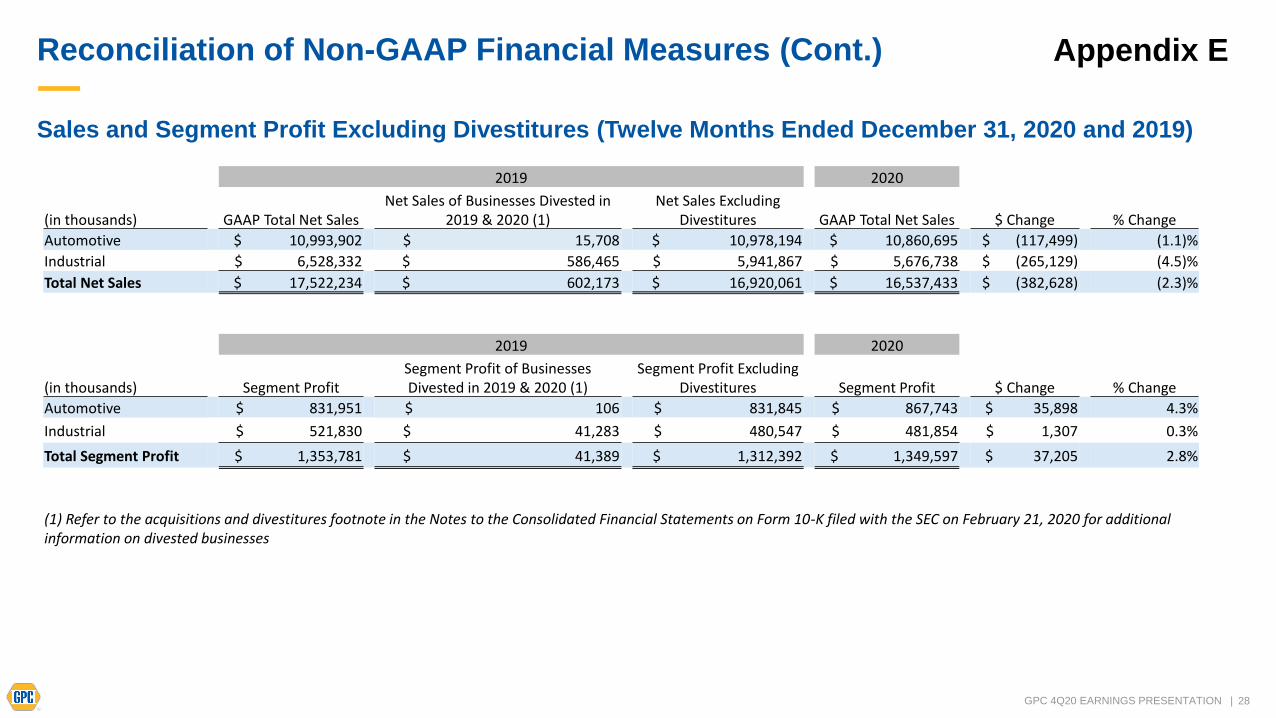
Reconciliation of Non-GAAP Financial Measures (Cont.) Appendix E
Sales and Segment Profit Excluding Divestitures (Twelve Months Ended December 31, 2020 and 2019)
2019 2020
(in thousands) GAAP Total Net SalesNet Sales of Businesses Divested in
2019 & 2020 (1)Net Sales Excluding
Divestitures GAAP Total Net Sales $ Change % Change
Automotive $ 10,993,902 $ 15,708 $ 10,978,194 $ 10,860,695 $ (117,499) (1.1)%
Industrial $ 6,528,332 $ 586,465 $ 5,941,867 $ 5,676,738 $ (265,129) (4.5)%
Total Net Sales $ 17,522,234 $ 602,173 $ 16,920,061 $ 16,537,433 $ (382,628) (2.3)%
2019 2020
(in thousands) Segment ProfitSegment Profit of Businesses Divested in 2019 & 2020 (1)
Segment Profit Excluding Divestitures Segment Profit $ Change % Change
Automotive $ 831,951 $ 106 $ 831,845 $ 867,743 $ 35,898 4.3%
Industrial $ 521,830 $ 41,283 $ 480,547 $ 481,854 $ 1,307 0.3%
Total Segment Profit $ 1,353,781 $ 41,389 $ 1,312,392 $ 1,349,597 $ 37,205 2.8%
(1) Refer to the acquisitions and divestitures footnote in the Notes to the Consolidated Financial Statements on Form 10-K filed with the SEC on February 21, 2020 for additional information on divested businesses
29GPC 4Q20 EARNINGS PRESENTATION |
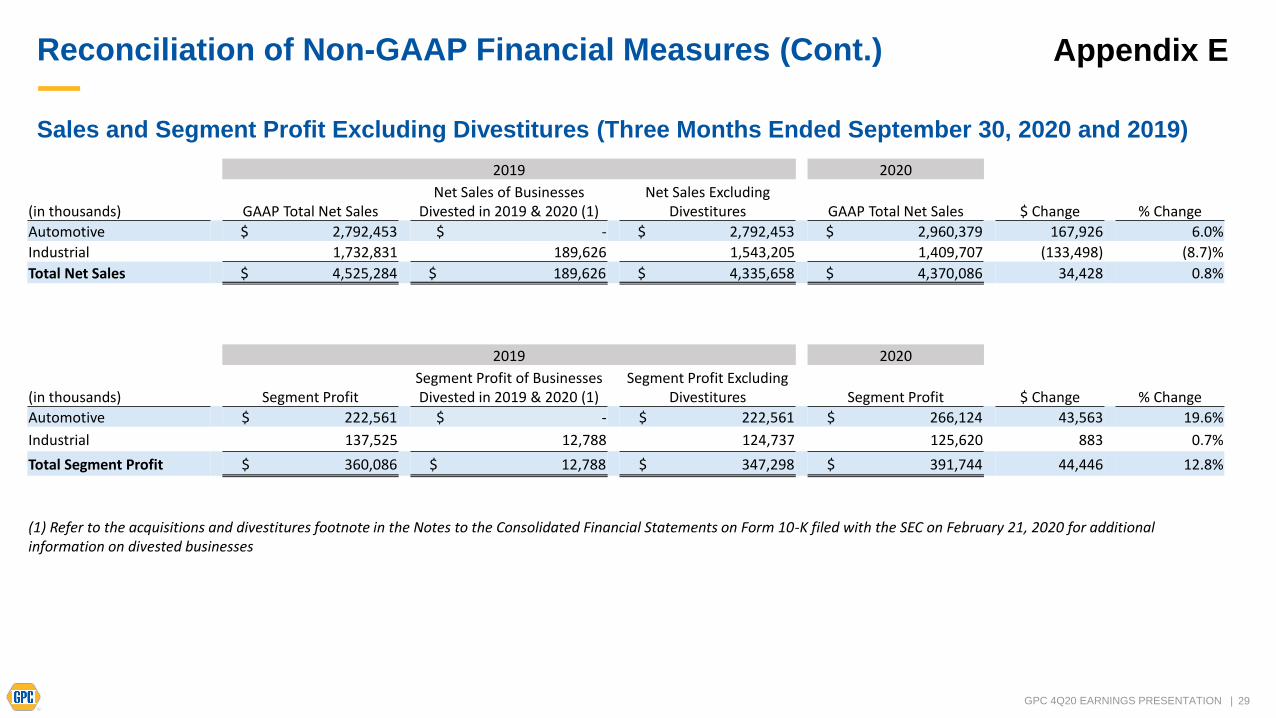
Reconciliation of Non-GAAP Financial Measures (Cont.) Appendix E
Sales and Segment Profit Excluding Divestitures (Three Months Ended September 30, 2020 and 2019)
2019 2020
(in thousands) GAAP Total Net SalesNet Sales of Businesses
Divested in 2019 & 2020 (1)Net Sales Excluding
Divestitures GAAP Total Net Sales $ Change % Change
Automotive $ 2,792,453 $ - $ 2,792,453 $ 2,960,379 167,926 6.0%
Industrial 1,732,831 189,626 1,543,205 1,409,707 (133,498) (8.7)%
Total Net Sales $ 4,525,284 $ 189,626 $ 4,335,658 $ 4,370,086 34,428 0.8%
2019 2020
(in thousands) Segment ProfitSegment Profit of Businesses Divested in 2019 & 2020 (1)
Segment Profit Excluding Divestitures Segment Profit $ Change % Change
Automotive $ 222,561 $ - $ 222,561 $ 266,124 43,563 19.6%
Industrial 137,525 12,788 124,737 125,620 883 0.7%
Total Segment Profit $ 360,086 $ 12,788 $ 347,298 $ 391,744 44,446 12.8%
(1) Refer to the acquisitions and divestitures footnote in the Notes to the Consolidated Financial Statements on Form 10-K filed with the SEC on February 21, 2020 for additional information on divested businesses
30GPC 4Q20 EARNINGS PRESENTATION |
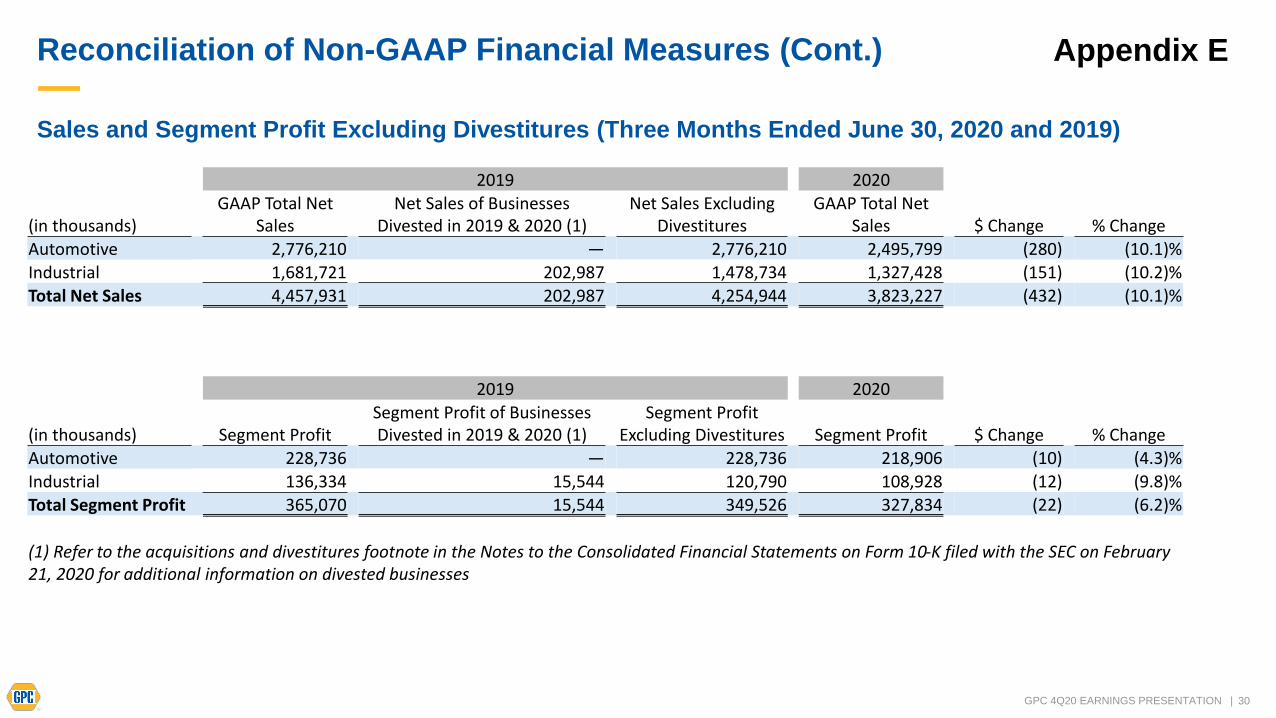
Reconciliation of Non-GAAP Financial Measures (Cont.) Appendix E
Sales and Segment Profit Excluding Divestitures (Three Months Ended June 30, 2020 and 2019)
2019 2020
(in thousands)GAAP Total Net
SalesNet Sales of Businesses
Divested in 2019 & 2020 (1)Net Sales Excluding
DivestituresGAAP Total Net
Sales $ Change % Change
Automotive 2,776,210 — 2,776,210 2,495,799 (280) (10.1)%Industrial 1,681,721 202,987 1,478,734 1,327,428 (151) (10.2)%
Total Net Sales 4,457,931 202,987 4,254,944 3,823,227 (432) (10.1)%
2019 2020
(in thousands) Segment ProfitSegment Profit of Businesses Divested in 2019 & 2020 (1)
Segment Profit Excluding Divestitures Segment Profit $ Change % Change
Automotive 228,736 — 228,736 218,906 (10) (4.3)%Industrial 136,334 15,544 120,790 108,928 (12) (9.8)%Total Segment Profit 365,070 15,544 349,526 327,834 (22) (6.2)%
(1) Refer to the acquisitions and divestitures footnote in the Notes to the Consolidated Financial Statements on Form 10-K filed with the SEC on February 21, 2020 for additional information on divested businesses
31GPC 4Q20 EARNINGS PRESENTATION |
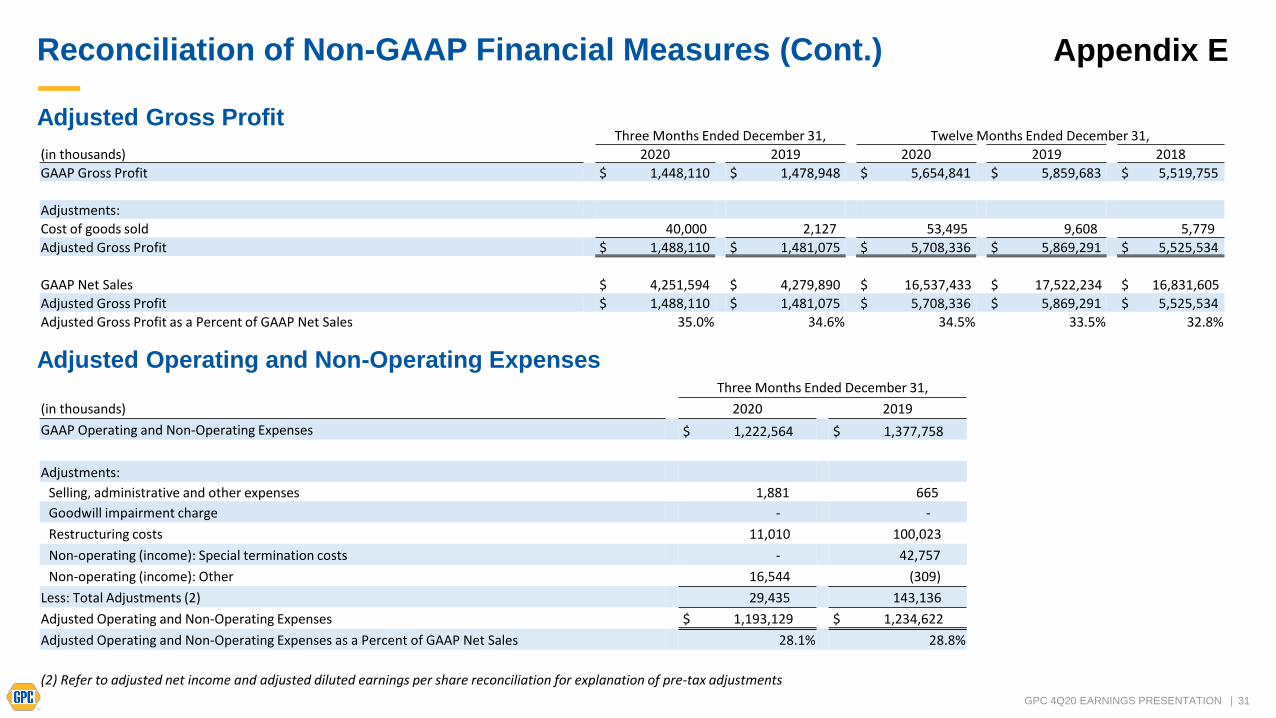
Reconciliation of Non-GAAP Financial Measures (Cont.) Appendix E
Adjusted Gross Profit
Adjusted Operating and Non-Operating Expenses
Three Months Ended December 31, Twelve Months Ended December 31,
(in thousands) 2020 2019 2020 2019 2018
GAAP Gross Profit $ 1,448,110 $ 1,478,948 $ 5,654,841 $ 5,859,683 $ 5,519,755
Adjustments:
Cost of goods sold 40,000 2,127 53,495 9,608 5,779
Adjusted Gross Profit $ 1,488,110 $ 1,481,075 $ 5,708,336 $ 5,869,291 $ 5,525,534
GAAP Net Sales $ 4,251,594 $ 4,279,890 $ 16,537,433 $ 17,522,234 $ 16,831,605
Adjusted Gross Profit $ 1,488,110 $ 1,481,075 $ 5,708,336 $ 5,869,291 $ 5,525,534
Adjusted Gross Profit as a Percent of GAAP Net Sales 35.0% 34.6% 34.5% 33.5% 32.8%
Three Months Ended December 31,
(in thousands) 2020 2019
GAAP Operating and Non-Operating Expenses $ 1,222,564 $ 1,377,758
Adjustments:
Selling, administrative and other expenses 1,881 665
Goodwill impairment charge - -
Restructuring costs 11,010 100,023
Non-operating (income): Special termination costs - 42,757
Non-operating (income): Other 16,544 (309)
Less: Total Adjustments (2) 29,435 143,136
Adjusted Operating and Non-Operating Expenses $ 1,193,129 $ 1,234,622
Adjusted Operating and Non-Operating Expenses as a Percent of GAAP Net Sales 28.1% 28.8%
(2) Refer to adjusted net income and adjusted diluted earnings per share reconciliation for explanation of pre-tax adjustments
32GPC 4Q20 EARNINGS PRESENTATION |
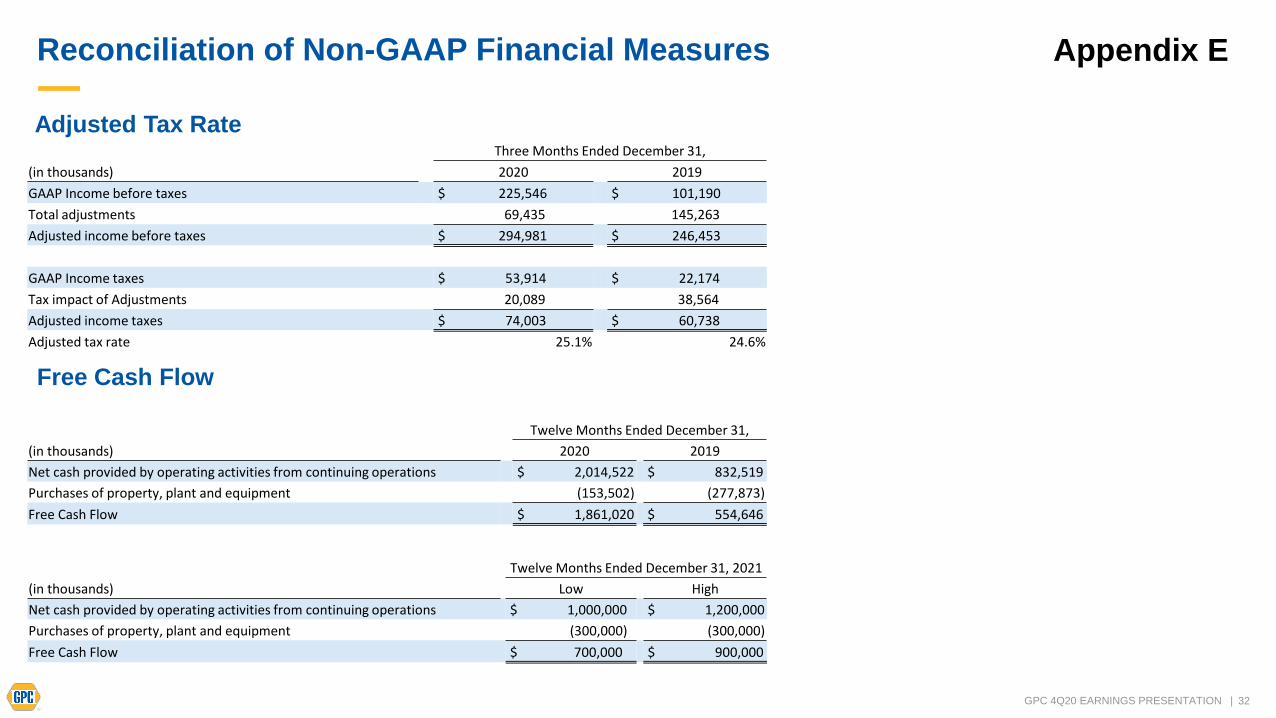
Reconciliation of Non-GAAP Financial Measures Appendix E
Adjusted Tax Rate
Free Cash Flow
Twelve Months Ended December 31,
(in thousands) 2020 2019
Net cash provided by operating activities from continuing operations $ 2,014,522 $ 832,519
Purchases of property, plant and equipment (153,502) (277,873)
Free Cash Flow $ 1,861,020 $ 554,646
Twelve Months Ended December 31, 2021
(in thousands) Low High
Net cash provided by operating activities from continuing operations $ 1,000,000 $ 1,200,000
Purchases of property, plant and equipment (300,000) (300,000)
Free Cash Flow $ 700,000 $ 900,000
Three Months Ended December 31,
(in thousands) 2020 2019
GAAP Income before taxes $ 225,546 $ 101,190
Total adjustments 69,435 145,263
Adjusted income before taxes $ 294,981 $ 246,453
GAAP Income taxes $ 53,914 $ 22,174
Tax impact of Adjustments 20,089 38,564
Adjusted income taxes $ 74,003 $ 60,738
Adjusted tax rate 25.1% 24.6%