genworth mortgage insurance australia limited abn 72 154 ...in october 2016, gfi and china oceanwide...
TRANSCRIPT

Contents Page
1) Company details 1
2) Results for announcement to the market 1
3) Net tangible assets per security 2
4) Entities over which control has been gained or lost during the period 2
5) Dividends 2
6) Dividend reinvestment plan 2
7) Details of associates and joint venture entities 2
8) For foreign entities, which set of accounting standards is used in compiling the report 2
9) Audit dispute or qualification 2
Attachment A: half year financial report 30 June 2018 3
Genworth Mortgage Insurance Australia Limited
ABN 72 154 890 730
Half Year Financial Report 30 June 2018
Appendix 4D

Genworth Mortgage Insurance Australia Limited Appendix 4D 1
1) Company details
Genworth Mortgage Insurance Australia Limited
ABN 72 154 890 730
Reporting period: 1 January 2018 to 30 June 2018
Previous corresponding reporting period: 1 January 2017 to 30 June 2017
2) Results for announcement to the market
Up/ down % change
Half year ended 30 June 2018
$’000
Half year ended 30 June 2017
$’000
Revenue from ordinary activities
Down 22.7% 229,260 296,503
Profit from ordinary activities after income tax attributable to shareholders
Down 52.7% 41,903 88,663
Net profit for the period attributable to shareholders
Down 52.7% 41,903 88,663
Dividends Amount per security
(cents) Franked amount per security
(cents)
Interim dividend 8.0 8.0
Special dividend 4.0 4.0
The record date of the interim dividend is 16 August 2018.
Brief explanation of any figures reported above
Please refer to the commentary in the review of operations and activities section of the directors’ report and the half
year results announcement accompanying this half year report.
3) Net tangible assets per security
Half year ended 30 June 2018
$
Half year ended 30 June 2017
$
Net tangible assets per security 3.93 3.87
Net tangible assets per ordinary share has been determined by using the net assets on the balance sheet adjusted for
intangible assets and goodwill.
4) Entities over which control has been gained or lost during the period
None
5) Dividends
Refer to note 3.1 in the half year financial report attached.
6) Dividend reinvestment plan
Not applicable
7) Details of associates and joint venture entities

Genworth Mortgage Insurance Australia Limited Appendix 4D 2
Not applicable
8) For foreign entities, which set of accounting standards is used in compiling the report
International Financial Accounting Standards
9) Audit dispute or qualification
Not applicable

Genworth Mortgage Insurance Australia Limited Appendix 4D 3
Attachment A
Genworth Mortgage Insurance Australia Limited
Half Year Financial Report
30 June 2018

1
Genworth Mortgage Insurance Australia Limited
ABN 72 154 890 730
Half Year Financial Report 30 June 2018

2
Contents
Directors’ report ......................................................................................................................... 3
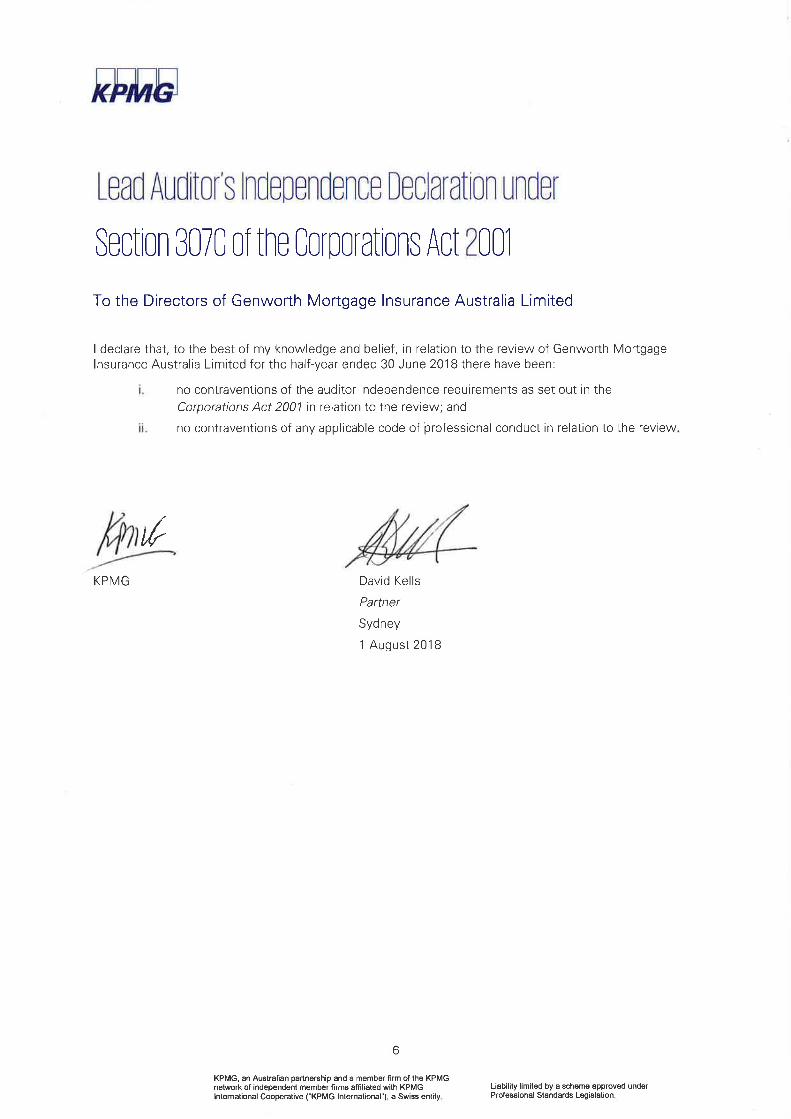
Lead Auditor’s Independence Declaration ................................................................................. 6
Financial Statements ................................................................................................................. 7
Directors’ declaration ............................................................................................................... 25
Independent auditor’s report .................................................................................................... 26

3
Directors’ report The directors present their report together with the financial statements of the Group comprising Genworth
Mortgage Insurance Australia Limited (“the Company”) and its controlled entities (“the Group”) for the half
year ended 30 June 2018 and the auditor’s review report thereon.
Directors The directors of the Company at any time during or since the end of the half year are as follows:
David Foster
Anthony (Tony) Gill
Ian MacDonald
Gai McGrath
Georgette Nicholas
Leon Roday
Stuart Take
Gayle Tollifson
Jerome Upton
Principal activity The principal activity of the Group during the reporting period was the provision of lenders mortgage
insurance (“LMI”) under authorisation from APRA. In Australia, LMI facilitates residential mortgage lending
by transferring risk from lenders to LMI providers, predominately for high loan to value ratio residential
mortgage loans.
Review and results of operations Operating results for the reporting period
The Group reported a 2018 statutory interim net profit after tax of $41.9 million, down 52.7% from $88.7
million in the prior corresponding period mainly driven by the adverse impact from the change in earnings
curve conducted in 2017 which resulted lower earned premium.
The expense ratio increased to 32.9% from 25.9% in the prior corresponding period mainly reflecting lower
net earned premium in the current period.
The reported loss ratio increased from 34.8% at 30 June 2017 to 53.3% at 30 June 2018 reflecting primarily
lower net earned premium in the current period.
Review of financial condition
Consolidated total assets were $3.7 billion as at 30 June 2018 and consolidated liabilities were $1.9 billion.
Cash flow
Cash flow from operating activities for the reporting period was $32.3 million.

4
Regulatory capital The Group’s regulatory capital at 30 June 2018 was 1.90 times the Prescribed Capital Amount (“PCA”) and
the Common Equity Tier 1 (“CET1”) ratio was 1.71. Regulatory capital exceeds the Group’s targets and
reflected a strong capital position.
Corporate structure The Company is incorporated and domiciled in Australia. The majority shareholders of the Group is Genworth
Financial International Holdings, Genworth Financial Australia Holdings, LLC (“LLC”) and Genworth Holdings,
Inc. (as partners of the Genworth Australian General Partnership (“AGP”) representing 51.95% ownership.
The ultimate parent entity of AGP is Genworth Financial, Inc (“GFI”) which is incorporated in Delaware, United
States of America.
In October 2016, GFI and China Oceanwide announced that they had entered into a definitive agreement
under which China Oceanwide agreed to acquire all of the outstanding shares of GFI, subject to approval by
GFI stockholders as well as other closing conditions. Upon completion of the transaction GFI will be a
standalone subsidiary of China Oceanwide. The closing of the merger remains subject to the receipt of
required regulatory approvals in the U.S., China, and other international jurisdictions and other closing
conditions. Genworth Financial and China Oceanwide also continue to be actively engaged with the other
relevant regulators regarding the pending applications.
Market capitalisation The market capitalisation of the Company as at 30 June 2018 was $1.2 billion based on the closing share
price of $2.57.
Events subsequent to reporting date Detail of matters subsequent to the end of the financial year is set out below and in the events subsequent
to reporting date note within the financial statements.
On 1 August 2018, the Directors declared a 100% ordinary franked dividend of 8.0 cents per share totalling
$36,817,000 and a 100% franked special dividend for 4.0 cents per share totalling $18,409,000.
Likely developments Further information about likely developments in the operations of the Group and the expected results of
those operations in future financial years have not been included in this report because the directors believe
it would be likely to result in unreasonable prejudice to the Group.
Rounding off The Group is of a kind referred to in ASIC Corporations (Rounding in Financial/Directors’ Reports) Instrument
2016/191 dated 24 March 2016 and, in accordance with that Class Order, amounts in the consolidated
financial statements and Directors’ report have been rounded off to the nearest thousand dollars, unless
otherwise stated.

5
Lead auditor’s independence declaration
The lead auditor’s independence declaration is set out on page 6 and forms part of the Directors’ report.
Signed in accordance with a resolution of the Directors:
Ian MacDonald
Chairman
Dated: 1 August 2018

7
Financial Statements Contents Consolidated statement of comprehensive income ................................................................................................................ 8 Consolidated statement of financial position .......................................................................................................................... 9 Consolidated statement of changes in equity ....................................................................................................................... 10 Consolidated statement of cash flows .................................................................................................................................. 11
Section 1 Basis of preparation ....................................................................................................................................... 12
1.1 Reporting entity .................................................................................................................................................. 12
1.2 Basis of preparation ............................................................................................................................................ 12
Section 2 Risk management .......................................................................................................................................... 13
2.1 Financial risk management ................................................................................................................................. 13
Section 3 Results for the period ..................................................................................................................................... 15
3.1 Dividends ............................................................................................................................................................ 15
3.2 Earnings per share ............................................................................................................................................. 15
Section 4 Insurance contracts ........................................................................................................................................ 16
4.1 Outstanding claims ............................................................................................................................................. 16
4.2 Reinsurance and non-reinsurance recoveries .................................................................................................... 17
4.3 Accounting estimates and judgements ............................................................................................................... 17
Section 5 Capital management and financing ................................................................................................................ 18
5.1 Interest bearing liabilities .................................................................................................................................... 18
5.2 Equity .................................................................................................................................................................. 19
5.3 Contingencies ..................................................................................................................................................... 19
Section 6 Other disclosures ........................................................................................................................................... 20
6.1 Related party disclosures ................................................................................................................................... 20
6.2 Share based payments ....................................................................................................................................... 20
6.3 Events subsequent to reporting date .................................................................................................................. 24

8
Consolidated statement of
comprehensive income For the half year ended 30 June 2018
Note 30 June 2018
$’000
30 June 2017
$’000
Gross written premium 266,760
63,137
(33,884)
211,562
(73,578)
(27,207)
(27,514)
83,263
12,702
95,964
36,400
(5,686)
126,678
(38,016)
88,663
182,310
182,310
182,310
63,137
(33,884)
211,562
(73,578)
(27,207)
(27,514)
83,263
12,702
95,964
36,400
(5,686)
126,678
(38,016)
88,663
182,310
182,310
Movement in unearned premium (83,900) 63,137
Outward reinsurance premium expense (39,515) (33,885)
Net earned premium 143,345 211,562
Net claims incurred (76,375) (73,578)
Acquisition costs (19,935) (27,207)
Other underwriting expenses (27,191) (27,514)
Underwriting result 19,844 83,263
Investment income on assets backing insurance liabilities 14,785 18,523
Insurance profit 34,629 101,786
Investment income on equity holders’ funds 31,615 32,533
Investment expenses on equity holders’ funds (1,922) (1,954)
Financing costs (5,922) (5,687)
Profit before income tax 58,400 126,678
Income tax expense (16,497) (38,015)
Profit for the period 41,903 88,663
Total comprehensive income for the period 41,903 88,663
Profit attributable to:
Earnings per share
Basic earnings per share (cents per share) 3.2 8.9 17.4
Diluted earnings per share (cents per share) 3.2 8.9 17.4
The consolidated statement of comprehensive income is to be read in conjunction with notes to the financial
statements.

9
Consolidated statement of financial
position As at 30 June 2018
The consolidated statement of financial position is to be read in conjunction with notes to the financial
statements.
Note
30 June
2018
$’000
31 December
2017
$’000
Assets
Cash 57,281 43,025
Accrued investment income 19,509 17,777
Investments 2.1 3,221,356 3,348,547
Trade and other receivables 94,746 12,521
Prepayments 2,671 2,450
Deferred reinsurance expense 80,356 145,425
Non-reinsurance recoveries 4.2 21,814 23,552
Deferred acquisition costs 154,115 151,791
Plant and equipment 4,659 938
Deferred tax assets 8,970 9,435
Intangibles 2,389 1,301
Goodwill 9,123 9,123
Total assets 3,676,989
3,765,885
Liabilities
Trade and other payables 33,359
31,653
Reinsurance payable 85,216
159,979
Outstanding claims 4.1 339,336
339,679
Unearned premium 1,192,455
1,108,554
Employee benefits provision 7,114
6,796
Interest bearing liabilities 5.1 197,591
197,035
Total liabilities 1,855,071
1,843,696
Net assets 1,821,918
1,922,189
Equity
Share capital 5.2 1,218,829 1,303,151
Share based payment reserve 1,534 2,528
Other reserves (476,559) (476,559)
Retained earnings 1,078,114 1,093,069
Total equity 1,821,918 1,922,189

10
Consolidated statement of changes in
equity For the half year ended 30 June 2018
Share
capital
Other
reserves
Retained
earnings
Share based
payment
reserve
Total
$’000 $’000 $’000 $’000 $’000
Balance at 1 January
2017
1,354,034 (476,559) 1,086,517 3,389 1,967,381
Profit after taxation - - 88,663 - 88,663
Dividends declared and
paid
- - (71,312) - (71,312)
Share based payment
expense recognised
- - - 3,005 3,005
Share based payment
settled
- - - (3,933) (3,933)
Balance at 30 June 2017 1,354,034 (476,559) 1,103,868 2,461 1,983,804
Balance at 1 January
2018 1,303,151
(476,559)
1,093,069
2,528
1,922,189
Profit after taxation - - 41,903 - 41,903
Dividends declared and
paid
- - (56,858) - (56,858)
Share based payment
expense recognised
- - - 484 484
Share based payment
settled
- - - (1,478) (1,478)
Buy-back of shares, net of
transaction costs
(84,322) - - - (84,322)
Balance at 30 June 2018 1,218,829 (476,559) 1,078,114 1,534 1,821,918
The consolidated statement of changes in equity is to be read in conjunction with notes to the financial
statements.

11
Consolidated statement of cash flows For the half year ended 30 June 2018
Note 30 June 2018
$’000
30 June 2017
$’000
Cash flows from operating activities
Premiums received 189,970 182,310
Interest and other income 42,243 58,560
Claims paid (74,980) (57,096)
Financial expense on long term borrowings (3,222) (3,008)
Cash payments in the course of operations (99,392) (87,636)
Income tax paid (22,273) (46,120)
Net cash provided by operating activities 32,346 47,010
Cash flows from investing activities
Payment for plant and equipment and intangibles (5,064) (592)
Payments for investments (583,423) (623,138)
Proceeds from sale of investments 711,577 629,749
Net cash provided by investing activities 123,090 6,019
Cash flows from financing activities
Payments for the on-market buy-back of shares (84,322) -
Dividends paid (56,858) (71,311)
Net cash used in financing activities (141,180) (71,311)
Net (decrease)/increase in cash held 14,256 (18,282)
Cash and cash equivalents at the beginning of the
financial period
43,025 57,634
Cash and cash equivalents at the end of the financial
period 57,281
39,352
The consolidated statement of cash flows is to be read in conjunction with notes to the financial statements.

12
Section 1 Basis of preparation 1.1 Reporting entity This general purpose consolidated financial report is for the half year ended 30 June 2018 and comprises
the consolidated financial statements for Genworth Mortgage Insurance Australia Limited (the “Company”)
and its controlled entities (together referred to as the “Group”). The company is a for-profit entity domiciled
in Australia and its shares are publicly traded on the Australian Securities Exchange (“ASX”). The Group
operates in one business and geographical segment conducting loan mortgage insurance business in
Australia; hence no segment information is presented.
The financial statements were authorised for issue by the Board of Directors on 1 August 2018.
The consolidated half year financial report does not include all the information required for full annual financial
reports, and should be read in conjunction with the annual report for the year ended 31 December 2017 and
any public announcements made during the half year reporting period in accordance with the continuous
disclosure reporting requirements of the Corporations Act 2001.
1.2 Basis of preparation
(a) Statement of compliance This consolidated financial report is a general purpose half year financial report that has been prepared in
accordance with the Corporations Act 2001, Australian Accounting Standard AASB 134 Interim Financial
Reporting, and all other applicable Australian Accounting Standards adopted by the Australian Accounting
Standards Board (“AASB”) and the ASX listing rules.
International Financial Reporting Standards (“IFRSs”) form the basis of Australian Accounting Standards
adopted by the AASB, being Australian equivalents to IFRS (“AIFRS”). The half year financial report of the
consolidated entity also complies with IAS 34 Interim Financial Reporting, IFRSs and interpretations adopted
by the International Accounting Standards Board.
The current IFRS standard for insurance contracts does not include a comprehensive set of recognition and
measurement criteria. The IASB has issued a new standard (IFRS 17 Insurance Contracts – adopted as
AASB 17 Insurance Contracts in an Australian context) that does include such criteria, however this standard
will not come into effect until 1 January 2021, at which time AASB 9 will be implemented as well given the
Company meets the requirements for deferral under AASB 2016-6. Until this standard takes effect, the
financial reports of insurers in different countries that comply with IFRS may not be comparable in terms of
the recognition and measurement of insurance contracts.
Selected explanatory notes are included to explain events and transactions that are significant to an
understanding of the changes in financial position and performance of the Group.
(b) Basis of preparation The consolidated financial report is prepared on the historical cost basis except for investments being stated
at fair value and outstanding claims and the related reinsurance recoveries on unpaid claims being stated at
present value. All values are rounded to the nearest thousand dollars, unless otherwise stated, in accordance
with ASIC Corporations Instrument 2016/191.
The consolidated financial report is presented in Australian dollars.
The consolidated statement of financial position has been prepared using the liquidity format of presentation,
in which the assets and liabilities are presented broadly in order of liquidity.
(c) Significant accounting policies adopted The accounting policies adopted in the preparation of this financial report are consistent with those applied
for the previous reporting year except as set out below.

13
New and amended accounting standards adopted by the Group
New standards, amendments and interpretations Operative date
AASB 15 Revenue from contracts with customers 1 January 2018
AASB 2015-8
Amendments to Australian Accounting Standards – Effective date
of AASB 15 1 January 2018
AASB 2015-10
Amendments to Australian Accounting Standards – Effective date
of Amendments to AASB 10 and AASB 128 1 January 2018
AASB 2016-3
Amendments to Australian Accounting Standards – Clarifications
to AASB 15 1 January 2018
AASB 2016-5
Amendments to Australian Accounting Standards - Classification
and measurement of share-based payment transactions 1 January 2018
AASB 2016-6
Amendments to Australian Accounting Standards – Applying
AASB 9 Financial Instruments with AASB 4 Insurance Contracts 1 January 2018
AASB 2017-3
Amendments to Australian Accounting Standards – Clarifications
to AASB 4 1 January 2018
IFRIC Interpretation 22 Foreign currency transactions and advance consideration 1 January 2018
AASB 15 introduces a single model for the recognition of revenue based on when control of goods and
services transfers to a customer. It does not apply to insurance contracts and financial instruments. Hence
the Group’s revenue is not materially impacted by this change.
There were no new Australian Accounting Standards and Interpretations issued and effective, including the
above, which had a material financial impact on the Group.
(d) Use of estimates and judgements The preparation of a financial report requires management to make judgements, estimates and assumptions
that affect the application of policies and reported amounts of assets, liabilities, income and expenses. The
estimates and associated assumptions are based on historical experience and various other factors that are
believed to be reasonable in the circumstances, the results of which form the basis of making judgements
about the carrying values of assets and liabilities that are not readily apparent from other sources.
These estimates and underlying assumptions are reviewed on an ongoing basis and actual results may vary
from estimates. Revisions to accounting estimates are recognised in the period in which the estimate is
revised if the revision affects only that period or in the period of the revision and future periods if the revision
affects both current and future periods.
The approach to key estimates and judgements for this reporting period are the same as the 2017 financial
year, unless otherwise stated.
(e) Comparative figures Comparative figures have been adjusted, where necessary, to conform to the basis of presentation and the
classification used in the current period.
Section 2 Risk management 2.1 Financial risk management
Fair value measurements Accounting policies
Financial assets backing general insurance liabilities
The assets backing general insurance liabilities are those assets required to cover the technical insurance
liabilities (outstanding claims and unearned premiums) plus an allowance for capital adequacy.

14
The Group has designated the assets backing general insurance activities based on its function. Initially
insurance technical balances are offset against the required assets, with any additional assets required being
allocated based on liquidity.
In accordance with the Group’s investment strategy, the Group actively monitors the average duration of the
notional assets allocated to insurance activities to ensure sufficient funds are available for claim payment
obligations.
The Group accounts for financial assets and any assets backing insurance activities at fair value through
profit and loss, with any unrealised profits and losses recognised in the statement of comprehensive income.
The valuation methodologies of assets valued at fair value are summarised below:
Cash assets and bank overdrafts are carried at face value of the amounts deposited or drawn;
Fixed interest securities are initially recognised at fair value, determined as the quoted cost at date
of acquisition. They are subsequently remeasured to fair value at each reporting date. For securities
traded in an active market, fair value is determined by reference to published bid price quotations.
For securities not traded and securities traded in a market that is not active, fair value is determined
using valuation techniques with the most common technique being reference to observable market
data using the fair values of recent arm’s length transactions involving the same or similar
instruments. In the absence of observable market information, unobservable inputs which reflect
management’s view of market assumptions are used. Valuation techniques maximise the use of
observable inputs and minimise the use of unobservable inputs; and
Listed equity securities are designated as financial assets at fair value through profit and loss upon
initial recognition. They are initially recorded at fair value, determined as the quoted cost at date of
acquisition and are subsequently remeasured to fair value at each reporting date.
Financial assets not backing general insurance liabilities
Investments not backing insurance liabilities are designated as financial assets at fair value through profit
and loss on the same basis as those backing insurance liabilities.
The Group’s financial assets and liabilities are carried at fair value.
The Group investments carried at fair value have been classified under the three levels of the IFRS fair value
hierarchy as follows:
Level 1 - Quoted prices in an active market: Fair value investments which are quoted in active and known
markets. The quoted prices are those at which transactions have regularly and recently taken place within
such markets.
Level 2 - Valuation techniques with observable parameters: Fair value investments using inputs other than
quoted prices within Level 1 that are observable either directly or indirectly.
Level 3 - Valuation techniques with significant unobservable parameters: Fair value investments using
valuation techniques that include inputs that are not based on observable market data.
30 June 2018 Level 1 Level 2 Level 3 Total
$’000 $’000 $’000 $’000
Financial Instruments
Government and semi-government bonds - 856,932 - 856,932
Corporate bonds - 1,332,743 - 1,332,743
Equity investments 160,249 - - 160,249
Short term deposits 871,432 - - 871,432
Total 1,031,681 2,189,675 - 3,221,356

15
31 December 2017 Level 1 Level 2 Level 3 Total
$’000 $’000 $’000 $’000
Financial Instruments
Government and semi-government bonds - 751,250 - 751,250
Corporate bonds - 1,308,056 - 1,308,056
Equity investments 237,443 - - 237,443
Short term deposits 1,051,798 - - 1,051,798
Total 1,289,241 2,059,306 - 3,348,547
Interest bearing liabilities are initially measured at fair value (net of transaction costs) but are subsequently
measured at amortised cost. The Company considers the fair value of the interest bearing liabilities to be
approximate to that of the carrying value. The interest bearing liabilities have been classified as Level 2 under
the three levels of the IFRS fair value hierarchy.
Section 3 Results for the period 3.1 Dividends Accounting policy
A provision for dividends is made in respect of ordinary shares when dividends have been declared on or
before the reporting date but have not yet been distributed at that date.
Cents per
share
Total amount
$m
Payment date Tax rate for
franking credit
Percentage
franked
2016 final dividend
14.0
71.3
8 March 2017 30% 100%
2017 interim dividend 12.0 61.1 30 August 2017 30% 100%
2017 special dividend 2.0 10.2 30 August 2017 30% 100%
2017 final dividend1 12.0 56.9 16 March 2018 30% 100%
1of the total 2017 final dividend declared of $59.1 million, right and entitlement of $2.2 million to dividends was waived resulted from the share buy-back during the year.
Dividends not recognised at reporting date Cents per
share
Total amount
$m
Expected payment
date
Tax rate for
franking credit
Percentage
franked
2018 interim dividend 8.0 36.82 30 August 2018 30% 100%
2018 special dividend 4.0 18.42 30 August 2018 30% 100%
2based on the number of shares on issue at 2 July 2018 (553,948 shares were cancelled on 2 July 2018 and
no dividend will be paid on these shares).
3.2 Earnings per share Accounting policies
Basic earnings per share is calculated by dividing the profit after tax by the weighted average number of
shares on issue during the reporting period.
Diluted earnings per share is calculated by dividing the profit after tax adjusted for any costs associated with
dilutive potential ordinary shares by the weighted average number of ordinary shares and dilutive potential
ordinary shares.
30 June 2018 30 June 2017
Basic earnings per share (cents per share) 8.9 17.4
Diluted earnings per share (cents per share) 8.9 17.4

16
(a) Reconciliation of earnings used in calculating earnings per share 30 June 2018
$’000
30 June 2017
$’000
Profit after tax 41,903 88,663
Profit used in calculating basic and diluted earnings per share 41,903 88,663
(b) Reconciliation of weighted average number of ordinary shares used in
calculating earnings per share 30 June 2018
$’000
30 June 2017
$’000
Weighted average number of ordinary shares on issue 470,105 509,392
Weighted average number of shares used in the calculation of
basic earnings per share
470,105 509,392
Weighted average number of dilutive potential ordinary shares
Bonus element of shares
557 841
Weighted average number of shares used in the calculation of
diluted earnings per share 470,662 510,233
Section 4 Insurance contracts 4.1 Outstanding claims Accounting policies
Claims expense and a liability for outstanding claims are recognised in respect of direct and inward
reinsurance business. The liability covers claims reported and outstanding, IBNR and the expected direct
and indirect costs of settling those claims. Outstanding claims are assessed by estimating the ultimate cost
of settling delinquencies, which includes IBNR and settlement costs, using statistics based on past
experience and trends. Changes in outstanding claims are recognised in profit or loss in the reporting period
in which the estimates are changed.
The provision for outstanding claims contains a risk margin to reflect the inherent uncertainty in the central
estimate, the central estimate being the expected value of outstanding claims.
No discounting has been applied to non-current claims on the basis that the effect is immaterial.
Refer to Note 4.3 Accounting estimates and judgements for further detailed information.
30 June
2018
$’000
31 December
2017
$’000
Central estimate 300,090 300,375
Risk margin 39,246 39,304
Gross outstanding claims 339,336 339,679

17
(a) Reconciliation of changes in outstanding claims 30 June
2018
$’000
31 December
2017
$’000
Opening balance at 1 January 339,679 355,546
Current period net claims incurred 76,375 141,774
Movement in non-reinsurance recoveries (1,738) (10,862)
Claims paid (74,980) (146,779)
Closing balance 339,336 339,679
Current 255,547 254,730
Non-current 83,789 84,949
339,336 339,679
4.2 Reinsurance and non-reinsurance recoveries Accounting policies
Reinsurance and other recoveries receivable
Reinsurance and other recoveries receivable on paid claims, reported claims not yet paid and IBNR claims
are recognised as revenue. Recoveries receivable on paid claims are presented as part of non-reinsurance
recoveries receivable net of any provision for impairment based on objective evidence for individual
receivables. Recoveries receivable are assessed in a manner similar to the assessment of outstanding claims.
Reinsurance does not relieve the Group of its liabilities to policyholders and reinsurance recoveries are, if
applicable, presented as a separate asset on the statement of financial position.
30 June
2018
$’000
31 December
2017
$’000
Opening balance 23,552 34,414
Movement of non-reinsurance recoveries 62 (962)
Net borrower recoveries receivable recognised (1,800) (9,900)
Closing balance 21,814 23,552
When claims are paid, Genworth typically obtains a legally enforceable judgement against borrowers for the
amount of the loss incurred. Genworth actively engages in collection activities to recover monies from
borrowers under these judgements. Based on a history of successful collection activities over the last few
years and current economic conditions, an expected recovery rate was established and a recovery accrual
related to claims paid was recorded.
4.3 Accounting estimates and judgements Critical accounting estimates and judgements
The Group makes judgements, estimates and assumptions that affect the application of accounting policies
and the reported amounts of assets, liabilities, income and expenses. Estimates and judgements are
continually evaluated and are based on historical experience and other factors, including expectations of
future events that are believed to be reasonable under the circumstances.
The areas where critical accounting estimates and judgements are applied are noted below.

18
Estimation of premium revenue/ unearned premium/ deferred acquisition costs
Premium is earned over periods of up to 12 years. The principle underlying the earning recognition is to
derive a premium earning scale which recognises the premium in accordance with the incidence of claims
risk.
The review of the premium earning scale is based on an annual analysis of a number of factors including the
historical pattern of claims incurred, the pattern of policy cancellations, economic outlook and policyholder
risk profile. The estimate for unearned premiums is established on the basis of this earning scale. Changes
to earnings curve assumptions, which in turn impact the timing of the recognition of unearned premium and
DAC, are recognized prospectively. Changes are recommended by the Appointed Actuary when the results
of the annual analysis indicate an ongoing change in the pattern of emergence of risk.
Deferred acquisition costs are amortised under the same premium earnings scale as the related insurance
contract.
Estimation of outstanding claims liabilities
Provision is made for the estimated claim cost of reported delinquencies at the reporting date, including the
cost of delinquencies incurred but not yet reported to the Group.
The estimated cost of claims includes direct expenses to be incurred in settling claims gross of expected
third party recoveries. The Group takes all reasonable steps to ensure that it has appropriate information
regarding its claims exposure. However, given the uncertainty in establishing claims provisions, it is likely
that the final outcome will prove to be different from the original liability established.
A risk margin is added to the central estimate as an additional allowance for uncertainty in the ultimate cost
of claims over and above the central estimate. The overall margin adopted by the Group is determined after
considering the uncertainty in the portfolio, industry trends, the Group's risk appetite and the margin
corresponding with that appetite.
The estimation of IBNR is generally subject to a greater degree of uncertainty than the estimation of the cost
of settling claims already notified to the Group, where more information about the claim event is generally
available. IBNR claims may often not be apparent to the insured until sometime after the events giving rise
to the claims have happened.
In calculating the estimated cost of unpaid claims, the Group uses a variety of estimation techniques,
generally based upon statistical analysis of historical experience, which assumes that the development
pattern of the current claims will be consistent with past experience. Allowance is made, however, for
changes or uncertainties which might create distortion in the underlying statistics or cause the cost of
unsettled claims to increase or decrease when compared with the cost of previously settled claims.
Provisions are calculated gross of any recoveries. A separate estimate is made of the amounts that will be
recoverable from lenders under specified arrangements. Estimates are also made for amounts recoverable
from borrowers and property valuers, based upon the gross provisions.
Section 5 Capital management and
financing 5.1 Interest bearing liabilities Accounting policies
Interest bearing liabilities are initially recognised at fair value less transaction costs that are directly
attributable to the transaction. After initial recognition the liabilities are carried at amortised cost using the
effective interest rate method.
Finance related costs include interest, which is accrued at the contracted rate and included in payables, and
amortisation of transaction costs which are capitalised, presented together with borrowings, and amortised
over the life of the borrowings. This cost also includes the write off of capitalised transaction costs and
premium paid on the early redemption of borrowings.

19
30 June
2018
$’000
31 December
2017
$’000
Subordinated notes
$200 million subordinated notes (a) 200,000 200,000
Less: capitalised transaction costs (2,409) (2,965)
197,591 197,035
(a) On 3 July 2015, GFMI issued $200,000,000 of 10 year, non-call five year subordinated notes. The notes
qualified as Tier 2 Capital under the APRA’s capital adequacy framework.
Key terms and conditions are:
Interest is payable quarterly in arrears, with the rate each calendar quarter being the average of the
90 day bank bill swap rate at the end of the prior quarter plus a margin equivalent to 3.5% per annum;
and
The notes mature on 3 July 2025 (non-callable for the first 5 years) with the issuer having the option
to redeem at par from 3 July 2020. Redemption at maturity, or any earlier date provided for in the
terms and conditions of issue, is subject to prior approval by APRA.
5.2 Equity
Share capital 30 June
2018
$’000
31 December
2017
$’000
Issued fully paid capital
Opening balance 1,303,151 1,354,034
Buy-back shares, net of transaction costs (84,322)1 (50,883)
Closing balance 1,218,829 1,303,151
1 553,948 shares have been bought back on 28 June 2018 for a value of $1,442,000. These shares have
been cancelled on 2 July 2018. These shares form part of the buy-back shares disclosed in the table above.
The Company’s issued shares do not have a par value. All ordinary shares are fully paid. Ordinary shares
have the right to receive dividends as declared and, in the event of winding up the Company, to participate
in the proceeds from the sale of all surplus assets in proportion to the number of and amounts paid up on
shares held.
Ordinary shares entitle their holder to one vote, either in person or by proxy, at a meeting of the Company.
On-market buy-back
On 2 August 2017, the Company announced its intention to commence, with effect from 21 August 2017, an
on-market share buy-back program for shares up to a maximum equivalent value of $100 million. As at 31
December 2017 the Company acquired 17,013,668 of shares for a total consideration of $51 million
On 9 February 2018, the Company recommenced the on-market FY 2017 share buy-back program and
completed the program on 21 February 2018 with 18,537,698 shares acquired for a total consideration of
$49 million.
On 2 May 2018, the Company announced its intention to commence, with effect from 17 May 2018 and
continue until 31 October 2018 an on-market share buy-back program for shares up to a maximum equivalent
value of $100 million. As at 30 June 2018 the Company acquired 13,596,431 of shares for a total
consideration of $35 million.
5.3 Contingencies There were no contingent liabilities as at 30 June 2018.

20
Section 6 Other disclosures 6.1 Related party disclosures Transactions with related parties are undertaken on normal commercial terms and conditions.
Corporate overhead
On settlement of the Company‘s IPO, the Group entered into certain agreements with Genworth Financial
and its affiliates. Under the agreements GFI will provide certain services to the Group, with most services
being terminated if GFI ceases to beneficially own more than 50% of the common shares of the Company or
at the request of either party at annual successive renewal terms after the initial term ends on 31 December
2016. The services rendered by GFI and affiliated companies consist of finance, human resources, legal and
compliance, investments services, information technology and other specified services. These transactions
are in the normal course of business and accordingly are measured at fair value. Payment for these service
transactions are non-interest bearing and are settled on a quarterly basis. The Group incurred net charges
of $1,363,339 (30 June 2017: $2,028,000) for the half year ended 30 June 2018. There is a payable balance
of $284,000 (30 June 2017: $402,000) as at 30 June 2018.
Share buy-back
GFI participated in on-market sale transactions during the buy-back program to maintain the approximately
52 per cent stake in the Group. GFI has sold 16.7 million shares for a total consideration of $43.3 million as
at 30 June 2018. Refer to Note 5.2 Equity for further details.
6.2 Share based payments Accounting policies
Share-based payment transactions
Share based remuneration is provided in various forms to eligible employees and executive Directors of the
Group in compensation for services provided to the Group.
The fair value at the grant date, being the date both the employee and the employer agree to the arrangement,
is determined using a valuation model based on the share price at grant date and the vesting conditions. The
fair value does not change over the life of the instrument. At each reporting period during the vesting period
and upon final vesting or expiry of the equity instruments, the total accumulated expense is revised based
on the fair value at grant date and the latest estimate of the number of equity instruments that are expected
to vest based on the vesting conditions, and taking into account the expired portion of the vesting period. The
movement in the total of accumulated expenses from the previous reporting date is recognised in the profit
and loss with a corresponding movement in the share based payment reserve.
To satisfy obligations under the various share based remuneration plans, shares are generally expected to
be equity settled.
Share Rights Plan
On 21 May 2014, the Group granted restricted share rights to a number of key employees including executive
KMP. The aggregate amount of these share rights was $7,265,000. One third of the share rights granted
during the year vest on each of the second, third and fourth anniversaries of the grant date. If at any time an
employee ceases continuous service with the Group, any unvested share rights are immediately cancelled,
except in cases of retirement, redundancy, total and permanent disability or death.
In addition to the grants to key employees, other employees were granted an amount of share rights in the
aggregate amount of $276,000. All share rights granted to other employees vest on the third anniversary of
the grant date. If at any time an employee ceases continuous service with the Group, any unvested share
rights vest immediately. The aggregate amount of $276,000 was expensed during the year ended 31
December 2014.

21
Share rights plan grant date
Available to Vesting period Total ($)
7 May 2015 Nominated employees Four equal tranches vested on first anniversary of grant date
$509,967
6 May 2016 Nominated employees Four equal tranches vested on first anniversary of grant date
$499,030
1 March 2017 Nominated employees Four equal tranches vested on first anniversary of grant date
$492,910
From 2018 onwards, it was decided that no grants would be made under the Equity Plan. All outstanding
grants (prior to 2018) made under the Equity Plan will continue to vest per the original terms and conditions
of the plan.
The fair value of the share rights is calculated as at the grant date using a Black Scholes valuation. The
factors and assumptions used for the valuation are summarised in the below table:
2017 2016 2015 2014
Grant date 1 March 2017 6 May 2016 7 May 2015 21 May 2014
Share price on grant date ($)
$2.81
$3.00
$3.09
$2.95
Dividend yield
8.6% 11.36%
11.16%
7.8%
Risk free rate (%)
Tranche 1: 1.83% Tranche 2: 2.00% Tranche 3: 2.15% Tranche 4: 2.29%
Tranche 1: 1.57% Tranche 2: 1.57% Tranche 3: 1.57% Tranche 4: 1.80%
Tranche 1: 2.03% Tranche 2: 2.03% Tranche 3: 2.20% Tranche 4: 2.35%
Tranche 1: 2.60% Tranche 2: 2.71% Tranche 3: 3.08
Vesting dates Tranche 1: 1 March 2018 Tranche 2: 1 March 2019 Tranche 3: 1 March 2020 Tranche 4: 1 March 2021
Tranche 1: 1 March 2017 Tranche 2: 1 March 2018 Tranche 3: 1 March 2019 Tranche 4: 1 March 2020
Tranche 1: 1 March 2016 Tranche 2: 1 March 2017 Tranche 3: 1 March 2018 Tranche 4: 1 March 2019
Tranche 1: 20 May 2016 Tranche 2: 20 May 2017 Tranche 3: 20 May 2018
Key terms and conditions:
The rights are granted for nil consideration.
Holders do not receive dividends and do not have voting rights until the rights are exercised.
Details of the number of employee share rights granted, exercised and forfeited or cancelled during the period were as follows:
2018
Grant date
Balance at
1 January
2018
Granted in the
year
Exercised in
the year
Cancelled/forfeited
in the year
Balance at 30
June 2018
Vested and
exercisable
at end of
the year
Number Number Number Number Number Number
21 May 2014 294,344 - (269,187) (25,157) - -
7 May 2015 51,936 - (22,710) (6,491) 22,735 -
22 June 2015 3,869 - (1,934) - 1,935 -
6 May 2016 154,224 - (43,139) (31,812) 79,273 -
1 March 2017
363,374 5,890 (173,951) (27,145) 168,168 -
1 March 2018 - 191,6361 - (10,371) 181,265 -
Total 867,747 197,526 (510,921) (100,976) 453,376 -
1 The number of share rights granted in the year representing the deferred short- term incentive component
under the 2017 remuneration program.

22
2017
Grant date
Balance at
1 January
2017
Granted in the
year
Exercised in
the year (*)
Cancelled/forfeited
in the year
Balance at 31
December 2017
Vested and
exercisable
at end of
the year
Number Number Number Number Number Number
21 May 2014 844,020 - (423,052) (126,624) 294,344 -
21 May 2014 54,665 - (54,665) - - -
7 May 2015 99,528 - (35,543) (12,049) 51,936 -
22 June 2015 5,803 - (1,934) - 3,869 -
6 May 2016 271,714 - (117,490) - 154,224 -
1 March 2017 - 382,3441 (703) (18,267) 363,374 -
Total 1,275,730 382,344 (633,387) (156,940) 867,747 -
1 The number of share rights granted in the year includes 139,169 shares rights, representing the deferred
short-term incentive component under the 2016 remuneration program.
* included employees who ceased service with the Group, any unvested share rights vested immediately.
Long term incentive plan (LTI)
The Group implemented a long term incentive plan for executive KMP which is performance oriented and
reflects local market practice.
LTI grant date Nature of award Vesting conditions Total ($)
7 May 2015 share rights continuous active employment for four years from grant date.
Subject to performance conditions
$1,822,777
6 May 2016 share rights $1,729,230
1 March 2017 share rights $1,873,986
1 March 2018 share rights $1,886,491
Key terms and conditions:
The rights are granted for nil consideration
Holders are entitled to receive notional dividend equivalents during the vesting period but do not
have voting rights.
Each allocation is split equally into two portions which are subject to different performance hurdles
with a twelve month deferral period after the performance period ends. The first vesting condition is
not market related and requires continuous active employment for four years from grant date. The
second set of vesting conditions are as follows:
25% is subject to a return on equity performance condition (ROE). The Group’s 3-year average
ROE is tested against target ROEs over a 3 year period.
75% is subject to a relative total shareholder return performance condition (TSR). The Group’s
TSR is tested against comparator group, the ASX 200 financial services excluding Real Estate
Investment Trust (REITs) over a 3 year period.
The number of share rights offered is determined by dividing the grant value of the 2018 long term
incentive plan by $2.6611, being the 10-day volume weighted average price (VWAP) of the
Company share price following the release of full-year results for 2017, rounded down to the nearest
whole share right. Each share right is a right granted to acquire a fully paid ordinary share of the
Company.
The fair value of the share rights is the share price as at the grant date.
If an employee ceases employment with the Group before the performance conditions are tested, their
unvested rights will generally lapse.

23
The fair value of the share rights for LTI is calculated as at the grant date using Monte Carlo simulation. The
factors and assumptions used for the valuation are summarised in the below table.
2018 2017
Grant date 1 May 2018 1 March 2017
Share price on grant date ($) 2.37 $2.81
Dividend yield 0%2 8.60%
Volatility 34.1% 35.00%
Correlation A correlation matrix for the ASX 200 (excluding resource companies) has been used
Risk free rate (%) 2.09% 2.0%
Vesting date 31 December 2021 31 December 2020 2 Consistent with the requirements set out in AASB2, given participants in the LTI plan are entitled to dividend equivalents on the
underlying shares, the input for expected dividend yield has been set to zero. For the purposes of Relative TSR fair value
calculations, the expected dividend yield of the comparator group has also been set to zero
Details of the number of employee share rights granted, exercised and forfeited or cancelled during the period
were as follows:
2018
Grant date Balance at
1 January
2018
Granted in
the year
r
Exercised
in the year
Cancelled/forfeited
in the year
Balance at 30 June
2018
Vested and
exercisable
at end of
the year
Number Number Number Number Number Number
7 May 2015 116,196 - - - 116,196 -
6 May 2016 648,988 - - (96,384) 552,604 -
1 March 2017 646,425 - - (115,383) 531,042 -
17 July 2017 75,025 - - - 75,025 -
1 March 2018 - 708,914 - (41,148) 667,766 -
Total 1,486,634 708,914 - (252,915) 1,942,633 -
2017
Grant date Balance at
1 January
2017
Granted in
the year
Exercised
in the year
Cancelled/forfeited
in the year
Balance at 31
December 2017
Vested and
exercisable
at end of
the year
Number Number Number Number Number Number
7 May 2015 177,497 - - (61,301) 116,196 -
6 May 2016 742,159 - - (93,171) 648,988 -
1 March 2017 - 646,425 - - 646,425 -
17 July 2017 - 75,025
- - 75,025 -
Total 919,656 721,450 - (154,472) 1,486,634 -
Omnibus Incentive Plan
GFI, GFMI and LLC entered into a Cost Agreement on 15 July 2005 (as varied from time to time) pursuant
to which GFI agreed to offer its 2004 Omnibus Incentive Plan and its 2012 Omnibus Incentive Plan (Omnibus
Incentive Plans) to certain employees of GFMI and LLC.
Under the Omnibus Incentive Plans, GFI issues stock options, stock appreciation rights, restricted stock,
restricted stock units, other stock based awards and dividend equivalent awards with respect to its common
stock to employees of its affiliates throughout the world. Under the Cost Agreement, GFMI and LLC have
agreed to bear the costs for their employees’ participation in the Omnibus Incentive Plans from time to time.
Employees of GFMI and LLC will not, following the IPO, receive any further awards under the Omnibus
Incentive Plans. Any incentives after that date will be provided through the Group’s share rights plan.

24
However, GFMI and LLC will continue to bear the costs of past awards under the Omnibus Incentive Plans.
The Group has reserved for such costs and the amount of the reserve is marked to market to reflect the
Group’s exposure to those costs having regard to the price of GFI shares.
6.3 Events subsequent to reporting date As the following event occurred after reporting date and did not relate to conditions existing at reporting date,
no account has been taken in the financial statements for the current reporting period.
On 1 August 2018, the Directors declared a 100% ordinary franked dividend of 8.0 cents per share totalling
$36,817,000 and a 100% franked special dividend for 4.0 cents per share totalling $18,409,000.

25
Directors’ declaration In the opinion of the Directors of Genworth Mortgage Insurance Australia Limited (the Company):
a) the condensed consolidated financial statements and notes set out on pages 8 to 24 are in
accordance with the Corporations Act 2001, including:
(i) giving a true and fair view of the Group’s financial position as at 30 June 2018 and of its
performance, for the six month period ended on that date; and
(ii) complying with Australian Accounting Standards AASB 134 Interim Financial Reporting and
the Corporations Regulations 2001 and
b) there are reasonable grounds to believe that the Group will be able to pay its debts as and when
they become due and payable.
Signed in accordance with a resolution of the Directors
___________________________
Ian MacDonald
Chairman
Dated: 1 August 2018.