geo479/579: geostatistics ch13. block kriging. block estimate requirements an estimate of the...
TRANSCRIPT

Geo479/579: Geostatistics
Ch13. Block Kriging

Block Estimate
Requirements
An estimate of the average value of a variable within a prescribed local area
One method is to discritize the local area into many points and then average the individual point estimates to get the average over the area
This method is computationally expensive

Objective
See how the number of computations can be significantly reduced by constructing and solving only one kriging system for each block estimate
Block Kriging

Block Kriging
Block Kriging is similar to the point kriging The mean value of a random function over a
local area is simply the average (a linear combination) of all the point random variables contained in the local area
Where VA is a random variable corresponding to the mean value over an area A, and Vj are random variables corresponding to point values within A
Ajj
jA VA
V1
Equation 13.1

Point Kriging In point kriging, the covariance matrix D consists
of random variables at the sample locations and the location of interest
˜ C 11 ˜ C 1n 1
˜ C n1 ˜ C nn 1
1 1 0
w1
wn
˜ C 10
˜ C n 0
1
C w D
w C-1 D(12.14)
(12.13)

Point Kriging
In point kriging, these are point-to-point covariances. For block kriging, these are point-to-block covariances (the block of interest)
˜ C 11 ˜ C 1n 1
˜ C n1 ˜ C nn 1
1 1 0
w1
wn
˜ C 1A
˜ C nA
1
C w D
w C-1 D

Block Kriging
Point-to-block covariances required for Block Kriging
˜ C iA Cov(VA ,Vi) E(VAVi) E(VA )E(Vi)
E1
| A |V j
j | jA
Vi
E
1
| A |V j
j | jA
E(Vi)
1
| A |{E(
j | jA
V jVi) E(V j )E(Vi)}
1
| A |Cov(V j
j | jA
Vi)
Block Kriging
The covariance between the random variable at the ith sample location and the random variable VA representing the average value over the area A is the same as the average of the point-to-point covariances between Vi and the random variables at all the points within A
Block Kriging
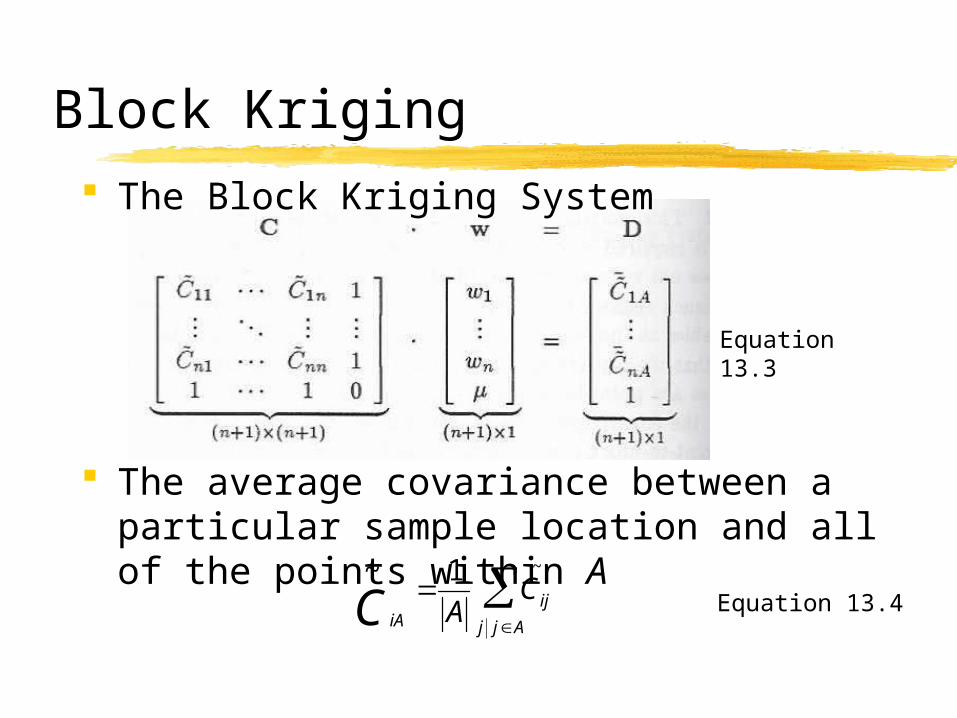
The Block Kriging System
The average covariance between a particular sample location and all of the points within A
C~
iA
1
ACij
~
j jA
Equation 13.3
Equation 13.4

Block Kriging
The Block Kriging Variance:
The value C is the average covariance between pairs of locations within A
~
OK
2
C~
AA ( wi
i1
n
C~
iA )
ijAii Ajj
AA CA
C
~
2
~ 1
Equation 13.5
Equation 13.6

Ordinary Kriging Variance Calculate the minimized error variance by using
the resulting to plug into equation (12.8)
˜ R2 ˜ 2 wi
j1
n
w j˜ C ij
i1
n
2 wi˜ C i0
i1
n
˜ 2 ( wi˜ C i0
i1
n
)
iw

Block Estimates vs. the Averaging of Point Estimates
The average of the four point estimates is the same as the direct block estimate The average of the point kriging weights for a sample is the same as the block kriging weight for the sample
Figure 13.1

Varying the Grid of Point Locations within a Block
When using the Block Kriging approach - How to discretize the local area for block being estimated?• The grid of discretizing points should be
always regular• The spacing between points may be larger in
one direction than the other if the spatial continuity is anisotropic (Figure 13.2)

Discretizing Points The shaded block is approximated by six points located on a
2X3 grid. The closer spacing of the points in a north-south direction reflects a belief that there is less continuity in this direction than in the east-west direction. Despite the differences in the east-west and north-south spacing, the regularity of the grid ensures that each discretizing point accounts for the same area, as shown by the dashed line
Figure 13.2

Discretizing Points
Discretizing points < 16, Significant differences Discretizing points = > 16, Estimates are similar
Sufficient discretizing points number
2D block: 4x4 = 16, 3D block: 4x4x4 = 64
Table 13.2
Block Kriging vs. Inverse Distance Squared Block Estimates
A plus symbol denotes a positive estimation error while a minus symbol denotes negative estimation error
The relative magnitude of the error corresponds to the degree of shading indicated by the grey scale at the top of the figure

Block Kriging vs. Inverse Distance Squared Block Estimates
Figures 13.3, 13.4
Figure 13.4

Case Study
Comparison of summary statistics for Block Kriging and Inverse Distance Weighted
Inverse Distance Weighted has larger errors For Inverse Distance Weighted, there are several large
overestimation where relatively sparse sampling meets much denser sampling
Inverse Distance Weighted did not correctly handle the clustered samples, giving too much weight to the additional samples in the high-valued areas
Block Kriging showed some underestimation due to its smoothing effect and the positive skewness of the distribution of the true block values

Block Kriging vs. Point KrigingFigures 13.3, 13.5

Block Kriging vs. Inverse Distance Squared Block Estimates
Table 13.3Estimates
Table 13.4Errors

Block Kriging versus Point Kriging
Table 13.5 Errors