geochemical and isotope analysis of produced water from
TRANSCRIPT

Geochemical and isotope analysis of produced water from the Utica/Point Pleasant Shale, Appalachian Basin
Journal: Environmental Science: Processes & Impacts
Manuscript ID EM-ART-02-2020-000066.R1
Article Type: Paper
Environmental Science: Processes & Impacts
1 Geochemical and isotope analysis of produced water from the Utica/Point Pleasant Shale,
2 Appalachian Basin
3 Tasker, T.L.*, Warner, N.R., Burgos, W.D.
4 Department of Civil and Environmental Engineering, The Pennsylvania State University, 212
5 Sackett Building, University Park, Pennsylvania 16802, United States
6 *Current address of corresponding author: Department of Environmental Engineering, Saint 7 Francis University, 117 Evergreen Drive, Loretto, PA 15940; Email: [email protected]
8 Abstract
9 While development of the Utica/Point Pleasant Shale (UPP) is extensive in Ohio (U.S.)
10 and increasing in Pennsylvania and West Virginia, few studies report the chemistry of produced
11 waters from UPP wells. These data have important implications for developing best management
12 practices for handling and waste disposal, or identifying the fluid in the event of accidental spill
13 events. Here, we evaluated the elemental and isotope chemistry of UPP produced waters from 26
14 wells throughout Ohio, Pennsylvania, and West Virginia to determine any unique fluid
15 chemistries that could be used for forensic studies. Compared to the Marcellus, UPP produced
16 waters contain higher activities of total radium (226Ra + 228Ra) and higher 228Ra/226Ra ratios. As
17 with the Marcellus Shale, elemental ratios (Sr/Ca) and isotope ratios (87Sr/86Sr) can distinguish
18 UPP produced waters from many conventional oil and gas formations. Sr/Ca and 87Sr/86Sr ratios
19 can fingerprint small fractions (~0.1%) of UPP produced water in freshwater. However, because
20 Marcellus and UPP produced waters display similar major elemental chemistry (i.e., Na, Ca, and
21 Cl) and overlapping ratios of Sr/Ca and 87Sr/86Sr, 228Ra/226Ra ratios may be the best tracer to
22 distinguish these waters.
Page 1 of 28 Environmental Science: Processes & Impacts
123456789101112131415161718192021222324252627282930313233343536373839404142434445464748495051525354555657585960

23 Environmental Significance:
24 It is important to understand the chemistry of the Oil and Gas produced water to help 1)
25 identify spatial variability in formation waters, 2) evaluate treatment strategies, and 3) identify
26 accidental releases and track contamination through the environment. Multiple studies have
27 discussed geochemical signatures of unconventional oil and gas wastewater, but many focused
28 solely on water from the Marcellus Formation. Now, with the production of hydrocarbons from
29 the Utica/Point Pleasant Formations (UPP) rapidly increasing along with the volume of produced
30 water, it is vital to evaluate the chemistry of water produced from these formations. In this study,
31 the chemistry of produced water from the UPP is documented along with elemental and isotopic
32 tracers that could be used to identify freshwaters contaminated by UPP wastewaters.
33 Introduction
34 Oil and gas (O&G) production from low-permeability, unconventional shale formations
35 continues to rise in the Appalachian Basin, U.S., generating over 45% of the domestic natural
36 gas in 2018 1. From 2007 to 2018 annual U.S. natural gas production from shale plays rose from
37 36 billion cubic meters (bcm) [1293 billion cubic feet (bcf)] to 617 bcm [22,054 (bcf)]. During
38 that same timeframe the percentage produced from the Appalachian Basin in the states of West
39 Virginia, Ohio, and Pennsylvania rose from less than 1% to over 45%, largely due to the
40 continued development of two unconventional shale formations, the Marcellus and Utica/Point
41 Pleasant (UPP)1. O&G development was historically limited to permeable reservoirs known as
42 conventional formations but has expanded into low permeability unconventional O&G
43 formations over the last 20 years because of technical improvements in horizontal drilling and
44 hydraulic fracturing. During hydraulic fracturing, large volumes of water (30 million liters per
45 well for Marcellus and 38 million liters per well for UPP) mixed with other additives are pumped
Page 2 of 28Environmental Science: Processes & Impacts
123456789101112131415161718192021222324252627282930313233343536373839404142434445464748495051525354555657585960
46 into the formation at high pressure causing the rock to fracture and stimulate hydrocarbon
47 release2. After this process, millions of liters of a salty and radium-bearing fluid (i.e., flow back
48 and produced waters) returns to the surface where it is typically disposed in underground
49 injection control (UIC) wells, reused to stimulate other wells, or treated for reuse at wastewater
50 treatment plants 3. Flowback waters are generally defined as fluids comprising mixtures of in situ
51 formation waters and hydraulic fracturing fluids that flow from a well shortly after the
52 stimulation pressure is released. Produced waters often refer to waters that return after the wells
53 have been in production for some time and are thought to better represent the in situ formation
54 waters or salts from the formation that could have been mobilized by hydraulic fracturing fluids
55 rather than the chemistry of the hydraulic fracturing fluids that were injected.
56 The two largest unconventional shale reservoirs in the Appalachian Basin are the
57 Marcellus and UPP Formations, which are estimated to contain over 2.4 trillion cubic meters
58 (i.e., 84.8 trillion cubic feet) and 1.1 trillion cubic meters (i.e., 38.8 trillion cubic feet) of
59 recoverable natural gas, respectively4,5. The Marcellus is the oldest organic rich shale in the
60 Middle Devonian sequence and overlies the Onondoga Limestone. Currently, there are over
61 10,000 active Marcellus wells in Pennsylvania6. The UPP Shale is several hundred meters below
62 the Marcellus Shale and has been called the “natural gas giant below the Marcellus” 7,8. The UPP
63 Formation is present throughout Ohio, Pennsylvania, West Virginia, New York, Ontario, and
64 Quebec ranging in depth from 2,300 meters in northwest Pennsylvania to 4,000 meters in West
65 Virginia and southern Pennsylvania7. Throughout the Appalachian Basin, the Utica Shale
66 directly overlies the Point Pleasant Shale with both formations having variable concentrations of
67 carbonate (20-60%), clay (30-60%), and total organic content (~1-5%) that is likely related to
68 their geographic location and varying depositional environments7. Collectively, the UPP is
Page 3 of 28 Environmental Science: Processes & Impacts
123456789101112131415161718192021222324252627282930313233343536373839404142434445464748495051525354555657585960

69 thickest (120 to 150 m) throughout southwest and northeast Pennsylvania and gets thinner in
70 eastern Ohio (60-90 m)7. Unconventional O&G development in the Appalachian Basin began in
71 the Marcellus around 2007 but has expanded into the UPP since 20116.
72 Most UPP development has occurred in Ohio but has recently increased in both
73 Pennsylvania and West Virginia. As of January 2020, there were over 2,700 UPP wells in Ohio
74 and over 160 in Pennsylvania 6,9. One of the largest environmental concerns with the increased
75 unconventional O&G production throughout the Appalachian Basin is the possibility of ground
76 water or surface water contamination by hydraulic fracturing fluids or produced waters. In areas
77 dominated by Marcellus development, there are numerous incidents where spills (1,181 spill
78 events in Pennsylvania from 2005-2014)10,11, surface water disposal12,13, improper management
79 at wastewater disposal facilities 14,15, and potentially faulty well casings16 caused Marcellus
80 produced waters to migrate to water resources. No similar incidents have been reported from the
81 more recent growth in UPP O&G development; however, this could be because there is only one
82 study that the authors are aware of that has tested freshwater for UPP produced water
83 contamination17.
84 Despite the environmental concerns and wastewater management challenges associated
85 with unconventional O&G development, UPP produced water chemistry has been published for
86 only two wells18,19. Total dissolved solid (TDS) concentrations in produced waters are highly
87 variable from unconventional shale formations because of variable amounts of dilution with
88 injection waters20–22. Therefore, any comparisons of elemental concentrations among produced
89 waters from different formations should be limited to water of similar TDS, preferably the most
90 saline waters that represent original formation waters20–22. Comparisons among these high-
91 salinity waters for different formations in the Appalachian Basin indicate that they can have
Page 4 of 28Environmental Science: Processes & Impacts
123456789101112131415161718192021222324252627282930313233343536373839404142434445464748495051525354555657585960

92 significantly different concentrations of Ca, Sr, Ba, Ra, and B, among other elements. For
93 instance, the Marcellus has unusually high concentrations of Ba, Sr, and 226Ra relative to other
94 formations in the Appalachian Basin. Formations throughout the Basin also have unique
95 elemental or isotope ratios (i.e., Sr/Ca, 228Ra/226Ra, 87Sr/86Sr, 11B/10B, and 7Li/6Li) that can
96 identify small quantities (often <0.1 %) of produced water mixed with groundwater, surface
97 water, or stream sediments12,22–27. In almost every case study investigating potential O&G
98 contamination events, unique isotope or elemental ratios were used as a forensic tool to
99 determine the source of pollution (i.e., unconventional brine vs. conventional brine vs. road salt
100 vs. acid mine drainage). As development expands in the UPP, similar data could be important in
101 fingerprinting UPP produced waters in the environment, understanding heterogeneities in the
102 formation, and developing strategies for managing UPP produced water from various parts of the
103 play. The existing data for UPP produced water chemistry is not adequate to conduct this
104 fingerprinting because it is from only two wells and is limited to a few analytes (SO4, Cl, Na, Ca,
105 Mg, and K)18,19.
106 The management of UPP produced waters in Pennsylvania, Ohio, and West Virginia fall
107 under the same regulatory statutes and disposal practices as Marcellus fluids, which includes
108 disposal through injection disposal wells, reuse without any treatment to fracture other wells, or
109 treatment at zero liquid discharge treatment plants that remove some of the suspended solids and
110 precipitate out barium-sulfate minerals before reuse for hydraulic fracturing28. Current and future
111 concerns with handling the wastes from UPP development will likely be related to the proper
112 disposal of radioactive sludge generated from facilities treating the fluids, faulty casings on gas-
113 producing wells that may allow fluid migration, or potential spills at the surface. From 2010 to
114 2013, approximately 5% of the Marcellus Shale wells in Pennsylvania received violations for
Page 5 of 28 Environmental Science: Processes & Impacts
123456789101112131415161718192021222324252627282930313233343536373839404142434445464748495051525354555657585960

115 well cementing issues29. The greatest threat to water quality is likely from surface spill events
116 which occur at approximately 10% of the unconventional wells each year30. Therefore, it is
117 essential to develop forensic tools for identifying potential contamination from UPP
118 development after the spill is diluted with freshwater.
119 The objectives of this work were to 1) document the chemistry of liquid wastes from UPP
120 wells, and 2) determine unique isotope or elemental ratios for tracing UPP releases in the
121 environment. To address these objectives, liquid wastes from the UPP were collected from
122 producing wells and analyzed for inorganic chemistry (Cl, Br, SO4, Na, Ca, Mg, Sr, K, Li, B, Ba,
123 Fe, Pb, Cu, As, and U), radioactivity (226Ra and 228Ra), and isotope ratios (87Sr/86Sr). Unique
124 signatures for tracing environmental contamination from UPP development were identified by
125 comparing our results to analyses from other O&G formations in the Appalachian Basin.
126 Methods
127 Produced water collection. UPP produced waters were collected from 26 wells
128 throughout Ohio, Pennsylvania, and West Virginia (Figure 1). Based on well production reports
129 and communication with collaborators from industry, all wells were in production for over 120
130 days, reducing chemical variabilities commonly observed in produced waters collected early
131 after a well goes into production20,31. Produced water samples were collected from O&G water
132 separators at well heads, stored in 10-liter high-density polyethylene (HDPE containers), and
133 preserved to pH<2 with nitric acid for cation analyses or unpreserved for anion analyses.
134 Thereafter, 100 mL of each sample for cation analysis was digested with 6 mL of aqua regia for
135 4 hours at 70oC. There were no suspended solids in any of the samples after digestion. Acid
136 dissolution of suspended particulates could increase the possibility of excess dissolved Fe (and
137 potentially other metals). However, because metal precipitation can occur rapidly after produced
Page 6 of 28Environmental Science: Processes & Impacts
123456789101112131415161718192021222324252627282930313233343536373839404142434445464748495051525354555657585960
138 waters flow from a gas well21, all samples were digested prior to filtering to analyze total metals
139 in solution. The true vertical depth of the sampled UPP wells varied from ~2,300 m in northwest
140 Pennsylvania, ~3,500 m in northeast Pennsylvania, to ~3,700 to 4,000 m in West Virginia and
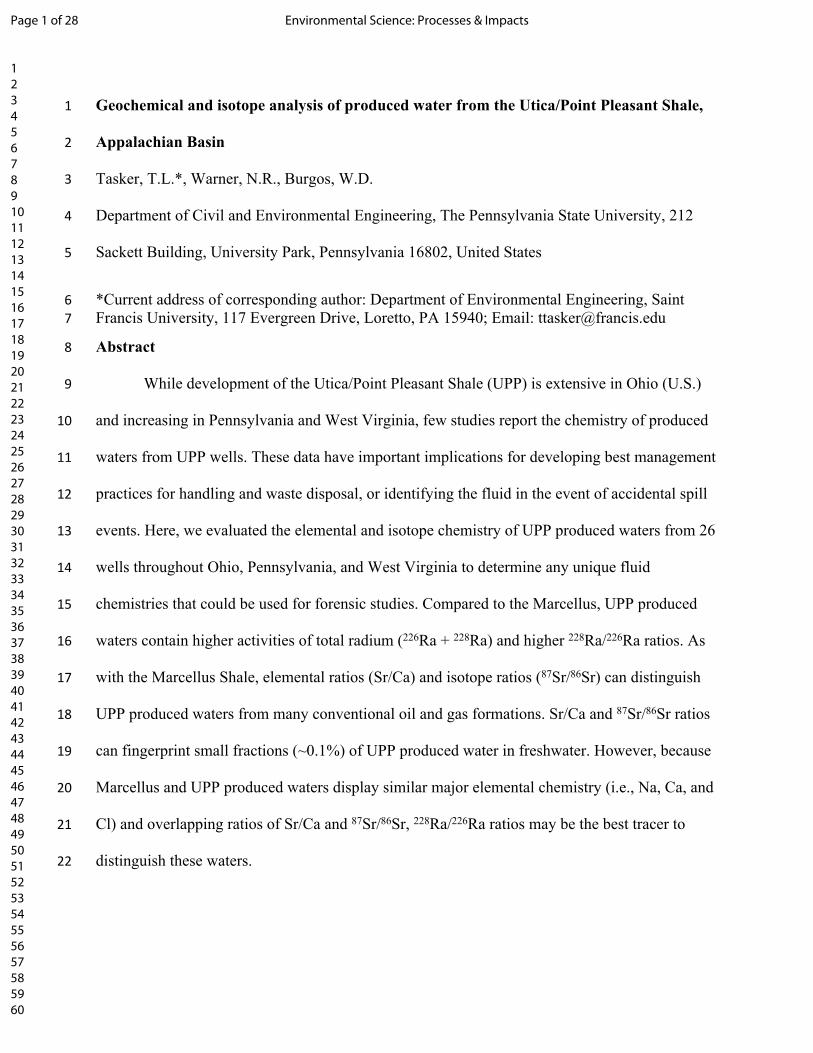
141 southern Pennsylvania (Figure 1).
142143 Figure 1. Sampled oil and gas wells from the Utica/Point Pleasant (UPP) formation in the northern 144 Appalachian Basin, U.S. (A) The UPP play is shaded gray. (B) Active O&G wells producing from the UPP 145 formation are represented with white circles. Produced waters from 26 of the active wells were sampled 146 throughout the Basin with well depths indicated by symbols.
147 Produced water characterizations. Major and minor trace element analyses were
148 performed on a Thermo Scientific iCAP 6000 inductively coupled plasma optical emission
149 spectrometer (ICP-OES; Na, Ca, Mg, Sr, K), Thermo X-Series 2 mass spectrometer (ICP-MS;
150 Li, B, Ba, Fe, Pb, Cd, Cu, As, U) located at Penn State University’s Energy and Environmental
151 Sustainability Laboratories (EESL), and Dionex ICS-1100 ion chromatography (IC; Cl, Br, SO4).
152 Before elemental analyses, samples were filtered (0.45 µm cellulose acetate) and diluted in 2%
153 nitric acid or ≥18MΩ ultrapure water (Cl, Br, SO4) to reach dilution factors of 2000 for Na, Ca,
Page 7 of 28 Environmental Science: Processes & Impacts
123456789101112131415161718192021222324252627282930313233343536373839404142434445464748495051525354555657585960

154 Mg, Sr, and K, 100 for Cl, Br, and SO4, or 50 for all other metals. Mass interferences and matrix
155 complications of analyzing high salinity samples by ICP-MS or ICP-OES were accounted for by
156 using internal spikes (Sc, In, Re, Y) and high salinity, matrix-matched standards 32. Calibration
157 curves for all analyses were verified by confirming <5% differences between measured and
158 known elemental concentrations in check standards (USGS M-220, USGS T-227, and
159 SRM1640a).
160 Isotope analyses were performed using a ThermoFisher Neptune Plus high resolution
161 multicollector (MC-ICP-MS; 87Sr/86Sr) located at Penn State University EESL and a small anode
162 germanium detector gamma spectrometer from Canberra Instruments at the Tracing Salinity with
163 Isotopes Lab (SALTs) also located at Penn State University (228Ra/226Ra). Radioactivity (226Ra,
164 228Ra) was measured in acid digested produced waters at geometries (20 mL and 3 L geometries)
165 consistent with well characterized internal standards from an inter-laboratory comparison that
166 reported most probable radium activities in three Appalachian Basin O&G produced waters 32.
167 After a 21-day equilibration, 226Ra was calculated directly at 186.2 keV and then confirmed from
168 the average activity of 214Bi (609.3 keV) and 214Pb (295.2 & 351.9 keV). Direct measurement of
169 228Ra were performed using its 228Ac daughter at 911.1 keV. Prior to 87Sr/86Sr analysis, strontium
170 was separated from wastewaters with recoveries of 99% ± 3.7 using Sr Spec EICHROM resin
171 and nitric acid (2 N) to yield 0.25 to 1 µg of strontium. Strontium isotope accuracy was
172 determined by comparisons to NIST SRM 987. The average 87Sr/86Sr ratio of the SRM over 41
173 analyses was 0.710240 with a standard deviation of 0.000002 (actual value=0.710240).
174 Additional data sources. Produced water chemistry from the UPP were compared to
175 existing produced water chemistry from O&G formations in the Appalachian Basin. Produced
176 water chemistry data from conventional and unconventional formations were compiled from the
Page 8 of 28Environmental Science: Processes & Impacts
123456789101112131415161718192021222324252627282930313233343536373839404142434445464748495051525354555657585960

177 US Geological Survey (USGS) Produced Water Database version 2.3n33. Produced water
178 chemistry from hydraulically fractured oil and gas wells is known to vary with time after a well
179 goes into production. While all of the UPP wells sampled in this study were over 120 days of
180 production and were believed to have a fluid chemistry reflective of the formation mineralogy or
181 instu formation fluids, an operational chloride threshold was used to reduce potential unknown
182 sources of error in the UPP produced water chemistry and to allow for comparisons of produced
183 water chemistry from different formations. The operational chloride threshold was defined as
184 only including data from wells where chloride concentrations were ≥76,800 mg/L chloride (i.e.,
185 the 5th percentile chloride concentration from the 26 UPP samples collected for this study). This
186 was a reasonable threshold in limiting potential sources of error (e.g., mixing with hydraulic
187 fracturing fluids) in the UPP produced water chemistry. One of the collected UPP samples (UPP
188 24 in Table S1) that was excluded from statistical analyses by this threshold was later found to
189 be compromised by a local hydraulic fracturing job. The sample (i.e., UPP 24) had lower TDS
190 (e.g., ~71,000 mg/L) than was expected for a well with over 120 days of production. After
191 contacting the oil and gas company about this sample, the company stated that the produced
192 water chemistry in sample UPP 24 was likely influenced by fracturing fluids that migrated along
193 a fault line from the local hydraulic fracturing job.
194 In order to compare the UPP produced water chemistry to produced waters from other
195 formations in the Appalachian Basin, all produced water data collected from the US Geological
196 Survey (USGS) Produced Water Database was also filtered to only include samples with
197 ≥76,800 mg/L chloride (i.e., the 5th percentile chloride concentration from the 26 UPP samples
198 collected for this study). While the authors acknowledge that this data inclusion method could
199 cause potential sources of bias, the method would likely bias results so formations would appear
Page 9 of 28 Environmental Science: Processes & Impacts
123456789101112131415161718192021222324252627282930313233343536373839404142434445464748495051525354555657585960

200 to have more similar fluid chemistries; therefore, any observed differences in fluid chemistries
201 are likely real. The total conventional produced water data set from the US Geological Survey
202 (USGS) Produced Water Database included 2,434 analyses from 84 formations. Conventional
203 wastewater results were reduced to 1,122 entries by only including data from wells where
204 chloride concentration was ≥76,800 mg/L chloride. Similarly, data for the Marcellus Shale were
205 reduced from 448 entries to 128 by only including wells with ≥76,800 mg/L chloride.
206 Elemental and isotope ratios for the formations were also compared to ground and
207 surface water resources in Appalachian Basin using the Water Quality Portal from the National
208 Water Quality Monitoring Council34. Water quality data for streams, rivers, and ground water
209 wells were collected from 2000-2005 (n=9,006). Of the 9,006 entries, 5,589 included Cl, 460
210 included Br, 24 included B, 3,504 included Na, 5,542 included Ca, 348 included Mg, 101
211 included Ba, 113 included Sr, 25 included 226Ra, and 25 included 228Ra. The 87Sr/86Sr ratios in
212 freshwaters were also referenced from additional sources35.
213 Statistical analyses. All statistical analyses were performed in RStudio36. Shapiro Wilk
214 tests for normality (Table S7) confirmed that most of the data was not normal. Therefore,
215 Kruskal-Wallis and Wilcoxon rank sum tests with Bonferroni corrections were used to determine
216 if there were any statistical differences between the produced water chemistry from UPP,
217 Marcellus, and conventional formations. Statistical differences between the compared formations
218 were interpreted as being significant if p values were less than 0.05. Elements with
219 concentrations below detection limits were not included in these analyses.
220 Results and Discussion
221 Chemistry of produced waters from the Utica and Point Pleasant Shale. Consistent
222 with produced waters from other O&G formations in the Appalachian Basin, UPP produced
Page 10 of 28Environmental Science: Processes & Impacts
123456789101112131415161718192021222324252627282930313233343536373839404142434445464748495051525354555657585960

223 waters are dominated by sodium, calcium, and magnesium (accounting for >90% of the total
224 cation charge equivalents) and are nearly 100% charge balanced by chloride (Figure 2). Based on
225 the data inclusion method used in this study (i.e., wells with over 76,800 mg/L chloride), the
226 UPP and conventional gas formations have produced waters with higher chloride, calcium, and
227 sodium concentrations than produced waters from Marcellus wells. Median bromide
228 concentrations in UPP produced waters were also 1.6 times higher than produced water from the
229 Marcellus. These differences in bromide concentrations were greater than reported levels of
230 analytical inaccuracy (i.e., typically ± 20% accuracy for O&G wastewater32).
231 Like the Marcellus, UPP produced waters are characterized by high concentrations of
232 barium (ranging from 57 to 2,700 mg/L) and strontium (2,000 mg/L to 6,500 mg/L) (Table S1
233 and S3). No sulfate was detected in any of the UPP produced waters (i.e., all samples < 100mg/L
234 SO4), indicating strong reducing conditions in the formation. Low sulfate concentrations allow
235 high concentrations of dissolved alkaline earth metals that would otherwise precipitate in low
236 solubility sulfate minerals (e.g., Ksp of barite ~10-10)20. Both the Marcellus and UPP produced
237 waters have median barium and strontium concentrations that are greater than the concentrations
238 measured in produced waters from conventional gas wells (Figure 2). High concentrations of
239 these alkaline earth metals in produced waters are variously attributed to evaporated seawater
240 brines reacting with local rock formations over geologic time26,37 or reductive weathering of
241 shales during hydraulic fracturing38,39.
Page 11 of 28 Environmental Science: Processes & Impacts
123456789101112131415161718192021222324252627282930313233343536373839404142434445464748495051525354555657585960

242243 Figure 2. Produced water chemistry from the UPP (red) analyzed in this study compared to other 244 formations in the Appalachian Basin. Produced water analyses from the Marcellus (blue) and 245 conventional O&G formations (white) were previously reported in the USGS Produced Water Database33. 246 Numbers above the x-axis represent the number of analyses for each formation. Green brackets indicate 247 comparisons between two formations that have significantly different produced water chemistry (p<0.05).
248 UPP produced waters have high radioactivity. While the median 226Ra activities in UPP
249 produced water are similar to Marcellus produced waters (e.g., 1522 pCi/L in UPP and 1417
250 pCi/L in Marcellus produced waters), the UPP has higher 228Ra activities (e.g., 1566 pCi/L in
251 UPP and 228 pCi/L in Marcellus Shale produced waters). These differences in 226Ra and 228Ra
252 radioactivity result in 228Ra/226Ra activity ratios in UPP produced waters (i.e, 1.0 to 1.2 based on
253 the 25th to 75th percentiles; Table S5) that are greater than the values reported for Marcellus
Page 12 of 28Environmental Science: Processes & Impacts
123456789101112131415161718192021222324252627282930313233343536373839404142434445464748495051525354555657585960

254 produced waters (i.e., 0.01 to 0.4 based on the 25th to 75th percentiles). Differences in 228Ra/226Ra
255 activity arise from different ratios of their respective radioactive parents (232Th for 228Ra and 238U
256 for 226Ra) in the host reservoir rocks. Typically, the Th/U mass ratios for most silicate rocks fall
257 in the range of 1.5 to 6.0 and generate 228Ra/226Ra activity ratios of 0.5 to 2.0 for both the rocks
258 and for equilibrated formation waters40–42. To generate the median 228Ra/226Ra activity ratio in
259 UPP waters (1.08, Table S5), the UPP reservoir rocks would have to contain a 232Th/238U activity
260 ratio of 1.0 and a Th/U mass ratio of 3.0 that is typical of clay-bearing silicate rocks40,41.
261 Elemental and isotopic ratios for identifying UPP produced water. Several elemental
262 and isotopic ratios could be used to identify contamination from UPP (Figure 3). Median Na/Cl,
263 Cl/Br, (Ca + Mg)/Cl, (Ba + Sr)/Mg, and Sr/Ca molar ratios for all O&G produced waters from
264 the Appalachian Basin are statistically different from freshwaters (Figure 3; Table S6). However,
265 the only ratios that are unique to the UPP produced waters are ratios that incorporate strontium or
266 radium. For instance, (Ba + Sr)/Mg and Sr/Ca ratios for UPP and Marcellus produced waters are
267 not statistically different from each other but are different from conventional O&G produced
268 waters and freshwater (Figure 3). 87Sr/86Sr ratios for UPP produced waters are also in a relatively
269 narrow range (e.g., 87Sr/86Sr = 0.71088 to 0.71143 based on the 25th to 75th percentiles; Table S5)
270 that could be useful in forensic applications. Additionally, the UPP has higher 228Ra/226Ra
271 activity ratios than Marcellus produced waters but lower activity ratios than freshwaters. A
272 framework is illustrated below that outlines how these different ratios could be used to identify
273 freshwater contamination by the various O&G formations in the Appalachian Basin.
Page 13 of 28 Environmental Science: Processes & Impacts
123456789101112131415161718192021222324252627282930313233343536373839404142434445464748495051525354555657585960

274275 Figure 3. Comparison between elemental and isotopic ratios in O&G produced waters and freshwaters 276 throughout the Appalachian Basin. Green brackets indicate comparisons between two fluids that have 277 significantly different ratios (p<0.05).
278 Conservative mixing models between freshwater and O&G produced waters were created
279 in PHREEQC43 to test the sensitivity of various elemental and isotopic ratios for identifying
280 freshwater resources impacted by UPP produced water (Figure 4). All produced water with
281 ≥76,800 mg/L chloride (i.e., the 5th percentile chloride concentration from the 26 UPP samples
282 collected for this study) and all freshwater samples from the USGS Water Quality Portal
283 (n=9,006 from 2000-2005) are included in Figure 4 to show the potential endmembers that could
284 be used in mixing models. For the purposes of identifying ratios that could be used to detect UPP
285 produced waters in freshwaters, mixing models were performed with the 5th and 95th percentile
286 concentrations for each of the endmembers.
287
Page 14 of 28Environmental Science: Processes & Impacts
123456789101112131415161718192021222324252627282930313233343536373839404142434445464748495051525354555657585960

288289 Figure 4. Conservative mixing trends between freshwaters (blue) and produced waters from UPP (red), 290 Marcellus (yellow), and conventional (gray) O&G formations. Dashed lines represent mixing trends 291 between 5th and 95th percentile concentrations (or activities for radium) in O&G produced water and 292 freshwater. (A) The purple shaded area shows Sr/Ca mass ratios and Sr concentrations that could 293 definitively indicate contamination from with UPP or Marcellus produced water. (B) Panel B shows 294 87Sr/86Sr ratios and conservative mixing trends between freshwaters and produced waters from various 295 formations. (C) If a sampled fluid has a Sr/Ca ratio and Sr concentration within the purple shaded area, 296 the fluid could be analyzed for 228Ra/226Ra activity ratios to determine if the fluid is contaminated with 297 UPP or Marcellus produced water. If the 228Ra/226Ra activity ratio and total radium activity is within the 298 orange shaded area, the fluid is likely contaminated by Marcellus produced water instead of UPP 299 produced water.
300
Page 15 of 28 Environmental Science: Processes & Impacts
123456789101112131415161718192021222324252627282930313233343536373839404142434445464748495051525354555657585960

301 Freshwaters throughout the Appalachian Basin have highly variable Cl/Br mass ratios,
302 ranging from 12 to 1,700 (5th to 95th percentile, respectively). Cl/Br ratios in produced waters are
303 also highly variable but are generally lower than freshwaters (e.g., 5th to 95th percentile mass
304 ratios of 52 to 250). Mixing trends between O&G produced water and freshwater show that the
305 large variability in Cl and Br concentrations in freshwaters could make it difficult to utilize Cl/Br
306 ratios in determining uncontaminated versus contaminated freshwater (Figure S1). However, this
307 method could provide an initial indication of potential O&G contamination if the chloride
308 concentrations measured in freshwater are greater than 100 mg/L and have Cl/Br mass ratios less
309 than ~130 (i.e., the 75th percentile Cl/Br mass ratio for Appalachian Basin O&G produced
310 waters). While Cl/Br ratios could be used as an initial indicator of potential O&G contamination,
311 they do not provide any specificity as to the source of contamination (i.e. produced waters from
312 UPP, Marcellus Shale, or conventional O&G formations).
313 Many of the same elemental tracers that work for identifying Marcellus produced waters
314 in the environment also work for identifying UPP produced waters. For example, UPP and
315 Marcellus produced waters have higher Sr/Ca mass ratios (e.g., 0.10 to 0.53 based on the 5th to
316 95th percentiles; Figure 4A) than waters from conventional O&G formations, which have ratios
317 of 0.01 to 0.07 (5th to 95th percentiles; Figure 4A). Therefore, if sampled waters have Sr/Ca mass
318 ratios greater than 0.07, this could indicate that the solution contains greater than 0.5% UPP or
319 Marcellus water by volume. Smaller additions (i.e., less than 0.5%) result in Sr/Ca ratios that
320 overlap with conventional formations, making it difficult to distinguish if the contamination is
321 from unconventional shale reservoirs or conventional O&G produced waters. The purple shaded
322 area in Figure 4A represents the Sr/Ca mass ratios and corresponding strontium concentrations
323 that could definitively indicate contamination from UPP or Marcellus produced waters. The
Page 16 of 28Environmental Science: Processes & Impacts
123456789101112131415161718192021222324252627282930313233343536373839404142434445464748495051525354555657585960

324 upper bounds for this shaded area are the 95th percentile mixing tends for UPP and the lower
325 bounds are the 95th percentile mixing trends for conventional produced waters. Therefore, if
326 sampled fluids have Sr/Ca and strontium concentrations that are within the purple shaded area, it
327 is likely that fluids originate from or are contaminated by Marcellus Shale or UPP produced
328 waters. The use of this tracer for detecting freshwater contamination by UPP produced waters is
329 most applicable in eastern Ohio, where the current unconventional development is focused on the
330 UPP. In areas where there is both UPP Shale and Marcellus development (e.g., West Virginia
331 and Pennsylvania), this tracer is also sensitive in identifying potential contamination events from
332 these unconventional shale gas reservoirs; however, the overlap in Sr/Ca ratios between UPP and
333 Marcellus produced waters reduces the effectiveness of this tracer in differentiating potential
334 contamination from one of these two sources.
335 We further evaluated the sensitivity of isotope ratios (87Sr/86Sr and 226Ra/228Ra) as tracers
336 for identifying UPP produced waters in the environment. These isotope ratios have advantages
337 over the elemental ratios described previously as they are not subject to fractionation from ion
338 exchange equilibria, mineral solubility, or changes in temperature and salinity12,44. Strontium
339 isotope ratios (87Sr/86Sr) combined with Sr/Ca molar ratios are highly sensitive indicators for
340 tracing Marcellus produced waters, detecting as low as 0.01% produced water additions to
341 freshwater24,44. Similarly, this same isotope tracer works to identify contamination from UPP
342 produced waters. Both the UPP and Marcellus have similar strontium isotope ratios (e.g.,
343 87Sr/86Sr = 0.71088 to 0.71143 in UPP produced waters and 87Sr/86Sr = 0.71071 to 0.71117 in
344 Marcellus produced waters based on the 25th to 75th percentiles; Table S5) that are traceable in
345 freshwater and are distinguishable from some conventional produced waters that have 87Sr/86Sr
346 ratios as high as 0.7200 (Figure 4B). However, similar 87Sr/86Sr ratios in conventional, UPP, and
Page 17 of 28 Environmental Science: Processes & Impacts
123456789101112131415161718192021222324252627282930313233343536373839404142434445464748495051525354555657585960

347 Marcellus produced waters (p value=1; see Table S3) make them difficult to distinguish from
348 each other if there is suspected contamination. Therefore, 87Sr/86Sr are not always an appropriate
349 forensic tool for determining the source of produced water in the Appalachian Basin (Figure 4B).
350 When it is essential to determine if the suspected contamination is from Marcellus Shale
351 or UPP, radium isotopes are likely the best tracer (Figure 4C). UPP produced waters have
352 228Ra/226Ra activity ratios (i.e, 1.0 to 1.2 based on the 25th to 75th percentiles) that are greater than
353 the values reported for Marcellus produced waters (i.e., 0.01 to 0.4 based on the 25th to 75th
354 percentiles). Therefore, to determine if a contamination event is from UPP or Marcellus Shale
355 produced water, we recommend to analyze Sr/Ca ratios first to confirm if the fluid contains
356 produced water from an unconventional shale formation (i.e., UPP and Marcellus Shale
357 produced water). Thereafter, if 228Ra/226Ra activities are less than 1.0 (i.e., 25th percentile activity
358 ratio for UPP produced waters) and total radium activities are greater than 4.4 pCi/L (i.e., the
359 highest radium activity for freshwater reported on the USGS water quality portal), then this
360 could indicate that the water contains greater than 1% Marcellus produced water (Figure 4C
361 orange shaded area). In summary, if the Sr/Ca ratio and Sr concentration confirm that the fluid
362 contains produced water from an unconventional shale formation and additional analyses show
363 that the fluid has a 228Ra/226Ra activity ratio and total radium activity within the orange shaded
364 region of Figure 4C, it is likely that the fluid contains Marcellus produced water instead of UPP
365 produced water.
366 Conclusions
367 Many of the same tracers that distinguish Marcellus produced waters from freshwater or
368 other conventional O&G produced waters also work for UPP produced waters. In western Ohio
369 where there is very little Marcellus development, Cl/Br, Sr/Ca, and 87Sr/86Sr ratios can identify
Page 18 of 28Environmental Science: Processes & Impacts
123456789101112131415161718192021222324252627282930313233343536373839404142434445464748495051525354555657585960
370 potential UPP produced water contamination events. These isotope and elemental ratios in UPP
371 produced waters are different than produced waters from conventional O&G development in
372 Ohio, making them unique fingerprints that could identify potential contamination events from
373 the UPP development. In regions of the Appalachian Basin with both UPP and Marcellus
374 development, it may be more difficult to distinguish potential contamination between these two
375 sources due to their overlapping Sr/Ca and 87Sr/86Sr ratios. However, these two formations have
376 Sr/Ca ratios in their produced waters that are higher than conventional produced waters.
377 Therefore, basic water quality analyses that utilize ICP or IC instrumentation to determine Cl,
378 Br, Ca, and Sr concentrations can provide useful information in trying to determine if samples
379 are contaminated with conventional or unconventional (e.g., UPP or Marcellus) produced waters.
380 These analyses can also be performed at a lower cost (~$30 to $60) than other isotopic methods
381 (e.g., gamma spectroscopy, MC-ICP-MS, etc) which can cost over $100 per sample. If it is
382 necessary to identify if pollution is from Marcellus or UPP produced water, the 228Ra/226Ra ratio
383 could distinguish UPP produced waters from Marcellus produced waters. The 228Ra/226Ra in UPP
384 produced waters was the only tracer that was consistently different from the ratio observed in
385 Marcellus produced waters.
386 There are also limitations with using elemental and isotopic tracers that need to be
387 acknowledged before identifying potential contamination by unconventional or conventional
388 produced waters. If freshwater is contaminated with UPP produced water, the resulting elemental
389 ratios in the fluid mixture will be influenced by the volume of produced water that was mixed
390 with the freshwater and the elemental concentrations of the two solutions. If no chemical or
391 physical reactions occur after mixing, the resulting elemental concentrations could be calculated
392 using a simple mass balance approach (i.e., conservative mixing model). However, if the two
Page 19 of 28 Environmental Science: Processes & Impacts
123456789101112131415161718192021222324252627282930313233343536373839404142434445464748495051525354555657585960

393 solutions were incompatible or mixed together in a complex environment with multiple phases
394 (i.e., air, water, soil, etc), the elemental concentrations in the combined fluid would not be
395 explained by a conservative mixing model45. For instance, mixing strontium and barium-rich
396 produced waters with sulfate or carbonate-rich fresh waters can result in mineral precipitation
397 reactions that influence conservative mixing trends; similarly, cation-exchange reactions between
398 contaminated freshwater and bedrock could result in the exchange of calcium (or other alkaline
399 earth metals) ions in the contaminated water for sodium ions on clay minerals. While elemental
400 and isotopic ratios are highlighted in this work as conservative tracers, the authors recommend
401 that the type of mixing environment (i.e., water, subsurface environment, soil, etc) and the
402 compatibility of the fluids being mixed together be considered in case-specific scenarios of
403 suspected freshwater contamination.
404 Acknowledgements
405 The authors would like to thank all the gas companies who provided the samples. Partial support
406 for author Travis Tasker was provided from NSF-CBET 1703412 and NSF:AIR 1640634.
407 Tasker was also supported by Saint Francis University and the Center for Watershed Research
408 and Service.
409 References
410 1 EIA, Appalachia region drives growth in U.S. natural gas production since 2012,
411 https://www.eia.gov/todayinenergy/detail.php?id=33972#.
412 2 K. Schmid and D. A. Yoxtheimer, Wastewater recycling and reuse trends in Pennsylvania
413 shale gas wells, Environ. Geosci., 2015, 22, 115–125.
414 3 B. D. Lutz, A. N. Lewis and M. W. Doyle, Generation, transport, and disposal of
Page 20 of 28Environmental Science: Processes & Impacts
123456789101112131415161718192021222324252627282930313233343536373839404142434445464748495051525354555657585960

415 wastewater associated with Marcellus Shale gas development, Water Resour. Res., 2013,
416 49, 647–656.
417 4 J. L. Coleman, R. C. Milici, T. A. Cook, R. R. Charpentier, M. Kirschbaum, T. R. Klett,
418 R. M. Pollastro and C. J. Schenk, Assessment of undiscovered oil and gas resources of the
419 Devonian Marcellus Shale of the Appalachian Basin Province, 2011, 2011.
420 5 M. A. Kirschbaum, C. J. Schenk, T. A. Cook, R. T. Ryder, R. R. Charpentier, T. R. Klett,
421 S. B. Gaswirth, M. E. Tennyson and K. J. Whidden, Assessment of undiscovered oil and
422 gas resources of the Ordovician Utica Shale of the Appalachian Basin Province, 2012.
423 6 PA DEP, PA DEP Oil and Gas Reporting Website: Statewide Data Downloads by
424 Reporting Period,
425 https://www.paoilandgasreporting.state.pa.us/publicreports/Modules/DataExports.
426 7 Utica Shale Appalachian Basin Exploration Consortium, A Geologic Play Book for Utica
427 Shale Appalachian Basin Exploration, Final report of the Utica Shale Appalachian Basin
428 Exploration Consortium, 2015.
429 8 H. King, Utica Shale: The natural gas giant below the Marcellus?,
430 https://geology.com/articles/utica-shale/.
431 9 Ohio Division of Oil and Gas Resources, Oil and Gas Well Production,
432 http://oilandgas.ohiodnr.gov/production.
433 10 B. D. Drollette, K. Hoelzer, N. R. Warner, T. H. Darrah, O. Karatum, M. P. O’Connor, R.
434 K. Nelson, L. A. Fernandez, C. M. Reddy and A. Vengosh, Elevated levels of diesel range
435 organic compounds in groundwater near Marcellus gas operations are derived from
Page 21 of 28 Environmental Science: Processes & Impacts
123456789101112131415161718192021222324252627282930313233343536373839404142434445464748495051525354555657585960

436 surface activities, Proc. Natl. Acad. Sci., 2015, 112, 13,184-13,189.
437 11 K. O. Maloney, S. Baruch-Mordo, L. A. Patterson, J.-P. Nicot, S. A. Entrekin, J. E.
438 Fargione, J. M. Kiesecker, K. E. Konschnik, J. N. Ryan and A. M. Trainor,
439 Unconventional oil and gas spills: Materials, volumes, and risks to surface waters in four
440 states of the US, Sci. Total Environ., 2017, 581, 369–377.
441 12 N. R. Warner, C. A. Christie, R. B. Jackson and A. Vengosh, Impacts of shale gas
442 wastewater disposal on water quality in western Pennsylvania, Environ. Sci. Technol.,
443 2013, 47, 11,961-11,966.
444 13 J. M. Wilson, Y. Wang and J. M. VanBriesen, Sources of high total dissolved solids to
445 drinking water supply in southwestern Pennsylvania, J. Environ. Eng., 2013, 140,
446 B4014003-1–10.
447 14 D. M. Akob, A. C. Mumford, W. Orem, M. A. Engle, J. G. Klinges, D. B. Kent and I. M.
448 Cozzarelli, Wastewater disposal from unconventional oil and gas development degrades
449 stream quality at a West Virginia injection facility, Environ. Sci. Technol., 2016, 50,
450 5517–5525.
451 15 S. K. Alawattegama, T. Kondratyuk, R. Krynock, M. Bricker, J. K. Rutter, D. J. Bain and
452 J. F. Stolz, Well water contamination in a rural community in southwestern Pennsylvania
453 near unconventional shale gas extraction, J. Environ. Sci. Heal. Part A, 2015, 50, 516–
454 528.
455 16 G. T. Llewellyn, F. Dorman, J. Westland, D. Yoxtheimer, P. Grieve, T. Sowers, E.
456 Humston-Fulmer and S. L. Brantley, Evaluating a groundwater supply contamination
457 incident attributed to Marcellus Shale gas development, Proc. Natl. Acad. Sci., 2015, 112,
Page 22 of 28Environmental Science: Processes & Impacts
123456789101112131415161718192021222324252627282930313233343536373839404142434445464748495051525354555657585960
458 6,325-6,330.
459 17 E. C. Botner, A. Townsend-Small, D. B. Nash, X. Xu, A. Schimmelmann and J. H. Miller,
460 Monitoring concentration and isotopic composition of methane in groundwater in the
461 Utica Shale hydraulic fracturing region of Ohio, Environ. Monit. Assess., 2018, 190, 1–15.
462 18 R. A. Daly, M. A. Borton, M. J. Wilkins, D. W. Hoyt, D. J. Kountz, R. A. Wolfe, S. A.
463 Welch, D. N. Marcus, R. V. Trexler and J. D. MacRae, Microbial metabolisms in a 2.5-
464 km-deep ecosystem created by hydraulic fracturing in shales, Nat. Microbiol., 2016, 1, 1–
465 9.
466 19 F. B. Woodward, B. E. Schulmeister, C. Caldwell, R. Seeman and R. S. Hudson, in SPE
467 Hydraulic Fracturing Technology Conference, 3-5 February, Society of Petroleum
468 Engineers, The Woodlands, Texas, USA, 2015.
469 20 E. Barbot, N. S. Vidic, K. B. Gregory and R. D. Vidic, Spatial and temporal correlation of
470 water quality parameters of produced waters from Devonian-age shale following hydraulic
471 fracturing, Environ. Sci. Technol., 2013, 47, 2562–2569.
472 21 P. E. Dresel and R. A.W., Chemistry and origin of oil and gas well brines in western
473 Pennsylvania, 2010.
474 22 N. R. Warner, T. Darrah, R. Jackson, R. Millot, W. Kloppmann and A. Vengosh, New
475 tracers identify hydraulic fracturing fluids and accidental releases from oil and gas
476 operations, Environ. Sci. Technol., 2014, 48, 12,552-12,560.
477 23 J. D. Johnson, J. R. Graney, R. C. Capo and B. W. Stewart, Identification and
478 quantification of regional brine and road salt sources in watersheds along the New
Page 23 of 28 Environmental Science: Processes & Impacts
123456789101112131415161718192021222324252627282930313233343536373839404142434445464748495051525354555657585960

479 York/Pennsylvania border, USA, Appl. Geochemistry, 2015, 60, 37–50.
480 24 C. A. Kolesar Kohl, R. C. Capo, B. W. Stewart, A. J. Wall, K. T. Schroeder, R. W.
481 Hammack and G. D. Guthrie, Strontium isotopes test long-term zonal isolation of injected
482 and Marcellus formation water after hydraulic fracturing, Environ. Sci. Technol., 2014, 48,
483 9,867-9,873.
484 25 L. K. Lautz, G. D. Hoke, Z. Lu, D. I. Siegel, K. Christian, J. D. Kessler and N. G. Teale,
485 Using discriminant analysis to determine sources of salinity in shallow groundwater prior
486 to hydraulic fracturing, Environ. Sci. Technol., 2014, 48, 9,061-9,069.
487 26 B. W. Stewart, E. C. Chapman, R. C. Capo, J. D. Johnson, J. R. Graney, C. S. Kirby and
488 K. T. Schroeder, Origin of brines, salts and carbonate from shales of the Marcellus
489 Formation: Evidence from geochemical and Sr isotope study of sequentially extracted
490 fluids, Appl. Geochemistry, 2015, 60, 78–88.
491 27 N. R. Warner, R. B. Jackson, T. H. Darrah, S. G. Osborn, A. Down, K. Zhao, A. White
492 and A. Vengosh, Geochemical evidence for possible natural migration of Marcellus
493 Formation brine to shallow aquifers in Pennsylvania, Proc. Natl. Acad. Sci., 2012, 109,
494 11,961-11,966.
495 28 K. O. Maloney and D. A. Yoxtheimer, Production and disposal of waste materials from
496 gas and oil extraction from the Marcellus Shale play in Pennsylvania, Environ. Pract.,
497 2012, 14, 278–287.
498 29 S. L. Brantley, D. Yoxtheimer, S. Arjmand, P. Grieve, R. Vidic, J. Pollak, G. T.
499 Llewellyn, J. Abad and C. Simon, Water resource impacts during unconventional shale
500 gas development: The Pennsylvania experience, Int. J. Coal Geol., 2014, 126, 140–156.
Page 24 of 28Environmental Science: Processes & Impacts
123456789101112131415161718192021222324252627282930313233343536373839404142434445464748495051525354555657585960

501 30 L. A. Patterson, K. E. Konschnik, H. Wiseman, J. Fargione, K. O. Maloney, J. Kiesecker,
502 J.-P. Nicot, S. Baruch-Mordo, S. Entrekin and A. Trainor, Unconventional oil and gas
503 spills: risks, mitigation priorities, and state reporting requirements, Environ. Sci. Technol.,
504 2017, 51, 2,563-2,573.
505 31 M. A. Engle and E. L. Rowan, Geochemical evolution of produced waters from hydraulic
506 fracturing of the Marcellus Shale, northern Appalachian Basin: A multivariate
507 compositional data analysis approach, Int. J. Coal Geol., 2014, 126, 45–56.
508 32 T. L. Tasker, W. D. Burgos, M. A. Ajemigbitse, N. E. Lauer, A. V. Gusa, M. Kuatbek, D.
509 May, J. D. Landis, D. S. Alessi, A. M. Johnsen, J. M. Kaste, K. Headrick, F. D. H. Wilke,
510 M. McNeal, M. Engle, A. M. Jubb, R. Vidic, A. Vengosh and N. R. Warner, Accuracy of
511 methods for reporting inorganic element concentrations and radioactivity in oil and gas
512 wastewaters from the Appalachian Basin, U.S based on an inter-lab comparison, Environ.
513 Process. Impacts, 2019, 21, 224–241.
514 33 Y. K. Blondes, M.S., Gans, K.D., Engle, M.A., Kharaka and E. A. Reidy, M.E.,
515 Saraswathula, V., Thordsen, J.J., Rowan, E.L., Morrissey, U.S. Geological Survey
516 National Produced Waters Geochemical Database (ver. 2.3, January 2018),
517 https://doi.org/10.5066/F7J964W8.
518 34 National Water Quality Monitoring Council, Water Quality Data,
519 https://www.waterqualitydata.us/portal.
520 35 R. S. Fisher and A. M. Stueber, Strontium isotopes in selected streams within the
521 Susquehanna River basin, Water Resour. Res., 1976, 12, 1,061-1,068.
522 36 RStudio, RStudio:Integrated Development for R., http://www.rstudio.com/.
Page 25 of 28 Environmental Science: Processes & Impacts
123456789101112131415161718192021222324252627282930313233343536373839404142434445464748495051525354555657585960

523 37 T. T. Phan, J. A. Hakala, C. L. Lopano and S. Sharma, Rare earth elements and radiogenic
524 strontium isotopes in carbonate minerals reveal diagenetic influence in shales and
525 limestones in the Appalachian Basin, Chem. Geol., 2019, 509, 194–212.
526 38 M. Renock, D., Landis, J.D., Sharma, Reductive weathering of black shale and release of
527 barium during hydraulic fracturing, Appl. Geochemistry, 2016, 65, 73–86.
528 39 D. Landis, J.D., Sharma, M., Renock, Rapid desorption of radium isotopes from black
529 shale during hydraulic fracturing. 2. A model reconciling radium extration with Marcellus
530 wastewater production, Chem. Geol., 2018, 500, 1924–206.
531 40 R. A. Zielinski and J. R. Budahn, Mode of occurrence and environmental mobility of oil-
532 field radioactive material at US Geological Survey research site B, Osage-Skiatook
533 Project, northeastern Oklahoma, Appl. Geochemistry, 2007, 22, 2,125-2,137.
534 41 T. F. Kraemer and D. F. Reid, The occurrence and behavior of radium in saline formation
535 water of the US Gulf Coast region, Chem. Geol., 1984, 46, 153–174.
536 42 A. Vengosh, D. Hirschfeld, D. Vinson, G. Dwyer, H. Raanan, O. Rimawi, A. Al-Zoubi, E.
537 Akkawi, A. Marie, G. Haquin, S. Zaarur and J. Ganor, High naturally occurring
538 radioactivity in fossil groundwater from the Middle East, Environ. Sci. Technol., 2009, 43,
539 1,769-1,775.
540 43 D. L. Parkhurst and C. A. . Appelo, in U.S. Geological Survey Techniques and Methods,
541 Book 6, U.S. Geological Survey, 2013, pp. 1–497.
542 44 E. C. Chapman, R. C. Capo, B. W. Stewart, C. S. Kirby, R. W. Hammack, K. T.
543 Schroeder and H. M. Edenborn, Geochemical and strontium isotope characterization of
Page 26 of 28Environmental Science: Processes & Impacts
123456789101112131415161718192021222324252627282930313233343536373839404142434445464748495051525354555657585960

544 produced waters from Marcellus Shale natural gas extraction, Environ. Sci. Technol.,
545 2014, 46, 3545–3553.
546 45 E. L. Gross and C. A. Cravotta, Groundwater quality for 75 domestic wells in Lycoming
547 County, Pennsylvania, 2014, 2017.
548
Page 27 of 28 Environmental Science: Processes & Impacts
123456789101112131415161718192021222324252627282930313233343536373839404142434445464748495051525354555657585960

338x190mm (96 x 96 DPI)
Page 28 of 28Environmental Science: Processes & Impacts
123456789101112131415161718192021222324252627282930313233343536373839404142434445464748495051525354555657585960