geochemical characteristics of the … training programme reports 2000 orkustofnun, grensásvegur 9,...
TRANSCRIPT

GEOTHERMAL TRAINING PROGRAMME Reports 2000Orkustofnun, Grensásvegur 9, Number 9IS-108 Reykjavík, Iceland
165
GEOCHEMICAL CHARACTERISTICS OF THEGREATER OLKARIA GEOTHERMAL FIELD, KENYA
Cyrus W. KaringithiKenya Electricity Generating Co Ltd,
Olkaria Geothermal Project,P. O. Box 785, Naivasha,
ABSTRACT
Aquifer fluid compositions and aqueous species distribution have been calculated forsamples from nineteen wells in the greater Olkaria high-temperature geothermal field,Kenya, with the aid of the WATCH-speciation program. It is concluded that overallmineral-solution equilibrium is closely approached at quartz equilibrium temperaturewith respect to most hydrothermal minerals occurring in the aquifer. The mineralsinvolved are in alphabetical order: albite, anhydrite, calcite, epidote, fluorite,microcline, prehnite, pyrite and pyrrhotite.
The solute geothermometers indicate temperatures similar to anticipated aquifertemperatures. However, the gas geothermometers give temperatures either higher orlower than measured aquifer temperatures. The chemical composition of the alterationminerals of the buffer participating in the gas equilibrium is required to formulate newcalibration that will be suitable or appropriate for the Olkaria geothermal fielddischarges. The stable water isotopes indicate that the fluid discharged in the easternand western fields has different sources.
1. INTRODUCTION
The Greater Olkaria geothermal area (GOGA) is located in the central sector of the Kenya Rift Valley tothe south of Lake Naivasha and 120 km northwest of Nairobi (Figure 1). The Kenya Rift Valley is anintegral part of the East African Rift Valley system, which extends for over 3000 km from southernMozambique through Tanzania, Kenya and Ethiopia to join the Red Sea and the Gulf of Aden rifts at theAfar triple junction (KenGen, 1998). The Olkaria high-temperature geothermal field is associated witha region of Quaternary volcanism. Twelve similar Quaternary volcanic centres occur in the axial regionof the rift and are potential geothermal resources (Omenda, 1998; Omenda et al., 1993; Riaroh and Okoth,1994).
Exploration for geothermal energy started in the early 1950s when two wells were drilled at Olkaria.Between 1960 and 1970 a lot of surface exploration work was carried out in the Central Rift Valleythrough the UNDP (United Nations Development Programme) and the Kenya Government through

166Karingithi Report 9
FIGURE 1: Map of the Kenya rift faults showingthe major Quaternary central volcanoes and location
of the Olkaria volcanic complex (KenGen 1999)
various bilateral and multilateral agreements.The exploration work identified Olkaria to besuitable for geothermal prospecting. By 1976,six deep wells had been drilled and in 1981 thefirst 15 MWe generating unit wascommissioned. More wells were drilled andconnected to the steam gathering system. Unit2 and Unit 3, each 15 MWe, werecommissioned in 1982 and 1984, respectively.Currently twenty-three wells are connected tothe steam gathering system. Some of theshallow wells initially connected to the steamgathering system have since been retired. Sixmake-up wells have been drilled and four ofthese are already connected to the steamgathering system. The power plant producesthe installed capacity of 45 MWe.
The Greater Olkaria geothermal area coversapproximately 140 km2 as shown in Figure 2.It is divided into seven fields, namely: OlkariaEast, Olkaria Northeast, Olkaria Central,Olkaria Northwest, Olkaria Southwest, OlkariaSoutheast, and Olkaria Domes (Mwangi,2000). Each of the fields has been exploredeither partially or completely. The completelyexplored fields are Olkaria East, with a 45MWe power plant, Olkaria Northeast, whose64 MWe power plant is under construction andOlkaria Southwest (owned and operated byOrpower4 Inc.) with an 8 MWe combinedcycle binary power plant in operation.Expansion of the power plant to 64 MWe ormore is under way.
Currently, more than ninety-five (95) wells with varying depths (150-2500 m), have been drilled, and,hence, a large database of well information is available to assist in understanding the reservoir.
The objective of this research project is to re-evaluate some geochemical data from nineteen wells selectedto represent all the sectors of the Greater Olkaria geothermal area with a view of getting a betterunderstanding of the fluid compositions in the producing aquifers.
The geochemistry of each individual field has earlier been reported - Olkaria West (KPC 1984, 1990;Muna 1990; Wambugu 1995), Olkaria Northeast (KPC 1988; Wambugu 1996), Olkaria East (Muna 1982;KPC, 1982a, 1982b, 1984, and 1988; Karingithi 1992, 1993, and 1996) and Olkaria Domes (Karingithi1999). From the above references, it can be concluded that the reservoir chloride concentration isdeclining through the different fields in the order: Olkaria Northeast field (ONEF) - Olkaria East field(OEF) - Olkaria West field (OWF) - Olkaria Domes field (ODF). The aquifer chloride concentration foreach field in descending order is 300-550, 170-700, 100-500, and 180-270, for ONEF, OEF, OWF, andODF, respectively. Figure 3 shows the distribution of the total discharge Cl concentration in Olkaria. Itshould be noted that the data used for comparison was the initial chemical data for the OEF beforeproduction. By considering the most recent data, the values in the OEF are seemingly higher than in theother fields.

167Report 9 Karingithi
FIGURE 2: Geothermal fields within the Greater Olkaria geothermal area (KenGen 1999)
FIGURE 3: Total discharge Cl concentration distribution in Olkaria (KenGen 1999)

168Karingithi Report 9

169Report 9 Karingithi
FIGURE 5: Volcano-tectonic map of the GreaterOlkaria geothermal area (KenGen, 1999)
FIGURE 6: E-W geological cross-section through the Olkaria area(Muchemi, 1999; Omenda, 1998)
2. GEOLOGICAL AND GEOTHERMAL FEATURES OF THE RESERVOIR
2.1 Geology and stratigraphy
The Olkaria volcanic complex (Figure 4) is one of several major volcanic centres in the Central KenyaRift of the East African Rift system, associated with an area of Quaternary silicic volcanism (Muchemi,1999; Omenda 1998). The evolution of the Central Kenya Rift stress field and the resultant faults have
been discussed by Strecker, et al. (1990).A structural N-S running boundary passesthrough the Olkaria Hill that divides theGreater Olkaria area into east and weststratigraphic zones. In the Olkaria area thesurface to about 1400 m a.s.l. is covered byQuaternary comendites and pantelleritesand an extensive cover of pyroclastic fallfrom Longonot and Suswa. Volcaniceruption centres are structurally controlled.The main centres are the Olkaria Hill,Ololbutot fault zone and the Gorge Farmarea. The most recent volcanism isassociated with the Ololbutot fracture zone.The youngest lava is the Ololbutot rhyoliteflow, which is about 250 ±100 years BP(Omenda, 1998; Clarke et al., 1990).
The subsurface geology of the Olkariageothermal field can be divided into fivebroad lithostratigraphic groups based onage, tectono-stratigraphy, and lithology.The formations are: (1) The Mau tuffs; (2)Plateau trachytes, (3) Olkaria basalts and(4) Upper Olkaria volcanics insludingminor intrusives, as shown in Figure 5(Muchemi, 1999; Omenda, 1998). Thegeothermal reservoir to the east of the
Ololbutot fracture zone ish o s t e d w i t h i n t h ePle i s tocene p la teautrachytes while in the westit is within the PlioceneMau tuffs.
The regional structures inthe area are represented bythe Gorge Farm fault, theSuswa lineament and theeast-northeast trendingOlkar ia fau l t zone(Muchemi, 1999). Themain recharge paths to theG r e a t e r O l k a r i ageothermal area are NNW-SSE and NW-SE dippingmajor rift faults exposedon the Mau escarpment.

170Karingithi Report 9
FIGURE 7: Integrated geophysical section from the Mau escarpment to Longonotthrough the Greater Olkaria geothermal area, resistivity in Sm (KenGen, 1999)
Reactivated N-S rift floor faults and fractures control axial groundwater flow through the geothermalsystem, but have a shallower influence than the major rift forming faults that provide deep recharge.
The main structures controlling fluid movement within the Greater Olkaria geothermal area are N-S, NW-SE, NNW-SSE, and ENE-WSW faults and a ring structure. The NW-SE trending faults are inferred fromaerial photographs and Landsat images since an extensive pyroclastic cover masks the surface features.Seismic data indicate that there is active movement along some of these faults (Simiyu et al., 1997).Clarke et al., (1990) and Mungania (1992) have demonstrated that most of the recent lava flows areassociated with the N-S striking faults and the ring structure. These faults are thought to have numerousdyke swarms below the surface. Some of the dykes are well exposed in the Ol Njorowa gorge. Influenceof the reactivated N-S rift floor faults and fractures on reservoir characteristics is shown by thetemperature inversions that are common in most wells drilled close to the exposed N-S faults, e.g. wellsOW-1, OW-201, and OW-401 (Omenda 1998).
Resistivity studies have been carried out by various workers since the early seventies (KenGen, 1999).The most notable finding is that the Olkaria West is different from the East and Northeast fields. Figure6 shows the integrated geophysical model based on a combined interpretation of TransientElectromagnetic (TEM), DC-Schlumberger, and Magnetotelluric (MT) soundings within the area. Thedata show that the low-resistivity anomalies are controlled by linear structures running NE-SW and NW-SE. The resistivity is generally lower in Olkaria West than in the eastern Olkaria fields (KenGen, 1999).
2.2 Hydrothermal minerals
Muchemi (1999) and Omenda (1998) have summarized studies of hydrothermal alteration of rockspenetrated by wells drilled into the Olkaria geothermal system. Hydrothermal minerals present includekaolinite, biotite, hydrobiotite, vermiculite, chlorite, chlorite-illite, illite-smectite, smectite, epidote,calcite, quartz, fluorite, anhydrite Fe-oxides, prehnite, wairakite, stilbite, pyrite, adularia, albite, sphene,leucoxene, actinolite, garnet and talc. The most common secondary minerals are clay minerals, fluorite,anhydrite, calcite, pyrite and iron oxides. Clay mineral analysis shows that the prevailing clays in the eastabove 1000 m a.s.l., are smectite and chlorite, whereas in the west, illite is more dominant (Leach andMuchemi, 1987). At depths below 1000 m a.s.l., the dominant clay is interlayered chlorite-biotite andbiotite. In general, the clay grading with depth in the east is smectite-chlorite-biotite and in the westsmectite-illite-chlorite-biotite. Epidote has been observed to be closely associated with basalts and is moreabundant in the eastern fields than in the western fields.

171Report 9 Karingithi
FIGURE 8: E-W temperature cross-section through the Olkaria area (KenGen, 1999)
2.3 Temperature and pressure
Temperature and pressure distribution across the entire field have been studied and indicate that fluidmovement in the Olkaria geothermal area is associated with tectonic structures. The highest temperaturerecorded is 340/C at 2000 m depth in well OW-19 in Olkaria East. The Olkaria East reservoir is two-phase, at least to the depth penetrated by the deepest wells. High temperatures are also observed inOlkaria West, Olkaria Northeast and Olkaria Domes while lower temperatures are observed in OlkariaCentral (Figure 7). Pressures decrease both eastwards and westwards from respective peaks towardsOlkaria Central. Within the Olkaria Central and Northeast, the pressures decline southward towards wellOW-401 and Olkaria East, respectively (Ouma, 1999). The ENE-WSW trending Olkaria fault zone is themost important permeable structure in the entire Olkaria geothermal area. A permeability thickness (Kh)product of more than 10 Dm is common in the vicinity of this fault. The fault transects the Northeast andWest fields, where it forms the most productive part of the system (Figure 4). This fault zone forms ahydrological divide. The geothermal reservoir in the north (including Olkaria Domes) is liquid-dominatedand has no steam cap, whereas south of the fault the reservoir is a liquid-dominated two-phase systemoverlain by a steam dominated zone (Ambusso and Ouma, 1991; KenGen, 1999).
3. FLUID CHEMISTRY
3.1 Analytical data
A lot of chemical data have been collected from wells discharges at Olkaria over the years. Water sampleshave been collected from the weirbox at each wellhead. Steam samples from production wells in theOlkaria East production field were collected from the wellhead separators through a stainless steelsampling coil that was connected to the sampling point provided. From exploration and appraisal wellsin other parts of the area, steam samples were collected from two-phase horizontal discharge pipelineswith the aid of a webre separator. Sampling pressures for steam samples is variable but for water samplesit is close to 0.8 bar-a. For the present study chemical data from 19 wells (Tables 1 and 2) have been usedto study the state of mineral-solution equilibria in producing aquifers at Olkaria and to investigate theconformity between geothermometry temperatures and measured downhole temperatures at the level ofpermeable horizons in the selected wells.

172Karingithi Report 9
TABLE 2: Average steam analysis results for selected Olkaria wells;concentrations are in mmoles/100 moles of steam in the steam samples
Wellno.
Samplingpressure
(bars)
CO2 H2S H2 O2 CH4 N2
OW-10 4.53 142 7.87 6.37 1.31 1.11 6.24OW-15 4.64 103 9.62 6.45 0.14 0.38 6.51OW-16 4.66 111 11.16 5.65 0.01 0.43 2.90OW-19 4.58 165 15.51 8.86 0.17 0.67 6.56OW-23 5.04 146 13.13 9.53 0.12 0.31 4.49OW-25 4.90 141 10.08 7.80 0.05 0.30 4.42OW-202 1.46 280 1.00 0.02 0.07 0.50 1.57OW-301 1.46 7675 6.40 1.90 0.00 1.47 20.30OW-302 1.79 662 1.99 0.63 0.88 0.67 5.81OW-304D 2.58 20650 4.76 1.69 0.00 3.05 31.26OW-306 1.79 2048 5.23 0.97 0.00 1.69 14.12OW-307 0.00 3027 4.82 4.38 83.65 2.23 382.24OW-308 3.74 47812 0.91 0.05 9.30 4.08 50.17OW-709 1.93 101 2.64 3.42 0.00 0.50 5.51OW-714 2.76 146 7.89 2.22 0.00 0.60 6.05OW-719 2.88 280 9.57 1.88 0.00 0.81 7.35OW-901 1.56 336 8.91 4.36 0.19 0.55 9.30OW-902 1.01 322 0.85 0.07 0.63 1.38 24.41OW-903 1.26 501 1.87 0.35 1.19 1.29 34.21
The samples for which chemical data are presented in Tables 1 and 2 were collected in 1999. Theanalytical results for individual wells often show erratic time variations. Because the variations are erratic,it is considered that they may, at least, partly be due to analytical imprecision but not to natural variations.The numbers given for some components in Table 1 represent average concentrations for all samplescollected from a particular well in cases where the 1999 samples gave values that departed significantlyfrom the average.
The water discharged from wells in the Olkaria field is low in dissolved solids compared to water frommost other drilled high-temperature geothermal fields in the world. Chloride concentrations in water atthe weirbox range between 50 and 1100 ppm, being lowest in well OW-304D and highest in well OW-10.Water from wells in Olkaria East and Northeast tend to be highest in chloride. The high chlorideconcentrations observed for the Olkaria East and Northeast Fields could be the consequence of upflowof deep high-temperature geothermal fluid, although progressive boiling by heat flow from the rock mayalso contribute in the Olkaria East field. In the Olkaria West field the chloride concentrations are quitelow (100–200 ppm) except in well OW-305, which discharges water similar to that discharged from thewells in the Olkaria East and Olkaria Northeast fields (530-750 ppm Cl at weirbox, Wambugu, 1995).Well OW-305 is thought to be tapping the up-flow fluid for Olkaria West field, while other wells arethought to discharge fluid, which has been diluted by either steam condensate or shallow groundwater.
The water from the weirbox of the Olkaria wells is slightly to moderately alkaline (pH 8.1-9.9 as measuredat 20/C) and is relatively high in bicarbonate, with 90-13000 ppm of HCO3
-. The high bicarbonate isconsidered to be a consequence of CO2 supply to the geothermal fluid and a subsequent reaction betweenthe carbonic acid and minerals of the rock, which act like bases, thus converting some of the carbondioxide to bicarbonate. The well discharges in Olkaria West are distinctly highest in carbon dioxide(Table 2). The CO2 source is considered to be pre dominantly from the magma heat source of thegeothermal system although carbon present in the rock may contribute a little.

173Report 9 Karingithi
25
50
75
100
0
0
25
50
100
75
0 25 50 75 100
OW-16 OW-19
OW-23
OW-25
OW-202
OW-301
OW-302
OW-304D
OW-306
OW-307
OW-308
OW-709
OW-714
OW-719
OW-901OW-902
OW-903
Olkaria East Olkaria CentralOlkaria West Olkaria North EastOlkaria Domes
ClSO4 HCO3
Cl
SO4 HCO3
OW-15OW-10
FIGURE 9: The Cl-SO4-HCO3 diagram for selectedOlkaria geothermal well water samples
-8 -4 0 4 8Oxygen-18 °/°°
-20
0
20
40
60
Deu
teriu
m °
/ °°
OW-15
OW-16OW-19
OW-25
L. Naivasha
OW-202
OW-301
OW-302
OW-304
OW-306
OW-308
OW-901
OW-902OW-903
RW
Olkaria EastL. NaivashaOlkaria CentralOlkaria WestOlkaria NortheastOlkaria DomesRain water
Kenya
rain
line
(Clar
ke et
al.,1
990)
OW-10
OW-307
OW-719
OW-23
OW-714
OW-709
FIGURE 10: Stable isotope composition of samplesfrom Greater Olkaria geothermal area
Temperature reversals are observed in some wells, like OW-201 and OW-401. Some of the other recentlydrilled wells in Olkaria Central field, although not yet discharge-tested, indicate similar temperaturereversals. These reversals could imply recharge of cold water encroaching the field from above orlaterally. Such recharge could cause steam condensation, and reaction of the acid condensate could bethe process leading to the formation of bicarbonate water rather than direct supply of CO2 from themagmatic heat source to the deep, hot geothermal fluid.
From the relative abundanceof chloride, sulphate andbicarbonate in the water fromthe weirbox of the Olkariawells these waters would beclassified as sodium-chlorideand sodium-bicarbonatewater, or mixtures thereof(Figure 8). Wells in theOlkaria East production fieldand in Olkaria Northeastdischarge sodium-chloridetype water. In Olkaria Westthey are, on the other hand, ofthe bicarbonate type. Wells inthe Olkaria Central fielddischarge a mixture ofchloride and bicarbonate end-member water as do wells inthe Olkaria Domes area.
3.2 Isotope composition
Water samples collected from the wellsand Lake Naivasha were analyzed for thestable isotopes oxygen-18 and deuterium.The results are shown in Table 3. Steamcompositions were calculated from the dataon the water samples assuming equilibriumbetween the two phases and using the "-isotope fractionation values reported byHenley et al. (1984). The aquifer isotopiccompositions were calculated on theassumption that partial phase segregationin the depressurized zone around wells wasresponsible for the excess enthalpies, i.e.,the steam fraction was taken to be equal tothat produced by depressurization from theaquifer temperature to the weirbox. Quartzequilibrium temperature was taken as theaquifer temperature. A plot of deuteriumversus oxygen-18 reveals interestingresults (Figure 9). The samples plot closeto the Kenya Rift Valley meteoric line(Kenya rainline - Clarke et al., 1990):

174Karingithi Report 9
TABLE 3: Isotope composition of selected well water samples (weirbox and aquifer)
Location Weirbox*18O
Weirbox*D
Aquifer*18O
Aquifer*D
OW-10 4.55 22.6 3.04 14.57OW-15 4.37 19.7 3.05 12.72OW-16 3.8 15.1 2.38 7.54OW-19 4.1 19 2.61 11.09OW-23 4.59 21.7 3.06 13.61OW-25 5.03 27.4 3.52 19.37OW-202 0.21 5.5 -0.75 0.38OW-301 -0.16 -1.7 -1.93 -11.07OW-302 0.87 7.6 -0.78 -1.16OW-304 -2.21 -9.3 -3.27 -14.92OW-306 -0.04 0.5 -1.43 -6.89OW-307 -2.02 -5.8 -3.03 -11.14OW-308 -4.55 2.5 -5.39 -1.96OW-709 4.18 30.6 2.72 22.86OW-714 3.71 23.7 2.07 15.00OW-719 3.43 22.3 1.99 14.68OW-901 4.97 32.2 3.67 25.28OW-902 3.22 21.8 1.95 15.05OW-903 3.09 21.7 1.87 15.24L. Naivasha 1.95 31.40Rain water 1.87 -13.00
*D = 5.56 *18O + 2.04 Kenya Rift Valley meteoric line.
The equation has a smaller slope than the world meteoric line proposed by Craig (1961):
*D = 8 *18O + 10 World meteoric line.
From Figure 9, it is seen that the Olkaria East samples cluster together 10 ± 5 *D ‰ and 3 ± 1 *18O ‰;Olkaria Northeast and Olkaria Domes samples plot within the same range but on the other side of theKenya Rift Valley meteoric line. The samples from Olkaria West and Central plot together, *18O rangingfrom -0.75 ‰ to -5.4 ‰, the *D from 0.38 ‰ to -14.92 ‰. One sample is depleted with respect to *18O,probably due to the high CO2 in the geothermal system in Olkaria West and its vicinity. As CO2 bubblesthrough the geothermal system, there is a preferred uptake of 18O atoms, thus depleting the reservoir fluidof the same. Water from the eastern Olkaria sector, i.e. east of the Ololbutot fault, is enriched in bothdeuterium and oxygen-18 relative to local precipitation and as this water falls on or close to the localmeteoric line, this indicates that the water evaporated before infiltrating into the bedrock of the geothermalsystem. The lower (more negative) deuterium values of the aquifer water in Olkaria West and Centralindicate a different source (recharge area) for the Olkaria western sector, on one hand, and the easternsector, on the other.

175Report 9 Karingithi
4. DATA HANDLING
4.1 Calculation of aquifer fluid compositions
Most of the wells at Olkaria have excess enthalpy, i.e. the enthalpy of the discharged fluid is higher thanthat of steam-saturated water at the respective aquifer temperature. Excess enthalpy may be theconsequence of several processes. It may be a reflection of the high enthalpy of two-phase aquifer fluid.Alternatively, it could be caused by transfer of heat to the fluid flowing into wells from the rock in thedepressurization zone around wells or by partial phase segregation of the water and steam in this zone(Arnórsson et al., 1990). All of these processes may be operative. Difficulties in evaluating their relativeabundance lead to uncertainties as to how to calculate the chemical composition of the aquifer fluid fromanalytical data on water and steam samples collected at the wellhead.
To obtain a common reference point for the samples collected from wells discharging through a twinsilencer to the atmosphere, component concentrations in water and steam were calculated at 10 bar-avapour pressure with the aid of the WATCH- program (Arnórsson et al., 1982; Bjarnason, 1994). For thesamples collected from production wells, the steam component concentrations were first recalculated to1 bar-a, which was the sampling pressure of the water component, and subsequently the composition ofboth phases was recalculated at 10 bar-a. The aquifer chemistry was then recalculated using the compileddata. The enthalpy of saturated steam varies with temperature. It reaches maximum around 235/C. Inthe range 180-270/C (10-55 bar-a vapour pressure) it has a value close to this maximum, but at lower andhigher temperatures it drops. As a consequence of this, the steam to water ratio (enthalpy) of a fluid haslittle effect upon evaporation of the water during depressurization in the pressure interval 10-55 bar-a butat lower and higher pressures water evaporation by depressurization increases with increasing steamfraction of the fluid. Most of the Olkaria wells have aquifer temperatures of less than 270/C so enhancedwater evaporation above 270/C due to excess enthalpy can be ignored. On the other hand, the excessenthalpy may significantly enhance evaporation of water flowing into the weirbox, particularly forexploration and appraisal wells that do not have a steam wellhead separator. This is the reason forselecting the common reference point of 10 bar-a vapour pressure because it is not sensitive to variationsin the excess of well discharge enthalpy.
Individual component concentrations have been calculated for the total discharge of the wells. For high-enthalpy wells, silica concentrations are variable and low. They decrease within increasing dischargeenthalpy and yield low quartz equilibrium temperatures. Chloride concentrations are also variable andlow and, for each field, decrease with increasing discharge enthalpy. These results indicate that the excessenthalpy is not due to an increase by heat flow from the aquifer rock, to the fluid flowing into wells in thedepressurization zone around these wells. Pressure logging indicates that the reservoir in the GreaterOlkaria geothermal area is liquid-dominated in terms of volume except for the steam zone that caps theliquid reservoir in the Olkaria East production field. This leaves phase segregation in the aquifer as themost important process in generating excess enthalpy well discharges. Aquifer component concentrationshave been calculated on the assumption that this process accounts solely for the excess enthalpy.
In detail the procedure for calculating the aquifer fluid compositions for exploration and appraisal wellswas as follows: (1) Gas concentrations in steam were reduced, corresponding to boiling from the samplingpressure to atmospheric pressure, (2) The compositions of water and steam were calculated at 10 bar-avapour pressure using the measured discharge enthalpy value, and finally, (3) the aquifer componentconcentrations were calculated at the selected aquifer temperature assuming no effect of the excessenthalpy on the vaporisation of the water phase. For the production wells in the Olkaria East productionfield, the aquifer component concentrations were calculated according to two models. The first involvedcalculation of the water phase component concentrations in the wellhead separators from data on watersamples collected from the weirbox, adding steam and gas lost during boiling between wellhead separatorand silencer. Subsequently, using the measured discharge enthalpy values, water and steam compositionswere calculated at 10 bar-a vapour pressure from the information on these components in the wellhead
176Karingithi Report 9
separator. Finally, aquifer water compositions were calculated from the derived data at 10 bar-a byassuming that any excess steam does not affect evaporation of the water during depressurization.Alternately, the aquifer chemistry was calculated from data on steam and water compositions atatmospheric pressure assuming liquid enthalpy. Such an assumption is similar to the assumption thatexcess enthalpy does not affect water evaporation during depressurization. By this alternate approach,water evaporation is overestimated between wellhead separator and silencer but underestimated betweenwellhead separator and 10 bar-a vapour pressure, at least for excess enthalpy wells. Both of theapproaches, described above, for the Olkaria East production wells yield about the same aquifer chemistry.For the present study the alternate method was used.
4.2 Calculation of aqueous speciation and mineral saturation
Having derived a satisfactory model to calculate component concentrations in the producing aquifersbeyond the depressurization zone around wells, the WATCH chemical speciation program was used tocalculate individual aqueous species activities and mineral saturation in the initial aquifer fluid. The database for these calculations is that presented by Arnórsson et al. (1982) except for gas solubility, Al-hydroxide and Fe+3-hydroxide dissociation constants which were taken from Arnórsson and Andrésdóttir(1999) and Diakonov et al. (1999).
The activity products for the following minerals were calculated: albite (low), microcline, calcite,anhydrite, prehnite, fluorite, epidote, pyrite, and pyrrhotite. The solubility constants for the sameminerals, as a function of temperature, were obtained from the following sources: albite (low) andmicrocline (Arnórsson and Stefánsson, 1999; Arnórsson, 2000), calcite and fluorite (Arnórsson et al.,1982) and anhydrite, prehnite, epidote, pyrite and pyrrhotite (Gudmundsson and Arnórsson, 2001).Comparison between the solubility constant (K) and the activity product (Q) permits evaluation of whetherthe water is undersaturated (Q<K), at equilibrium (Q=K) or supersaturated (Q>K) with a particularmineral.
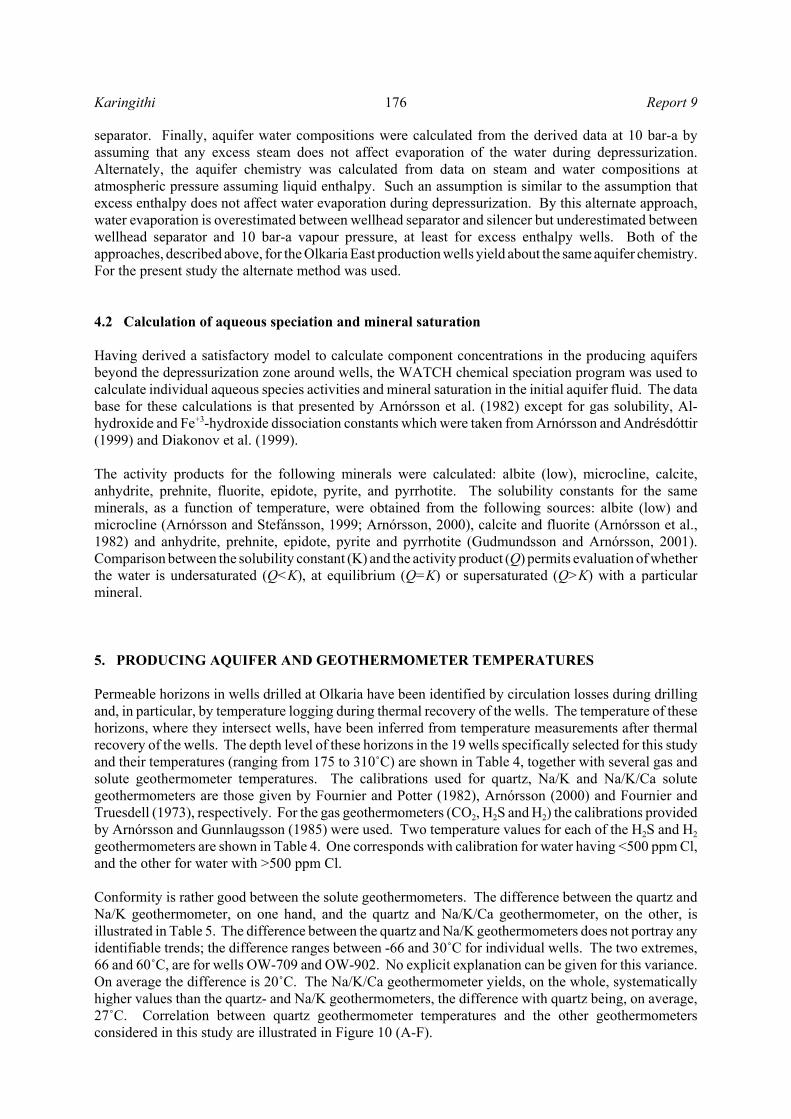
5. PRODUCING AQUIFER AND GEOTHERMOMETER TEMPERATURES
Permeable horizons in wells drilled at Olkaria have been identified by circulation losses during drillingand, in particular, by temperature logging during thermal recovery of the wells. The temperature of thesehorizons, where they intersect wells, have been inferred from temperature measurements after thermalrecovery of the wells. The depth level of these horizons in the 19 wells specifically selected for this studyand their temperatures (ranging from 175 to 310/C) are shown in Table 4, together with several gas andsolute geothermometer temperatures. The calibrations used for quartz, Na/K and Na/K/Ca solutegeothermometers are those given by Fournier and Potter (1982), Arnórsson (2000) and Fournier andTruesdell (1973), respectively. For the gas geothermometers (CO2, H2S and H2) the calibrations providedby Arnórsson and Gunnlaugsson (1985) were used. Two temperature values for each of the H2S and H2geothermometers are shown in Table 4. One corresponds with calibration for water having <500 ppm Cl,and the other for water with >500 ppm Cl.
Conformity is rather good between the solute geothermometers. The difference between the quartz andNa/K geothermometer, on one hand, and the quartz and Na/K/Ca geothermometer, on the other, isillustrated in Table 5. The difference between the quartz and Na/K geothermometers does not portray anyidentifiable trends; the difference ranges between -66 and 30/C for individual wells. The two extremes,66 and 60/C, are for wells OW-709 and OW-902. No explicit explanation can be given for this variance.On average the difference is 20/C. The Na/K/Ca geothermometer yields, on the whole, systematicallyhigher values than the quartz- and Na/K geothermometers, the difference with quartz being, on average,27/C. Correlation between quartz geothermometer temperatures and the other geothermometersconsidered in this study are illustrated in Figure 10 (A-F).

177Report 9 Karingithi
TABLE 4: Geothermometer temperatures (/C) and measured aquifer temperatures
Well H2S(saline)
H2(saline)
CO2 H2S(dilute)
H2(dilute)
Qtz Na/K Na-K-Ca
Aquifer temp. Depth level of aquifers(m)
10 257 285 211 186 225 247 242 254 255,260,270 750, 850,115015 262 286 196 197 228 229 250 266 245,265, 270 800, 1200-130016 269 287 213 207 229 239 236 253 240 950-130019 276 290 226 217 236 245 260 270 245,270 1000, 150023 270 292 222 209 239 248 234 246 245, 265,280 800,1000, 120025 262 287 210 196 230 247 262 270 260,270 800, 1400-1600202 217 101 282 92 189 196 256 283 215, 230 1250, 1400-1600301 257 273 523 185 197 269 250 292 265,275 1200, 1600-1850302 239 263 309 143 166 259 248 267 245,270 1000,1400-1600
304D 251 271 810 172 190 205 179 213 250,265 1100-1300, 1600-1800306 259 271 397 190 190 236 213 248 220,255 800,1500-1700307 nd nd nd nd nd 200 208 252 175,230 750,1400-1650308 218 249 272 92 111 184 198 258 165,220,225 1000, 1250,1400709 238 283 206 140 222 242 308 310 250,275,310 1100, 1500, 1795714 262 276 234 195 203 258 270 281 225,275,290 900-1100, 1500, 2000719 259 279 260 190 211 240 241 258 220,260,290 750-1000, 1250,1800901 282 313 234 224 271 228 212 240 250,280,305 900-1000, 1500-1700,902 223 239 291 104 60 225 195 219 220,240,245 1000-1250, 1500-1600903 299 243 358 239 84 220 197 230 215,220 950-1100, 1500-1600
TABLE 5: Differences between quartz and other geothermometers (/C)
Well Qtz-NaK Qtz-CO2 Qtz-H2S
salineQtz-H2saline
Qtz-H2Sdilute
Qtz-H2dilute
10 5 36 -10 -38 63 2315 -21 33 -33 -57 47 1616 3 26 -30 -48 31 1019 -15 19 -31 -45 29 1023 13 26 -23 -44 42 1325 -15 37 -15 -40 53 19
202 -60 -86 -21 95 100 3301 19 -254 12 -4 94 82302 11 -50 20 -4 122 99
304D 26 -605 -46 -66 26 8306 23 -161 -23 -35 45307 -8 - - - - -308 -14 -88 -34 -65 92 73709 -66 36 4 -41 105 23714 -12 24 -4 -18 68 60719 -1 -20 -19 -39 50 29901 16 -6 -54 -85 3 -44902 30 -66 2 -14 118 162903 23 -138 -79 -23 -23 133

178Karingithi Report 9
160 200 240 280 320Quartz temperature (°C)
160
200
240
280
320
Na-
K te
mpe
ratu
re (°
C)
10
15
16
19
23
25202
301302
304D
306307
308
709
714
719
901
902903 Olkaria EastOlkaria CentralOlkaria WestOlkaria NEastOlkaria Domes
A
160 200 240 280 320Quartz temperature (°C)
160
200
240
280
320
Na-
K-C
a te
mpe
ratu
re (°
C)
10
15
16
19
23
202
301
302
304D
306307
308
709
714
719
901
902
903
B
25
100 200 300Quartz temperature (°C)
100
200
300
H2
tem
pera
ture
(°C
- sa
l)
19
202
301302
304D 306
308
714719
901
902903
D
1025162315
709
50 100 150 200 250 300Quartz temperature (°C)
50
100
150
200
250
300
H2S
tem
pera
ture
(°C
- di
l)
1015
1619
23
25
202
301
302
304D
306
308
709
714719
901
902
903
E
50 100 150 200 250 300Quartz temperature (°C)
50
100
150
200
250
300
H2
tem
pera
ture
(°C
- di
l) 10
2325
202301
302
306
308
709
714719
901
902
903
C
1916
304D
15
120 160 200 240 280 320Quartz temperature (°C)
120
160
200
240
280
320
H2S
tem
pera
ture
(°C
- S
al) 10
1516
1923
25
202
301
302
304D
308
709
714719
901
902
903
F
306
FIGURE 10: Correlation between quartz and various geothermometers

179Report 9 Karingithi
The calibration proposed by Arnórsson and Gunnlaugsson (1985) for “dilute” (<500 ppm Cl) and “saline”(>500 ppm Cl) water yields systematically low and high H2S temperatures relative to quartz for mostwells, or by 58 and 21/C on average, respectively. The corresponding numbers for the H2 geothermometerare 41 and 32/C. Using the calibration for saline waters, the H2S geothermometer temperatures rangebetween 217 and 299/C, well OW-202 having the lowest H2S temperature and well OW-903 the highest.The H2 geothermometer temperatures range between 101 and 313/C, wells OW-202 again yielding thelowest value but well OW-901 the highest (Table 3). Using the gas calibrations for dilute water, thereverse is observed. The quartz geothermometer temperatures are, on the whole, much higher than therespective H2S and H2 temperatures. The difference varies from 3/C to as much as 122/C. For the wellsin Olkaria East, Northeast and Domes, conformity is generally reasonable between the quartz and CO2geothermometers, but for Olkaria Central and Olkaria West the CO2 geothermometer yields high andunrealistic values.
The gas geothermometers proposed by Arnórsson and Gunnlaugsson (1985) are geochemically calibrated,i.e. they involve correlating measured aquifer temperatures with the calculated concentrations of thesegases in the aquifer water. Yet they considered that the mineral assemblage,calcite+quartz+epidote+prehnite, was likely to control aquifer water CO2 concentrations and the mineralassemblage of pyrite+pyrrhotite+ epidote+prehnite both H2S and H2 aquifer water concentrations.Geochemical calibration was preferred, rather than a chemical thermodynamic one in view of rather poorquality of available chemical thermodynamic data on these minerals. Since the work of Arnórsson andGunnlaugsson (1985) various chemical thermodynamic data assessments have led to improved quality ofdata on minerals involved in the mineral buffers mentioned above (Berman, 1988; Holland and Powell,1990, 1998; Gottschalk, 1997). This led to theoretical calibration of all three gas geothermometers forepidote compositions in hydrothermally altered basalts. The compositions of all the minerals constitutingthe gas-mineral buffer are quite pure, except for epidote, of which the iron content varies with that of thehost rock. Data are not available on epidote compositions at Olkaria that would permit theoreticalcalibration of the various gas geothermometers for that field. Evidently, a valid calibration for the Olkariafield is intermediate for the calibrations proposed by Arnórsson and Gunnlausson (1985) for "dilute" and"saline" geothermal waters.
The anomalously high CO2 temperatures in Olkaria West and Olkaria Central could be the consequenceof CO2 control by a mineral buffer other than quartz+calcite+epidote+prehnite or that dis-equilibriumconditions prevail in the reservoir in these parts of the Olkaria field. Such dis-equilibrium conditionscould be the consequence of CO2 flux from a deep source in the geothermal system; from degassing ofthe magma heat source, even directly from the mantle (Omenda, 1998). A similar occurrence ofanomalously high CO2 temperatures has been observed in the Krafla geothermal area of Iceland, shortlyafter the initiation of a volcanic eruption period that started in 1975 and lasted until 1984. The increasein CO2 was attributed to degassing of fresh magma intruded into the roots of the geothermal system(Ármannsson et. al., 1987).
From comparison between measured temperatures of aquifers (permeable horizons) and the solutegeothermometer results, deductions have been made regarding which, if any of these horizons, dominatewell discharges, Table 4. The results indicate that the shallowest horizons are usually the main or solecontributor to the discharge. These horizons may not be represented by horizontal layers but, at least insome cases, by vertical or near-vertical faults and fractures. In case of near-vertical permeable structures,a deeper aquifer could yield fluid into a well by downward movement of that fluid along these structures.
6. CALCULATION OF MINERAL SATURATION
The solubility product (Q) for each of the following hydrothermal minerals: albite (low), microcline,calcite, anhydrite, prehnite, fluorite, epidote, pyrite, and pyrrhotite, has been plotted as a function oftemperature in Figure 11 (A-I). Also shown in the diagrams of this figure are the solubility constantcurves for each mineral. Supersaturation is indicated when the solubility product (Q) values are higherthan the solubility constant (K) values at a particular temperature, and undersaturation when Q<K.

180Karingithi Report 9
120 160 200 240 280 320Temperature (°C)
-18
-16
-14
-12
-10
Log
Q a
lbite
(low
)
16202
301306 714
901
902
A
307
23719
25
1019302
903
304D
308
120 160 200 240 280 320Temperature (°C)
-17
-16
-15
-14
-13
Log
Q m
icro
clin
e
15
202
301
302306
307
308
714
902
903
B
709719
1910
901
232516
304D
120 160 200 240 280 320Temperature (°C)
-15
-14
-13
-12
-11
-10
Log
Q C
alci
te
10
1519
202
301
304307
308
709
714
901903
C
902
306 16719
2325
302
120 160 200 240 280 320Temperature (°C)
-12.4
-12
-11.6
-11.2
-10.8
-10.4
Log
Q F
luor
ite
10
1516
1923
25
202 302
304
306
308709
714
719
901
903
E
902
307
301
120 160 200 240 280 320Temperature (°C)
-11
-10
-9
-8
-7
-6
Log
Q a
nhyd
rite
10
25202
302
304
306307308
709714
719901
902
903
D
15
231916
301
FIGURE 11: The saturation state of aquiferwater in the Olkaria geothermal reservoir withrespect to various hydrothermal minerals (A-I);black dots represent the solubility product forindividual well aquifers and the numbers therespective well numbers. The solid curvesrepresent solubilities of pure end-member minerals

181Report 9 Karingithi
120 160 200 240 280 320Temperature (°C)
-40
-38
-36
-34
Log
Q P
rehn
ite
10
162325
202
301
302
304
306
307
308
709
714
901
903
F
19
15902
719
120 160 200 240 280 320Temperature (°C)
-44
-42
-40
-38
-36
Log
Q E
pido
te
10
1523
25202
301
302
304
306
307308
709
714
901
902
903
G
71919
16
120 160 200 240 280 320Temperature (°C)
-3
-2
-1
0
1
2
Log
Q P
yrrh
otite
1016
202
301
302
304
306308
709
714
901
902
I
25
719
903
15
2319
307
120 160 200 240 280 320Temperature (°C)
0
1
2
3
4
5
Log
Q P
yrite 15
1619
25
301
302
304
306
709714
719
902903
H
2310
901
FIGURE 11: Continued (F-I)
6.1 Low-albite and microcline
The results depicted in Figures 11A and B indicate the aquifer water at Olkaria is saturated to slightlysupersaturated with respect to low-albite (fully ordered albite with respect to Al and Si) and microcline(the stable K-feldspar at low temperatures). For low-albite the degree of supersaturation corresponds to0.33 log Q units on average and 0.22 log Q units for microcline. The hydrothermal K-feldspar identifiedat Olkaria is adularia. According to calorimetric data (Hovis, 1988), the solubility of these two types offeldspars is practically the same. Therefore, the microcline solubility curve presented in Figure 11B canbe taken to also represent adularia. The degree of low-albite and microcline supersaturation is not regardedas significant. There is some uncertainty involved in calculation of the aluminium speciation activitiesthat affect the calculated log Q values. However, the predominant Al-hydroxide species in the water isAl (OH)-
4, independent of which chemical thermodynamic data are selected: those of Castet et al. (1993),Pokrovskii and Helgeson (1995) and Arnórsson and Andrésdóttir (1999). In calculating the solubilityproducts for the alkali feldspars, the Si-Al dimer (Pokrovski et al., 1998) was not considered. This dimer

182Karingithi Report 9
may, according to the experimental results of Pokrovski et al. (1998) constitute a substantial fraction ofthe aqueous aluminium concentrations in geothermal water, about half for the Olkaria water, thus loweringthe log Q values by about 0.3 log units for both low-albite and microcline, or quite close to the solubilityconstant curves. However, Stefánsson and Arnórsson (2000) have observed that a calculated saturationindex for high-temperature geothermal water worldwide, for both low-albite and microcline, is generallynegative (undersaturation) if the Si-Al dimer of Pokrovski et al. (1998) is taken into consideration. Theirconclusion is that the stability of this complex may be overestimated, at least at high temperatures.
6.2 Calcite and cation/proton activity ratios
The results of Figure 11C indicate that most of the aquifer water is somewhat calcite undersaturated. Theresults indicate slight supersaturation for the aquifer water of wells OW-10, OW-709, OW-202 and OW-308 but undersaturation for the aquifer water of other wells. On average the departure from saturation is0.13 log Q units and the standard deviation of the departure from equilibrium is 0.35 log Q units.Equilibrium with calcite is rapidly attained at high temperatures. For this reason it is to be expected thathigh-temperature geothermal water would be very close to being calcite saturated. However, in view ofall the errors involved in sampling, analysis and assessment of the speciation of the aquifer water,departure in log Q from the calcite solubility constant curve of 0.3 is not regarded as significant. One ofthe main errors involved in calculating calcite saturation in the aquifer of wet-steam wells from data onthe chemical composition of water and steam samples collected at the surface is the calculation of aquiferpH. One way of checking the reliability of the calculated aquifer pH value is to look at values obtainedfor the calcite saturation index and major cation/proton activity ratios. Too low an aquifer pH would showup as calcite undersaturation and low cation/proton activity ratios. At equilibrium with specific mineralbuffers, geothermal water attains specific cation/proton activity ratios at a particular temperature(Arnórsson and Stefánsson, 2001). Figure 12 (A-D) depicts Na/H, K/H, /Ca/H and /Mg/H ion activityratios. From this figure it is seen that Na/H, K/H and /Mg/H ratios are high relative to the equilibriumvalues proposed by Arnórsson and Stefánsson (2001). The samples with highest cation/proton ratiosdisplay the highest calcite supersaturation. On the other hand, /Ca/H ion activity ratios are low,particularly for the wells in Olkaria West.
The aquifer pH for most of the wells is around 6.5. However, the water in the aquifer of wells OW-202,OW-308 and OW-709 has a pH in excess of 7, and well OW-304D a value below 6. These wells haveNa/H, K/H and Mg/H ion activity ratios, which depart much from the rest of the wells and the equilibriumvalues, as proposed by Arnórsson and Stefánsson (2001).
The relationship between the bicarbonate content of the geothermal water and the /Ca/H ion activityratios suggest that the stability of the CaHCO3
- ion pair is overestimated in the WATCH speciationprogram with the result that a substantial part of the analyzed Ca concentrations in the water samples goesinto forming this ion pair and little is left to form a free Ca ion. The value of the stability constant forCaHCO3
- used in the WATCH speciation program was estimated. Later experiments on calcite solubility(Plummer and Busenberg, 1982) indicate lower stability constant for this ion pair, or by 0.6-0.7 log Kunits in the range 200-300/C. Overestimation of the stability of the CaHCO3
- ion pair would lead tonegative saturation index values (undersaturation) for calcite and low /Ca/H ion activity ratios are indeedobserved.
The concentrations of bicarbonate are generally high in water discharged from Olkaria wells except forwells in the East production field. This high bicarbonate together with the pH of the water samples causeCO2 partial pressures to be higher than that of the atmosphere. As a result, these samples will tend todegas when placed in an open beaker during measurement of pH and titration of the carbonate carbon.Such degassing will tend to give high pH readings and low carbonate carbon concentrations. It is

183Report 9 Karingithi
1.6 1.8 2 2.2 2.41000/Temp (1/K)
4
4.5
5
5.5
6
6.5
Na/
H ra
tio
10
1516
25
202
301302
304
307
308
709
714
901
902
A
30619719
23
903
1.6 1.8 2 2.2 2.41000/Temp (1/K)
2.5
3
3.5
4
4.5
5
K/H
ratio
1925
202
301
304
306
307
308
709
714719
901
902903
B
30216
15
10
23
1.6 1.8 2 2.2 2.41000/Temp (1/K)
2.8
3.2
3.6
4
4.4
4.8
Mg/
H ra
tio
1516
202
301
302
304
308
709
714901
902
903
C
232510
19 719
306
307
1.6 1.8 2 2.2 2.41000/Temp (1/K)
2.5
3
3.5
4
4.5
5
5.5
Ca/
H ra
tio
1619
2325
202
301
302
304
306307
308709
714 719902
903
D
10
90115
FIGURE 12: Cation/proton ratio variations with the reciprocal of the absolute temperature
considered that such degassing may be the cause of the observed high Na/H, K/H and /Mg/H ratios. Itwill also tend to give high /Ca/H ion activity ratios and calcite supersaturation. However, overestimationof the stability of the CaHCO3
- ion pair apparently has a larger effect in the opposite direction in the caseof the /Ca/H activity ratio and calcite saturation.
6.3 Anhydrite and fluorite
The plot of the activity product for anhydrite and fluorite is shown in Figure 11D and E. All the wateris undersaturated with respect to anhydrite, and saturated or undersaturated with fluorite. Both theseminerals occur as hydrothermal minerals at Olkaria although anhydrite is confined to Olkaria West. Thereis, thus, inconsistency in the results. The cause for this inconsistency is considered to be the consequenceof too low values for the dissociation constant of the CaHCO3
- ion pair leading to its too high stabilityand correspondingly too low values for the activity of the free calcium ion and too low log Q values forboth anhydrite and fluorite. Additionally, some loss of calcium from solution by calcite precipitation in

184Karingithi Report 9
the depressurization zone between undisturbed aquifer conditions and wellhead could contribute furtherto low calculated Ca+2 activity.
6.4 Prehnite and epidote
The log Q for the prehnite plot is shown in Figure 11F. Wells OW-10, OW-709, OW-15 and OW-714are supersaturated with respect to prehnite. Their deviation from equilibrium follows the same order asgiven above. All the other wells discharge fluid that is to varying degrees, undersaturated with respectto prehnite. Extreme undersaturation is observed for wells OW-301, OW-304, OW-307 and OW-308.Epidote (Figure 11G) follows a similar pattern although the data points are on the whole shifted towardshigher values. Some of the data points for Olkaria West and Central indicate undersaturation but othersare close to saturation or indicate supersaturation. Decreasing iron content would lead to higher degreeof supersaturation.
6.5 Pyrite and pyrrhotite
The results in Figures 11H and I indicate that all the Olkaria waters are pyrite supersaturated andpyrrhotite undersaturated. However, departure from equilibrium is not large when considering theuncertainty involved in the chemical thermodynamic data to calculate the ferrous iron speciation. It isconcluded that the Olkaria aquifer waters are close to equilibrium with these sulphide minerals.
7. DISCUSSION
The calculated quartz equilibrium temperatures for wells depend on the model selected in accounting forthe excess enthalpy in the well discharges. The model used in this study assumes that partial segregationof the water and steam phases in the depressurization zone around wells is responsible for the excessenthalpy. If heat flow from the aquifer rock to the fluid in the aquifer contributed to vaporisation of thewater, the selected model would give high values for quartz equilibrium temperatures. It is consideredthat heat flow from the rock may contribute to the excess enthalpy of well discharges, particularly in theEast production field, where reservoir pressure drawdown is most extensive but this process is not thedominant one in accounting for excess enthalpy. Calculation of quartz equilibrium temperatures by thismodel sometimes yields values that are lower than the temperatures at wellheads.
Mixing of fluid in wells from two or more aquifers of significantly different temperatures may lead to adiscrepancy between various geothermometers. Such mixing leads to Na/K temperatures becoming higherthan the quartz equilibrium temperatures, particularly if the hotter component in the mixture had highersalinity (Arnórsson, 2000). Extensive boiling causes initially calcite-saturated geothermal water tobecome supersaturated with this mineral and its deposition. For the low calcium and rich total carbonatecarbon water at Olkaria, such calcite deposition may involve removal of a substantial part of the calciumfrom solution, resulting in too high Na/K/Ca temperatures. This process is thought to be the cause of highNa/K/Ca temperatures rather than faulty calibration of the geothermometer.
Contribution to well flow from two or more aquifers of significantly different temperatures causes H2Stemperatures to be higher that any solute geothermometer temperature, particularly if the deeper, hotteraquifer is rich in steam. Reliable calibration of the H2S geothermometer is needed to study a possiblediscrepancy between the mentioned geothermometers. High H2 temperatures, compared with those ofH2S, are indicative of the presence of equilibrium steam in the aquifer beyond the zone ofdepressurization. Again reliable calibration of the H2 geothermometer is required to calculate the steamfraction in the aquifer (see Arnórsson et al., 1990). Yet, it appears that the gas geothermometer calibrationfor dilute water, given by Arnórsson and Gunnlaugsson (1985), provides reasonable results for the Olkaria

185Report 9 Karingithi
East production field where basalts are relatively abundant.
The aquifer water from the various parts of the Olkaria field, excepting the Olkaria East production field,are relatively rich in bicarbonate. The thermodynamic data in the WATCH speciation program on thedissociation constant for the CaHCO3
+ ion pair is apparently too low, and lower than indicated by theexperimental results on calcite solubility by Plummer and Busenberg (1982). This leads to too lowcalculated values for the activity of the free Ca+2 ion and correspondingly low solubility products (Q-values) for all calcium-bearing minerals such as calcite, anhydrite, fluorite, prehnite and epidote. Toassess the saturation state of the reservoir water at Olkaria with respect to these minerals, it is necessaryto update the data base in the WATCH speciation program with respect to the stability of the CaHCO3
+
ion pair.
8. SUMMARY AND CONCLUSIONS
The solute geothermometers most often yield comparable aquifer temperatures for the wells specificallyselected for the present study. They lie in the range 184 to 310/C, being lowest in well OW-308 andhighest in well OW-709. Comparison between these temperatures and those measured at the depth levelof the permeable horizons suggest that the shallowest horizons constitute the main feed zones for manyof the wells. In order to obtain reliable results from the gas geothermometers, it is necessary to obtainappropriate calibration for these geothermometers that takes into account the composition of the mineralin the buffers with which these gases tend to equilibrate. The CO2 gas geothermometer temperatures areerroneously high for Olkaria West, Olkaria Domes and in some wells in Olkaria Northeast. This isprobably the result of lack of equilibration between CO2 and the respective mineral buffer due to high fluxof CO2 from the magmatic heat source.
The oxygen-18 and deuterium isotope composition of water in producing aquifers at Olkaria plot closeto the local meteoric line. In Olkaria West and Central, the isotope composition groups together. The *Dvaries from -18 to 0‰, while *18O varies from -6 to -1‰. Water in Olkaria East, Olkaria Northeast, andOlkaria Domes forms another group. The *D varies from 0.2 to 20‰. There exists a major differencebetween the fields to the west of Olkaria fracture and to the east of the Ololbutot fault, indicating that theyhave different recharge areas.
At quartz equilibrium temperature, the aquifer water has closely approached equilibrium, with somehydrothermal minerals, including low-albite, calcite and microcline. The water apparently is saturatedto undersaturated with respect to fluorite, and somewhat undersaturated with respect to anhydrite. Theapparent undersaturation may be an artifact due to erroneous data on the stability of the CaHCO3
+ ion pairin the thermodynamic database of the WATCH speciation program.
ACKNOWLEDGEMENTS
Special thanks to my supervisor Stefán Arnórsson; I am honoured to have been his student. I would liketo express my sincere gratitude to the UNU Staff - Dr. Ingvar B. Fridleifsson, Mr. Lúdvík S. Georgssonand Mrs. Gudrún Bjarnadóttir, for all the care, generous help and advice during the whole training period.I would like to thank the UNU, the Government of Iceland, Orkustofnun staff, and the KenGenmanagement for granting me the opportunity to participate in the Geothermal Training Programme.
My deepest thanks to my family. This report is dedicated to them for all the sacrifice they made duringthe six months that I was away from home. All glory and honor to the Lord for the successful completionof the entire programme.

186Karingithi Report 9
REFERENCES
Ambusso, W.J., and Ouma, P.A., 1991: Thermodynamic and permeability structure of Olkaria North-eastgeothermal field: Olkaria fault. Geothermal Resources Council, Transactions, 15, 237-242.
Ármannsson, H., Gudmundsson, Á., and Steingrímsson, B.S., 1987: Exploration and development of theKrafla geothermal area. Jökull, 37, 12-29.
Arnórsson, S., 2000: The quartz and Na/K geothermometers. 1. New thermodynamic calibration.Proceedings of the World Geothermal Congress 2000, Kyotot-Tohoku, Japan, 929-934.
Arnórsson, S., and Andrésdóttir, A., 1999: The dissociation constants of Al-hydroxy complexes at 0-350/C and Psat. Proceedings of 5th International Symposium on the Geochemistry of the Earth's Surface,Rotterdam, Balkema, 425-428. Arnórsson, S., Björnsson, S., Muna, Z.W., and Bwire-Ojiambo, S., 1990: The use of gas chemistry toevaluate boiling processes and initial steam fractions in geothermal reservoirs with an example from theOlkaria field, Kenya. Geothermics, 19, 497-514.
Arnórsson, S., and Gunnlaugsson, E., 1985: New gas geothermometers for geothermal exploration -calibration and application. Geochim. Cosmochim. Acta, 49, 1307-1325.
Arnórsson, S., Sigurdsson, S. and Svavarsson, H., 1982: The chemistry of geothermal waters in IcelandI. Calculation of aqueous speciation from 0/C to 370/C. Geochim. Cosmochim. Acta, 46, 1513-1532.
Arnórsson, S., and Stefánsson, A., 1999: Assessment of feldspar solubility constants in water in the range0-350/C at Psat. Am. J. Sci., 299, 173-209.
Arnórsson, S., and Stefánsson, A., 2001: A novel way to demonstrate mineral-solution equilibria ingroundwater systems. Geofluids, in press.
Berman, R.G., 1988: Internally consistent thermodynamic data for minerals in the system Na2O-K2O-CaO-MgO-FeO-Fe2O3-Al2O3-SiO2-TiO2-H2O-CO2. J. Petrology, 29, 455-522.
Bjarnason, J.Ö., 1994: The speciation program WATCH, version 2.1. Orkustofnun, Reykjavík, 7 pp.
Castet, S., Dandurand, J.L., Schott, J., and Gout, R., 1993: Boehmite solubility and aqueous aluminiumspeciation in hydrothermal solutions (90-350/C): Experimental study and modeling. Geochim.Cosmochim. Acta., 57, 4869-4884.
Clarke, M.C.G., Woodhall, D.G., Allen, D., and Darling, G., 1990: Geological, volcanological andhydrogeological controls on the occurrence of geothermal activity in the area surrounding LakeNaivasha, Kenya, with coloured 1:100 000 geological maps. Ministry of Energy, Nairobi, 138 pp.
Craig, H., 1961: Isotopic variations in meteoric water. Science, 133, 1702-1703.
Diakonov, I.I., Schott, J., Martin, F., Harrichourry, J.C., and Escalier, J., 1999: Iron (III) solubility andspeciation in aqueous solutions. Experimental study and modeling: part 1. Hematite solubility from 60to 300/C in NaOH-NaCl solutions and thermodynamic properties of FE(OH)4
-(aq). Geochim. Cosmochim.Acta, 63, 2247-2261.
Fournier, R.O., and Potter, R.W. II, 1982: A revised and expanded silica (quartz) geothermometer. Geoth.Res. Council Bull., 11-10, 3-12.
Fournier, R.O., and Truesdell, A.H.,1973: An empirical Na-K-Ca geothermometer for natural waters.Geochim. Cosmochim. Acta, 37, 1255-1275.

187Report 9 Karingithi
Gottschalk, M., 1997: Internally consistent thermodynamic data for minerals in the system SiO2-TiO2-Al2O3-Fe2O3-CaO-MgO-FeO-K2O-Na2O-H2O-CO2. Europ. J. of Mineralogy, 9, 175-223.
Gudmundsson, B.T., and Arnórsson, S., 2001: Secondary mineral - fluid equilibria in the Krafla andNámafjall geothermal systems, Iceland. Applied Geochemistry, (in press).
Henley, R.W., Truesdell, A.H., Barton, P.B. Jr., and Whitney, J.A., 1984: Fluid - mineral equilibria inhydrothermal systems. Reviews in Economic Geology, 1, 267 pp. Holland, T.J.B., and Powell, R., 1990: An enlarged and updated internally consistent thermodynamicdataset with uncertainities and correlations: K2O-Na2O-CaO-MgO-MnO-FeO-Fe2O3-Al2O3-TiO2-SiO2-C-H2-O2. J. Metamorphic Petrology, 8, 89-124.
Holland, T.J.B., and Powell, R., 1998: An internally consistent thermodynamic data set for phases ofpetrological interest. J. Metamorphic Petrology, 16, 309-343.
Hovis, G.L., 1988: Enthalpies and volumes related to K-Na mixing and Al-Si order/disorder in alkali-feldspars. J. Petrology, 29, 731-763.
Karingithi, C.W., 1992: Olkaria East production field geochemical report. Kenya Power Company, Ltd.,internal report, 96 pp.
Karingithi, C.W., 1993: Olkaria East production field geochemical report. Kenya Power Company, Ltd.,internal report, 86 pp.
Karingithi, C.W., 1996: Olkaria East production field geochemical report. Kenya Power Company, Ltd.,internal report, 124 pp.
Karingithi, C.W., 1999: Olkaria Domes geochemical model. The Kenya Electricity Generating Company,Ltd, internal report, 30 pp.
KenGen 1998: Surface exploration of Kenya’s geothermal resources in the Kenya Rift. The KenyaElectricity Generating Company, Ltd, internal report, 84 pp.
KenGen 1999: Conceptualized model of the Olkaria geothermal field (compiled by Muchemi, G.G.) TheKenya Electricity Generating Company, Ltd, internal report, 46 pp
KPC, 1982a: Programme for geochemical data collection and monitoring of well discharges preparedby Virkir Consulting Group Ltd. Kenya Power Company, Ltd., internal report, 112 pp.
KPC, 1982b: Status report on steam production, prepared by Merz and McLellan and Virkir ConsultingGroup Ltd. Kenya Power Company, Ltd., internal report, 102 pp.
KPC, 1984: Background report for scientific and technical review meeting.Kenya Power Company, Ltd.,internal report prepared by KRTA, 254 pp.
KPC, 1988: Report on Olkaria and Eburru geothermal development. Working papers on NortheastOlkaria, for STRM, Kenya Power Company, Ltd., internal report, 246 pp.
KPC, 1990: Olkaria West field information report. STRM, Kenya Power Company, Ltd., internal report,240 pp.
Leach, T.M., and Muchemi G.G., 1987: Geology and hydrothermal alteration of the North and Westexploration wells in the Olkaria geothermal field, Kenya. Proceedings of the 9th New Zealand GeothermalWorkshop, Geothermal Institute, Auckland, 187-192.

188Karingithi Report 9
Muchemi, G.G.,1999: Conceptualised model of the Olkaria Geothermal Field. The Kenya ElectricityGenerating Company, Ltd, internal report, 46 pp.
Muna, Z.W., 1982: Chemistry of well discharges in the Olkaria geothermal field, Kenya. UNU G.T.P.Iceland, Report 8, 38 pp.
Muna, Z.W., 1990: Overview of the geochemistry of the Olkaria West geothermal field, Kenya. KenyaPower Company, Ltd., internal report, 56 pp.
Mungania, J., 1992: Geology of the Olkaria geothermal complex. Kenya Power Company, Ltd, internalreport, 38 pp.
Mwangi, M.N., 2000: Country update report for Kenya 1995-1999. Proceedings of the WorldGeothermal Congress 2000, Kyoto- Tohoku, Japan, 327-333.
Omenda, P.A., 1998: The geology and structural controls of the Olkaria geothermal system, Kenya.Geothermics, 27-1, 55-74.
Omenda, P.A., Onacha, S.A., and Ambusso, W.J., 1993: Geological setting and characteristics of the hightemperature geothermal systems in Kenya. Proceedings of the 15th New Zealand Geothermal Workshop,Geothermal Institute, Auckland, 161-167.
Ouma, P.A., 1999: Reservoir engineering report for Olkaria Domes field. Kenya Electricity GeneratingCompany Ltd., internal report, 54 pp.
Pokrovskii, G.S., Schott, J., Salvi, S., Gout, R., and Kubicki, J.D., 1998: Structure and stability ofaluminium-silica complexes in neutral to basic solution. Experimental study and molecular orbitalcalculations. Mineralogical Magazine, 62A, 1194-1195.
Pokrovskii, V.A., and Helgeson, H.C., 1995: Thermodynamic properties of aqueous species andsolubilities of minerals at high pressures and temperatures: The system Al2O3-H2O-NaCl. Am. J. Sci., 295,1255-1342.
Plummer, L.N., and Busenberg, E., 1982: The solubilities of calcite, aragonite and vaterite in CO2-H2Osolutions between 0 and 90/C, and evaluation of the aqueous model for the system CaCO3-CO2-H2O.Geochim. Cosmochim. Acta, 46, 1011-1040.
Riaroh, D., and Okoth, W., 1994: The geothermal fields of the Kenya rift. Tectonophysics, 236, 117-130.
Simiyu, S.M., Mboya, T.K., Oduong, E.O., and Vyele, H.I., 1997: Seismic monitoring of the Olkariageothermal area, Kenya. The Kenya Electricity Generating Company, Ltd., internal report, 62 pp.
Stefánsson, A., and Arnórsson, S., 2000: Feldspar saturation state in natural waters. Geochim.Cosmochim. Acta, 64, 2567-2584.
Strecker, M.R., Blisniuk, P.M., and Eisbacher, G.H., 1990: Rotation of extension direction in the CentralKenyan Rift. Geology, 18, 299.
Wambugu, J.M., 1995: Geochemical update of Olkaria West geothermal field. Kenya Power Company,Ltd., internal report, 40 pp.
Wambugu, J.M., 1996: Assessment of Olkaria-Northeast geothermal reservoir, Kenya based on welldischarge chemistry. Report 20 in: Geothermal Training in Iceland 1996. UNU G.T.P., Iceland, 481-509.