geochemical variability of major and trace elements and
TRANSCRIPT

~ 1261 ~
International Journal of Chemical Studies 2019; 7(5): 1261-1272
P-ISSN: 2349–8528
E-ISSN: 2321–4902
IJCS 2019; 7(5): 1261-1272
© 2019 IJCS
Received: 06-07-2019
Accepted: 24-07-2019
UK Maurya
National Institute of Abiotic
Stress Management (NIASM),
Malegaon, Baramati, Pune,
Maharashtra, India
RA Duraiswami
Department of Geology,
University of Pune, Pune,
Maharashtra, India
NR Karmalkar
Department of Geology,
University of Pune, Pune,
Maharashtra, India
KPR Vittal
National Institute of Abiotic
Stress Management (NIASM),
Malegaon, Baramati, Pune,
Maharashtra, India
Correspondence
UK Maurya
National Institute of Abiotic
Stress Management (NIASM),
Malegaon, Baramati, Pune,
Maharashtra, India
Present Address:
Division of Soil Science &
Agronomy, ICAR-Indian
Institute of Soil & Water
Conservation, Dehradun,
Uttarakhand, India
Geochemical variability of major and trace
elements and their role in abiotic stresses
UK Maurya, RA Duraiswami, NR Karmalkar and KPR Vittal
DOI: https://doi.org/10.22271/chemi.2019.v7.i5w.7116
Abstract
Geochemical variability in rocks collected from profile section, drilling core and random samples from
NIASM site has been studied using x-ray fluorescence spectrometry. The sum total of all the major oxide
analyses show variable degrees of weathering and range from highly weathered samples to fresh rock.
Analyses were used on an anhydrous basis in the SINCLAS programme to recalculate major oxides and
normalise the geochemical analyses to 100. The programme also gives a rock name following the TAS
diagram as well as fixes the Fe2O3: FeO ratio and then calculates the norm. Based on the normative
mineralogy and SiO2 vs. Na2O+K2O content in the TAS diagram the present samples were classified into
sub-alkaline basalts, basaltic andesites and andesite. Major oxide variation diagram in the Main Pit
indicated silica and alumina oxides tend to accumulate towards the upper parts whereas TiO2 and FeO
tend to be mobile in an oxidizing environment and get leached towards the lower parts of the weathering
profile. The unique lobate geometry of the lava flow does not weather uniformly resulting in a rather
jagged oxide variation diagram which is predominantly a function of the lobe geometry and the porosity
and permeability of the lobe sub-units. The Mg# of the subalkaline basalt indicates moderately evolved
magmas. The trace element Cu and Ni have a distinctly opposite signature as compared to Zr, V, Cr, Zn,
and Co. Concentration of Ba, Sr and Rb are invariably high in the upper and lower parts of the Main Pit
which is due to modal variations in the plagioclase content or due to the variable mobility of these
elements in response to differential weathering across the Main Pit profile. Anomalous concentration of
different major oxides and trace elements at 50 cm and 70 cm depth is due to presence of the thin clay
horizons related to weathering of glassy rind of a single 20 cm thick pahoehoe toe. Such anomalous
accumulations could suggest that the clays provide suitable sites for their adsorption or that considerable
enrichment of these elements takes place due to deposition of soluble salts in an oxidizing environment.
Keywords: Geochemical variability, abiotic stresses, basalt, pahoehoe toe
1. Introduction
The National Institute of Abiotic Stress Management (NIASM) site is a part of the Nira River
Basin of the Upper Bhima River. Earlier work in the basin has been carried out by Kale et al
(1993) [12], Rajguru et al. (1993) [24], Kale and Dasgupta (2009) [11], and Ghodke et al. (1984) [9].
Geological Survey of India (GSI, 1998) [8] has undertaken detailed mapping of the area and has
classified the flows into the Dive Ghat Formation. The detailed chemostratigraphy of the area
was undertaken by Khadri et al. (1999) [15] and the flows exposed in the basin have been
classified as those belonging to the Poladpur and Ambenali Formation of Wai Subgroup.
Duraiswami et al (2008a) [5] also reported rubbly pahoehoe flows from the Dive Ghat section.
It has been observed that the multi-lobed compound geometry of the pahoehoe lava flow
exposed at site has considerable control on weathering and mobility of major and trace
element. The objectives of the present investigations are to study the geochemical variability in
major and trace elements in the main pit at the site due to diverse nature of lobate geometry
with different degree of weathering from inner to outer side of the lobes and establish the
relationship with similar rocks exposed elsewhere in the site.
2. The study area
The NIASM site under study is located between N 18º8’59.279" and 18º9'45.845" and E
74º29'30.38" and 74º30'38.299" and lies between Karha Basin of Bhima River in the north and
Nira River Basin in the south. It lies in the Drought Prone Area of plateau region of western
Maharashtra on a water divide with a smooth but slightly undulating topography within the
limits of village Malegaon Khurd, Baramati Taluka of Pune district. The area is known for its
frequent scarcity. The site is well connected by road with major cities in the State and also by

~ 1262 ~
International Journal of Chemical Studies http://www.chemijournal.com
Central Rail Network to Pune via Daund Junction (Fig.1).
Fig 1: Location of study area Malegaon in Pune District
The side of the area is drained by two streams and generally
exhibit dendritic drainage pattern especially in the lower order
streams. A prominent percolation tank is built across the
western stream while an earthen dam is built across the
eastern stream. The climate of the region is semi-arid dry.
Based on the rational classification of climate (Potential
evapo-transpiration and Moisture index), the study area
experiences arid megathermal climate (Paranjape, 2001) [22].
3. Material and Methods Rock samples from surfacial pits and boreholes were selected
for geochemical analyses and were optimized on the basis of
the representations in the basaltic weathering profile at
NIASM project site. Eight representative samples each from
the main pit and the boreholes and ten representative samples
from random surfacial locations from NIASM site were
selected for major oxide and trace element analyses. Small
chips of each sample (~150 gm) were broken by a steel
hammer, rinsed several times with ultra-pure water and
crushed with an agate mortar and pestle and pelletized into
pellets using 4 grams of sample powder mixed with 0.7 grams
of wax at 10 tons/in2 pressure using a hydraulic press.
Samples for both major and trace elements were analyzed
after calibrating internal standards using SPECTRO ED-XRF.
The standard deviation for all major oxides is less than 0.5,
except for SiO2 and Na2O where it is around 1. The LIO was
not determined for these samples and the analyses were used
on an anhydrous basis in the SINCLAS programme (Verma et
al., 2002) [26] to recalculate major oxides and normalize the
geochemical analyses to 100. Total iron was split into ferrous
and ferric oxides on the basis of well-established criteria. In
the measured iron-oxidation ratio option, all iron was
considered as Fe2O3 (T) the Middlemost option (Middlemost,
1989) [21] was used, which proposed a fixed ratio of Fe2O3 to
FeO that depended on the rock type (Classification).
4. Results and Discussion
4.1 Geological variability of the site
The rocks exposed in the study area belong to Cretaceous age.
The Recent deposits are represented by shallow alluvium
whereas the Quaternary is represented by consolidated
sediments exposed in the downstream of the study areas. Two
lava flows of varying thickness and morphology belonging to
the Deccan Traps are exposed in the study area. The
lowermost flow F1 is grey, fine-grained, jointed and simple. It
is exposed only in the well sections in the study area as well
at places where upper flow has been removed by denudation
and weathering action. The upper flow F2 is pinkish,
vesicular and belongs to the hummocky pahoehoe type. The
flow is strongly compound and consists of lava toes, meter
scale lobes and thick (~10m) sheet lobes. The vesicles in this
flow are small (1-2 cm) and invariably filled with zeolites and
other secondary minerals like calcite. The base of individual
lava units are marked by pipe-amygdales. The upper flow F2
is extensively exposed in the NIASM site and in the adjacent
well sections. An elaborate geochemical (Beane et al., 1986)
[2] and lithostratigraphy (GSI, 1986, Godbole et al. 1996) [10]
exists for the Western Deccan Traps (Table 1). Detailed
mapping in the adjacent areas has revealed the lower simple
flow belongs to the Indrayani Formation (Godbole et al.
1996) [10] equivalent to the Khandala Formations (Khadri et al.
1999) [15] while the upper compound hummocky pahoehoe
flow belongs to the Karla Formation (GSI, 1986, Godbole et
al. 1996) [10] or Bushe Formations (Duraiswami, 2009) [4].

~ 1263 ~
International Journal of Chemical Studies http://www.chemijournal.com
Table 1: Established geochemical and lithostratigraphy in the western Deccan Traps (After Beane et al., 1986, GSI 1986, Godbole et al.
1996) [2, 10].
Geochemical stratigraphy Lithostratigraphy
Group Sub-group Formation Super Group Group Sub Group Formation
D
E
C
C
A
N
B
A
S
A
L
T
Wai
Desur
D
E
C
C
A
N
T
R
A
P
S
A
H
Y
A
D
R
I
G
R
O
U
P
Mahabaleshwar
Mahabaleshwar
Panhala M4
Mahabaleshwar
Ambenali Diveghat
Purandargad
Poladpur Diveghat
Lonavala
Elephanta
Lonavala Bushe Karla
Kandhala Indrayani
M3
Kalsubai
Bhimashankar
Kalsubai
Upper Ratangad
Thakurwadi M2
Neral Lower Ratangad
Igatpuri M1
Jawhar Salher
A rectangular pit (l:8m, b:2.5m, d:3m) was dug towards the
south-central part of the NIASM site and is referred to as the
main pit (MP) (Fig. 2). The pit exposes a weathering profile
typical of compound pahoehoe flows (Bondre et al., 2004) [3].
An intricate geometry of lava lobes and toes is seen on the
eastern face of the main pit (Fig. 3). Most of the lava toes and
lobes are completely vesicular and can be classified as s-type
lobes of Wilmoth and Walker (1993) [27] (Fig. 4a).
Fig 2: Main Pit
Fig 3: Field sketch of the lobate geometry of the compound
pahoehoe flow exposed in the NIASM site.
Fig 4: Photographs of lava features from the Main Pit at NIASM site.

~ 1264 ~
International Journal of Chemical Studies http://www.chemijournal.com
The southern face of the MP exposes three distinct lava lobes.
The upper lobe is partially exposed and has developed a crude
weathering profile. The middle lobe is intact and is
completely exposed in cross section in the MP (Fig. 4b). The
lobe is augen shaped and has a length of 1m and thickness of
0.5m. It consists of the typical 3-tiered internal structure of
crust-core-basal zone of Aubele et al., (1988) [1] but is
characterized by the lack of pipe vesicles in the basal
vesicular zones and thus, this relatively large lava lobe also
belongs to the s-type lobes. The crust of this lobe is highly
vesicular and at places develops a crude vesicle banding. The
vesicles are small towards the chilled margins of the lobes but
become larger (up to 2 cm) towards the base of the crust. The
western face of the MP exposes a chaotic assemblage of small
lava toes (Fig. 4c) and lobes as well as large dome shaped
lobe (Fig. 4d). The inter-lobe spaces are highly weathered and
show beautiful zeolite mineralization (Fig. 4E). A large 40 cm
central gas blister or cavity is seen towards the mid central
part of the lobe and is lined by zeolites (Fig. 4F). The detailed
lithologs of samples collected from the MP is presented in
Table 2.
Table 2: Geological logs from main pit at NIASM site
Sr. no. Depth (cm)
From To Sample No Description
1 0 17 MP1 Highly weathered basalts with few zeolite filled vesicles
2 17 27 MP2 Weathered basalt with fluffy white zeolite encrustation with few zeolite filled vesicles.
3 27 50 MP3 Fine grained, reddish bole (Glassy rind of weathered pahoehoe lobe) with small white patches of calcrete
4 50 65 MP4 Light brown, moderately weathered basalt with 0.2 to 0.9 mm spherical vesicles partly filled with buff
coloured zeolite and also one side with white patches of calcrete/zeolite (?)
5 65 70 MP5 Sample similar to MP3, probably lower rind of pahoehoe lobe, no calcrete deposition seen here unlike
MP3 and sample slightly harder than MP3.
6 70 83 MP6 Grayish brown moderately weathered basalt with 0.22 to 0.5 mm white amygdales filled with zeolites.
7 83 156 MP7 Grayish moderately weathered basalt with < 2 mm spherical vesicles which contains greenish lining and
zeolite mineralization.
8 156 231 MP8 Sample similar to MP7 except the presence of one 3 mm white amygdale and more weathered than MP7
Besides this core drilling was conducted to 5m depths at
numerous locations from NIASM for geotechnical
investigations. The cores were inspected and logged and chips
were harvested for detailed geochemical investigations.
Random samples were also collected from areas and are
represented on the NIASM site (Fig. 5) so that weathering
patterns and inter borehole correlations could be established.
The detail lithologs of sample collected from cores and
random sampling are shown in Table 3 & 4.
Fig 5: Sample location at NIASM Site. Main Pit (MP), Bore Hole Pit (BH 1-12 &16) and Random Sample Pit (RS 2, 6, 7,8,10, 12, 25 &35)
Table 3: Geological logs from the different boreholes at NIASM site
Sr. no. Depth (m) From To Sample No Description
1 4.5 5.0 BH-1/28 Fresh, brownish, massive basalt with dixytaxitic texture, without vesicles.
2 1.5 2.5 BH-9/1 Reddish brown, vesicular basalt with fine zeolites lining the vesicles.
3 4.0 4.5 BH-9/18 Reddish brown massive basalt devoid of vesicles.
4 4.5 5.0 BH-9/22 Reddish brown massive basalt with minute < 1 mm vesicles and some of them are filled with zeolites.
5 3.5 5.0 BH-10/19 Grayish black massive basalt with large stray vesicles filled by zeolites.
6 0.2 1.0 BH-7/3 Brownish massive basalt.
7 4.0 5.0 BH 7/31 Red coloured, highly zeolitised massive basalt.

~ 1265 ~
International Journal of Chemical Studies http://www.chemijournal.com
Table 4: Geological logs from various random locations at the NIASM site
Sr. no. Depth (m) From To Sample No Description
1 0.2 1.2 RS2 Reddish vesicular basalt, moderately weathered, few large (~10cm) elongated vesicles, partly
filled with zeolites.
2 0.3 1.5 RS6 Reddish brown comparatively fresh basalt with numerous partly filled vesicles.
3 1.0 1.5 RS7 Comparatively fresh reddish grey, fine grained basalt representing massive part of the lava lobe
with fine dixytaxitic texture.
4 0.8 1.4 RS8 Comparatively fresh reddish basalt with 0.2 mm to 0.5 mm vesicles lined creamish material,
non zeolite bearing.
5 0.3 0.9 RS10 Moderately weathered fine grained basalt showing plain surfaces (joints) along which greenish
encrustations of fine zeolite are deposited.
6 0.1 1.3 RS11 Comparatively fresh dense basalt with high vesicle density of spherical to irregular filled with
zeolites
7 0.3 1.1 RS17 Comparatively fresh, grey, massive basalt devoid of zeolites but with minute irregular pores
(dixytaxitic texture).
8 0.2 1.0 RS25 Sample similar to RS17, but comparatively more weathered.
9 0.1 1.3 RS26 Massive, dense, comparatively weathered basalt where dixytaxitic voids are filled with zeolites.
10 0.3 1.6 RS36 Reddish brown, moderately weathered basalt with small (~2 mm) vesicles filled by platy
zeolites.
4.2 Geochemical variability in major oxide The analytical results of major oxide and their normative
classification are given in the table 5 to 7. Based on normative
classification most of the samples analysed belongs to sub-
alkaline, tholeiite (hypersthene normative) basalts. Besides
this, most fresh samples are olivine normative with the
normative olivine content varying from 3.28 to 6.48. This
geochemical observation.
Table 5: Major oxide geochemistry and CIPW norms of samples from main pit of NIASM site
Sample MP 1 MP 2 MP 3 MP 4 MP 5 MP 6 MP 7 MP 8
Rock type B, subal B, subal B, subal B, subal A B, subal BA B, subal
SiO2 44.25 43.44 35.94 44.48 42.34 44.81 43.26 45.13
TiO2 2.21 1.92 0.46 2.28 0.58 2.04 1.90 2.55
Al2O3 8.94 9.56 11.11 8.47 12.58 9.64 9.32 7.95
Fe2O3(T) 12.06 11.89 3.85 13.88 5.14 12.54 11.28 15.00
MnO 0.17 0.13 0.04 0.17 0.05 0.16 0.12 0.15
MgO 4.59 3.69 1.66 3.65 3.49 4.95 5.21 6.12
CaO 12.95 10.46 19.92 10.32 8.19 10.75 7.99 7.07
Na2O 1.67 2.76 0.17 3.14 1.28 2.34 2.96 3.50
K2O 0.37 0.58 0.05 0.27 0.31 0.37 0.46 0.45
P2O5 0.16 0.25 0.03 0.28 0.03 0.20 0.20 0.29
Total 87.37 84.68 73.23 86.94 73.99 87.80 82.70 88.21
SiO2adj 51.25 51.92 49.30 51.87 57.53 51.66 52.88 51.91
TiO2adj 2.56 2.30 0.63 2.66 0.79 2.35 2.32 2.93
Al2O3adj 10.35 11.43 15.24 9.88 17.09 11.11 11.39 9.15
Fe2O3adj 2.13 2.17 0.81 2.47 1.67 2.21 2.93 2.63
FeOadj 10.65 10.84 4.03 12.34 4.78 11.03 9.77 13.16
MnOadj 0.20 0.16 0.06 0.20 0.07 0.18 0.15 0.17
MgOadj 5.32 4.41 2.28 4.26 4.74 5.71 6.37 7.04
CaOadj 15.00 12.50 27.32 12.03 11.13 12.39 9.77 8.13
Na2Oadj 1.93 3.30 0.23 3.66 1.74 2.70 3.62 4.03
K2Oadj 0.43 0.69 0.07 0.32 0.42 0.43 0.56 0.52
P2O5adj 0.19 0.30 0.04 0.33 0.04 0.23 0.24 0.33
Q 4.33 0.79 3.72 0.96 15.92 2.44 1.78 -
Or 2.53 4.10 0.40 1.86 2.49 2.52 3.32 3.06
Ab 16.37 27.92 1.97 30.98 14.72 22.83 30.62 34.07
An 18.31 14.32 40.33 9.58 37.59 16.96 13.18 5.35
Di 45.49 38.21 51.11 40.31 14.07 35.66 27.60 27.14
Hy 4.60 6.47 - 6.93 11.21 11.41 14.27 16.50
Ol - - - - - - - 3.73
Mt 3.09 3.14 1.17 3.58 2.43 3.20 4.25 3.81
Il 4.86 4.36 1.20 5.05 1.50 4.47 4.41 5.57
Ap 0.43 0.69 0.10 0.76 0.10 0.53 0.57 0.77
Mg# 47.08 42.04 50.20 38.07 63.88 47.99 53.75 48.82
FeO(T)//MgO 2.36 2.90 2.09 3.42 1.33 2.28 1.95 2.21
Salic 41.53 47.12 46.43 43.38 70.71 44.74 48.90 42.48
Femic 36.28 31.67 14.60 32.60 24.77 37.71 39.59 44.13
CI 71.05 54.45 66.72 48.24 63.53 61.08 54.82 44.26
DI 23.22 32.80 6.10 33.80 33.12 27.79 35.71 37.13
SI 25.98 20.60 30.73 18.47 35.51 25.87 27.39 25.72
AI 1.21 1.40 1.01 1.44 1.17 1.31 1.49 1.71

~ 1266 ~
International Journal of Chemical Studies http://www.chemijournal.com
WI 3610 3945 3167 3890 2537 3719 3780 4050
B, subal-Basalt, subalkaline; BA-Basaltic andesite; A-Andesite. CI-Colour Index, AI-Alkalinity Index, WI-Weathering Index, SI-Silica Index
Table 6: Major oxide geochemistry and CIPW norms of samples from the boreholes at the NIASM site
Sample BH1/80 BH7/3 BH7/13 BH9/1 BH9/2 BH9/18 BH10/9 BH10/19
Rock type B, subal B, subal BA BA BA B, subal B, subal B, subal
SiO2 47.23 46.90 48.38 47.50 46.72 45.67 45.79 46.85
TiO2 2.61 2.65 2.04 2.12 1.96 2.39 2.23 2.32
Al2O3 12.20 12.19 10.65 10.74 10.10 11.85 12.43 12.50
Fe2O3 (T) 12.74 12.64 12.54 12.20 11.78 13.60 13.11 13.13
MnO 0.16 0.20 0.18 0.17 0.17 0.30 0.20 0.20
MgO 5.52 5.05 4.58 4.04 4.77 5.62 5.65 4.79
CaO 12.12 13.00 11.21 9.99 9.02 12.89 11.85 11.11
Na2O 2.89 2.78 2.52 2.41 3.04 2.50 2.54 2.76
K2O 0.40 0.22 0.48 0.48 0.66 0.15 0.22 0.29
P2O5 0.22 0.24 0.21 0.19 0.19 0.19 0.21 0.21
Total 92.54 88.13 86.24 93.79 99.92 91.99 94.23 94.16
SiO2adj 49.71 49.47 52.70 53.44 53.41 48.58 49.18 50.35
TiO2adj 2.75 2.80 2.22 2.39 2.24 2.54 2.40 2.49
Al2O3adj 12.84 12.86 11.60 12.08 11.55 12.61 13.35 13.43
Fe2O3adj 2.05 2.03 2.90 2.92 2.86 2.21 2.15 2.15
FeOadj 10.23 10.17 9.68 9.73 9.54 11.03 10.74 10.76
MnOadj 0.17 0.21 0.20 0.19 0.19 0.32 0.22 0.22
MgOadj 5.81 5.33 4.99 4.55 5.45 5.98 6.07 5.15
CaOadj 12.76 13.71 12.21 11.24 10.31 13.71 12.73 11.94
Na2Oadj 3.04 2.93 2.75 2.71 3.48 2.66 2.73 2.97
K2Oadj 0.42 0.23 0.52 0.54 0.75 0.16 0.24 0.31
P2O5adj 0.23 0.25 0.23 0.21 0.22 0.20 0.23 0.23
Q - - 5.20 7.53 3.10 - - 0.42
Or 2.49 1.37 3.09 3.19 4.46 0.95 1.40 1.84
Ab 25.74 24.81 23.23 22.95 29.41 22.50 23.08 25.10
An 20.14 21.24 17.79 19.20 13.68 21.99 23.48 22.42
Di 34.31 37.30 34.13 29.14 29.70 36.99 31.53 29.34
Hy 3.61 3.24 7.60 8.73 10.76 2.60 7.93 12.50
Ol 4.99 3.20 - - - 6.48 4.40 -
Mt 2.97 2.95 4.21 4.23 4.15 3.20 3.11 3.12
Il 5.22 5.31 4.22 4.53 4.25 4.83 4.55 4.74
Ap 0.54 0.59 0.53 0.50 0.50 0.47 0.52 0.52
Mg# 50.32 48.29 47.88 45.45 50.47 49.13 50.19 46.03
FeO(T)/MgO 2.08 2.25 2.46 2.72 2.22 2.18 2.09 2.47
Salic 48.37 47.42 49.30 52.88 50.64 45.43 47.96 49.78
Femic 36.12 34.98 34.52 32.72 36.05 36.91 37.22 35.25
CI 65.70 67.71 60.36 55.04 54.14 68.70 65.65 58.70
DI 28.23 26.18 31.52 33.67 36.96 23.45 24.48 27.36
SI 26.97 25.74 23.94 22.24 24.69 27.13 27.69 24.13
AI 1.31 1.27 1.32 1.32 1.48 1.24 1.26 1.30
WI 4316 4183 3934 3637 4084 4014 3948 3929
Table 7: Major oxide geochemistry and CIPW norms of random samples from the NIASM site
Sample RS 2 RS 6 RS 7 RS 8 RS 10 RS 11 RS 17 RS 25 RS 26 RS 35
Rock type B, subal B, subal B, subal B, subal BA B, subal B, subal B, subal B, subal BA
SiO2 45.83 45.39 42.02 45.38 48.33 42.42 45.54 49.13 45.26 48.56
TiO2 2.40 2.22 2.15 2.22 1.92 2.22 2.21 2.75 2.28 1.88
Al2O3 11.97 11.81 11.23 11.51 10.60 11.69 11.54 13.27 10.64 10.55
Fe2O3(T) 13.39 12.20 12.47 13.03 10.71 12.33 13.20 13.32 12.68 11.32
MnO 0.17 0.15 0.15 0.17 0.17 0.17 0.20 0.20 0.17 0.13
MgO 5.07 3.91 5.72 5.73 3.77 4.07 7.02 5.27 4.99 5.17
CaO 11.85 11.37 11.40 11.83 8.77 11.20 11.40 12.41 9.54 9.34
Na2O 2.41 1.88 1.77 2.24 2.05 1.69 2.13 3.11 2.50 2.20
K2O 0.19 0.20 0.21 0.22 0.64 0.26 0.32 0.17 0.71 0.51
P2O5 0.22 0.17 0.20 0.21 0.17 0.19 0.23 0.29 0.22 0.18
Total 93.50 89.30 87.32 92.54 85.13 86.24 93.79 99.92 88.99 86.84
SiO2adj 49.62 51.43 48.71 49.63 56.01 49.79 49.14 49.73 51.48 54.59
TiO2adj 2.60 2.52 2.49 2.43 2.23 2.61 2.39 2.78 2.59 2.11
Al2O3adj 12.96 13.38 13.02 12.59 12.29 13.72 12.45 13.43 12.10 11.86
Fe2O3adj 2.21 2.11 2.21 2.17 2.64 2.21 2.17 2.06 2.20 2.71
FeOadj 11.06 10.54 11.02 10.87 8.80 11.04 10.86 10.28 11.00 9.02
MnOadj 0.18 0.17 0.17 0.19 0.20 0.20 0.22 0.20 0.19 0.15
~ 1267 ~
International Journal of Chemical Studies http://www.chemijournal.com
MgOadj 5.49 4.43 6.63 6.27 4.37 4.78 7.58 5.34 5.68 5.81
CaOadj 12.83 12.88 13.22 12.94 10.16 13.15 12.30 12.56 10.85 10.50
Na2Oadj 2.61 2.13 2.05 2.45 2.38 1.98 2.30 3.15 2.84 2.47
K2Oadj 0.21 0.23 0.24 0.24 0.74 0.31 0.35 0.17 0.81 0.57
P2O5adj 0.24 0.19 0.23 0.23 0.20 0.22 0.25 0.29 0.25 0.20
Q 0.47 6.09 - 0.09 12.91 3.62 - - 1.67 9.10
Or 1.22 1.34 1.44 1.42 4.39 1.80 2.04 1.02 4.78 3.39
Ab 22.08 18.02 17.36 20.73 20.11 16.79 19.45 26.64 24.07 20.93
An 23.04 26.28 25.59 22.64 20.66 27.63 22.65 22.01 17.87 19.57
Di 32.38 30.32 31.69 33.05 23.54 30.10 30.16 31.73 28.43 25.59
Hy 12.12 9.68 15.28 13.77 9.89 11.40 14.14 7.17 14.50 13.01
Ol - - 0.17 - - - 3.32 2.49 - -
Mt 3.21 3.06 3.20 3.15 3.82 3.20 3.15 2.98 3.19 3.92
Il 4.94 4.78 4.73 4.61 4.23 4.95 4.53 5.29 4.93 4.02
Ap 0.55 0.45 0.54 0.53 0.46 0.52 0.57 0.68 0.58 0.47
Mg# 46.95 42.83 51.74 50.69 46.96 43.55 55.42 48.05 47.91 53.47
FeO(T)/MgO 2.38 2.81 1.96 2.05 2.56 2.73 1.69 2.27 2.29 1.97
Salic 46.81 51.73 44.39 44.88 58.06 49.84 44.13 49.67 48.38 52.99
Femic 37.08 32.03 41.26 39.80 30.64 34.14 43.14 35.07 37.65 36.29
CI 63.42 60.61 69.93 67.04 51.55 62.70 68.86 62.75 55.32 57.82
DI 23.76 25.45 18.80 22.24 37.40 22.21 21.48 27.65 30.51 33.42
SI 25.45 22.80 29.93 28.49 23.09 23.52 32.58 25.41 25.20 28.24
AI 1.25 1.20 1.19 1.24 1.32 1.19 1.24 1.29 1.38 1.32
WI 3785 3293 3444 3783 3355 3226 3882 4272 3914 3574
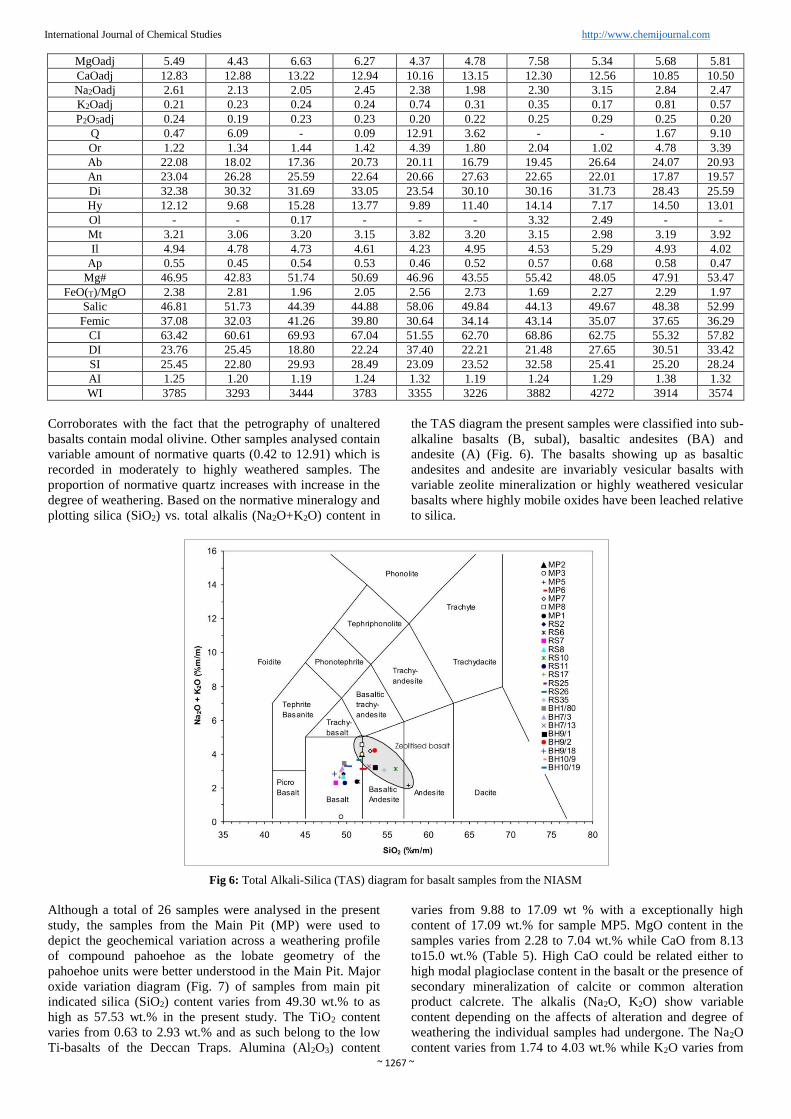
Corroborates with the fact that the petrography of unaltered
basalts contain modal olivine. Other samples analysed contain
variable amount of normative quarts (0.42 to 12.91) which is
recorded in moderately to highly weathered samples. The
proportion of normative quartz increases with increase in the
degree of weathering. Based on the normative mineralogy and
plotting silica (SiO2) vs. total alkalis (Na2O+K2O) content in
the TAS diagram the present samples were classified into sub-
alkaline basalts (B, subal), basaltic andesites (BA) and
andesite (A) (Fig. 6). The basalts showing up as basaltic
andesites and andesite are invariably vesicular basalts with
variable zeolite mineralization or highly weathered vesicular
basalts where highly mobile oxides have been leached relative
to silica.
Fig 6: Total Alkali-Silica (TAS) diagram for basalt samples from the NIASM
Although a total of 26 samples were analysed in the present
study, the samples from the Main Pit (MP) were used to
depict the geochemical variation across a weathering profile
of compound pahoehoe as the lobate geometry of the
pahoehoe units were better understood in the Main Pit. Major
oxide variation diagram (Fig. 7) of samples from main pit
indicated silica (SiO2) content varies from 49.30 wt.% to as
high as 57.53 wt.% in the present study. The TiO2 content
varies from 0.63 to 2.93 wt.% and as such belong to the low
Ti-basalts of the Deccan Traps. Alumina (Al2O3) content
varies from 9.88 to 17.09 wt % with a exceptionally high
content of 17.09 wt.% for sample MP5. MgO content in the
samples varies from 2.28 to 7.04 wt.% while CaO from 8.13
to15.0 wt.% (Table 5). High CaO could be related either to
high modal plagioclase content in the basalt or the presence of
secondary mineralization of calcite or common alteration
product calcrete. The alkalis (Na2O, K2O) show variable
content depending on the affects of alteration and degree of
weathering the individual samples had undergone. The Na2O
content varies from 1.74 to 4.03 wt.% while K2O varies from

~ 1268 ~
International Journal of Chemical Studies http://www.chemijournal.com
0.04 to 0.33 wt.%. The Mg# of the subalkaline basalt varies
from 38.07 to 55.42 and indicates moderately evolved
magmas. Higher Mg# (53.75 to 63.88) is recorded in the
basaltic andesites and andesite sample which reflect a pseudo
increase due to secondary mineralization or relative
enrichment in the samples analysed (Table 5 & Fig. 7). The
normative mineralogy was used to calculate Colour Index
(CI) of the samples that varies from 54.14 to 71.05 and the
Alkalinity Index (AI) from 1.01 to 1.71.
Fig 7: Major oxide variation diagram with depth in main pit samples from the NIASM site. #Mg in countsn
Figure 7 indicates an anomalous concentration of different
major oxides at 50 cm and 70 cm depth due to presence of the
thin clay horizons related to weathering of glassy rind of a
single 20 cm thick pahoehoe toe. There is a perceptible
increase in the alumina and magnesia contents at the upper
interface of the toe (at 50 cm) while there is a perceptible
decline in the TiO2 and FeO at the same interface. Similar
oxide pattern is also pronounced at the lower interface at 70
cm. From the major oxide variation diagram it is clear that
oxides such as silica and alumina which are relatively
immobile during weathering and leaching tend to accumulate
towards the upper parts of the weathering horizons. In
contrast the oxide such as TiO2 and FeO tend to be mobile in
an oxidizing environment and get leached towards the lower
parts of the weathering profile. The unique lobate geometry of
the lava flow however does not weather uniformly as
individual lobes and their sub-units tend to weather
independently, especially in the initial stages of weathering.
This result in a rather jagged oxide variation diagram which is
predominantly a function of the lobe geometry and the
porosity and permeability of the lobe sub-units. This is
reflected in the Main Pit at the NIASM site where three
distinct lobes are exposed. The oxide variations can be better
explained by taking the examples of the relatively mobile
elements like titania and iron. The upper lobe is partially
exposed at the Main Pit of the NIASM site and is exposed to
the hydrometerological elements that break down mineral
constituents like plagioclase, augite, olivine and glass to
release iron and titania. Being mobile these tend to get
leached and move downwards. At 50 cm of the profile, the
glassy upper rind tends to be unstable in the weathering
regime and has weathered to a great extent there by rendering
a rapid decline in the oxide values (Fig. 7). Similar type of
situation exists at the 70 cm mark where the lower glassy rind
occurs. The intermittent sample at 65 cm represents the
vesicular core of the lava toe that has nearly the original oxide
content due to relatively less weathering thereby giving a
pseudo positive anomaly in the profile. Lobe 3 in the Main Pit
occurs below 70 cm and is exposed incompletely until 2.30 m
BGL. In this lobe a reversal of the weathering pattern is seen
where in the degree of weathering is highest at 70 cm (at the
red bole glassy horizon) up to 2.31 m where the original
unweathered basalt is exposed. The steady increase in the
oxide percentage from the weathered glassy rind to the host
rock is also reflected in the major oxide pattern of this lobe.
Also one can notice the difference in the nature of weathering
in the upper and lower lobe. Hence, in weathering regimes of
the compound pahoehoe the lobe geometry will dictate the
weathering pattern which is in stark contrast to the weathering

~ 1269 ~
International Journal of Chemical Studies http://www.chemijournal.com
pattern seen in the simple flows or conventional soil profiles
in basalts.
4.3 Geochemical variability in trace element content and
their role in the abiotic stresses The analytical results of trace element analyses are presented
in Tables 8 to 10 and variation diagram representative to main
pit are shown in Fig. 8. There is a general variability in the
trace element content of the samples analysed and this is a
reflection of host basalt geochemistry and its weathering
products. The biogeochemistry of the significant trace
elements is discussed here so as to give a brief account of its
role in the abiotic stress at NIASM site, Malegaon.
Table 8: Trace element concentrations (ppm) of samples from main pit of NIASM site
Sample MP1 MP2 MP3 MP4 MP5 MP6 MP7 MP8
Rock type B, subal B, subal B, subal B, subal A B, subal BA B, subal
V 319 279 122 353 100 298 322 343
Cr 247 194 15.8 233 16.8 241 228 288
Co 47.2 30.4 19.6 41.2 23.3 29.7 30.7 58.1
Ni 114 96.9 144 105 227 105 97.1 125
Cu 172 145 441 247 577 128 145 142
Zn 90.4 90.5 47.3 92.7 63.1 97.4 76.5 104.5
Ga 19 10.1 43.5 9.1 30.6 16.6 16.5 20.6
Rb 15.9 13.1 4 6.2 23.1 17.5 22.3 24.9
Sr 374 541 77.9 280 1456 705 400 218
Y 25.2 25.3 6.6 34.3 4.4 26.5 30.5 39.9
Zr 119 123 58.9 142 72.4 127 121 160
Nb 8.0 7.0 8.5 8.8 5.6 5.8 5.5 10.4
Mo 6.2 4.3 2.6 5.5 1 4.0 4.0 6.0
Sn 14.2 16.7 13.1 15.9 12.7 12.5 14.8 12.6
Ba 241 420 51.0 118 360 134.2 191 103
Pb 3.4 1.9 4.1 1.0 5.2 2.7 2.5 5.0
Table 9: Trace element concentrations (ppm) of samples from the boreholes at the NIASM site
Sample BH1/80 BH7/3 BH7/13 BH9/1 BH9/2 BH9/18 BH10/9 BH10/19
Rock type B, subal B, subal BA BA BA B, subal B, subal B, subal
V 464 416 317 312 315 378 363 386
Cr 203 213 256 179 187 221 234 185
Co 35.6 41.2 36.9 42.8 26.3 41.0 34.1 32.6
Ni 96.7 103.7 114.9 86.0 86.7 113.9 113.9 88.0
Cu 182 198 201 158 171 184 119 190
Zn 98.3 99.2 91.8 98.4 92.0 102.1 100.2 98.5
Ga 17.6 27.8 14.3 18.5 21.9 18.5 18.8 17.2
Rb 9.6 3.3 16.3 14.7 27.4 5.1 9.5 11.1
Sr 230 228 350 561 306 204 218 276
Y 32.3 31.3 27.9 25.6 26.7 28.9 27.5 27.5
Zr 149 149 125 132 127 135 132 140
Nb 8.0 8.5 6.5 7.0 6.8 8.3 7.0 6.9
Mo 5.5 4.9 4.8 3.8 3.8 5.2 5.0 5.4
Sn 14.7 11.0 12.4 11.4 12.4 16.5 8.6 16.7
Ba 70.3 79.5 171 214 133 86.7 64.3 103
Pb 2.7 2.8 2.0 1.0 2.9 2.1 2.2 2.5
Table 10: Trace element concentrations (ppm) of random samples from the NIASM site
Sample RS2 RS6 RS7 RS8 RS10 RS11 RS17 RS25 RS26 RS35
Rock type B, subal B, subal B, subal B, subal BA B, subal B, subal B, subal B, subal BA
V 364 329 342 344 275 352 370 467 335 274
Cr 196 203 214 264 163 181 307 216 218 223
Co 31.3 35.7 35.9 41.5 14.2 28.4 45 31.4 44.1 35.5
Ni 94.1 77.1 120 113 77.4 77.9 146 100 94.2 104
Cu 192 175 165 162 132 170 153 181 181 167
Zn 105 91.0 92.9 107 84.7 94.5 102 104 106 86.2
Ga 22.4 20.4 21.7 22.7 14.6 20.0 22.2 24.3 19 18.5
Rb 5.4 8.1 9.9 12.4 28.1 15.2 19.3 2.2 35 19
Sr 251 319 172 191 383 187 192 234 551 169
Y 28 24.3 26 27.2 20.9 27.2 25.4 31.8 27.5 20.7
Zr 138 135 129 134 118 132 127 157 128 114
Nb 8.2 6.6 7.2 7.1 8.2 6.2 6.8 10.9 6.6 7.0
Mo 7.0 7.1 6.7 6.3 5.5 5.2 8.5 5.6 7.4 6.9
Sn 14.1 17 15.9 17.3 11.5 19 15.6 18.2 10.2 16.8
Ba 73.7 76.7 35 57.8 153 36.5 42.1 85.1 152 95.5
Pb 1.0 2.1 2.8 2.4 2.5 2.6 2.2 1.6 1.9 2.2
~ 1270 ~
International Journal of Chemical Studies http://www.chemijournal.com
Vanadium (V) content in the samples analysed varies from
100 to 464 ppm and as such is within the normal range in the
weathering profiles of Deccan Traps. The vanadium bearing
blue zeolite - cavensite and phillipsite are common to basalt
cavities in and around Pune. Vanadium enters the food chain
through soil, vegetation and herbivorous animals. The cycle
of vanadium initiates with the weathering of the basalt under a
relatively high redox potential. It is generally adsorbed on to
clays and is released into the hydrosphere only by humic
solutions. Highly alkaline surface waters and groundwater
with calcite in the oxidizing weathering profile could
precipitate small quantities of Pb, Cu, Zn or U vanadates. The
presence of vanadium in the weathering mantle of the NIASM
site indicates that the flora (crops, fodder) and fauna (poultry,
cattle) to be raised on the experimental plots may not be
stressed due to vanadium deficiency. Cobalt (Co) and nickel
(Ni) are widely distributed in the biosphere and in the present
study their concentrations varies from 14 to 58 ppm and 77 to
146 ppm respectively. In basalts, the Co and Ni behave
similarly and generally reside in minerals such as olivine and
augite which are main constituents of basalts. In the
weathering profile, Co remains in solution as bicarbonate, in
contrast, Ni tends to accumulate in the insoluble weathering
residue. Deficiency of Cobalt in soils and subsequently in
cattle fodder is the established cause of ‘bush sicknesses in
grazing animals (Rankama and Sahama, 1949) [25]. The
presence of Co and Ni in the above range in the weathering
regime at NIASM site indicates that these elements may not
cause significant abiotic stress. Copper is biophile and is
considered an essential micro-nutrient to plants and its small
quantities stimulate plant growth but higher concentrations
are known to be toxic in nature (Rankama and Sahama, 1949)
[25]. Its presence in the weathering profile in a range of 128-
577ppm at the NIASM site is encouraging.
Zinc (Zn) is relatively abundant in basalts and during
weathering it readily converts to sulphates and chlorides that
dissolve in water. It is an essential element and in low
concentrations Zn stimulates healthy growth in plants and
animals. However, like Cu, it is toxic in high concentrations.
In the samples analysed, Zn concentrations varies from 47 to
107 ppm indicating that the crops cultivated on the NIASM
soils would not face zinc deficiency and stresses due to Zn.
Molybdenum (Mo) bearing minerals commonly form small
quantities of hydrated oxides like molybdnite (MoO3 or
FeO/3MoO3.8H2O) in the soil profile. However, high Ca in
weathering profiles or groundwater could precipitate Mo in
calcretes or carbonates. In the samples analysed Mo varies
from 1 to 8.5 ppm and it was observed that the subalkaline
basalts have higher Mo concentrations as compared to the
basaltic andesite samples.
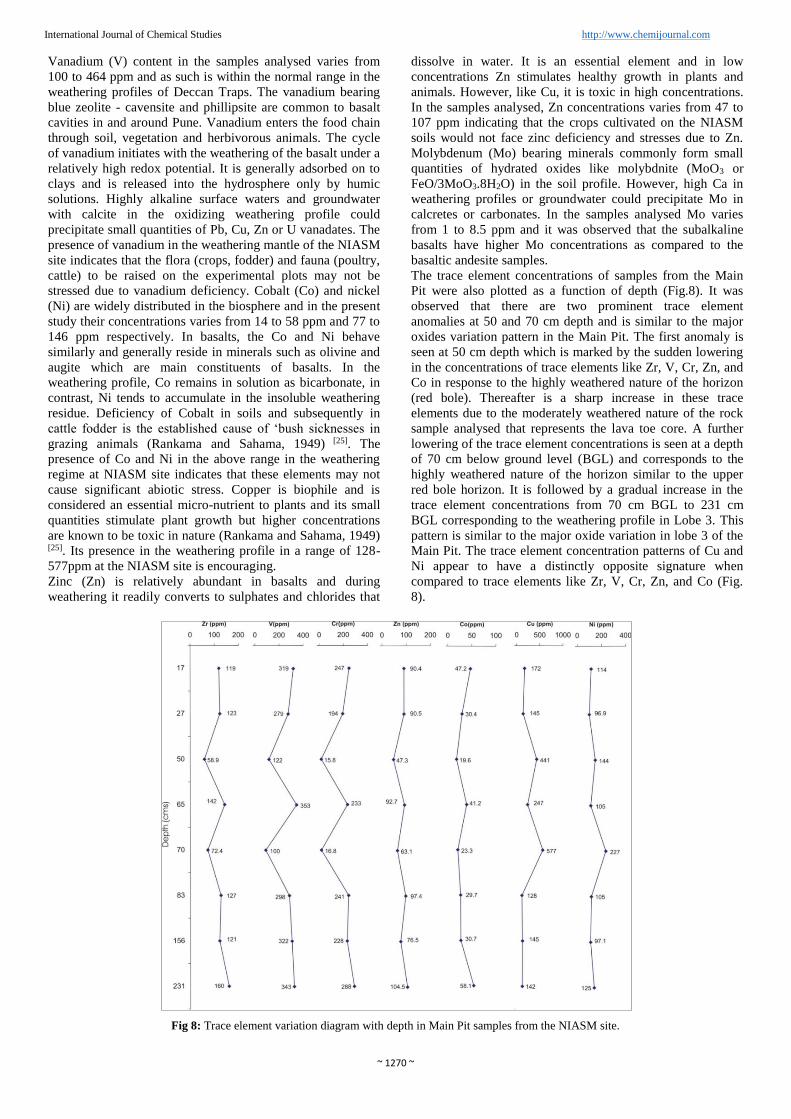
The trace element concentrations of samples from the Main
Pit were also plotted as a function of depth (Fig.8). It was
observed that there are two prominent trace element
anomalies at 50 and 70 cm depth and is similar to the major
oxides variation pattern in the Main Pit. The first anomaly is
seen at 50 cm depth which is marked by the sudden lowering
in the concentrations of trace elements like Zr, V, Cr, Zn, and
Co in response to the highly weathered nature of the horizon
(red bole). Thereafter is a sharp increase in these trace
elements due to the moderately weathered nature of the rock
sample analysed that represents the lava toe core. A further
lowering of the trace element concentrations is seen at a depth
of 70 cm below ground level (BGL) and corresponds to the
highly weathered nature of the horizon similar to the upper
red bole horizon. It is followed by a gradual increase in the
trace element concentrations from 70 cm BGL to 231 cm
BGL corresponding to the weathering profile in Lobe 3. This
pattern is similar to the major oxide variation in lobe 3 of the
Main Pit. The trace element concentration patterns of Cu and
Ni appear to have a distinctly opposite signature when
compared to trace elements like Zr, V, Cr, Zn, and Co (Fig.
8).
Fig 8: Trace element variation diagram with depth in Main Pit samples from the NIASM site.

~ 1271 ~
International Journal of Chemical Studies http://www.chemijournal.com
Fig 8 Contd.: Trace element variation diagram with depth in Main
Pit samples from the NIASM site.
There are significantly higher concentrations of these
elements at depths of 50 cm BGL and 70 cm BGL where the
weathering regime in the form of red bole is present. Such
anomalous accumulations could suggest that the clays provide
suitable suites for their adsorption or that considerable
enrichment of these elements takes place due to deposition of
soluble salts in an oxidizing environment. There is a wide
variation in the trace element patterns of elements such as Ba,
Sr and Rb (Fig. 8). They are invariably higher concentration
in the upper and lower parts of the Main Pit at NIASM site.
This could be the effect either due to the fact that the initial
concentrations of these elements may vary in the 3 lava lobes
exposed in the Main Pit due to modal variations in the
plagioclase content which primarily hosts these trace elements
or due to the variable mobility of these elements in response
to differential weathering across the Main Pit profile. There is
a significant decrease in the concentrations of these element at
50 cm BGL and may be related to the highly weathered nature
of the horizon. Since these elements are highly mobile during
weathering they leached out from upper horizons under the
influence of percolating water during monsoon. The increase
of Ba, Sr and Rb at 70 cm BGL could indicate precipitation of
these elements at the upper contact of Lobe 3.
5. Conclusions Study indicated the geochemical variability of major oxide
and trace elements are governed by the geological variability
in different lava lobe and lava toe geometry of compound
pahoehoe as well the degree of weathering. The
crystallization of zeolites and other secondary minerals could
also influence the trace element distribution in the weathering
regime which is apparent due to presence of two anomalies at
50 and 70cm depth.
6. Acknowledgements Authors are thankful to the Director, National Institute of
Abiotic Stress Management, Malegaon, Baramati for
providing financial assistance and to the Head, Department of
Geology, University of Pune for providing laboratory
facilities during the entire course of study. Authors are also
thankful to the Er. Pravin More NIASM, Baramati for his
technical assistance during the course of prepartion of this
manuscriopt.
7. References 1. Aubele JC, Crumpler LS, Elston WE. Vesicle zonation
and vertical structure of basalt flows. Jour. Volcanol.
Geotherm. Res. 1988; 35:349-374.
2. Beane JE, Turner CA, Hooper PR, Subbarao KV, Walsh
JN. Stratigraphy, composition and form of the Deccan
basalts, Western Ghats, India. Bull. Volcanol. 1986;
48:61-83.
3. Bondre NR, Duraiswami RA, Dole G. Morphology and
emplacement of flows from the Deccan Volcanic
Province, India. Bull. Volcanol. 2004; 66:29-45.
4. Duraiswami RA. Pulsed inflation in the hummocky lava
flow near Morgaon, Western Deccan Volcanic Province
and its significance. Curr. Sci. 2009; 97:313-316.
5. Duraiswami RA, Bondre NR, Managave S. Morphology
of rubbly pahoehoe (Simple) flows from the Deccan
Volcanic Province: implications for style of
emplacement. Jour. Volcanol. Geotherm. Res. 2008a;
177:822-836.
6. Duraiswami RA, Krishnamurthy V, Mitra D, Joshi VB.
Modeling salinity in the Karha River Basin: a Remote
Sensing and GIS approach. Jr. App. Hydro. 2008b;
20:37-50.
7. Eggleton RE, Foudoulis C, Varkevisser. Weathering of
basalt: changes in rock chemistry and mineralogy. Clays
and Clay Minerals. 1987; 35:161-169.
8. Geological Survey of India. Quadrangle Geological Map
of Baramati Quadrangle. Government of India Press,
1998.
9. Ghodke SS, Powar KB, Kanegoankar NB. Trace
elements distribution in Deccan Trap flows in Dive Ghat
area, Pune district, Maharashtra. Proc. Symp. Deccan
Traps and Bauxites, Geological Survey of India. Spl.
Publ. 1984; 14:55-62.
10. Godbole SM, Rana RS, Natu SR. Lava stratigraphy of
Deccan basalts of western Maharashtra. Gondwana Geol.
Mag. Spl. Publ. 1996; 2:125-134.
11. Kale MG, Dasgupta S. Petrography of Quaternary
sediments of Morgaon area, Pune District, Maharashtra,
India. Gond. Geol. Mag. 2009; 24:1-10.
12. Kale VS, Patil DN, Pawar NJ, Rajaguru SN. Discovery of
volcanic ash bed in the alluvial sediments at Morgaon,
Maharashtra. Man and Envi. 1993; 18:141-143.
13. Kale VS, Rajaguru SN. Late Quaternary alluvial history
of the northwestern Deccan Upland Region. Nature.
1987; 325:612-614.
14. Kanegaonkar NB, Powar KB. Genesis of Plagioclase
megacrysts in porphyritic basalts of Purandhar hills,
Western Maharashtra. Recent Res. Geol., Hindustan
Publ. Corp, Delhi. 1978; 4:313-332.
15. Khadri SRF, Subbarao KV, Walsh JN. Stratigraphy, form
and structure of the east Pune basalts, Western Deccan
Basalt Province, India. Geol. Soc. Ind. Mem. 1999;
43:172-202.

~ 1272 ~
International Journal of Chemical Studies http://www.chemijournal.com
16. Korisettar R, Venkatesan TR, Mishra S, Rajaguru SN,
Somayajulu BLK, Tandon SK, et al. Discovery of tephra
bed in the Quaternary alluvial sediments of Pune district
(Maharashtra), Peninsular India. Curr. Sci. 1989; 58:564-
567.
17. Makki MF. Collecting cavansite in the Wagholi quarry
complex, Pune, Maharashtra, India. The Mineralogical
Record. 2005; 36:507-512.
18. Maurya UK, Vittal KPR. Geology of the NIAM Site,
Malegaon. NIAM Technical Bulletin - 1, National
Institute of Abiotic Stress Management (ICAR),
Baramati, 2010.
19. Maurya UK, Vittal KPR. Identification of Abiotic
Edaphic Stressors of Deccan Trap at NIASM Site,
Malegaon: A Geotechnical & Geological Study. NIASM
Technical Bulletin-2. National Institute of Abiotic Stress
Management (ICAR), Baramati, 2011.
20. Maurya UK, Vittal KPR, Ghadge SV. Formation of
zeolites in development of edaphic stressors on Vertic
Toposequence. NIASM Technical Bulletin-3. National
Institute of Abiotic Stress Management (ICAR),
Baramati, 2012.
21. Middlemost. A chemical classification of volcanic rocks
based on the total alkali-silica diagram. Jour. Petrol.
1989; 27:745-750.
22. Paranjpe SC. Climatic classification of the Maharashtra
State based on methods proposed by Thornwaite. In: An
integrated approach for strengthening and protecting
drinking water sources, GSDA Seminar Volume, 2001,
489-498.
23. Price J, Velbel MA. Chemical weathering indices applied
to weathering profiles developed on heterogeneous felsic
metamorphic parent rocks. Chem. Geol. 2003; 202:397-
416.
24. Rajguru SN, Kale VS, Badam GL. Quaternary fluvial
systems in upland Maharahstra. Curr. Sci. 1993; 64:817-
822.
25. Rankama K, Sahama Th. G. Geochemistry. The
University of Chicago Press, Chicago, 1949.
26. Verma SP, Torres-Alvarado IS, Sotelo-Rodríguez ZT.
SINCLAS: standard Igneous norm and volcanic rock
classification system. Computers & Geosciences. 2002;
28:711-715.
27. Wilmoth RA, Walker GPL. P-type and S-type pahoehoe:
a study of vesicle distribution patterns in Hawaiian lava
flows. Jour. Volcanol Geotherm Res. 1993; 55:129-142.