geochemistry of geothermal fluids rico, colorado of geothermal fluids rico, colorado megan smith...
TRANSCRIPT

1
Final Report
Geochemistry of Geothermal Fluids
Rico, Colorado
Megan SmithTerry BisiarTeuku Putra
Van Blackwood

2
Table of Contents Page
1.0 Introduction 3-51.1 Primary Geothermal Fluids - This section was adapted from (Arnosson, Steffansson,Bjarnasson,2007)
1.1.1 Chemical composition of primary fluids1.1.2 Na-Cl waters1.1.3 Acid-sulfate waters1.1.4 High salinity waters
1.2 Secondary Fluids1.2.1 Steam-heated acid sulfate waters1.2.2 Carbon-dioxide waters1.2.3 Mixed waters
2.0 ISOTOPE AND FLUID INCLUSION STUDIES IN RICO, COLORADO 5-112.1 Introduction2.2 Study results
2.2.1 Oxygen isotopes ratios2.2.2 Hydrogen isotopes ratios2.2.3 Origin of the hydrothermal fluids2.2.4 Stable isotope composition of the quartz molybdenite fluid2.2.5 Stable isotope composition of the epithermal fluids
2.3 Conclusions3.0 GEOTHERMOMETRY 11-20
3.1 Physical and geological description of springs3.2 Major element composition3.3 Trace element geochemistry3.4 Geothermometry background
3.4.1 Na-K geothermometer3.4.2 Na-K-Ca geothermometer3.4.3 Silica geothermometers and Mixing Models3.4.4 Lithium-based geothermometers3.4.5 Gas geothermometers
3.5 Geothermometers Applied at Rico, CO3.5.1 Dunton Hot Springs3.5.2 Geyser Warm Spring3.5.3 Paradise Spring3.5.4 Rico core-drill holes
3.6 Magnesium Correction to Na-K-Ca derived temperatures3.7 Conclusions from CGS geothermometer calculations
4.0 References 21-22

3
1.0 INTRODUCTION
The purpose of this paper is to describe the importance of geochemistry with respect to geothermalreservoir characterization. We will briefly describe how geochemistry is used for reservoir characterizationand in more detail discuss geothermometer and isotope data for the geothermal reservoir at Rico Colorado.
Broadly speaking, geochemical fingerprinting is a rapidly expanding discipline in the earth and environmental sciences. It is anchored in the recognition that geological processes leave behind chemicaland isotopic patterns in the rock record. Many of these patterns, informally referred to as geochemicalfingerprints, differ only in fine detail from each other. For this reason, the approach of fingerprinting requires analytical data of very high precision and accuracy.
Geochemical fingerprinting occurred alongside progress in geochemical analysis techniques. The advancement of in situ analytical techniques is also identified as a major factor that has enabled geochemical fingerprinting to expand into a larger variety of fields (Kamber, 2009).
Geothermal geochemistry research is used to identify the origin of geothermal fluids and to quantify theprocesses that govern their compositions and the associated chemical and mineralogical transformations ofthe rocks with which the fluids interact. The variation in the chemistry of geothermal fluids provideinformation regarding the origins, mixing and flow regimes of the systems. The subject has a strong appliedcomponent: Geothermal chemistry constitutes an important tool for the exploration of geothermal resourcesand in assessing the production characteristics of drilled geothermal reservoirs and their response toproduction. Geothermal fluids are also of interest as analogues to ore-forming fluids. Understandingchemical processes within active geothermal systems has been advanced by thermodynamic and kineticexperiments and numerical modeling of fluid flow. Deep drillings for geothermal energy have providedimportant information on sources and composition of geothermal fluids, their reaction with rock-formingminerals, migration of the fluids, and fluid phase separation and fluid mixing processes (Arnosson,Steffansson, Bjarnasson, 2007).
According to DiPippo, the geochemist has several responsibilities with respect to geothermal reservoircharacterization. Namely, identifying whether the resource is vapor- or liquid dominated, estimating theminimum temperature of the geofluid, determine the chemical properties of the fluid both in reservoir andin the produced state, and characterize the recharge water, including its nature and resources. Geothermalfluids are broken down into primary and secondary fluids.
1.1 Primary geothermal fluids - This section was adapted from (Arnosson, Steffansson, Bjarnasson,2007)
Primary geothermal fluids are fluids located at the bottom of a convection cell. They may be a mixture oftwo or more fluid components such as meteoric and seawater and magmatic volatiles. The main types ofprimary fluids are Na-Cl waters, acid-sulfate waters and high salinity brines. When primary fluids risetowards the surface, they can undergo fluid phase separation and fluid mixing to form secondarygeothermal fluids. The most important processes that lead to the formation of secondary geothermal fluidsare:
1) Depressurization boiling to yield boiled water and a steam phase with gas.2) Phase separation of saline fluids into a hypersaline brine and a more dilute vapor.3) Vapor condensation in shallow ground water or surface water to produce acid-sulfate,carbon-dioxide or sodium bicarbonate waters.4) Mixing of CO2 gas from a deep source with thermal ground water.5) Mixing of geothermal fluids with shallower and cooler ground water.
1.1.1 Chemical composition of primary fluidsThe chemical composition of primary geothermal fluids is determined by the composition of the source fluidsand reactions involving both dissolution of primary rock-forming minerals and deposition of secondary minerals,as well as by adsorption and desorption processes. The source fl uids are usually meteoric water or seawater or a

4
mixture thereof. Components of connate, magmatic and metamorphic fluids may also be present in geothermalfluids.
1.1.2 Na-Cl waters.The dissolved salt in Na-Cl waters is mainly NaCl. This type of water is the most common in geothermalsystems. Chloride concentrations typically range from only a few hundred to a few thousand ppm. They arelowest in waters hosted in basaltic rocks but highest in fluids which have interacted with sedimentary rockscontaining evaporites. The salinity of geothermal fluids is determined by the availability of solublesalts. These salts may be leached from the aquifer rock or added to the geothermal fluid by deepmagmatic fluids. Alternatively, saline fluids may form through reactions between magmatic HCl and rock-forming minerals.
The concentrations of most major elements in Na-Cl waters are fixed by close approachto local equilibrium with secondary minerals if temperatures are above ~100 to 150°C. The only conservativemajor component in these waters is Cl. The mineral-solution equilibria constrain ion activity ratios and theactivities of neutral aqueous species other than Cl-bearing species, including reactivegases like CO2, H2S and H2,which may be largely of magmatic origin. Some systems closelyapproach redox equilibrium while others significantly depart from it.
The concentrations of many trace elements (e.g., Ag, Fe, Cu, Pb, Zn) in Na-Cl geothermalwaters are clearly controlled by sulfide mineral deposition. These elements typically form cations in solution.Trace elements that form large simple anions or oxy-anions in solution may have high mobility and even showincompatible behavior (Br, I, As, Mo, W).
1.1.3 Acid-sulfate waters.Deep acid-sulfate fluids have been encountered in many volcanic geothermal systems, particularly in associationwith andesitic volcanoes. Acidity is caused by HCl or HSO4 or both, and evidence indicates that it mostly formsby transfer of HCl and SO2 from the magmatic heat source to the circulating fluid.
When measured at 25 °C, the pH of flashed acid-sulfate water collected at the wellheadmay be as low as 2. The pH of the water is near neutral at the high temperature in the aquifer,however. Production of acidity upon cooling is related to the increased acid strength of HSO4 with decreasingtemperature. The most important difference between the Na-Cl and acid-sulfate waters is that the main pH-buffer of the former is CO2/HCO3, but HSO4/SO4 in the latter. Compared to Na-Cl waters, acid SO4-Cl waterscontain higher concentrations of SO4 and some minor elements, such as Fe and Mg, which are contained inminerals with pH-dependent solubility.
Elevated Cl concentrations (up to 120 ppm by weight) have been measured in superheated vapor. The Cl in thevapor is transported as HCl. A high Cl concentration in the vapor is due to evaporation of brine. The Clconcentration of the vapor affected by the pH of the brine and the temperature of separation of vapor and brine.
1.1.4 High salinity watersGeothermal brines can form in several ways. Brine-forming processes include dissolution of evaporites by waterof meteoric origin and reaction between some primary minerals of volcanic rocks and magmatic HCl. Connatehot water brines have been encountered in sedimentary basins (White 1965). Brines may form by fluid phaseseparation through cooling and depressurization of moderately saline geothermal fluids in which case they aresecondary.
Many metals (Ag, Au, Cu, Mo, Pb, Sn, W, Zn) form complexes with Cl−, HS− and OH− atmagmatic temperatures that partition into the magmatic fluid during crystallization. As this fluid escapes fromthe melt into the country rock, these metals together with magmatic gases are transported into the geothermalfluid. Mixing of the magmatic and geothermal fluids and their subsequent interaction with rock-forming mineralsleads to brine formation, if the magma is rich in HCl. Cooling and transformation ofmagmatic SO2 into H2S leads to precipitation of metallic sulfides. Porphyry ore-deposits are considered to formin this way.

5
1.2 Secondary fluids
1.2.1 Steam-heated acid sulfate waters.In many high-temperature geothermal fi elds, surface manifestations consist mostly of steam vents (fumaroles),steam-heated surface water and hot intensely altered ground (Fig. 6). Condensation of H2S-bearing steam by heatloss or mixing with surface water and oxidation of the H2S leads to the formation of native sulfur, thiosulfate,various polysulfides and ultimately sulfate. Steam-heated acid-sulfate waters are characterized by low Cl andrelatively high sulfate concentrations. It is not uncommon that the pH is <1. At low pH, these waters oftencontain many metals (e.g., Al, Fe, Mn, Cr) in high concentrations. The acid water effectively dissolves theprimary minerals of common volcanic rocks leaving a residue rich in amorphous silica, anatase, native sulfur,sulfides, aluminous sulfates and smectite or kaolinite.
1.2.2 Carbon-dioxide waters.Thermal and non-thermal waters rich in carbonate carbon are widespread on a global scale. They are particularlycommon in areas of volcanic activity, but are also found in seismically active zones devoid of volcanic activity.Further, CO2-waters occur at the boundaries of volcanic geothermal systems and around active volcanoes.Carbon-dioxide emissions from active geothermal systems and active volcanoes are largely diffuse and notconfined to fumarole and hot spring emissions. Some CO2-waters form by mixing of mantle-derived, magmaticor metamorphic CO2 with ground or surface waters. In volcanic geothermal systems, CO2-waters may form bycondensation of CO2-containing vapor in perched aquifers or by mixing of downward percolating CO2-richcondensate with the deep primary geothermal fluid. Finally, CO2-waters may form by mixing of high-temperature geothermal fluid that has not undergone fluid phase separation with cool ground water.
Deuterium (δ2H) and oxygen-18 (δ18O) data indicate that the CO2-waters are meteoric by origin. Tritium analysessuggest, at least in some instances, short residence times. The content of 14C is low due to extensive dilution by14C-dead carbon from the deep source. CO2-waters are often considerably mineralized (Table 2) because the CO2
makes the water quite reactive by maintaining relatively low pH, thus increasing the rate of dissolution of manycommon primary rock-forming minerals by enhancing their degree of undersaturation. The low pH may alsoreduce adsorption of many trace metal cations onto iron-hydroxide or other minerals and in this way increase themobility of these cations.
1.2.4 Mixed waters.In up-flow zones of geothermal systems ascending boiled or unboiled water may mix with shallow ground water.Alternatively, the thermal fluid that mixes with the cooler ground water may be two-phase (liquid and vapor).Mixed geothermal waters have been studied with the aim of assessing the temperature of the hot watercomponent in the mixed water, largely for geothermal exploration purposes.
Variably diluted (mixed) geothermal fluids in a particular field can be identified by a negative correlationbetween temperature and flow rates of springs. A positive correlation between the concentrations of conservativechemical and isotopic components is also typical of mixed waters. Mixing affects the state of equilibriumbetween the fluid phase and both primary and hydrothermal minerals and leads to changes in the initialconcentrations of reactive components in the mixed water, particularly if the hot fluid component is un-boiledwater or two-phase fluid. These changes typically involve an increase in Ca and Mg concentrations and adecrease of Na/K ratios.
The remainder of this paper details the use of geothermometry and isotopic analysis of geothermal fluidslocated at Rico, Colorado
2.0 ISOTOPE AND FLUID INCLUSION STUDIES IN RICO, COLORADO
2.1 IntroductionThe Rico mining district, western San Juan Mountains, Colorado contains epithermal vein deposits,carbonate replacement deposits, and a large zone of porphyry-style molybdenum mineralization.Historically, the vein and replacement deposits have produced significant amounts of silver, lead, and zinc,with minor gold and copper. All the mineralization formed nearly contemporaneously about 5 m.y. ago.

6
The veins and replacement deposits occur in Paleozoic and Mesozoic sedimentary rocks that have beenuplifted into the Rico dome, which is cored by a horst of Precambrian green stone and quartzite. Theporphyry molybdenum mineralization (40 million tons of 0.31% Mo) is 1,500 m beneath the surface in theeast end of the district and consists of stock work veining in Precambrian quartzite and greenstone and inPennsylvanian sedimentary rocks. The epithermal veins occur above and peripheral to the porphyrymineralization. Widespread high silica, alaskite porphyry dikes were also emplaced at the same time as theporphyry mineralization and are probably related to the source intrusion for the molybdenummineralization and the heat source for the hydrothermal system that produced the epithermal andreplacement deposits.
2.2 Study results
Figure 1.
Figure 1 is a cross section of a sample from Newman Hill showing paragenetic relations among the threezones. Histograms of quartz fluid inclusion homogenization temperatures (Th) and ice melting pointmeasurements (Tm) are also shown for each of the three zones.
Figure 2.

7
The figure 2 above is a histogram showing all homogenization measurements for fluid inclusions fromquartz-molybdenite veinlets. Primary inclusions homogenize to either a liquid or a vapor in thetemperatures ranging between 350°C to 420°C. Boiling occurred during deposition in this temperaturerange.
2.2.1 Oxygen isotopes ratiosThe figure 3 is a histogram of all ∂18O analyses with respect to vein and veinlet quartz from the Ricodistrict. The ∂18O values for quartz from other tertiary deposits in Colorado are shown for comparison. Therange of quartz ∂18O values for porphyry mineralization at Climax (Hall et al., 1974) and in the Ophir(West Silverton) area (Ringrose et al., 1986) are in the same range of values as those for the Silver Creekdeposit at Rico. Epithermal vein quartz values at the Sunnyside mine (Casadevall and Ohmoto, 1977) are inthe same range as the lower Silver Creek and Argentine quartz samples, but the Creede (Bethke and Rye,1979) vein quartz values are higher than typical epithermal quartz vein samples.
Figure 3.
The oxygen isotopes ratios as shown in the figure 3, indicate that each of the areas in the Rico districtcontains quartz that exhibits a distinct range of ∂18O values. Data from each group do not overlap with datafrom any other group. The massive, weakly mineralized, quartz veins from lower and upper Silver Creekyield the lowest ∂18O values found in the district. Lower Silver Creek values range from -5.5 to - 6.1 permil. Quartz from the Argentine and Union Carbonate mines has values in the range -0.9 to -3.9 per mil.Quartz from the porphyry molybdenum veinlets produced the highest ∂18O values. These data clusterbetween 7.5 and 8.7 per mil, and with the exception of SC-54409, the data lie within the 0.3 per mil rangefrom 8.4 to 8.7 per mil.
2.2.2 Hydrogen isotopes ratiosInclusion fluids from seven samples of quartz were analyzed for hydrogen isotope ratios (Table below).The ∂D values for the three paragenetic zones in RI-011 vary from - 121 through - 117 to - 112 per mil for zones I through III. Fluid inclusions from these three zones are predominantly primary, and the secondaryinclusions in zone I have been shown to have formed from zone II fluids. The samples for ∂D analyses were ground to finer than 160 mesh in an attempt to fracture the quartz along zones of secondary inclusionsprior to extraction to the fluids for analysis. The hydrogen isotope ratios for each zone are thereforeprobably derived from predominantly primary inclusions, although some mixing with secondary inclusionfluids could not realistically be avoided. Two samples from the Argentine mine yielded nearly identical ∂D values of -117 and -113 per mil. The inclusions from these samples were almost entirely secondary inorigin.

8
Figure 4. The ∂D Values for Quartz Inclusion Fluids from the Rico District
Figure 4 shows plots of average homogenization temperatures (Th) for fluid inclusions vs. quartz ∂18Ovalues. Also shown are isopleths of ∂18O values for water in equilibrium with quartz calculated using thequartz-water fractionation of Clayton et al. (1972). The vertical bars represent the standard deviation in Th
measurements for each sample. The ∂18O value of water in equilibrium with the quartz for each of thesamples can be read directly from the isopleths. The porphyry fluids had consistently high ∂18O values andthe lower Silver Creek and Argentine fluids had low values. The Newman Hill fluids are intermediatebetween the porphyry and massive quartz fluids, but this is not the result of mixing between these twodistinct reservoirs.

9
2.2.3 Origin of the hydrothermal fluidsOxygen isotope values for fluids in equilibrium with quartz in all the samples for which quartz ∂18O valuesand average homogenization temperatures were measured are shown in the figure 4. This figure plots thequartz ∂18O value versus Th. Water ∂18O isopleths are also shown. These were calculated using the quartz-water fractionation equation of Clayton et al. (1972). The oxygen isotope values for the hydrothermal fluidsfall into three distinct fields in the figure 4 above. The quartz-molybdenite veinlet fluids have 5180 valuesthat cluster within 0.5 per mil of 2.0 per mil. The data from the massive quartz veins in lower Silver Creek,the Argentine mine, and the Union Carbonate mine yield water values less than -9 per mil. The NewmanHill veins have water values that are intermediate between the quartz molybdenite veinlets and the massivequartz veins.
The isotopic compositions of fluids involved in the porphyry and vein mineralization in the Rico district(Fig. 5) can be defined using the hydrogen isotope analyses of the inclusion fluids and the oxygen isotopevalues of fluids in equilibrium with the hydrothermal quartz (Fig. 4). These data suggest that two fluidswith distinct isotopic signatures were responsible for the mineralization. The porphyry fluid probablycontained both a magmatic and an 18O -shifted meteoric component. The epithermal fluid was an 18O-shifted meteoric water.
Figure 5.
Figure 5 shows that the Newman Hill fluids are typical 18O-shifted meteoric waters and that the porphyryfluids contain a magmatic component and figure 5 is a plot of ∂D fluid inclusions vs. calculated ∂18O valuesof the hydrothermal fluids in the epithermal veins and porphyry veinlets from the Rico district. Themeteoric water line (MWL) and the field of primary magmatic water (PMW) (Taylor, 1979) are alsoshown. The epithermal fluids define the typical 18O-shifted pattern that is characteristic of meteoric-hydrothermal fluids in hot spring and epithermal systems. The porphyry fluid lies on a mixing trajectorybetween the 18O -shifted epithermal fluid and the field of magmatic water. Also shown are fields ofhydrothermal fluid compositions for other tertiary epithermal vein systems in the San Juan Mountains: theSunnyside periods I to V (Casadevall and Ohmoto, 1977) and Platoro (Brooks et al., 1986) and for quartz-molybdenite mineralization in the West Silverton district (Ringrose et al., 1986).
10
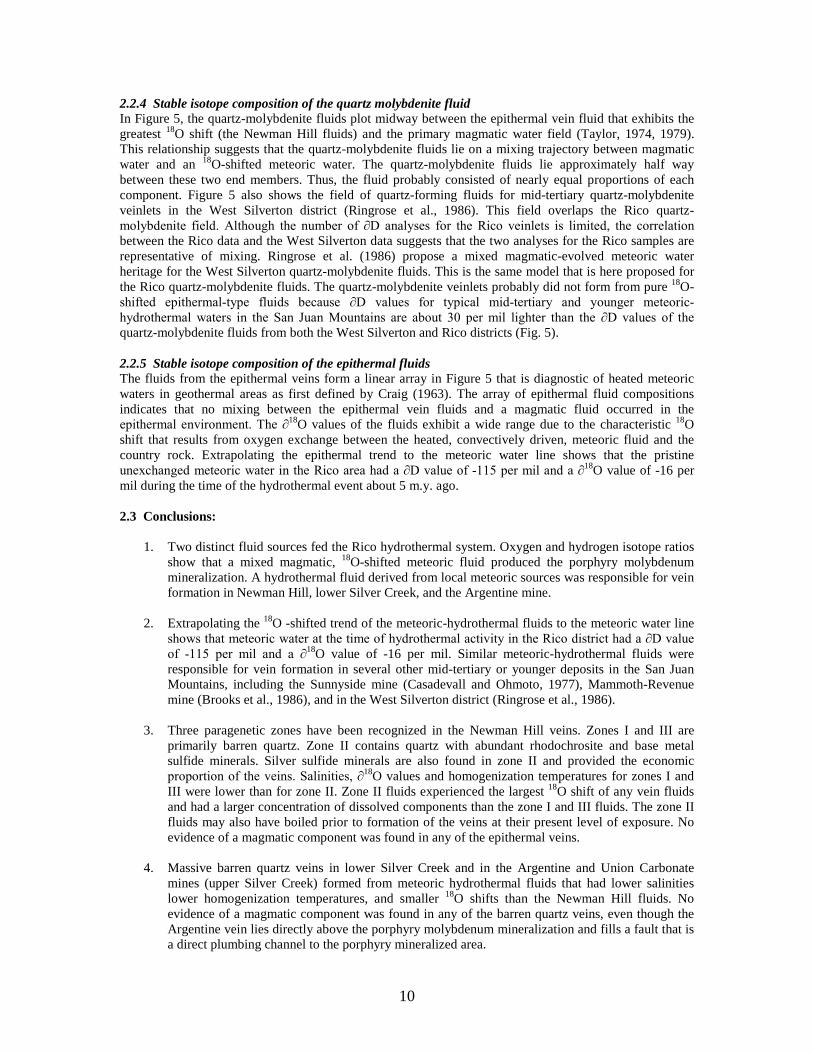
2.2.4 Stable isotope composition of the quartz molybdenite fluidIn Figure 5, the quartz-molybdenite fluids plot midway between the epithermal vein fluid that exhibits thegreatest 18O shift (the Newman Hill fluids) and the primary magmatic water field (Taylor, 1974, 1979).This relationship suggests that the quartz-molybdenite fluids lie on a mixing trajectory between magmaticwater and an 18O-shifted meteoric water. The quartz-molybdenite fluids lie approximately half waybetween these two end members. Thus, the fluid probably consisted of nearly equal proportions of eachcomponent. Figure 5 also shows the field of quartz-forming fluids for mid-tertiary quartz-molybdeniteveinlets in the West Silverton district (Ringrose et al., 1986). This field overlaps the Rico quartz-molybdenite field. Although the number of ∂D analyses for the Rico veinlets is limited, the correlation between the Rico data and the West Silverton data suggests that the two analyses for the Rico samples arerepresentative of mixing. Ringrose et al. (1986) propose a mixed magmatic-evolved meteoric waterheritage for the West Silverton quartz-molybdenite fluids. This is the same model that is here proposed forthe Rico quartz-molybdenite fluids. The quartz-molybdenite veinlets probably did not form from pure 18O-shifted epithermal-type fluids because ∂D values for typical mid-tertiary and younger meteoric-hydrothermal waters in the San Juan Mountains are about 30 per mil lighter than the ∂D values of the quartz-molybdenite fluids from both the West Silverton and Rico districts (Fig. 5).
2.2.5 Stable isotope composition of the epithermal fluidsThe fluids from the epithermal veins form a linear array in Figure 5 that is diagnostic of heated meteoricwaters in geothermal areas as first defined by Craig (1963). The array of epithermal fluid compositionsindicates that no mixing between the epithermal vein fluids and a magmatic fluid occurred in theepithermal environment. The ∂18O values of the fluids exhibit a wide range due to the characteristic 18Oshift that results from oxygen exchange between the heated, convectively driven, meteoric fluid and thecountry rock. Extrapolating the epithermal trend to the meteoric water line shows that the pristineunexchanged meteoric water in the Rico area had a ∂D value of -115 per mil and a ∂18O value of -16 permil during the time of the hydrothermal event about 5 m.y. ago.
2.3 Conclusions:
1. Two distinct fluid sources fed the Rico hydrothermal system. Oxygen and hydrogen isotope ratiosshow that a mixed magmatic, 18O-shifted meteoric fluid produced the porphyry molybdenummineralization. A hydrothermal fluid derived from local meteoric sources was responsible for veinformation in Newman Hill, lower Silver Creek, and the Argentine mine.
2. Extrapolating the 18O -shifted trend of the meteoric-hydrothermal fluids to the meteoric water lineshows that meteoric water at the time of hydrothermal activity in the Rico district had a ∂D value of -115 per mil and a ∂18O value of -16 per mil. Similar meteoric-hydrothermal fluids wereresponsible for vein formation in several other mid-tertiary or younger deposits in the San JuanMountains, including the Sunnyside mine (Casadevall and Ohmoto, 1977), Mammoth-Revenuemine (Brooks et al., 1986), and in the West Silverton district (Ringrose et al., 1986).
3. Three paragenetic zones have been recognized in the Newman Hill veins. Zones I and III areprimarily barren quartz. Zone II contains quartz with abundant rhodochrosite and base metalsulfide minerals. Silver sulfide minerals are also found in zone II and provided the economicproportion of the veins. Salinities, ∂18O values and homogenization temperatures for zones I andIII were lower than for zone II. Zone II fluids experienced the largest 18O shift of any vein fluidsand had a larger concentration of dissolved components than the zone I and III fluids. The zone IIfluids may also have boiled prior to formation of the veins at their present level of exposure. Noevidence of a magmatic component was found in any of the epithermal veins.
4. Massive barren quartz veins in lower Silver Creek and in the Argentine and Union Carbonatemines (upper Silver Creek) formed from meteoric hydrothermal fluids that had lower salinitieslower homogenization temperatures, and smaller 18O shifts than the Newman Hill fluids. Noevidence of a magmatic component was found in any of the barren quartz veins, even though theArgentine vein lies directly above the porphyry molybdenum mineralization and fills a fault that isa direct plumbing channel to the porphyry mineralized area.

11
5. Fluid inclusion homogenization to both a liquid and a vapor shows that boiling occurred at sometime in the history of the porphyry mineralization. The temperature of boiling was in the range350°C to 420°C, indicating a pressure during quartz deposition of about 130 bars. The porphyrymineralization occurred early in the history of the Rico system. Numerous trains of lowertemperature dilute secondary inclusions in the veinlet quartz suggest a late-stage influx ofmeteoric-hydrothermal fluids.
6. Fluid inclusions in quartz from the veins homogenize at temperatures in the range 200°C to 300°Cand yield salinities less than 5 equiv wt percent NaC1. The ∂D values of quartz inclusion fluids (-112‰ to - 121‰) and calculated ∂18O values of fluids in equilibrium with the quartz (-3‰ to -17‰) show that the epithermal vein fluids were 18O-shifted meteoric waters. Vein samples withlarge 18O shifts also exhibit very saline fluid inclusions indicating that the fluids whichexperienced the greatest degree of water-rock interaction contain the highest concentration ofdissolved components.
7. The porphyry fluid (∂D = -90‰ to -104‰, ∂18O = +2‰) was derived from mixed magmatic andmeteoric sources. Primary inclusions in the porphyry veinlets homogenize to both liquid and vaporin the temperature range 350°C to 420°C, suggesting that boiling occurred during their formation.Trains of secondary inclusions are abundant in the veinlets and show that a later lower temperaturefluid encroached upon the porphyry system.
8. The porphyry mineralization formed early in the history of the Rico hydrothermal system.Epithermal vein formation occurred later than the porphyry mineralization and the meteoric-hydrothermal fluid collapsed into the porphyry core of the system during the retrograde stages ofthe hydrothermal system.
3.0 GEOTHERMOMETRY
The Dunton Hot Spring, Geyser Warm Springs, Paradise Hot Springs, and four core-drill holes near thetown of Rico, CO, were sampled for geochemistry in 1975 and 1976 and described in Barrett and Pearl(1976, 19878). The available elemental and radiogenic isotope data are summarized in the appendices inTables 1.
3.1 Physical and geological description of springsAll spring descriptions (Barrett and Pearl, 1978) mention the proximity of strong north-northwest trendingfaults near the geothermal features (see Figure 6). At the Dunton Hot Spring, local faulting has brought theMorrison (mud/sand/siltstone and limestone) formation in contact with the Entrada (sandstone) and Dolores(red silt- and sandstones, shales) Formations. The Geyser Warm Spring is actually located on theintersection of two mapped faults, and Paradise Warm Springs was also assumed to originate as a result oflocal faulting. Frothing waters (observed at nearly all of the geothermal features) results from carbondioxide degassing, which may have been derived from water-rock reactions with available limestone(possibly in the Morrison or Leadville formations).
The three natural springs and the four man-made drill holes near town have generally moderate discharges,ranging from 10-30 gallons per minute, with the exception of brief geyser-like activity from the GeyserWarm Spring, and from one of the drill-holes in Rico town.

12
Figure 6. Adapted geological map of Rico region, Dunton Hot Springs, showing occurrences andstrike of widespread localized faulting. (Barrett and Pearl, 1978).
3.2 Major eElement compositionOverall, calcium dominates the cationic portion of these waters’ geochemistry, with sodium andmagnesium playing secondary roles and generally slightly lower potassium. Although Paradise Hot Springsfollows this general trend, it should be noted that its Ca/Na/K levels are one to two orders of magnitudehigher than all other geothermal features. Bicarbonate and sulfate tend to dominate the anionic species.
Paradise Hot Springs stands out from the other features due to its elevated lithium and fluoride levels, aswell as higher conductance and total dissolved solids values. The lithium and fluoride in particular suggestthat Paradise waters may have spent more time in contact with or contacted a greater percentage of graniticrocks along subsurface flowpaths than did waters from the remaining geothermal springs in the area.
3.3 Trace element geochemistryThe most noticeable feature of these springs’ trace element geochemistry is the elevated strontium levelsacross all of the springs (some of the highest in Colorado, according to Barrett and Pearl. AlthoughParadise Springs was the only feature to indicate this possibility through major element data, the highstrontium levels may indicate that all of these waters have interacted with granitic or granitically-derivedsediments.

13
3.4 Geothermometry backgroundOne practical and often-used application of surface-water geochemical analyses is the calculation ofsubsurface temperatures using geothermometric equations. Several types of these geothermometers havebeen studied and are described below in more detail. The results of those geothermometers that werespecifically applied in Rico, CO, are discussed in the following section.
The basic assumptions underlying most geothermometers are that ascent of deeper, hotter waters (and theaccompanying cooling) is fast enough such that kinetic factors will inhibit re-equilibration of the water, andminimal mixing with alternate water sources occurs during ascent; it should be noted that compliance withthese assumptions is often “exceedingly difficult to prove” (Ferguson et al., 2009). Additional assumptionspreviously stated by Fournier (1977) are that all reactants are present in sufficient quantities, and thatequilibrium is itself attained at depth.
One of the most important facts to note about geothermometers is that a temperature of “last reservoircontact” is produced from these equations, but these same equations provide no estimation of the depth atwhich this contact and derived temperature were experienced. Thus, caution should be used when planningor estimating drilling depths based on geothermometrically calculated temperatures.
3.4.1 Na-K geothermometerThis particular geothermometer is based on temperature-dependent cation exchange reactions, primarilywithin feldspar minerals (common in many tock types) in contact with heated waters. At highertemperatures, the ratio of sodium to potassium in the water shifts in favor of elevated potassium (reflectingthe need for a higher temperature to allow larger potassium ions to “break free” from crystal structures).Fournier (1977) derived bounding equations for this geothermometer using data collected from both naturalgeothermal sources and experimental data, but cautioned that it should be used only for waters with >200C temperatures, as overestimation of temperature results in source waters colder than 100C. For suchlower-temperature geofluids, the Na-K-Ca geothermometer is recommended.
3.4.2 Na-K-Ca geothermometerExperimental temperature-concentration data show tighter clustering under low-temperature conditionswhen calcium is considered as an additional reactant (see Figure 7). The solid line in Figure 7 representsthe equation:
log NaK log Ca
Na 1647
273 T o C 2.24 (Fournier, 1977)
Concentrations in the above equation are in units of mol/kg, and the term derives from cation substitutionstoichiometry ( = 1/3 for low temperature reactions and = 4/3 for higher temperatures). The derivationof the term appears to be somewhat qualitative, as discussed further in Fournier and Truesdell (1973).
The addition of calcium in this particular geothermometer reflects the fact that calcium may compete withsodium and potassium ions in exchange reactions, as a result of the ubiquity of dissolved calcium fromdissolution of calcite or a similar carbonate mineral. However, the authors also made several assumptionsto accommodate the formation of this geothermometer. These assumptions are: excess silica (typicallydeposited in hydrothermal systems and thus plausible); conservative aluminum (also plausible due to lowAl solubility in water); and conservation of net hydroxyl minerals, to remove H+ ions from all relevantequations. These authors admit that although pH changes may occur, known values of both temperatureand pCO2 are necessary to correct for them, making this last assumption an essential but unsatisfactory one.One last important caveat to this geothermometer, in terms of Rico geothermal features, is that in CO2-richenvironments such as these, this geothermometer “will give good results provided that calcium carbonatewas not deposited after the water left the reservoir” (Fournier and Truesdell, 1973). However, travertineand other surficial calcium carbonate deposits were noted as several Rico features (Barrett and Pearl, 1978).

14
An empirical correction to this geothermometer for waters with higher magnesium contents is available anddiscussed in Fournier and Potter (1979). ‘High’ magnesium is defined by these authors as R > 50, where R= {eq(Mg)/(eq(Mg) + eq(Ca) + eq(K))}
. 100.
Figure 7. Temperature-dependent Na-K-Ca relationships, as described in Fournier and Truesdell(1973). Dashed lines represent 15C. Figure taken from Fournier (1977).
3.4.3 Silica geothermometers and mixing modelsUnlike the two previous geothermometers that utilize exchange reactions, silica geothermometers functionas a result of solubility reactions. According to Fournier (1977), silica is ideal for this purpose as it isgenerally in excess supply (as it is the main constituent of the vast majority of minerals), it is not readilylost through volatilization, and does not react through complexes or other ionic effects. Fournier (1977,and references within) compiled various equations relating temperature with solubility with guidance as totheir usage for amorphous silica, quartz (both with and without steam loss), cristobalite ( and types) andchalcedony (see Appendix for equations).
Silica solubility equations can also be used, in conjunction with temperature data from the mixed surface“warm” spring source and a “cold” (nearby cold springs or local meteoric recharge) diluting source, toestimate the original reservoir high temperature. A simplified graphical (yet still involved) method ofestimating the temperature at depth is provided in Truesdell and Fournier (1977).
3.4.4 Lithium-based geothermometersBoth elemental (Fouillac and Michard, 1981) and isotopic (Millot and Negrel, 2007) lithium models havebeen proposed for use as geothermometers, although neither method was applied at Rico. However, forParadise Springs especially, the high abundance of lithium may facilitate the use of these models in thefuture.

15
Based on correlations between high-temperature zones and decreased Na/Li ratios, Fouillac and Michard(1981) collected datasets and derived the purely empirical equation:
log (Na/Li) = 1000*T-1 – 0.38 (for low chloride, < 0.2M) (Fouillac and Michard, 1981)
where concentrations are given in molal units. The authors admit that there is no immediately obviousgeochemical reaction or process to explain this correlation between lithium and geothermal temperatures. Ifone assumes that the reported lithium and sodium values from Table 2 can be approximately converted tomolal values without correction for total dissolved solutes, approximate Na/Li temperatures can beestimated. At Paradise Springs, for example, the high lithium values drive the estimated subsurfacetemperature to an astounding 470C! In general, this correlation seems to provide highly elevatedtemperature estimates.
The relatively high abundances of lithium that seem to play havoc with that elemental Li geothermometermay enable accurate determinations of lithium isotopic signatures within these springs. Millot and Negrel(2007) collected data from various hydrothermal sites and found a clear correlation between temperatureand 7Li fractionation. This model may well be applicable at the Rico sites.
3.4.6 Gas geothermometersSeveral gas-based geothermometers have been proposed and utilized at various sites, but proper gascollection comes with its own set of concerns and issues. Horibe and Craig (1995) obtained experimentallyderived temperature vs. D/H fractionation curves for use in assessing temperature from methane/hydrogengas systems, but in natural settings there is no guarantee of the degree of equilibrium of these gases withthe geofluid. Helium gas may provide some indication of mantle- or magmatically-derived input to thegeothermal system and may be less susceptible to disequilibrium from calcite precipitation (Mutlu et al.,2008), but collection and analysis is time-consuming and difficult.
3.5 Geothermometers applied at Rico, COThe following conclusions are culled from the reported geochemical sampling and analyses recorded inBarrett and Pearl (1978), specifically from Table 4.
3.5.1 Dunton Hot Springs – Chalcedony as the dominant silica geothermometer yielded susbsurfacetemperatures of 51-54C. However, when used in conjunction with a mixing model, the “hot” subsurfacewater was calculated to be several degrees higher (65-69C) with ~40% cold water fraction. Na-Kgeothermometers yielded absurdly high temperatures of ~330C, while Na-K-Ca models, taking intoaccount the obviously elevated calcium levels, produced values of 47-52C, in general agreement with thechalcedony method. However, observation of a nearby CaCO3-depositing spring would indicate that bothof these estimates are overpredicting the temperature at depth.
3.5.2 Geyser Warm Spring – Again, the chalcedony solubility equation was used to derive a subsurfacetemperature estimate of 58C. Incorporating a mixing model again yields a higher-temperature “reservoir”source water of 113C, with an 80% cold water fraction. Na-K and Na-K-Ca geothermometers producemuch higher values (183, 160C) which are suspicious given the travertine deposits observed near thespring.
3.5.3 Paradise Spring – At this site, due to increased [SiO2], amorphous silica was determined to be thecontrolling phase and its solubility equation produced a subsurface temperature value of 39-56C, at or nearthe measured surface temperature of the spring. Mixing model calculations suggest that only a smallpercent (1-4) dilution of a source with similar temperatures (43C) occurs – which for all practical purposescan be ignored. As with the previous springs, Na-K and Na-K-Ca geothermometer estimates areanomalously high (246, 250C), but the presence of interfering magnesium is noted.
3.5.4 Rico Core-Drill Holes (Diamond Drill, Big Geyser, Warm, and Little) – Here amorphous silica wasused to calculate subsurface temperatures of 22-35C across all four drill-holes. These values are lowerthan measured surface-water temperatures but as noted by the authors are within the limits of error caused

16
by analytical methods. The Na-K system provides temperature estimates upwards of 185C but are notedas unreliable due to elevated calcium; Na-K-Ca methods provide more believable estimates of 17-59C.
3.6 Magnesium correction to Na-K-Ca derived temperaturesAs mentioned above, Fournier and Potter (1979) published an empirical magnesium correction to the Na-K-Ca. The method is uncomplicated, involving only the calculation of a ratio of equivalents and the use ofthat ratio and the figure below (Figure 8) to determine a number of degrees with which to correct thepreviously calculated Na-K-Ca estimate. However, this simple correction was not applied to any of theRico geochemical analyses, even though Barrett and Pearl (1978) plainly state that elevated magnesiumrenders their Na-K-Ca estimates invalid.
Figure 8. Empirically-based Mg correction plot for the Na-K-Ca geothermometer, with the authors’original instructions (figure 4 from Fournier and Potter, 1979).
An example correction is shown for the data from Geyser Warm Spring, below, and the remainingcalculations are presented in Table 1.

17
Geyser Warm Spring Data: 0.17 g/L Ca (or 0.00848 eq)0.04 g/L Mg (0.00329 eq)0.029 g/L K (0.000742 eq)
thus R(Geyser Warm Spring) = [0.00329 / (0.00329 + 0.00848 + 0.000742)]*100 = 26
from Figure 8 above, Mg correction (R=26, T=160C) ~ 85C
Mg-corrected Na-K-Ca Temperature = 160 – 100 = 60C
Table 1. Mg-corrected factors and resulting temperatures for Rico area springs
Data NameR Mg Factor (C)
Na-K-Ca Temp(C)
Corrected Temp(C)
Geyser Spgs 26 ~100 160 60Paradise 1 11 ~50 252 202Paradise 2 10 ~70 248 178Paradise 3 11 ~60 250 190
As Fournier and Potter (1979) recommend that this correction be used only for waters withoriginal Na-K-Ca temperature estimates above 70C, only the Geyser and Paradise waters are showncorrected. However, the calculated R values for all the geofluids are very tightly clustered (values of 10-26), which indicates similar Mg/(Mg+Ca+K) ratios for these waters, and perhaps reveals a shared water-rock reaction pathway.
The Mg-corrected temperature estimate for Geyser Springs very nearly matches the value predicted by thesilica geothermometers, but corrected estimates at Paradise Springs are still relatively high compared tosilica values.
3.7 Conclusions from CGS Geothermometer CalculationsFor waters from all of the Rico geothermal features, the Na-K geothermometer method is obviouslyviolated by high values of calcium. In addition, high levels of magnesium cause overestimations of the Na-K-Ca geothermometer as well. It is interesting that no attempt was made to correct for the noted elevatedmagnesium levels in all the analyzed waters. Silica geothermometer methods yield generally lowsubsurface temperature estimates (~25-58C), but the only offered explanation for these values is possibledilution by a colder water source. Overall, the available geothermometry calculations provide a somewhatdimmer view of the potential for Rico geothermal prospects than does the heat flow map produced by theColorado Geological Survey.
Of course the most desirable way to reconcile these conflicting suites of data would be to collect down-holetemperature and water data from deep drill holes in the area. Absent this expensive method, application ofsome of the isotopic or gas geothermometry models discussed above may provide more conclusive results.Finally, inverse modeling to determine water-rock reaction pathways may also help to constrain the extentof variable chemistry within the reservoir. This modeling could be undertaken by first obtaining moregeological detail concerning which formations are contacted by the geothermal fluids, and then acquiringgeochemical analyses of both altered and unaltered rock samples. Coupling these data with geothermalfluid analyses should provide a starting point for the use of models such as PHREEQC, Chiller, orGeochemist’s Workbench.

18
Table 2. Major and trace element chemistry and relevant chemical parameters of the Rico areageothermal features. Anomalous values highlighted in yellow.
DuntonHot
Spring
GeyserWarmSpring
ParadiseHot
Spring
Rico –Diamond
DrillHole
Rico –Big
GeyserWarmSpring
Rico –GeyserWarmSpring
Rico –Little
Spring
Al (ug/L)1 40 210 240 130As(ug/L)2
5-3
-
0 140--
-31
-
26 26-
Ba (ug/L)1 55 1000 290 34Be (ug/L)1 < 2 < 6 < 8 10Bi (ug/L)1 < 10 < 26 < 40 < 20B(ug/L)2
9011090
120 930010004300
7080
70
80 9070
Cd(ug/L)2
0--
0 0--
-1
-
0 0-
Ca(mg/L)2
330360340
170 160240170
590680
690
680 620690
Cr (ug/L)1 < 9 < 24 < 37 < 17Cl(mg/L)2
6.66.37.0
2.4 3.13.33.1
2.44.1
4.3
3.9 2.33
Co (ug/L)1 < 9 < 24 < 37 < 17Cu (ug/L)1 < 2 < 6 < 8 < 4F(mg/L)2
0.60.40.7
0.4 3.93.83.7
1.42.1
1.5
2.1 1.54.8
Ga (ug/L)1 < 4 < 10 < 17 - - < 8 -Ge (ug/L)1 < 9 < 24 < 37 - - < 17 -Fe(ug/L)2
23008301100
20 15060
20030
8300
8500
8500 48007400
Pb (ug/L)1 < 9 < 24 < 37 < 17Li(ug/L)2
100--
280 9600--
-250
-
250 210-
Mg(mg/L)2
454345
40 273028
8298
93
100 11092
Mn(ug/L)2
180017001900
700 780860830
13003100
4400
1900 1500 1600
Hg(ug/L)2
0--
0 0.1--
-0
-
0 0.1-
Ni (ug/L)1 < 9 < 24 < 37 < 17N, as N(mg/L)2
0.060.010.02
0.02 0.070.110.09
0.070.05
0.01
0.02 0.050.08
PO4, diss. As P (mg/L)2 0.030.050.01
0.09 0.100.120.22
0.080.08
0.18
0.09 0.080.11
PO4, as ortho(mg/L)2
0.090.150.03
0.28 0.310.370.67
0.250.25
0.55
0.28 0.250.34
K(mg/L)2
192121
29 360380370
2830
31
32 5.632
Se 0 0 0 0 0 0
19
(ug/L)2 --
--
--
-
SiO2
(mg/L)2343233
37 150200150
120110
140
110 120120
Ag (ug/L)1 < 1 < 3 < 4 < 2Na(mg/L)2
353434
400 180019001900
6678
67
80 7677
Sr (ug/L)1 3000 12000 3800 6700SO4
(mg/L)2350340310
68 140140110
810900
920
920 1000960
Sn (ug/L)1 < 9 < 24 < 37 < 17Ti (ug/L)1 < 4 < 12 < 17 < 8Va (ug/L)1 < 9 < 24 < 37 < 17Zn(ug/L)2
0--
0 50--
-1000
-
80 100-
Zr (ug/L)1 < 10 < 30 < 40 < 20Alk, as CaCO3 (mg/L)2 719
828837
1450 515562572
9191390
1350
1420 1400 1190
Alk, as HCO3-(mg/L)2 877
10101020
1770 628685697
11201700
1650
1730 1710 1450
Hardness, non carb(mg/L)2
290250200
0 0160
0890
710
750
690 600910
Hardness, total (mg/L)2 100011001000
590 510720540
18002100
2100
2100 20002100
Specific conductance(umohs)2
185018901860
2500 95601070010000
27103250
3100
3200 4700 3350
TDS(mg/L)
126013401300
1620--
607065306180
22502750
2740
2790 2790 2700
pH, field2 -7.06.4
---
-6.96.8
7.0-
6.8
- -7.0
Discharge(gpm)2
262525
25-2004
--
263430
158
12
14 1315
Temp, surface(C)2
444242
28--
464042
4434
36
38 3839
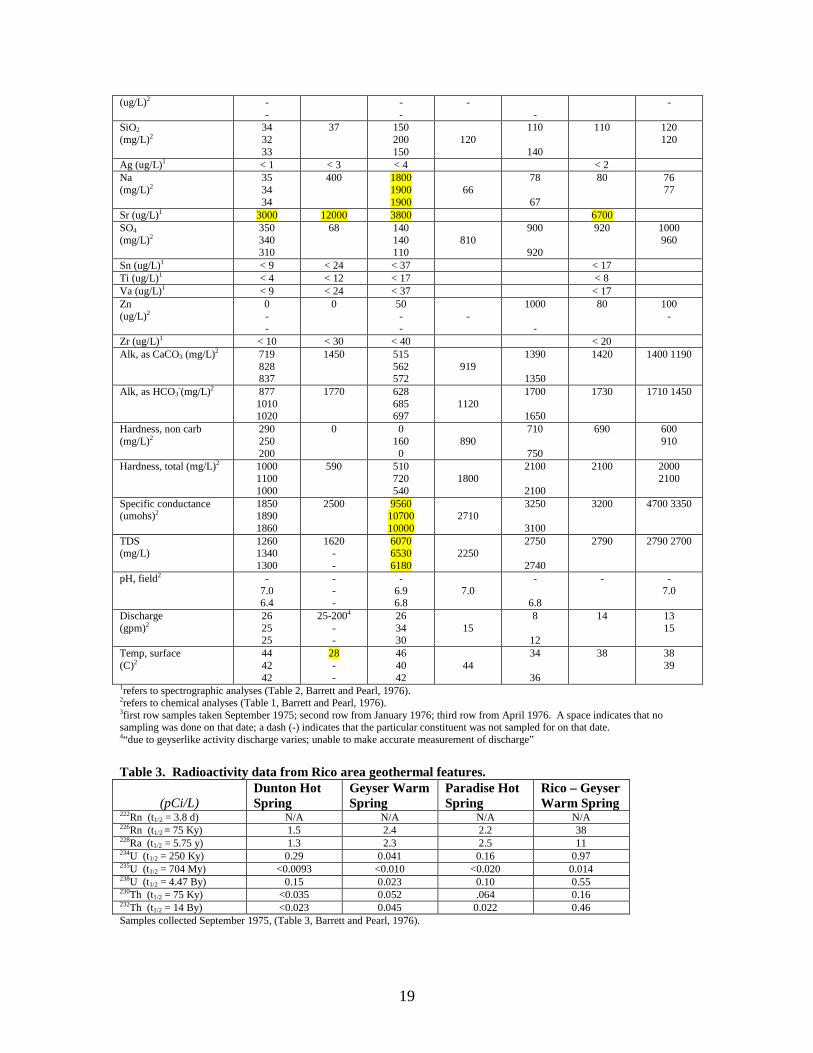
1refers to spectrographic analyses (Table 2, Barrett and Pearl, 1976).2refers to chemical analyses (Table 1, Barrett and Pearl, 1976).3first row samples taken September 1975; second row from January 1976; third row from April 1976. A space indicates that nosampling was done on that date; a dash (-) indicates that the particular constituent was not sampled for on that date.4“due to geyserlike activity discharge varies; unable to make accurate measurement of discharge”
Table 3. Radioactivity data from Rico area geothermal features.
(pCi/L)Dunton HotSpring
Geyser WarmSpring
Paradise HotSpring
Rico – GeyserWarm Spring
222Rn (t1/2 = 3.8 d) N/A N/A N/A N/A226Rn (t1/2 = 75 Ky) 1.5 2.4 2.2 38228Ra (t1/2 = 5.75 y) 1.3 2.3 2.5 11234U (t1/2 = 250 Ky) 0.29 0.041 0.16 0.97235U (t1/2 = 704 My) <0.0093 <0.010 <0.020 0.014238U (t1/2 = 4.47 By) 0.15 0.023 0.10 0.55230Th (t1/2 = 75 Ky) <0.035 0.052 .064 0.16232Th (t1/2 = 14 By) <0.023 0.045 0.022 0.46Samples collected September 1975, (Table 3, Barrett and Pearl, 1976).

20
Silica Geothermometer Equations
amorphous silica: T[C] = {731 / (4.52 - logC)-1} – 273.15-cristobalite: T[C] = {1000 / (4.78 - logC)-1} – 273.15-cristobalite: T[C] = {781 / (4.51 - logC)-1} – 273.15chalcedony: T[C] = {1032 / (4.69 - logC)-1} – 273.15quartz: T[C] = {1309 / (5.19 - logC)-1} – 273.15quartz (after steam loss): T[C] = {1522 / (5.75 - logC)-1} – 273.15
Equations for 0C < T < 250C with C as [mg SiO2/kg], from Fournier (1977)

21
4.0 References
[1] Kamber, Balz Samuel (2009) Geochemical fingerprinting: 40 years of analytical developmentand real world applications. Department of Earth Sciences, Laurentian University, Sudbury, Ontario,Canada. Applied Geochemistry, In Press.
[2] Arnorsson, S., Stefansson, A., and Bjarnason, J (2007) Fluid - Fluid Interactions in GeothermalSystems. Institute of Earth Sciences, University of Iceland. Reviews in Mineralogy & Geochemistry , Vol.65, pp. 259-312.
[3] DiPippo, R (2008) Geothermal Power Plants. Principles, Applications, Case Studies andEnvironmental Impact. New York.
[4] Cole, David R. et al., (2004) Oxygen isotope zoning profiles in hydrothermally alteredfeldspars: Estimating the duration of water-rock interaction, Chemical Sciences Division, Oak RidgeNational Laboratory, USA, Geology Magazine, January 2004.
[5] Larson, P. B. et al., (1994) Hydrothermal alteration and mass exchange in the hornblende latiteporphyry, Rico, Colorado, Springer-Verlag, Received March 29, 1992, Accepted June 30, 1993,Contributions to Mineralogy and Petrology, 116: 199-215.
[6] Larson, P. B., (1987) Stable Isotope and Fluid Inclusion Investigations of Epithermal Vein andPorphyry Molybdenum Mineralization in the Rico Mining District, Colorado, Department of GeologyWashington State University, Pullman, Washington, Economic Geology, Vol. 82, , pp. 2141-2157.
[7] Wareham, Christopher. D., (1998) C, Sr, and Pb Sources in the Pliocene Silver Creek Porphyry MoSystem, Rico, Colorado, Department of Geology and Petroleum Geology University of Aberdeen, UnitedKingdom, Economic Geology, Vol. 93, , pp. 32-46.
[8] Barrett, J.K. and Pearl, R.H. (1976) Hydrogeological Data of Thermal Springs and Wells in Colorado,Information Series No. 6. Colorado Geological Survey, Department of Natural Resources, Denver, CO.
[9] Barrett, J.K, and Pearl, R.H. (1978) An Appraisal of Colorado’s Geothermal Resources, Bulletin 39.Colorado Geological Survey, Department of Natural Resources, Denver, CO.
[10] Ferguson, G., Grasby, S.E., and S.R. Hindle (2009) What Do Aqueous Geothermometers Really TellUs? Geofluids, 9, 39-48.
[11] Fouillac, C., and Michard, G. (1981) Sodium/Lithium Ratio in Water Applied to Geothermometry ofGeothermal Reservoirs. Geothermics, 10, 55-70.
[12] Fournier, R.O. (1977) Chemical Geothermometers and Mixing Models for Geothermal Systems.Geothermics, 5, 41-50.
[13] Fournier, R.O., and Potter II, R.W. (1979) Magnesium Correction to the Na-K-Ca ChemicalGeothermometer. Geochemica et Cosmochimica Acta, 43, 1543-1550.
[14] Fournier, R.O., and Truesdell, A.H. (1973) An Empirical Na-K-Ca Geothermometer for NaturalWaters. Geochemica et Cosmochimica Acta, 37, 1255-1275.
[15] Horibe, Y., and Craig, H. (1995) D/H Fractionation in the System Methane-Hydrogen-Water.Geochemica et Cosmochimica Acta, 59, 5209-5217.
[16] Millot, R., and Negrel, P. (2007) Multi-Isotopic tracing (7Li, 11B, 87Sr/86Sr) and ChemicalGeothermometry: Evidence from Hydro-geothermal Systems in France. Chemical Geology, 244, 664-678.

22
[17] Mutlu, H., Gulec, N., and Hilton, D.R. (2008) Helium-Carbon Relationships in Geothermal Fluids ofWestern Anatolia, Turkey. Chemical Geology, 247, 305-321.
[18] Truesdell, A.H., and Fournier, R.O. (1977) Procedure for Estimating the Temperature of a Hot WaterComponent in a Mixed Water Using a Plot of Dissolved Silica vs Enthalpy. U.S. Geological Survey Journalof Research