geochemistry of spring water, southeastern uinta basin ... · geochemistry of spring water,...
TRANSCRIPT


Geochemistry of Spring Water, Southeastern Uinta Basin, Utah and Colorado
By BRIANT A. KIMBALL
GEOLOGICAL SURVEY WATER-SUPPLY PAPER 2074
UNITED STATES GOVERNMENT PRINTING OFFICE, WASHINGTON : 1981

UNITED STATES DEPARTMENT OF THE INTERIOR
JAMES G. WATT, Secretary
GEOLOGICAL SURVEY
Doyle G. Frederick, Acting Director
Library of Congress Cataloging in Publication DataKirn ball, Briant A.Geochemistry of spring water, southeastern Uinta Basin, Utah and Colorado.(Geological Survey Water-Supply Paper 2074)Bibliography: p. 28Supt. of Docs. no.:I 19.13:20741. Springs-Uinta Basin, Utah and Colo.-Mathematical models. 2. Springs Uinta Basin,
Utah and Colo. Data processing. 3. Water chemistry Mathematical models. 4. Water chemistry Data processing.
I. Title. II. Series: United States Geological Survey Water-Supply Paper 2074. GB1198.3U8K55 551.49'8 80-607933
For sale by the Superintendent of Documents, U.S. Government Printing OfficeWashington, D.C. 20402

CONTENTS
Page
Abstract.......................................................................................................................... 1Introduction .................................................................................................................. 1Physical setting .......................................................................................................... 3
Physiography.................................................................................................. 3Climate........................................................ ........................................................ 4Hydrology.............................................................................................................. 4Geology and soils ................................................................................................ 5
Water chemistry .......................................................................................................... 8Sampling and analysis .................................................................................... 8Chemical character of spring water ............................................................ 9
Sodium versus chloride ............................................................................ 10Calcium, magnesium, and bicarbonate versus chloride................ 12Sulfate versus chloride.............................................................................. 12
Simulation of reactions ............................................................................................ 13Components and phases of the closed system.......................................... 14Mass-balance reactions .................................................................................... 16Mass-transfer reactions .................................................................................... 17Initial solution composition ............................................................................ 18Results of the mass-transfer calculations .................................................. 19
Predicted reaction path and evolution of solution chemistry...... 19Mineral equilibria........................................................................................ 22Masses transferred...................................................................................... 26
Conclusions .................................................................................................................. 27References cited............................................................................................................ 28
ILLUSTRATIONS
Page
FIGURE 1. Map of study area and springs sampled for chemicalanalysis ......................................................................................... 2
2. Schematic representation of ground-water flow tosprings .......................................................................................... 6
3. Trilinear diagram showing chemical composition ofspring waters .............................................................................. 9
4-8. Scatter diagrams:4. Chloride versus sodium ................................................ 115. Chloride versus calcium .............................................. 136. Chloride versus magnesium. ................................ 147. Chloride versus bicarbonate ...................................... 158. Chloride versus sulfate ................................................ 16
9. Phase diagram of system CaO-Al 2O3-SiO2-H2O at 10° Cand 1 atm pressure...................................................................... 20

IV CONTENTS
FIGURE JQ Diagram showing changes in molality of major species age versus reaction progress...................................................... 21
11 .-12. Scatter diagrams:11. Dissolved sodium versus log K(6) for reverse
reaction 6 ..........................................'.................................... 2512. Dissolved sodium versus saturation index of
calcite .................................................................................... 26
TABLES
Page
TABLE 1. Spring-water sampling sites...................... .................................... 42. Composition of rocks associated with springs in the
southeastern Uinta Basin, Utah and Colorado .................. 73. Mean chemical composition of rainfall and snowmelt
and spring water .......................................................................... 104. Phases considered in chemical mass-transfer calculations 1?5. Summary of coefficients for mass-balance and mass-
transfer reactions........................................................................... 18

GEOCHEMISTRY OF SPRING WATER,SOUTHEASTERN UINTA BASIN, UTAH
AND COLORADO
By BRIANT A. KIMBALL
ABSTRACT
The chemical quality of water in the southeastern Uinta Basin, Utah and Colorado, is important to the future development of the abundant oil-shale resources of the area. This report examines the observed changes in chemistry as water circulates in both shallow and deep ground-water systems. Mass-balance and mass- transfer calculations are used to define reactions that simulate the observed water chemistry in the mixed sandstone, siltstone, and carbonate lithology of the Green River Formation of Tertiary age.
The mass-transfer calculations determine a reaction path particular to this system. The early dominance of calcite dissolution produces a calcium carbonate water. After calcite saturation, deeper circulation and further rock-water interaction cause the reprecipitation of calcite, the dissolution of dolomite and plagioclase, and the oxidation of pyrite; all combining to produce a calcium magnesium sodium bicarbonate sulfate water. The calculations suggest that silica concentrations are controlled by a kaolinite-Ca-montmorillonite phase boundary. Close agreement of mineral-saturation indices calculated by both an aqueous-equilibrium model and the mass-transfer model support the selection of reactions from the mass-transfer calculations.
INTRODUCTION
The potential for developing oil shale in the southeastern Uinta Basin, Utah and Colorado, created the need for studies of the quality and quantity of water in the area. This report, as one product of a comprehensive study of water resources in the basin, treats the changes in the chemical quality of spring water where the chemical character is influenced by water-rock interactions in the Green River Formation of early Tertiary age. An understanding of the spring-water chemistry helps to define the baseline conditions of water quality in the area. The location of the southeastern Uinta Basin and the location of springs sampled for chemical analysis are shown in figure 1. The basic chemical and hydrologic data used in this study are given in Conroy and Fields

SPRING WATER, UINTA BASIN, UTAH AND COLORADO
110°00' 109°30' 109°00'
40°00
R. 16 E. 17 18 19 20 21 22 23 24 R 25 E. R. 103 W 102 R 10f~W.
3 10I
201
30 MILES1
I I 10 10 20 30 KILOMETERS
EXPLANATION
Spring issuing from shallow or in termediate horizon
o Spring issuing from deep horizon
A Letters refer to tables 1 and 2
Boundary of study area
INDEX MAP
FIGURE 1. Location of study area and springs sampled for chemical analysis.

PHYSICAL SETTING a
(1977) and Conroy (1979). The spring-water sampling sites are listed in .table 1.
The comprehensive study of water resources in the southeastern Uinta Basin began in October 1974, in cooperation with the U.S. Bureau of Land Management and the Utah Department of Natural Resources, Division of Water Rights. Springs were sampled semiannually during 1975 and 1976 and monthly from May to September 1977. Fifteen were chosen to represent the types of spring water discharging from the Green River Formation.
Helgeson, Garrels, and Mackenzie (1969) began the application of mass-transfer simulation by digital computer to .the interpretation of spring-water chemistry. Other researchers have also used this approach to account for the solutes in natural waters (Garrels and Mackenzie, 1967; Paces, 1972; Norton, 1974). The computer program of Helgeson (1968) was modified and used to determine a sequence of chemical events that might account for the solutes in the spring water in the southeastern Uinta Basin.
Values given in this report are in metric units. Divide metric units by the conversion factors given below to obtain their inch- pound equivalents.
Metric Unit Conversion Inch-pound Unitfactor
Centimeter (cm) 2.540 Inch (in.) Meter (m) 0.3048 Foot (ft) Millimeter (mm) 25.40 Inch (in.) Square kilometer (km2) 2.590 Square mile (mi2)
Chemical concentration is given in milligrams per liter (mg/L), millimoles per liter (mmol/L), micrograms per liter (ptg/L), or micromoles per liter Gumol/L). Temperature is given in degrees Celsius (°C), which can be converted to degrees Fahrenheit (°F) by the following equation: °F=1.8(°C)+32.
PHYSICAL SETTINGPHYSIOGRAPHY
The southeastern Uinta Basin has an area of approximately 7,770 km2 in Utah and Colorado. The White River and Willow Creek, tributaries of the Green River, drain the southeastern Uinta Basin. These drainages intersect a broad plateau to form benchlike mesas. The altitude of the land surface at its lowest point on the White River is about 1,400 meters above the National Geodetic Vertical Datum of 1929. The land surface gently rises to the south,

SPRING WATER UINTA BASIN, UTAH AND COLORADO
TABLE 1. Spring-water sampling sites
Site (in fig. 1)
Altitude Location 1 (meters above National
Geodetic Vertical Datum of 1929)
Shallow horizon
A................B ................
................ (D-19-19) 36 caa-Sl
.................. (D-18-20)7bad-Sl2,780 2,707
Intermediate horizon
c................E ................H................I.................K................N................0.... ............
.................. (D-16-19)18cbc-Sl
................. (D-15-23)36ddd-Sl
................. . .(D-15-25)8cda-Sl
................. (D-15-20)15bbd-Sl
................. (D-15-25)7bcc-Sl
................ S(C-5-104)36acd-Sl
................ S(C-5-104)27dad-Sl
2,438 2,451 2,341 2,207 2,268 2,536 2,487
Deep horizon
D................F ................G................J ................L ................M ...............
................ T(D-15-21)36adc-Sl
.................. (D-15-23)32bcc-Sl
................. (D-15-24)18cdd-Sl
................. (D-15-25)13bad-Sl
................. (D-15-24)10bcd-Sl
.................. (D-14-24)21ccc-Sl
1,999 2,134 2,280 2,170 2,109 1,999
'See table 7 in Conroy and Fields (1977).
reaching 2,900 meters in the Roan Cliffs at the southern edge of the study area. Willow Creek and the tributaries of the White River trend northerly and have formed steep-walled canyons 150 to 300 meters deep and up to 1,700 meters wide.
CLIMATE
At lower altitudes the climate of the basin is semiarid, with hot, dry summers and occasional intense thunderstorms. Higher altitudes have a subhumid climate. Normal annual precipitation (1931-60) ranges from 150 mm at lower altitudes to 500 mm in the Roan Cliffs to the south (U.S. Weather Bureau, undated). Winters are cold, but snow usually accumulates only at higher altitudes, with subsequent spring runoff from snowmelt. At lower altitudes, in the northern part of the area, a single summer thunderstorm may account for the entire yearly discharge of a small ephemeral stream.
HYDROLOGY
Spring in the southeastern Uinta Basin generally are above an altitude of 1,800 meters. All the springs sampled discharge from the Green River Formation of Eocene age and the Renegade Tougue of

PHYSICAL SETTING 5
the Wasatch Formation of Eocene age. Figure 2 illustrates the three water-bearing horizons from which springs issue. In each of these horizons, springs discharge where channel-form sandstone bodies are cut by drainages. The shallow horizon is in the Horse Bench Sandstone Bed in the Parachute Creek Member of the Green River Formation, the intermediate horizon is in the upper part of the Douglas Creek Member of the Green River, and the deep horizon is in the Renegade Tongue of the Wasatch Formation.
The chemical character, temperature, and discharge of spring water from the shallow horizon vary seasonally. These seasonal variations suggest that the springs represent only local flow of ground water. In contrast, the characteristics of spring water from the deep horizon remain constant throughout the year. That consistency suggests that the springflow in the deep horizon is part of a regional flow system. Flow in the intermediate horizon shows variation between that of the two other horizons.
Recharge from snowmelt to the ground-water system occurs in the Roan Cliffs and along the upper reaches of principal drainages of the perennial streams. Almost all streams are intermittent, flowing only during spring runoff or after summer thunderstorms.
GEOLOGY AND SOILS
The Uinta Basin has been above sea level since the Cretaceous Period (Osmond, 1965). The lower Tertiary sedimentary rocks are mostly river (fluvial) and lake (lacustrine) deposits which gradually filled the basin. The fluvial sedimentary rocks surround the lacustrine sedimentary rocks on all sides. Bradley (1929, p. 88) gave the name Lake Uinta to the lake that deposited the large accumulation of oil shale, marlstone, siltstone, sandstone, and grain-supported carbonate rocks. Many workers have studied the Tertiary sedimentary rocks of the Uinta Basin because of their complex mineralogy and economic deposits (Cashion, 1967; Milton and Eugster, 1959; Bradley, 1929, 1931; Picard, 1955,1957; Wiley, 1967; Byrd, 1970). The stratigraphic descriptions of Cashion (1967) were found to be the most useful for fieldwork during this project.
The Green River Formation crops out in most of the study area. The strata dip to the north, slightly more than the gently rising plateau, so that the entire section of the formation is exposed from north to south. The Douglas Creek Member is the principal unit cropping out in the Roan Cliffs in the eastern half of the area, and to the west the Parachute Creek Member is exposed.
The stratigraphic setting of each spring was studied in the field. Rock samples were collected at each spring and thin sections were

6 SPRING WATER, UINTA BASIN, UTAH AND COLORADO
SOUTH NORTH
EXPLANATION
Water-bearing horizons
Book Cliffs divide Parachute c^ek Member of
* \ \ / Green River Formation
ShallowIntermediateDeep
General direction of ground-water movement
Lower part of Douglas Creek Member of Green River Formation
FIGURE 2. Schematic representation of ground-water flow to springs.
made from these samples. Percentage composition point counts were made on several of the thin sections. Results for selected samples are given in table 2. To accompany these weathered outcrop samples, core chips of unweathered rock were examined. These chips were collected by the Utah Geological and Mineral Survey in a study of oil-impregnated sandstone deposits in the Roan Cliffs area (Peterson, 1973).
Sandstone bodies that discharge spring water in each water bearing horizon have similar mineralogies, but they vary slightly due to the lacustrine and fluvial depositional environments (Picard, 1971). Samples from sites B and I represent the shallow water-bearing horizon and contain the highest amounts of authigenic carbonate cement. This is characteristic of lacustrine sandstone (Picard, 1971, p. 11). All the sandstones are classified as arkose. In each case, the plagioclase is altered to clay minerals, whereas the potassium feldspar is unaltered. This alteration is most evident in the rocks where deep-circulating spring water discharges, as in samples from sites F, K, L, and M, which represent the deep water-bearing horizon. This alteration provides sodium and silica to circulating ground water.
The sample from site C shows the mineralogy of siltstone or silty micrite, which is common to much of the Green River Formation. This siltstone provides much of the calcium, magnesium, and bicarbonate to the spring water. Pyrite was also observed in various stages of alteration. The abundant iron-oxide cement,

PHYSICAL SETTING 7
TABLE 2. Composition of rocks associated with springs in the southeastern Uinta Basin, Utah and Colorado
[Percentage composition of rocks collected during sampling of spring water; minimum of 200 points
counted per thin section. See sample location in figure 1 ]
Sample location
BCFIKLM
Sample location
BCFIKLM
Rock type
Silty micrite2 .........
Arkose 1 .....................
Arkose1 .....................
Rock type
Arkose1 .....................Silty micrite2 .........
Arkose 1 .....................Arkose1 .....................Arkose 1 .....................Arkose1 .....................
IQuartz
...............34
...............47
...............38
...............39
...............40
...............34
...............44
Dolomite
............... 25
................. 1
............... 1
}otassium feldspar
14
1113152014
Clay minerals
8
52
53
Plagioclase
81
12135
109
Iron Oxides
7
12
1111
Coarse mica
1
21
_2
Pyrite
121
1
Calcite
27251323
719
Porosity
1
146
9Q99
7
Classification after Folk, (1974, p. 125-136). "Classification after Folk, (1962, p. 70).
which is often local and surrounds oxidized pyrite, suggests iron and sulfate are released and iron is then reprecipitated.
In the outcrop area, the Douglas Creek Member consists of lacustrine and fluvial sandstone, siltstone, and some algal and oolitic limestone. The amount of sandstone decreases to the northeast (Cashion, 1967, p. 1). The Parachute Creek Member consists mostly of calcareous siltstone and lacustrine sandstone. The amount of sandstone also decreases to the northeast in this member. Evaporite beds, which are present in much of the Green River Formation, are not present in this part of the Parachute Creek Member. Deep canyons along the major tributaries of the White River cut through the fluvial Renegade Tongue of the Wasatch Formation where dominant lithologies are channel-form sandstone and siltstone.
Soils formed on the tops of plateaus are thin and immature, ranging from 0 to 170 cm deep. These soils are mostly shallow channery and flaggy loams containing coarse rock fragments of original rock-forming minerals. Sandy loams, often deeper than 150 cm, develop in the numerous intermittent stream channels throughout the area. All the soils of the study area are calcareous.

8 SPRING WATER, UINTA BASIN, UTAH AND COLORADO
The carbonate often forms a coating on the underside of rock fragments.
The minerology of soils forming on the Green River Formation was determined by X-ray diffraction for 15 samples in the area of T. 10 S., R. 24 E., in Utah (VTN Colorado, Inc., 1977, p. V-9). Quartz and calcite are present in all the soil samples. Feldspar is present in all but six samples. Dolomite was positively identified in only one sample. Montmorillonite (no further identification was given) is reported as an abundant clay mineral in all but one sample. Illite is abundant in two of eight samples where it was found. Kaolinite is present in 10 samples, but abundant in only 2 samples. All these minerals are from the less than 2-micrometer fraction of the soil.
From the X-ray diffraction work it is not possible to determine if the clay minerals are authigenic products of weathering or detrital minerals. In each thin section of sandstone, feldspars were altered to a fine clay, suggesting authigenic formation. However, illite and trioctahedral smectite have been reported as original rock-forming minerals in the Green River Formation (Hosterman and Dyni, 1972, p. D162; Dyni, 1976, p. 5-10). In the higher altitudes where springs discharge, the subhumid climate might result in an increase of the amount of Kaolinite in the soils at the expense of montmorillonite.
WATER CHEMISTRY
SAMPLING AND ANALYSIS
Water samples were collected as near as possible to the source of each spring. Carbonate alkalinity, pH, temperature, and conductance of the water were measured in the field along with spring discharge. Field values of alkalinity were compared with those obtained in the laboratory to detect changes in the water chemistry. A 1-liter sample was collected from each spring in polyethylene bottles, filtered through a 0.45-micrometer membrane filter, and acidified below a pH of 1.5. These samples were used for aluminum analysis by atomic-adsorption spectrophotometry.
Activity coefficients of major species in the spring water were calculated using the computer program WATEQ developed by Truesdell and Jones (1974). The calculated activities were used in diagrammatic evaluations of equilibrium relationships to be discussed below. The separate aluminum analyses were made to provide accurate aluminum concentrations for evaluating aluminosilicate equilibria with the computer program.

WATER CHEMISTRY »
Results of chemical analyses of the spring water sampled for this study are given by Conroy and Fields (1977, table 9) and Conroy (1979, table 8).
CHEMICAL CHARACTER OF SPRING WATER
Springs in the southeastern Uinta Basin discharge water of three different chemical types, and they are illustrated by plotting cation and anion percentages on the trilinear diagram in figure 3. Springs from the shallow horizon discharge a calcium bicarbonate type water, springs from the intermediate horizon discharge a calcium magnesium bicarbonate type water, and springs from the deep horizon discharge a calcium magnesium sodium bicarbonate sulfate type water. The points marked A and B in figure 3 represent the mean chemical character of spring water discharging from the shallow and deep horizons. The chemical compositions for points A and B are shown in table 3, along with the mean chemical composition of rainfall and snowmelt from the southeastern Uinta Basin. These compositions are used to evaluate the geochemical processes that occur during circulation of ground water.
EXPLANATION
Water-bearing horizon t Shallow a Intermediate DeepA Shallow circulating water B Deep circulating water
(Compositions in table 3)
CALCIUM CHLORIDEPERCENT
FIGURE 3. Chemical composition of spring waters.

10 SPRING WATER, UINTA BASIN, UTAH AND COLORADO
TABLE 3. Mean chemical composition of rainfall and snowmelt and spring water[Values are in millimoles per liter unless otherwise indicated; the saturation index, SI, is the ratio of the
ion-activity product to the equilibrium constant]
Component
Sodium (Na) ...............................Potassium (K) ...........................Chloride (Cl) ...............................Sulfate (SO4)Bicarbonate (HCCL )Silica (SiO2)Aluminum (Al), (/umol/L)Total carbon ...............................
pH (units) ...................................S/calcite .......................................S/dolomite ...................................S/chalcedony .............................S/kaolinite..... ..............................
Rainfall and
snowmelt
....... 0.057
....... .008
....... .035
....... .008
....... .022
....... .024
....... .108
....... .003
....... 1.112
....... .303
....... 10.2
....... 6.2
First i increment
1.241.416.043.005.012.122
3.023.127
-.6363.005
Shallow- circulating
spring water (point A in '
fig- 3)
1.298.424.078.013.034.146
3.131.130.482
3.308183
7.7.046
-.509-.1852.8792.223
Second increment
1.4742.1702.621.018.305
3.7721.971.203
-.2222.292
Deep- circulating
spring water (point B in
fig. 3)
2 7722.5942.699
.031
.3393.9185.102.333.260
5.600800
7.4.090.062.226
3.5433.476
Among the major solutes examined in this study, chloride appears to be conservative over the entire range of concentration. The chloride is derived from rainfall and snowmelt and is subsequently concentrated by evaporation. The evaporite beds of the Green River Formation are not present in the recharge area where the three water-bearing horizons crop out in the Roan Cliffs. Thus, by using chloride as a reference, the behavior of other solutes is evaluated graphically. This approach has been used by Smith and Drever (1976) and Eugster (1970, p. 219-221).
SODIUM VERSUS CHLORIDE
Figure 4 shows how sodium varies with chloride. The point labeled S represents the average composition of rainfall and snowmelt from table 3. A line of unit slope, or one-to-one concentration, is drawn from point S showing the path of simple evaporative concentration. If sodium were not added or taken away from the ground water, the points showing spring-water composition would plot along this line. Figure 4 shows that the sodium concentration exceeds that expected from simple evaporative concentration of spring water in all but one sample. The sodium concentration increases slightly in spring water from the shallow horizon and then steadily increases with deeper circulation.

0.5- -
0.0-
z -0.5-
-1.0-
WATER CHEMISTRY
I
11
y=1.56X+1.22 r 2 =0.953
EXPLANATION Chemical composition of
rainfall and snowmelt
Water-bearing horizon
Shallow Intermediate Deep
-1.5 -1.0 -0.5 CHLORIDE, IN LOG MILLIMOLES
FIGURE 4. Scatter diagram of chloride versus sodium.
The trend in figure 4 suggests that some rock-water interaction is active along with the simple evaporative concentration. A reaction of plagioclase feldspar, a rock-forming mineral of the Green River Formation, with a COa-charged water can account for this increase as shown by:2Ca 02Na08Al12Si28O8+2.4CO2+10H2O
= 1.2Al2Si208(OH)4 +1.6Na+ +0.4Ca+ 2 +3.2H4Si04°+2.4HC03 (1)
It appears from figure 4 that this reaction becomes more significant with deeper circulation. Sodium may also come from the dissolution of analcime and exchange reactions with clay minerals, but plagioclase probably is the major source of the ion.

12 SPRING WATER, UINTA BASIN, UTAH AND COLORADO
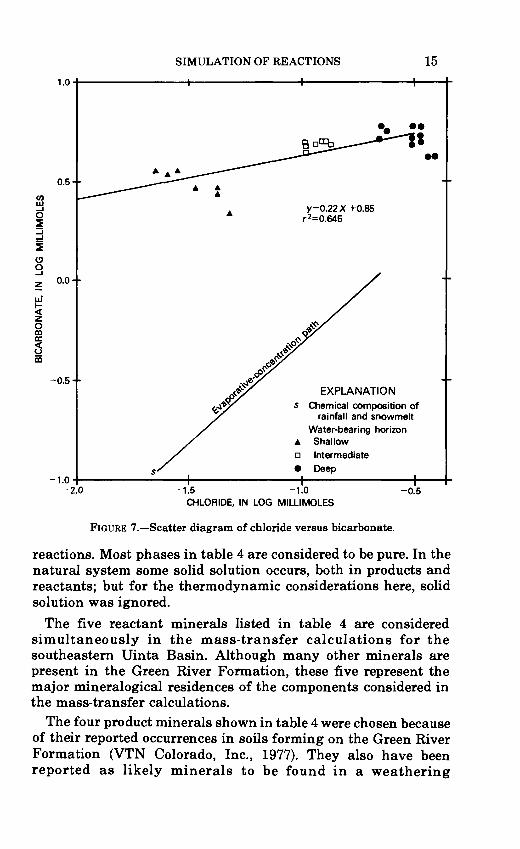
CALCIUM, MAGNESIUM, AND BICARBONATE VERSUS CHLORIDE
Figures 5, 6, and 7 are scatter diagrams relating calcium, magnesium, and bicarbonate, respectively, to chloride. The trend for each of these solutes shows large initial increase in concentration of calcium, magnesium, and bicarbonate with respect to chloride during shallow circulation, followed by an increase of less than unit slope during deep circulation. The trend may be explained by the dissolution and subsequent reprecipitation of carbonate minerals. The reaction of calcite with a CO2-charged water is
CaCO3+CO2+H2O=Ca+2+2HCO3. (2)
A similar reaction may be written for dolomite dissolution,
CaMg(CO3) 2 +2CO2+2H2O=Ca+2+Mg+24HCO3. (3)
The calcite reaction dominates the early circulation, producing the calcium bicarbonate water of shallow circulation. When calcite saturation is reached, the dominant dissolution reaction becomes an incongruent reaction of dolomite dissolution,
CaMg(CO3) 2 +CO2 +H2O=CaCO3 +Mg+2+2HCO3-. (4)
This reaction controls calcium activity. However, calcium does continue to increase slightly by reaction 1 (page 11).
Another source of magnesium in the spring waters may be the trioctahedral smectite described by Dyni (1976).
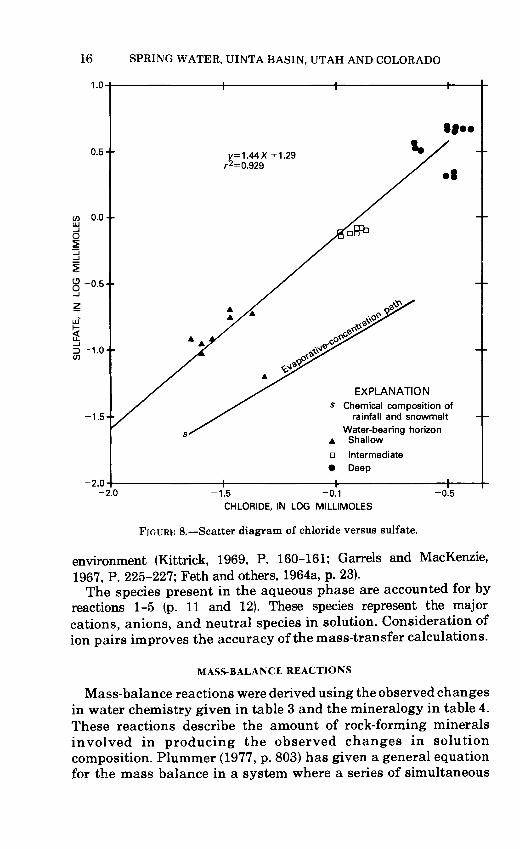
SULFATE VERSUS CHLORIDE
The variation of sulfate with chloride is shown in figure 8. Sulfate variation is similar to that of sodium and suggests a gradual increase beyond that due to evaporative concentration. The principal reaction contributing sulfate to the ground water is
2FeS2+7.5O 2 +4H2O=Fe2O3 +4SO;2 +8H+. (5)
The reaction also is partly responsible for a decrease in pH, which would increase the attack on carbonate and feldspar minerals. The lack of evaporite beds in the recharge areas precludes the contribution of sulfate from the dissolution of gypsum, although some gypsum was found in surface cracks after ground water had evaporated during dry periods. This may subsequently be dissolved and contribute to sulfate in solution.
These observations suggest that there are certain reactions that control the concentrations of the various dissolved solids in the

SIMULATION OF REACTIONS 13
0.5-
o.o-
^ -0.5 +
X=0.32X+0.58 r 2 =0.520
-1.0- EXPLANATION
s Chemical composition of rainfall and snowmelt
Water-bearing horizon A Shallow a Intermediate
Deep
-1.5-2.0 -1.5 -1.0 -0.5
CHLORIDE, IN LOG MILLIMOLES
FIGURE 5. Scatter diagram of chloride versus calcium.
spring water. To determine the importance of these reactions and their effect on one another, a chemical mass-transfer model was used to predict the sequence of chemical reactions that accounts for the observed changes in water chemistry. A description of this chemical mass-transfer model follows.
SIMULATION OF REACTIONSMost weathering reactions in a natural system are irreversible.
For this reason, it is difficult to make quantitative predictions of their behavior. The chemical evolution of snowmelt and rainfall into spring water by water-rock interaction follows some sequence of chemical events that control the dissolved-solid concentrations.

14 SPRING WATER, UINTA BASIN, UTAH AND COLORADO
-0.1 -
-0.7
-1.3-
-1.9--
-2.5 -2:0
y=0.73X+0.82 2 =0.924
EXPLANATION
Chemical composition of rainfall and snowmelt
Water-bearing horizon A Shallow a Intermediate Deep
-1.5 -1.0
CHLORIDE, IN LOG MILLIMOLES
-0.5
FIGURE 6. Scatter diagram of chloride versus magnesium.
Helgeson, Garrels, and MacKenzie (1969) have shown how weathering processes may be evaluated quantitatively with chemical mass-transfer calculations. Their approach treats weathering as a closed system, where a CCVcharged water attacks thermodynamically unstable minerals to produce dissolved solids and stable alteration products. This same approach may be used to describe the changes in the chemical quality of spring water in the southeastern Uinta Basin.
COMPONENTS AND PHASES OF THE CLOSED SYSTEM
The phases considered in the mass-transfer calculations may be described by an 11-component system, CaO-MgCM^O-l&O-AhOa- FeO-SiO2-O2-S2-CO2-H2O. Table 4 summarizes the phases present in the closed system as reactants and products of weathering
1.0
0.5-
UJ
0.0-
m
-0.5
-1.0 -2.0
SIMULATION OF REACTIONS
, I
15
y=0.22X+0.85 r 2=0.645
EXPLANATIONChemical composition of
rainfall and snowmelt Water-bearing horizonShallowIntermediateDeep
-1.5 -1.0 -0.5 CHLORIDE, IN LOG MILLIMOLES
FIGURE 7. Scatter diagram of chloride versus bicarbonate.
reactions. Most phases in table 4 are considered to be pure. In the natural system some solid solution occurs, both in products and reactants; but for the thermodynamic considerations here, solid solution was ignored.
The five reactant minerals listed in table 4 are considered simultaneously in the mass-transfer calculations for the southeastern Uinta Basin. Although many other minerals are present in the Green River Formation, these five represent the major mineralogical residences of the components considered in the mass-transfer calculations.
The four product minerals shown in table 4 were chosen because of their reported occurrences in soils forming on the Green River Formation (VTN Colorado, Inc., 1977). They also have been reported as likely minerals to be found in a weathering
16 SPRING WATER, UINTA BASIN, UTAH AND COLORADO
1.04 I I I-
EXPLANATION S Chemical composition of
rainfall and snowmelt Water-bearing horizon Shallow
-2.0
-2.0 -1.5 -0.1 -0.5
CHLORIDE, IN LOG MILLIMOLES
FIGURE 8. Scatter diagram of chloride versus sulfate.
environment (Kittrick, 1969, P. 160-161; Garrels and MacKenzie, 1967, P. 225-227; Feth and others, 1964a, p. 23).
The species present in the aqueous phase are accounted for by reactions 1-5 (p. 11 and 12). These species represent the major cations, anions, and neutral species in solution. Consideration of ion pairs improves the accuracy of the mass-transfer calculations.
MASS-BALANCE REACTIONS
Mass-balance reactions were derived using the observed changes in water chemistry given in table 3 and the mineralogy in table 4. These reactions describe the amount of rock-forming minerals involved in producing the observed changes in solution composition. Plummer (1977, p. 803) has given a general equation for the mass balance in a system where a series of simultaneous

SIMULATION OF REACTIONS 17
TABLE 4. Phases considered in chemical mass-transfer calculations
Reactant phases
Calcite ............................... CaCOsDolomite ............................. CaMg(CO3)2Plagioclase............................ CaoaNaosAliaSi2sO8Potassium feldspar.................... KAlSiaOsPyrite................................ FeS2Aqueous phase........................ CO2, O2 , H2O
Product phases
Kaolinite .............................Calcium-montmoriUonite ...............Calcite ............................... CaCOsFerric oxide........................... p^OsAqueous phase........................ Ca+ 2 , Mg+ 2 , Na+, K+, H4Si04°,
A1+ 3 , A1(OH)4-, H2C03, HCO-o, S0 4~ 2 , CaSOl, CaHCO£, MgSO MgHCOt, NaSOj, NaHCO°3
equations describe the change in molality of each component. Each equation contains the unknown coefficient of each phase in the system multiplied by the stoichiometric coefficient of a particular component in the phase. If the overall changes in molality are known for each component, and the number of phases equals the number of components, the equations can be solved for the unknown coefficients.
Two mass-balance reactions were determined from the chemical compositions in table 3. The reaction of snowmelt and rainfall with rock and soil minerals to produce the composition of the shallow circulating water involved seven components and phases. The change in molality is given in the column entitled First increment in table 3. The reaction to produce deeper circulating water involved eight components and phases. The reaction coefficients of phases involved in both reactions are given in table 5.
MASS-TRANSFER REACTIONS
The mass-transfer calculations are based on the simultaneous evaluation of mass-balance, charge-balance, and mass-action equations for an aqueous solution. These equations are solved by matrix operations to produce reaction coefficients for each phase in the closed system. The reaction coefficients in turn are used to calculate the change in moles of each component or phase in the system, either positive or negative, during each step of reaction progress. Helgeson (1968,1970) discusses the calculations in detail.

18 SPRING WATER, UINTA BASIN, UTAH AND COLORADO
TABLE 5. Summary of coefficients for mass-balance and mass-transfer reactions[Composition of phases are given in table 4. Values are in millimoles per liter of mineral. Negative
values indicate precipitation; positive values indicate dissolution]
Potassium Reactions Calcite Dolomite Plagioclase feldspar
Mass-balance11 ................2 ................
0.814 -.1753
0.4162.166
0.0543.234
0.005.018
Mass-transferShallow circulation
(point B, figs. 9 and 10).
Deep circulation (point E, figs. 9 and 10).
0.974 0.498 0.065 0.006
-.713 3.807 5.754 .032
Reactions Kaolinite Ca-montmorillonite Pyrite Carbon dioxide
Mass-balance11 .....2 -----
Mass-transfer Shallow circulation
(point B, figs. 9 and 10).
Deep circulation (point E, figs. 9
and 10).
-0.019 2.435
-0.021
-3.7840.0611.384
0.073
0.052-.287
2.891 -3.780 3.311
^Mass-balance reaction 1: Snowmelt and rainfall to shallow-circulating water. Mass-balance reaction 2: Shallow-circulating water to deep-circulating water.
Reactions 1-5 (p. 11, and 12) are given a weighting based on their importance in the mass-balance reactions. For example, table 5 shows that the calcite dissolved in the first mass-balance reaction is almost 2 times the dolomite dissolved and almost 15 times the plagioclase dissolved. Thus, if the calcite were given a stoichiometric coefficient of 1.000, the coefficients for other phases would be 0.511 dolomite, 0.067 plagioclase, 0.006 potassium feldspar, 0.075 pyrite, and 0.064 carbon dioxide.
As the reaction proceeds, saturation is reached with product minerals. A new reaction is incorporated for the precipitation of a new phase by adding an appropriate mass-action equation, and adding the product phase to the mass-balance equations. The effects of different product minerals are discussed below.
INITIAL SOLUTION COMPOSITION
After selecting the appropriate phases for the mass-transfer model, an initial solution composition was chosen. The mean

SIMULATION OP REACTIONS 19
composition of rainfall and snowmelt in table 3 was used for the initial composition of the major ions. Aluminum was given an initial concentration of 30 /ig/L. and silica was given the value of 0.16 mg/L. These values were taken from measured values in Utah (Feth and others, 1964b, table 1). The distribution of species was calculated by WATEQ (Truesdell and Jones, 1974).
Selection of an initial partial pressure of CO2 (PcoJ was °f special concern since the Pco2 , content of soil water is an important variable in determining the total mass transfer in a closed system (Garrels, 1967, p. 406). Studies of soil gases suggest that the Pcc>2 above the zone of saturation may be from 10 to 40 times that of the atmosphere (Garrels and MacKenzie, 1971, p. 141). The increased PC*}, is due to respiration by plant roots and microorganisms and the oxidation of organic matter (Birkeland, 1974, p. 22).
In the southeastern Uinta Basin, low precipitation and sparse vegetation reduce the biogenic contribution to < PCQ, except at the highest altitudes in the Roan Plateau. Thus a PCO-, of 10~24 atm, near 10 times atmospheric PCQ,, was chosen as an initial value. This gives an initial pH of 6.2.
RESULTS OF THE MASS-TRANSFER CALCULATIONS
Reaction paths predicted by the mass-transfer calculations may be plotted on phase diagrams to show the result of reacting aqueous solutions with rock-forming minerals. The phase diagram is one of the most useful ways to treat chemical and thermodynamic information for a system. Helgeson (1969) presents thermodynamic data that facilitate the preparation of these diagrams at temperatures from 0° to 300 °C. The conditions of interest for the weathering processes are 10 °C and 1 atm total pressure.
Although the portrayal of the phase relationships in a 10-component system requires a multi-dimensional phase diagram, the system here is presented diagramatically by using the partial phase diagram in figure 9. Silicic acid activity is chosen as the independent variable because of its role in determining the stable aluminosilicate phase (Hem and others, 1973.)
PREDICTED REACTION PATH AND EVOLUTION OF SOLUTION CHEMISTRY
The reaction path calculated in the 10-component system is shown by the arrows in figure 9, and the changes in molalities of aqueous species with reaction progress are shown in figure 10. From the initial solution composition, the reaction is described by reactions 1-3 and 5 (p. 11 and 12). Saturation is first reached with kaolinite (point A, not shown in fig. 9) while the aqueous solution is

2014
SPRING WATER, UINTA BASIN, UTAH AND COLORADO
d I I I
Ca MONTMORILLONITE
13-
,12
D Reaction path (from mass' transfer calculation
A
A
KAOLINITE
O Point corresponding to mineral saturation
11-
10 -4.0
EXPLANATION
Water-bearing horizon A Shallow
O Intermediate
Deep
Letters refer to mineral equilibria discussed in text
-3.8 -3.6 -3.4 -3.2
LOG [H4SiOj
FIGURE 9. Phase diagram of system CaO-Al2O3- Si0 2-H 20 at 10°C and 1 atm pressure. (Thermodynamic data from Helgeson, 1969, table 12.)
still very dilute. As kaolinite precipitates (segment A-B in fig. 10), the concentration of the dissolved solids increases until saturation is reached with calcite (point B). In the model, the equilibrium constant for aragonite was used for this saturation because springs from the shallow horizon (fig. 2) are generally supersaturated with calcite. As calcite precipitates along with kaolinite from point B to point C, the pH decreases and the activity of calcium remains nearly constant. However, total calcium continues to increase in the aqueous solution, mostly in the form of calcium complexes. The carbonate reaction after point B is described by reaction 4 (p. 12).

SIMULATION OF REACTIONS 21
-8
E F
Letters refer to minera equilibria discussed in text
-5 -4 -3 -2.75 -2.50 LOG TOTAL REACTION PROGRESS
FIGURE 10. Changes in molality of major species versus reaction progress.
At point C, saturation is reached with Ca-montmorillonite. The reaction path is then confined to the phase boundary shown in figure 9 until kaolinite is gone from the system. The reaction that describes this phase boundary is7Al2Si2O5(OH)4+Ca+2 +8H4SiO4°
=6Ca0.i67Al2.33Si3.67010(OH)2+2H++7H20. (6)
Silica acid does continue to increase slightly in this system, and the [Ca+2]/[H+2] ratio decreases.

22 SPRING WATER, UINTA BASIN, UTAH AND COLORADO
This reaction path differs from that found by Helgeson, Garrels, and MacKenzie (1969, p. 462-469). By mixing the weathering of carbonate and silicate phases in this 10-component system the reaction path moves down, rather than up, the kaolinite-Ca- montmorillonite phase boundary. The reprecipitation of calcite decreases the [Ca+2]/[H +2] ratio by increasing Pap2 and consequently decreasing the pH.
Saturation with dolomite is reached at point D. The model was not changed to allow for dolomite precipitation since the kinetics of dolomite precipitation could be prohibitive in a fairly dilute aqueous solution (Berner, 1971, p. 150-152). Thus, the reaction path continues along the phase boundary to point E where the model assumes that kaolinite is gone from the system. The exact location of point E is variable since one may assume an inexhaustible supply of kaolinite as an original rock-forming mineral. However, once kaolinite is gone, the reaction path leaves the phase boundary. Silica concentrations continue to increase until some control of silica solu bility is reached, such as amorphous silica saturation at point F. The continuation of the reaction path after point E is not shown in detail since such high silica concentrations are not observed in these spring waters.
As shown in figure 9, the calculated reaction path closely follows the path suggested by circulating from the shallow to deep horizons. The scatter is likely due to local physical conditions at the individual springs. The observed molalities of water discharged by springs in the shallow horizon are very close to segment B-C, and the molalities of spring water from the deep horizon are close to segment E-F.
MINERAL EQUILIBRIA
The mass-transfer calculations suggest a sequence of mineral equilibria as water quality changes during circulation. The most important equilibria include the saturation with calcite and the reaction of kaolinite to form a Ca-montmorillonite. The state of saturation of shallow-circulating and deep-circulating spring water with respect to the rock-forming minerals in the Green River Formation was determined by WATEQ and is shown as a saturation index (SI) in table 3. Chalcedony was chosen to represent silica minerals. The saturation index equals the ion- activity product for a mineral divided by the equilibrium constant adjusted for temperature for that mineral. When the saturation index for a mineral equals zero, the water is saturated with respect to that mineral. When the value is less than zero, the water is undersaturated; and when it is greater than zero, the water is

SIMULATION OF REACTIONS 23
supersaturated. These equilibria serve to check the predictions of the mass-transfer calculations.
Although there are slight differences in the saturation indices between the chemical-equilibrium and the mass-transfer models, the state of saturation is generally the same for both with respect to the minerals shown in table 3. At calcite saturation (point B in figures 9 and 10), there is slight supersaturation with calcite and undersaturation with dolomite, chalcedony, kaolinite, and Ca- montmorillonite. The aluminum concentrations in the mass- transfer model are strictly controlled by aluminosilicate phases, and thus the saturation indices for kaolinite and Ca- montmorillonite are much closer to zero than in the equilibrium model which uses observed aluminum concentrations. The possible problems with observed aluminum concentrations are discussed below.
At the point representing deep circulation (point E in fig. 10), saturation indices for calcite, dolomite, and chalcedony show slight supersaturation and are very near those found by the equilibrium model. Those for kaolinite and Ca-montmorillonite show supersaturation of two to three orders of magnitude, as do those from the equilibrium model.
The correct saturation index for aluminosilicate minerals depends on the accuracy of the aluminum analyses in water samples. Jones, Kennedy, and Zellweger (1974) compared observed and calculated concentrations of dissolved aluminum in surface waters. They found favorable comparisons by assuming that aluminum concentrations are in equilibrium with specific aluminosilicate minerals. Using the activities calculated by WATEQ, such equilibrium concentrations were evaluated assuming equilibrium with kaolinite and Ca-montmorillonite. The calculated equilibrium concentrations for shallow and deep circulating water in equilibrium with kaolinite are 1.6 and 0.3 Mg/L aluminum, respectively. For shallow and deep circulating water in equilibrium with Ca-montmorillonite, the calculated concentrations are 4.8 and 0.6 Mg/L aluminum, respectively. The mean aluminum concentrations from table 3 are 13 and 7 Mg/L- Possible sources of error in aluminum collection and analysis that could cause these higher values are discussed by Kennedy, Zellweger, and Jones (1974). It is possible that using a 0.45- micrometer filter for these samples did not remove all the particulate matter from the water, and thus they were contaminated with clay minerals. These higher values could also result from supersaturation with respect to aluminosilicate minerals.

24 SPRING WATER, UINTA BASIN, UTAH AND COLORADO
Considering the uncertainties of the aluminum analysis, phase relations expressed without aluminum concentrations are used for graphic evaluation. Figure 11 is a plot of the equilibrium constant for the reverse of reaction 6 (p. 21) against dissolved sodium.
If low sodium values represent early stages of reaction progress, then there appears to be an early trend towards the equilibrium value for the reaction. Once the equilibrium is reached, the observed values tend to stay near that equilibrium value. The average equilibrium value of the springs from the intermediate and deep horizons is 10~16-33 whereas the calculated value from the data of Helgeson (1969, table 12) is 10~16 47. One would expect the values to vary considerably since the expandable clay product does not have the ideal formula used in the thermodynamic calculation. Even with this variation there is a considerable agreement with the predicted value, suggesting that the reaction of kaolinite to an expandable clay could control some ion activities in the spring water. The average value for water from springs discharging from the deep horizon is 10~1567, and this suggests that the deeper- circulating water has departed from the kaolinite-montmorillonite phase boundary.
Two comments about figure 11 are necessary. First, the activity product on the ordinate depends on silica concentrations to the eighth power. Jones and Bowser (1979, p. 206-207) have pointed out that such an apparent trend toward equilibrium may be due to some other control on silica. The saturation index for chalecedony in table 3 shows slight supersaturation in the waters deeper circulation. This is the only silica mineral close to saturation, and it may exert some control. The precipitation of quartz overgrowths may indicate such a control by a silica mineral.
Second, the kinetics of montmorillonite formation may prohibit the actual precipitation of this phase (B. F. Jones, oral commun., 1979). It is possible that surface reactions on the detrital montmorillonite provide the same aqueous control of aluminum and silica that would result from authigenic precipitation. Such a process has been proposed for silica removal from ocean waters (MacKenzie and others, 1967; Siever and Woodford, 1973; Maynard, 1975). The observed trend here may also be similar to the control of aluminum and silica by some metastable aluminosilicate as suggested by Paces (1978).
Considering these possibilities, reaction 6, (p. 21) which was modeled by the mass-transfer program, is only one possible explanation for the control of aluminum and silica. No independent evidence for the formation of an authigenic Ca-

-15'
SIMULATION OF REACTIONS 25 I I I
-15.67 average of deeper circulating water
-16-
-16.47 from thermodynamic data of Heigeson (1968, table 12)
-17-
-18- -
EXPLANATION-19- A Water-bearing horizon
4 A Shallow
D Intermediate
Deep
-20
20 40 60 80 100 DISSOLVED SODIUM, IN MILLIGRAMS PER LITER
FIGURE 11. Scatter diagram of dissolved sodium versus log K(6) for reversereaction 6.
montmorillonite was found since the X-ray diffraction data were not definitive.
The saturation indices for calcite are plotted in figure 12. The saturation indices for calcite are within ±0.5 of saturation. Saturation indices for dolomite are not plotted, but they show a similar trend toward supersaturation. There is generally an early trend toward saturation in spring water from the shallow horizon and then a trend around saturation for both carbonate minerals with continued reaction progress.
The changes in chemical quality of spring water indicated by the data in table 3 are evident in figures 10-12. The early dominance of

26 SPRING WATER, UINTA BASIN, UTAH AND COLORADO
1.0
SUPERSATURATION
0.5-
Q 0
A 0.168 average of deeper circulating waterA ___ ______________ *_ -_*__. A n a
i Da
A
A
SATURATION
-0.5 - - UNDERSATURATION
-1.0
20 40 60 80 100 DISSOLVED SODIUM, IN MILLIGRAMS PER LITER
FIGURE 12. Scatter diagram of dissolved sodium versus saturation index of calcite.
calcium and bicarbonate is due to the dissolution of calcite. In later stages of the weathering process, calcite equilibrium controls the activity of calcium while sodium and magnesium become dominant cations. The pH of circulating spring water decreases with continued rock-water interaction because of pyrite oxidation and the increase of Pco2 from reprecipitation of calcite.
MASSES TRANSFERRED
The computer calculations provided a basis for evaluating the chemical weathering in the southeastern Uinta Basin. Mass of reactants destroyed and products formed were determined at each

CONCLUSIONS 27
step of the mass-transfer calculations. To evaluate chemical weathering, it is necessary to choose a point of reaction progress which describes the observed mineralogy of the soil and the determined concentration of dissolved solids in the spring water.
A summary of mass-transfer coefficients is given in table 5. These values, which are given in millimoles per liter of minerals produced and consumed, may be compared to the mass-balance coefficients given in table 5. Note the good agreement between mass-balance reaction 1 (p. 11) and the masses transferred during shallow circu lation. There was poorer agreement with the deeper circulating springs and mass-balance reaction 2 (p. 12). The aluminosilicate products agree closely, but some reactant minerals differ in the masses transferred. This points out that different solutions are ob tained when considering a larger system, since the mass-transfer calculations considered 10 components and 25 to 29 unknowns, whereas the mass-balance calculations considered only 8.
CONCLUSIONS
Spring water in the southeastern Uinta Basin discharges from three principal water-bearing horizons; the first represents local shallow circulation, the second represents intermediate circulation, and the third represents regional deep circulation. The chemical character of spring water changes from a calcium bicarbonate type during shallow circulation to a calcium magnesium sodium bicarbonate sulfate type during deep circulation.
A chemical mass-transfer model was used to follow changes in water chemistry. The sequence of chemical events which produce this chemical character includes saturation of the aqueous solution with kaolinite at an early stage of reaction progress, then saturation with calcite and Ca-montmorillonite. The concentrations of aqueous species are controlled by these mineral equilibria; however, in the case of silica it was not possible to determine an exact controlling reaction.
Modeling by the chemical mass-transfer approach is useful in studying water chemistry in a mixed lithologic setting. The prediction of a sequence of chemical events allows one to understand the changes that occur in the chemical character of the water. The modeling results are encouraging and suggest that the mass-transfer approach may be useful in evaluating other lithologic settings.

28 SPRING WATER, UINTA BASIN, UTAH AND COLORADO
REFERENCE CITED
Berner, R.A., 1971, Principles of chemical sedimentology: New York, McGraw-Hill, 240 p.
Birkeland, P. W., 1974, Pedology, weathering, and geomorphological research: New York, Oxford University Press, 285 p.
Bradley, W. H., 1929, The varves and climate of the Green River epoch: U.S. Geological Survey Professional Paper 158-E, p. 85-110.
__1931, Origin and microfossils of the oil shale of the Green River Formation of Colorado and Utah: U.S. Geological Survey Professional Paper 168, 58 p.
Byrd, W.D., 1970, P.R. Spring oil-impregnated sandstone deposit, Uintah and Grand Counties, Utah: Utah Geological and Mineral Survey Special Studies 31, 34 p.
Cashion, W. B., 1967, Geology and fuel resources of the Green River Formation, southeastern Uinta Basin, Utah and Colorado, U.S. Geological Survey Profes sional Paper 548, 48 p.
Conroy, L. S., 1979, Hydrologic and climatologic data, southeastern Uinta Basin, Utah and Colorado, water year 1977: U.S. Geological Survey Open-File Report 79-1493 (duplicated as Utah Hydrologic-Data Report 33), 191 p.
Conroy, L. S., and Fields, F. K., 1977, Climatologic and hydrologic data, south eastern Uinta Basin, Utah and Colorado, water years 1975 and 1976: U.S. Geological Survey Open-File Report (duplicated as Utah Basic-Data Release 29), 244 p.
Dyni, J. R., 1976, Trioctahedral smectite in the Green River Formation, Duchesne County, Utah: U.S. Geological Survey Professional Paper 967, 14 p.
Eugster, H. P., 1970, Chemistry and origin of the brines of Lake Magadi, Kenya: Mineralogical Society of America Special Paper No. 3, p. 213-235.
Feth, J. H., Roberson, C. E., and Polzer, W. L., 1964a, Sources of mineral consti tuents in water from granitic rock, Sierra Nevada, California and Nevada: U.S. Geological Survey Water-Supply Paper 1535-1, 70 p.
Feth, J. H., Rogers, S. M., and Roberson, C. E., 1964b, Chemical composition of snow in the northern Sierra Nevada and other areas: U.S. Geological Survey Water- Supply Paper 1535-J, 39 p.
Folk, R. L., 1962, Spectral subdivision of limestone types, in Ham, W. E., ed., Classification of carbonate rocks: American Association of Petroleum Geolo gists Memoir No. 1, p. 62-84.
__1974, Petrology of sedimentary rocks: Austin, Texas, Hemphill Publishing Co., 182 p.
Garrels, R. M., 1967, Genesis of some ground waters from igneous rocks, tnAbelson, P. H., ed., Researches in geochemistry, v. 2, New York, John Wiley, p. 405-420.
Garrels, R. M. and Mackenzie, F. T., 1967, Origin of the chemical composition of some springs and lakes, in Equilibrium concepts in natural water chemistry: American Chemical Society Advances in Chemistry Series, v. 67, p. 222-242.
__1971, Evolution of sedimentary rocks: New York, Norton, 397 p.Helgeson, H. C., 1968, Evaluation of irreversible reactions in geochemical processes
involving minerals and aqueous solutions I. Thermodynamic relations: Geo- chimica et Cosmochimica Acta, v. 32, p. 853-877.
__1969, Thermodynamics of hydro thermal systems at elevated temperatures and pressures: American Journal of Science, v. 267, p. 729-804.
Helgeson, H. C., 1970, Description and interpretation of phase relations in geochemical processes in aqueous solutions: American Journal of Science, v. 268, p. 415-438.

REFERENCES CITED 29
Helgeson, H. C., Garrels, R. M., and Mackenzie, F. K., 1969, Evaluation ofirreversible reactions in geochemical processes involving minerals andaqueous solutions II. Applications: Geochimica et Cosmochimica Acta, v. 33,p. 455-481.
Hem, J. D., Roberson, C. E., Land, C. T., Polzer, W. L., 1973, Chemical interactions ofaluminum with aqueous silica at 25°C: U.S. Geological Survey Water-SupplyPaper 1827-E, 57 p.
Hosterman, J. W., and Dyni, J. R., 1972, Clay mineralogy of the Green RiverFormation, Piceance Creek Basin, Colorado A preliminary study, in Geolo gical Survey Research 1972: U.S. Geological Survey Professional Paper 800-D,p. D159-D163.
Jones, B. F., and Bowser, C. J., 1979, The mineralogy and related chemistry of lakesediments, in Lakes: Chemistry, geology, physics, A. Lerman, ed.; New York,Springer Verlag, p. 179-235.
Jones, B. F., Kennedy, V. C., and Zellweger, G. W., 1974, Comparison of observedand calculated concentrations of dissolved Al and Fe in stream water: WaterResources Research, v. 10, p. 791-793.
Kennedy, V. C., Zellweger, G. W., and Jones, B. F., 1974, Filter pore-size effects onthe analysis of Al, Fe, Mn, and Ti in water: Water Resources Research, v. 10, p.785-790.
Kittrick, J. A., 1969, Soil minerals in the AlzOs-SiOa-HzO system and a theory oftheir formation: Clays and Clay Minerals, v. 17, p. 157-167.
Mackenzie, F.T., Garrels, R.M., Bricker, O.P., and Bickley, Frances, 1967, Silica insea water: Control by silica minerals: Science, v. 155, p. 1404-1405.
Maynard, J. B., 1975, Kinetics of silica adsorption by kaolinite with application toseawater chemistry: American Journal of Science, 275, p. 1028-1048.
Milton, C., and Eugster, H. P., 1959, Mineral assemblages of the Green RiverFormations, in Abelson, P.H., ed., Researches in Geochemistry: New York,John Wiley, p. 118-150.
Norton, Denis, 1974, Chemical mass transfer in the Rio Tanama system, west- central Puerto Rico: Geochimica et Cosmochimica Acta, v. 38, p. 267-277.
Osmond, J. C., 1965, Geologic history of site of Uinta Basin, Utah: Bulletin of theAmerican Association of Petroleum Geologists, v. 49, n. 11, p. 1957-1973.
Paces, T., 1972, Chemical characteristics and equilibration in natural water-felsicrock-COa system: Geochimica et Cosmochimica Acta, v. 36, p. 217-240.
__1978, Reversible control of aqueous aluminum and silica during theirreversible evolution of natural waters: Geochimica et Cosmochimica Acta, v.42, p. 1487-1493.
Peterson, P.R., 1973, Lithologic logs and correlation of core holes, P.R. Spring andHill Creek oil-impregnated sandstone deposits, Uintah County, Utah: Utah.Geological and Mineral Survey Report of Investigation 100, 30 p.
Picard, M. D., 1955, Subsurface stratigraphy and lithology of the Green RiverFormation: Bulletin of the American Association of Petroleum Geologists, v.39, p. 75-101.
__1957, Criteria for distinguishing lacustrine and fluvial sediments in Tertiarybeds of Uinta Basin, Utah: Journal of Sedimentary Petrology, v. 27, p. 373-377.
__1971, Petrographic criteria of recognition of lacustrine and fluvial sandstone,P. R. Spring oil-impregnated sandstone area, southeast Uinta Basin, Utah:Utah Geological and Mineral Survey Special Studies 36, 24 p.
Plummer, L. N., 1977, Defining reactions and mass transfer in part of the Floridan aquifer: Water Resources Research, v. 13, n. 5, p. 801-812.

30 SPRING WATER, UINTA BASIN, UTAH AND COLORADO
Siever, R., and Woodford, W., 1973, Sorption of silica by clay minerals: Geochimicaet Cosmochimica Acta, v. 37, p. 1851-1880.
Smith, C. L., and Drever, J. I., 1976, Controls on the chemistry of springs at TeelsMarsh, Mineral County, Nevada: Geochimica et Cosmochimica Acta, v. 40, p.1080-1093.
Truesdell, A. H., and Jones, B. F., 1974, WATEQ, a computer program forcalculating chemical equilibria of natural waters: Journal of Research of theU.S. Geological Survey, v. 2, no. 2, March-April 1974, p. 233-248.
U.S. Weather Bureau, undated, Normal, annual and May-September precipitation(1931-60) for the State of Utah: Map of Utah, scale 1:500,000.
VTN Colorado, Inc., 1977, Final environmental baseline report: Federal PrototypeOil Shale Leasing Program Tracts U-a and U-b, Utah: White River ShaleProject, Vernal, Utah.
Wiley, D. R., 1967, Petrology of bituminous sandstones in the Green RiverFormation, southeastern Uinta Basin, Utah: Unpublished M.S. thesis, Uni versity of Utah, 69 p.
IS GOVERNMENT PRINTING OFFICE 198