geocoding tutorial using google fusion tables · pdf filegeocoding tutorial using google...
TRANSCRIPT

Geocoding Tutorial using Google Fusion Tables
Geocoding involves assigning latitude and longitude coordinates to an item described in terms of its postal address. There are different ways to geocode. This tutorial will describe how to geocode a set of Canadian addresses and displaying them on a google map using Google Fusion Tables. Note: To use Google Fusion Tables you must have a Google Account. If you do not have one, but would like to create one, you can follow this link: https://accounts.google.com/NewAccount Your data should be formatted so that you have one column for the entire address. Google Fusion Tables will use the left-most column data to geocode. If you have address data in multiple columns, you can easily combine them in Excel.
1. Our example is a list of community centres in Toronto. You can download it from http://maps.library.utoronto.ca/datapub/helpsheets/communitycentres.xls. In our example we have all files saved to C:\Test\GeocodingExample2. The spreadsheet has names of community centres and their addresses, one per row:

2. The address data in our example is not all in the same column. To
combine it, insert a new column to the left of the Address column by clicking once on column B to highlight it, and then right clicking on it and selecting Insert.
3. Give the new column B a descriptive name. For our example, we will use FullAddress.

4. Next, we will use Excel’s concatenate function to merge all the address
information together into one column. Click in cell B2, type in the formula box =concatenate(C2, “ “, D2, “ “, E2, “ “, F2) and hit Enter.
5. Click once in cell B2 again and then double click on the small black box that appears on the bottom right corner of the cell. This will automatically copy that formula down the column for all the rows with data.

6. Now column B should have the complete address for each community
centre.
7. Next, go to the Chrome Web Store and search for Fusion Tables: https://chrome.google.com/webstore/category/apps

8. Click on Add to Chrome. This will open a new tab showing all
downloaded Chrome apps.
9. Click on the Fusion Tables icon. It will then prompt you to log into your Google Account. Once you log in, it will bring you to the Import new table dialogue.
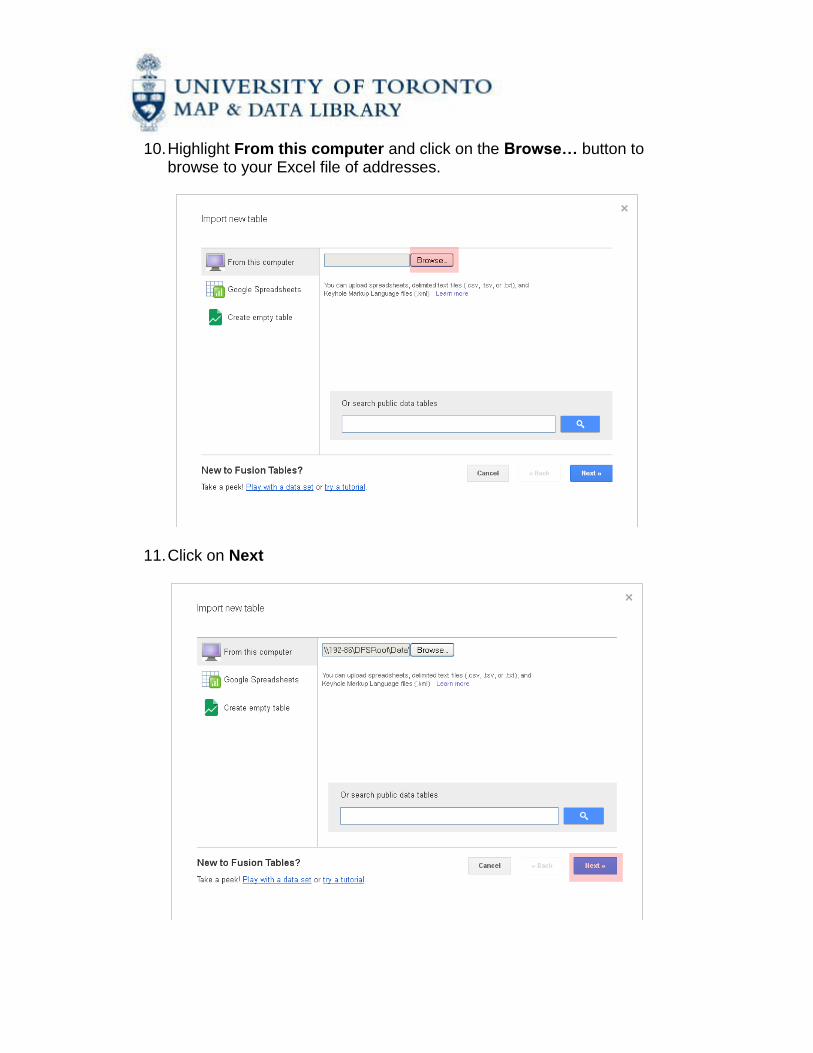
10. Highlight From this computer and click on the Browse… button to
browse to your Excel file of addresses.
11. Click on Next
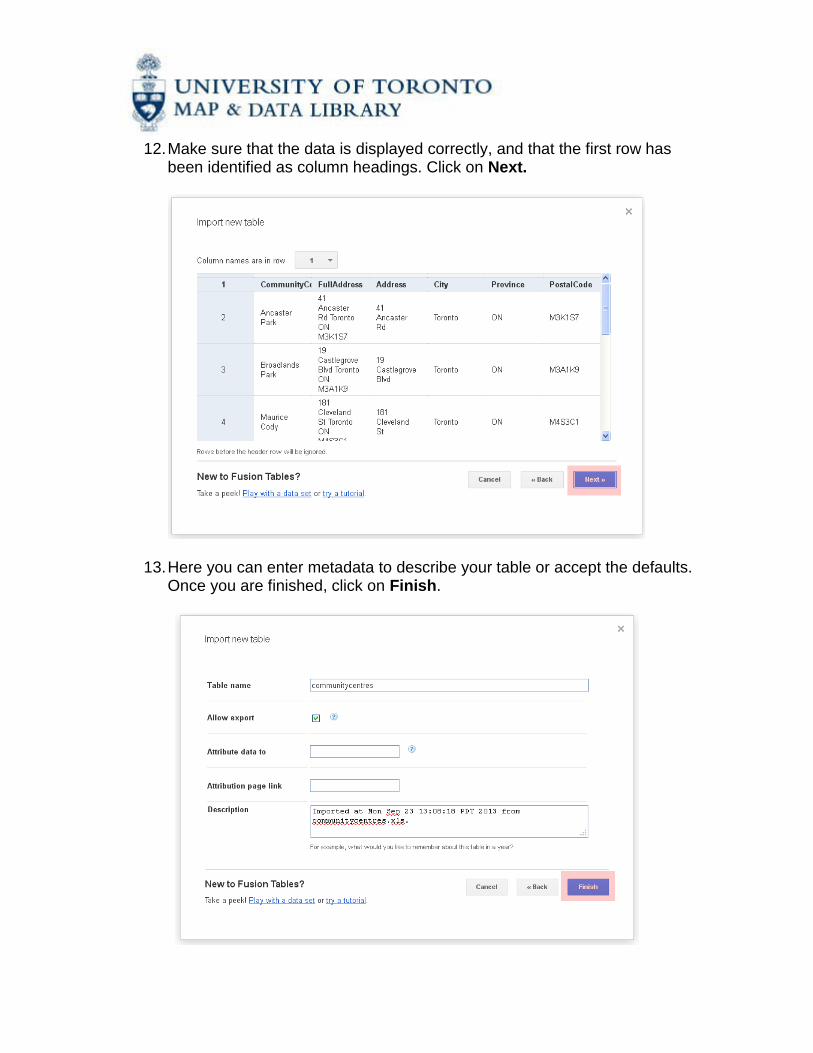
12. Make sure that the data is displayed correctly, and that the first row has
been identified as column headings. Click on Next.
13. Here you can enter metadata to describe your table or accept the defaults. Once you are finished, click on Finish.

14. Once it imports the data, it will display the table and highlight what column it thinks has the address information. Verify that the FullAddress column is highlighted.
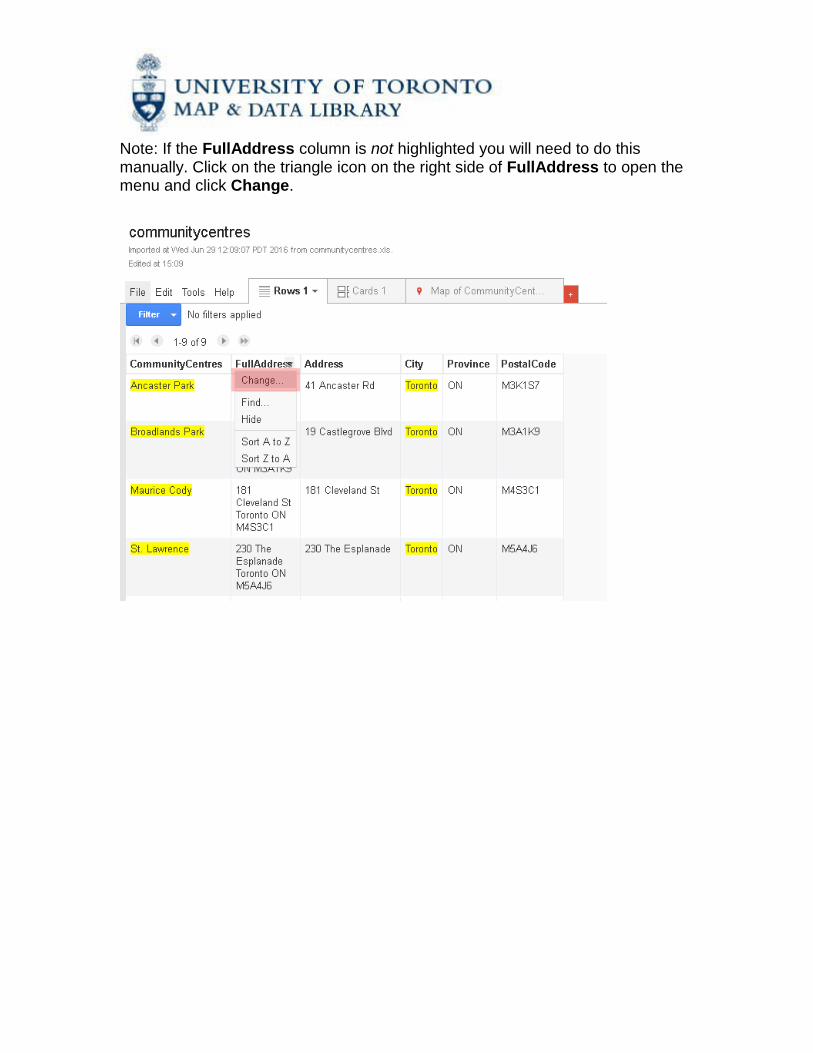
Note: If the FullAddress column is not highlighted you will need to do this manually. Click on the triangle icon on the right side of FullAddress to open the menu and click Change.
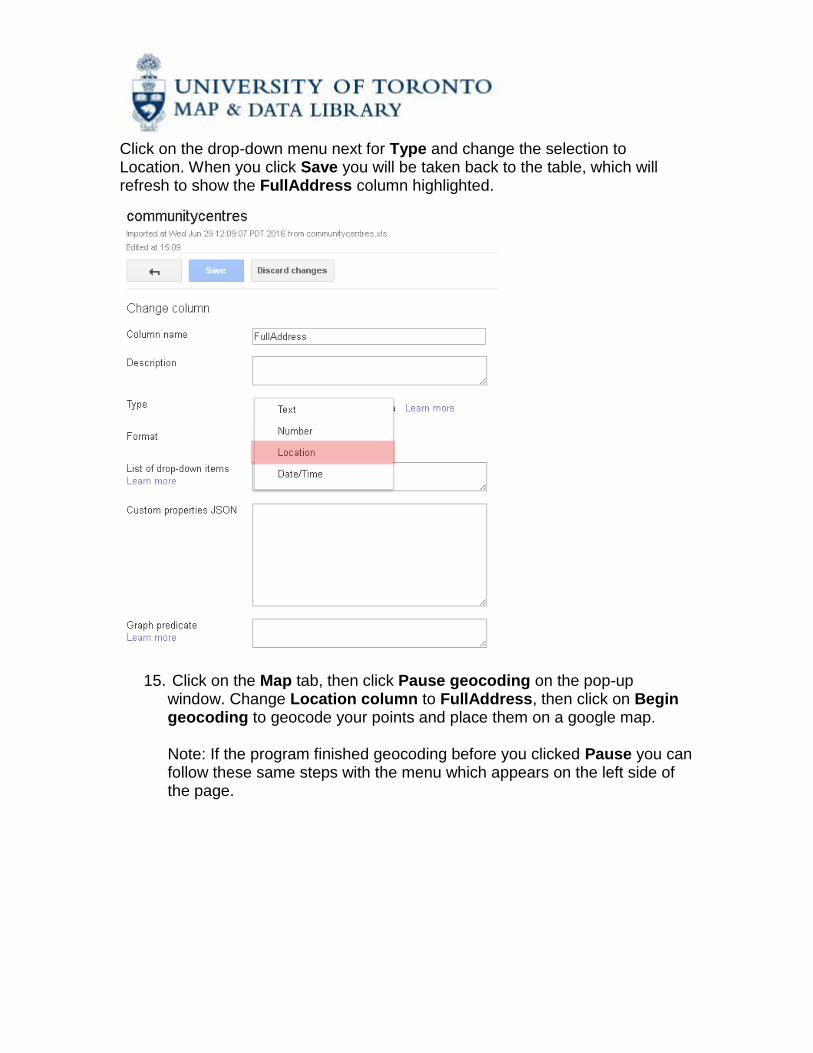
Click on the drop-down menu next for Type and change the selection to Location. When you click Save you will be taken back to the table, which will refresh to show the FullAddress column highlighted.
15. Click on the Map tab, then click Pause geocoding on the pop-up
window. Change Location column to FullAddress, then click on Begin geocoding to geocode your points and place them on a google map. Note: If the program finished geocoding before you clicked Pause you can follow these same steps with the menu which appears on the left side of the page.

16. Click on the Map tab again, and under select location select FullAddress. Now the community centers of Toronto should be properly displayed on the map. Your map may be zoomed out, so use the controls on the far left to zoom in, by clicking on the plus sign icon, and to pan to the correct spot on the map, by using the up/down/left/right pan icon.

17. Once you have zoomed in to the correct location, your map should look like the example below, and by clicking on one of the red points, you will be able to see all the information in your table regarding that location.
18. You can export your map to a KML file by clicking on the File tab and then selecting Download. Select KML as the format.

19. You will be prompted to save the file or open it up in Google Earth.
20. With a KML file representing your map you can save it, work with it using Google Earth, embed it in a webpage, or link to it from your own website. See this link for more information: http://code.google.com/apis/kml/documentation/kml_tut.html
21. For more information about Google Fusion Tables go to
http://www.google.com/fusiontables/public/tour/index.html
If you have any questions or comments, please contact us at [email protected].
Map & Data Library, University of Toronto – http://mdl.library.utoronto.ca October 2013