geodetic and seismic constraints on recent activity...
TRANSCRIPT

Geodetic and seismic constraints on recent activity at Long ValleyCaldera, California: evidence for viscoelastic rheology
A.V. Newmana, T.H. Dixonb,*, G.I. Ofoegbuc, J.E. Dixonb
aDepartment of Geological Sciences, Northwestern University, 1847 Sheridan Road, Evanston, IL 60208, USAbRosenstiel School of Marine and Atmospheric Science, University of Miami, 4600 Rickenbacker Causeway, Miami, FL 33149, USA
cSouthwest Research Institute, 6220 Culebra Road, San Antonio, TX 78228-0510, USA
Received 5 November 1998; accepted 20 August 2000
Abstract
Long Valley Caldera is an active volcanic region in east central California. Surface deformation on the resurgent dome within
the caldera was an order of magnitude higher for the ®ve-month period September 1997 through January 1998 compared to the
previous three-year average. However, the location of the immediate (shallow) source of deformation remained essentially
constant, 5±7 km beneath the dome, near the top of a region of probable magma accumulation de®ned by seismic data.
Similarly, although the rate of seismic moment release increased dramatically, earthquake locations remained similar to earlier
periods. The rate of deformation increased exponentially between April±May 1997 and late November 1997 with a time
constant of ,55±65 days, after which it decreased exponentially with about the same time constant. We develop a model
consistent with these observations and also consistent with independent constraints on sub-surface rheology from thermal,
geochemical and laboratory data. Deformation at sites on the resurgent dome most sensitive to the shallow deformation source
are well ®t by a model with a single pressure source at 6 km depth which experienced a pressure pulse that began in late 1996,
peaked in November 1997, close to the time of major seismic moment release, and essentially ended in mid-1999. The pressure
source in our model is surrounded by a 1 km thick ªshellº of Maxwell viscoelastic material (shell viscosity 1016 Pa s) within an
elastic half space, and has peak values that are much lower than corresponding purely elastic half space models. The shell
viscosity is characteristic of a weak, deformable solid, e.g. quartz-bearing country rock surrounding the magma chamber at
temperatures in the range 500±6008C, i.e. above the brittle±ductile transition, and/or largely crystallized rhyolite near its
solidus temperature of ,6708C, material that probably exists near the top of the zoned magma chamber at Long Valley. q 2001
Elsevier Science B.V. All rights reserved.
Keywords: Long Valley Caldera; viscoelastic rheology; geodetic constraints
1. Introduction
Geodetic data describing surface deformation on
active volcanoes can be used to infer the size and
shape of magmatic ªplumbing systemsº at depth,
and if available in a timely manner, may also be useful
for eruption warning. However, relating strain or
displacement at the surface to stress or pressure
sources at depth requires assumptions about the
rheology of intervening material. This re¯ects the
non-uniqueness of surface deformation data and
the inherent tradeoff between source pressure,
rheology and other factors. It also suggests the
importance of using extra information to help
constrain the problem. If the assumed rheology is a
Journal of Volcanology and Geothermal Research 105 (2001) 183±206
0377-0273/01/$ - see front matter q 2001 Elsevier Science B.V. All rights reserved.
PII: S0377-0273(00)00255-9
www.elsevier.nl/locate/jvolgeores
* Corresponding author. Fax: 11-305-361-4632.
E-mail address: [email protected] (T.H. Dixon).

poor representation of reality, deformation data may
®t a given model, but inferences about the processes
of interest may be wrong.
Most volcano deformation models published to
date assume that the earth's crust behaves as a
perfectly elastic solid. While elastic half space models
®t a variety of crustal deformation data, this rheology
is an oversimpli®cation, and may be an especially
poor choice for volcanoes, depending on data type,
volcano type, and eruption history. The elastic
approximation is generally appropriate for small
deformations of crustal materials with temperatures
cooler than the brittle±ductile transition, about 300±
5008C depending mainly on composition and strain
rate. Thus, elastic behavior characterizes the upper
10±15 km of the earth's crust in most non-volcanic
regions. However, in active volcanic zones, magma at
relatively shallow crustal levels can perturb the
geothermal gradient signi®cantly. Plastic, viscous, or
viscoelastic behavior is more likely to characterize the
upper crust near a magmatic center, and can greatly
in¯uence the surface deformation ®eld, rendering the
elastic approximation inappropriate. Bonafede et al.
(1986) and Dragoni and Magnanensi (1989) describe
volcano deformation models involving viscoelastic
behavior. In this paper we apply the results of these
pioneering theoretical studies to data from a recent
deformation episode at Long Valley caldera in east-
central California.
Long Valley Caldera has experienced seismicity
and surface deformation well above background
levels since 1979. The most active period in the last
century was the initial (1979±1980) in¯ation episode,
with moderately high activity in 1980±1983,
A.V. Newman et al. / Journal of Volcanology and Geothermal Research 105 (2001) 183±206184
Fig. 1. Sketch map of deformation and seismicity at Long Valley Caldera in eastern California (inset shows location) for two different time
periods, color-coded. Geodetic sites CASA and KRAK on central resurgent dome shown as triangles. Deformation rate (arrows with 95%
con®dence ellipses) and seismicity scaled by magnitude (®lled circles) shown for low activity period in green (October 1 1994±June 30 1997)
and high activity period in red (July 1 1997±December 31 1998). Dashed lines show the projected intersection point for the GPS data. Open
circle between CASA and KRAK shows location and 95% con®dence limits of shallow deformation source for the period 1989±1992 described
by Langbein et al. (1995). Seismic data were collected and analyzed by the Northern California Earthquake Data Center.

1989±1990 (Hill et al., 1991; Langbein et al., 1993,
1995) and the most recent phase of unrest in mid- and
late 1997. This activity almost certainly re¯ects intru-
sion of basaltic magma from the upper mantle and/or
lower crust into the middle and upper crust (Dvorak
and Dzurisin, 1997; Battaglia et al., 1999). Here we
examine this recent phase of unrest, interpret it in the
context of a model that incorporates viscoelastic
rheology near the magma chamber, and show that
the predictions of such a model in terms of rheological
conditions near the magma chamber are broadly
consistent with independent constraints based on ther-
mal and geochemical data from Long Valley and
laboratory data on the material properties of quartz-
bearing upper crustal rocks.
2. Deformation and seismic data
The deformation data come from two continuously
recording GPS stations (CASA, KRAK) separated by
about 8 km and spanning the resurgent dome (Dixon
et al., 1997), and two-color EDM data from the same
locations (Langbein et al., 1995) (Fig. 1). The GPS
data were analyzed at the University of Miami's
Geodesy Laboratory following Dixon et al. (1997).
Brie¯y, we used the GIPSY software and precise
satellite ephemerides provided by the Jet Propulsion
Laboratory (Zumberge et al., 1997), analyzing our
data in the ITRF-96 reference frame (Sillard et al.,
1998). The EDM system is described by Langbein
(1989). Previous geodetic studies (Langbein et al.,
1993, 1995) have addressed spatial variation in the
deformation ®eld based on a variety of geodetic
data, placing tight constraints on the location and
shape of several deformation sources, including a
shallow (5±7 km depth) source of deformation north-
west of CASA and southwest of KRAK. Below we
argue that the location of this shallow source did
not change appreciably during the recent phase of
deformation, although the rate of deformation
increased markedly over a roughly six-month period.
Here we focus on the time-varying aspects of recent
deformation associated with the shallow source, well
represented by the vector data from the two
continuous GPS stations, and the more precise but
scalar two-color EDM data from the same locations.
More extensive two-color EDM data from other
locations show a similar pattern of time variation at
sites closest to the resurgent dome (Langbein,
personal communication and http://www.usgs.gov/
QUAKES/geodetic/twocolor/longvalley.html), but
the amplitude of the time-varying signal is largest at
CASA and KRAK, making data from these sites ideal
for this study.
Seismic event locations and magnitudes were
retrieved from the Northern California Earthquake
Data Center (http://quake.geo.berkely.edu). The
earthquake magnitudes are reported as a combination
of coda, local and maximum amplitude magnitudes
(Mcoda, M1 and MMamp). We converted them to seismic
moment, M0, using an empirical formula for conver-
sion from surface wave magnitude Ms (Hanks and
Kanamori, 1979):
log10 M0 � 1:5Ms 1 16:1 �1�modi®ed for SI units (N m). Earthquakes in the
region represent both volcanic and tectonic sources
(e.g. Stroujkova and Malin, 2000), thus determination
of seismic moment is not straightforward. The
conversion given above was developed for non-
volcanic regions, and could yield biased moment
estimates for Long Valley. However, for the small
magnitude earthquakes under consideration, the
differences are not signi®cant, and also have essen-
tially no effect on our estimate of the rate of cumula-
tive moment growth with time, our main concern here.
A map view of seismic data and the horizontal
components of the GPS site velocities at CASA and
KRAK relative to the stable Sierra Nevada block
(Fig. 1) and a vertical section through these sites
(Fig. 2) are shown for two periods: October 1994
(beginning of deformation measurements at KRAK)
to June 30, 1997 (roughly the beginning of enhanced
activity) and July 1, 1997 to December 31, 1997
(roughly the period of high activity). The rate of
deformation for the latter period is about one order
of magnitude higher than the former (see also the
average slopes for the different time periods on the
position versus time plot for station CASA in Fig. 3).
For the one-year period from July 1, 1997 to June 30,
1998, the elevation of CASA increased by about 7 cm,
compared with about 1 cm for the previous 12-month
period. Prior to that, elevation increased by about
2 cm/yr from 1994 to 1996. CASA lies about 5 km
southeast of the center of maximum uplift for the
A.V. Newman et al. / Journal of Volcanology and Geothermal Research 105 (2001) 183±206 185

resurgent dome (Langbein et al., 1995; Dvorak and
Dzurisin, 1997). Uplift rates at this center location are
about a factor of two higher compared to CASA.
Adding this latest phase of uplift to previously
measured uplift from leveling at this location (Dvorak
and Dzurisin, 1997) indicates that from inception of
uplift sometime after 1975 (probably 1979) to late
1998, this central location increased in elevation by
about 75 cm. Roughly 15% of this uplift occurred
between mid-1997 and early 1998.
Langbein et al. (1995) used geodetic data to 1992 to
suggest the presence of a shallow source of deforma-
tion (5±7 km) beneath the resurgent dome, plus a
deeper source at about 13 km, and a dike beneath
Mammoth Mountain. The motions of CASA and
KRAK mainly re¯ect pressure or volume changes in
A.V. Newman et al. / Journal of Volcanology and Geothermal Research 105 (2001) 183±206186
Fig. 2. Similar to Fig. 1, except south±north and west±east cross-sections are displayed, to illustrate depth range of seismicity and vertical
component of surface deformation. Note small green arrows at base of the red arrows representing GPS velocity for earlier time periods.

the shallow source beneath the resurgent dome. It is
these data which we hope to use as a probe of
processes in the shallow crust beneath the resurgent
dome. The orientation of vectors in Fig. 1 suggests
that the horizontal position of the shallow source
responsible for surface deformation at CASA and
KRAK (intersection of vectors) has not changed
appreciably during the most recent phase of activity
compared to the previous several years.
An important question for volcanic hazard assess-
ment is whether the increased rate of surface deforma-
tion and seismicity re¯ects movement of magma
signi®cantly closer to the surface. The vertical compo-
nent of deformation, when combined with the
A.V. Newman et al. / Journal of Volcanology and Geothermal Research 105 (2001) 183±206 187
Fig. 3. Time series of daily vector position components estimated by GPS at stations CASA and KRAK and scalar length between CASA and
KRAK for 1994±1998 relative to arbitrary initial positions. Data points with large formal errors (north $8.0 mm, east $12.0 mm, vertical
$20.0 mm, length $10.0 mm) were removed.

horizontal components can be used to address this
question. Fig. 2 includes the vertical component of
deformation for the same periods as Fig. 1. There is
no suggestion in these data that the deformation
source depth has changed signi®cantly, as evidenced
by the similar orientation of surface displacement
vectors for the two periods. Following Dixon et al.
(1997) we can estimate the depth of deformation
assuming a simple point source (Mogi, 1958). For
January 1, 1994 to June 30, 1997 we obtain
6.1 ^ 0.7 km (one standard error), and for July 1,
1997 to December 31, 1998 we obtain 7.7 ^ 0.5 km.
Dixon et al. (1997) reported a depth of 5.8 ^ 1.6 km
for the period January 1, 1995 to December 31, 1995.
Langbein et al. (1995) reported a depth range of 5.5±
7.0 km for this shallow source, using deformation data
for the period 1988±1992, and incorporating an ellip-
soidal point source model. All of these depths are
equivalent at 95% con®dence. While we suspect that
magma has indeed moved upward during this period,
the majority of this motion may be in the deeper parts
of the magma chamber, and may have little effect of
the surface deformation at CASA and KRAK. These
stations appear to respond to pressure changes at shal-
lower levels, perhaps near the top of the magma cham-
ber, as discussed in a subsequent section.
Similarly, the location of seismicity has not
migrated signi®cantly during this period, either hori-
zontally (Fig. 1) or vertically (Fig. 2). In contrast to
the source of shallow deformation beneath the
resurgent dome, seismicity is concentrated along the
southern rim of the caldera, the south moat, an area of
enhanced seismic activity since 1979. Prior to the
recent phase of activity, earthquakes were relatively
disperse, including many events southeast of the moat
along the Hilton Creek fault (Fig. 1). During the
swarm activity that began in July 1997 and continuing
through January 1998, earthquakes became more
focussed, de®ning a near-vertical, east-west-striking
plane or tabular body about 15 km long, extending
to a depth of about 10 km (Fig. 4). Savage and Cock-
erham (1984) and Savage et al. (1987) postulated the
existence of an active dike near here as well as right
lateral slip during the 1982±1983 in¯ation episode, a
period that included a seismic swarm similar in some
respects to the 1997 activity. Thus the enhanced rate
of seismicity in mid- and late 1997 might re¯ect a dike
that expanded more rapidly or a fault that slipped
more frequently in this period compared to the
previous few years (Langbein et al., 1998). It does
not appear to be directly related to pressure or volume
increases immediately beneath the resurgent dome,
A.V. Newman et al. / Journal of Volcanology and Geothermal Research 105 (2001) 183±206188
-119˚ 00' -118˚ 54' -118˚ 48' -118˚ 42'
37˚ 36'
37˚ 42'
37˚ 48'
LVC boundary
LVC boundary
LVC boundary
-40
-30
-20
-10
0
-119
West/East cross section
Dep
th(k
m)
Fig. 4. Seismicity at Long Valley for November 1997. Inset shows all events in map view projected onto a west-east cross section. Note well-
de®ned linear trend, which may indicate location of a dike or fault near the south moat.
since it is in a different location, although we will later
describe a model that links these processes.
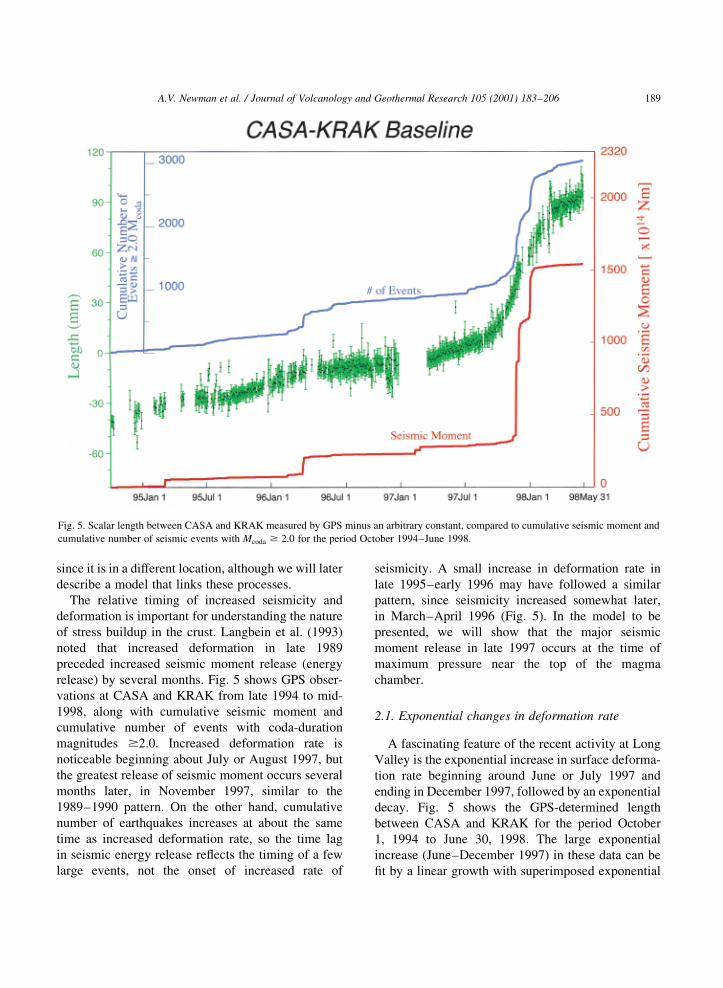
The relative timing of increased seismicity and
deformation is important for understanding the nature
of stress buildup in the crust. Langbein et al. (1993)
noted that increased deformation in late 1989
preceded increased seismic moment release (energy
release) by several months. Fig. 5 shows GPS obser-
vations at CASA and KRAK from late 1994 to mid-
1998, along with cumulative seismic moment and
cumulative number of events with coda-duration
magnitudes $2.0. Increased deformation rate is
noticeable beginning about July or August 1997, but
the greatest release of seismic moment occurs several
months later, in November 1997, similar to the
1989±1990 pattern. On the other hand, cumulative
number of earthquakes increases at about the same
time as increased deformation rate, so the time lag
in seismic energy release re¯ects the timing of a few
large events, not the onset of increased rate of
seismicity. A small increase in deformation rate in
late 1995±early 1996 may have followed a similar
pattern, since seismicity increased somewhat later,
in March±April 1996 (Fig. 5). In the model to be
presented, we will show that the major seismic
moment release in late 1997 occurs at the time of
maximum pressure near the top of the magma
chamber.
2.1. Exponential changes in deformation rate
A fascinating feature of the recent activity at Long
Valley is the exponential increase in surface deforma-
tion rate beginning around June or July 1997 and
ending in December 1997, followed by an exponential
decay. Fig. 5 shows the GPS-determined length
between CASA and KRAK for the period October
1, 1994 to June 30, 1998. The large exponential
increase (June±December 1997) in these data can be
®t by a linear growth with superimposed exponential
A.V. Newman et al. / Journal of Volcanology and Geothermal Research 105 (2001) 183±206 189
Fig. 5. Scalar length between CASA and KRAK measured by GPS minus an arbitrary constant, compared to cumulative seismic moment and
cumulative number of seismic events with Mcoda $ 2:0 for the period October 1994±June 1998.

increase:
u�t� � rt 1 e��t2t1�=t1� �2�
where u�t� is the position component as a function of
time, r is the rate of linear displacement, t1 is the start
time of the exponential process, and t 1 is the expo-
nential time constant (characteristic time) during this
phase. In this example, the best ®tting value for t 1 for
the GPS baseline between CASA and KRAK is 56
A.V. Newman et al. / Journal of Volcanology and Geothermal Research 105 (2001) 183±206190
Table 1
Characteristic time (t1,2) and goodness-of-®t (x 2 per degree of freedom, reduced x 2) for CASA and KRAK GPS position vector components,
and scalar baseline length between KRAK and CASA for GPS and two color EDM. Fits for the GPS east components are not possible due to low
signal to noise ratio
Baseline component Growth Decay
t 1 (days) Reduced x 2 t 2 (days) Reduced x 2
GPS
CASA N 63 2.1 79 2.2
CASA V 70 0.6 83 0.9
KRAK N 79 1.3 34 0.6
KRAK V 67 0.6 39 0.4
CASA±KRAK L 56 0.8 66 1.0
EDM
CASA±KRAK L 64 3.0 61 4.4
Fig. 6. Scalar length between CASA and KRAK measured by two-color EDM, detrended by 15 mm/yr, with exponential ®ts for early
(increasing deformation rate) and later (decreasing deformation rate) periods.

days. Similarly, the later part of the time series can be
®t by exponential decay superimposed with the same
linear growth from Eq. (2):
u�t� � rt 2 e�2�t2t2�=t2� �3�
with t2 now the stop time of the exponential process,
and t 2� 66 days. We also ®t this model to coordinate
velocities (individual motions of CASA and KRAK;
e.g. Fig. 3). Roughly similar characteristic times are
obtained regardless of velocity component (Table 1),
although the signal to noise ratio in the east compo-
nent is too low to extract a reliable estimate. While the
standard error is greatest in the vertical component
(e.g. Mao et al., 1999), the signal is also larger (Fig.
3), enabling an estimate. Depending on component
and station, we obtain values of t between 34 and
83 days for the various GPS data (Table 1). The
most precise estimate of t comes from the two-color
EDM data for the CASA±KRAK baseline, giving
t1� 64 days, and t 2� 61 days (Fig. 6). We have not
done a formal error analysis for our estimates of char-
acteristic time, but numerical simulations suggest that
the better determined (e.g. EDM length) components
have uncertainties (^one standard error) of about ^5
days, while more poorly determined components (e.g.
GPS vertical) have uncertainties of about ^20 days.
Thus, all the estimates quoted above are equivalent
within error, and the characteristic times are similar
for both the growth and decay phases of the deforma-
tion episode. In the subsequent discussion we take a
value of 60 days as representative for both periods,
and consider a range of 34±83 days.
We suggest that the characteristic time is a useful
parameter for describing the deformation episode,
since the data are well ®t by a simple exponential
function and the values are similar for both the expo-
nentially increasing and decreasing parts of the
episode. Basaltic systems on Iceland and Hawaii
also sometimes exhibit deformation episodes with
exponentially increasing or decreasing deformation
rates (e.g. Trygvason, 1980; Dvorak and Okamura,
1987; Linde et al., 1994; Owen et al., 1997; Dvorak
and Dzurisin, 1997) but typically the characteristic
deformation times are less than 1.5 days, sometimes
just a few hours, considerably shorter than the Long
Valley example. Many of the Hawaii and Iceland data
referenced above indicate relaxation times associated
with abrupt withdrawal of basaltic magma from a
reservoir and subsequent relaxation of the system.
Also, in some cases these data consist of strain or
tilt as opposed to displacement measurements; for
the order of magnitude comparisons of interest here,
this difference is not important, although note that
strain/tilt measurement systems tend not to record
long-lived deformation events due to instrument
drift. In comparing these various phenomena we
assume that there is useful information in the charac-
teristic time for exponentially changing surface defor-
mation time series, independent of the sign of the
exponent or whether the time series is exponentially
decreasing or increasing. Whether this is a function of
the underlying process (magma intrusion), a response
of the crustal media into which the magma intrudes, or
both, remains to be determined, and likely differs at
different volcanoes and at different times for a given
volcano. Nevertheless, based on the limited data
available, it appears that deformation at basaltic
volcanoes can often be characterized by relatively
short time constants, typically one day or less,
compared to much longer times that may be observed
at Long Valley, a more silicic system. It is likely that
temperature, magma viscosity and the composition of
the country rock all affect characteristic deformation
time, with hot, basaltic systems characterized by rapid
migration of low viscosity magma through dikes or
conduits and short deformation times, while cooler,
higher viscosity rhyolitic systems or zoned basaltic±
rhyolitic systems sometimes exhibit longer character-
istic times.
3. A model for surface deformation
A large number of models could explain the
observed exponential surface deformation at Long
Valley, re¯ecting the inherent non-uniqueness of
surface deformation data. For example, a period of
enhanced surface deformation could re¯ect: (a) a
change in the position of the pressure source (closer
to the surface) with constant source strength and
rheology; (b) a change in the rheology of intervening
material (decrease in material strength) with constant
source strength and source position; (c) a change in
source strength, with source position and surrounding
rheology remaining constant; or some combination.
A.V. Newman et al. / Journal of Volcanology and Geothermal Research 105 (2001) 183±206 191

Each of the above models may also assume simple
elastic half space rheology (for example, scenario
(b) could be implemented by simply changing the
elastic shear modulus as a function of time), or a
more realistic, but more complex, rheological
structure.
From surface geodetic data alone, it is not possible
to distinguish among these models. However, much
additional evidence is available to help constrain the
problem. Recall that the three dimensional vector GPS
data suggest that source location did not change
signi®cantly during the deformation episode, either
in the horizontal (Fig. 1) or vertical (Fig. 2) sense,
allowing us to rule out scenario (a). Strain rate-depen-
dent rheology (strain weakening) could lead to
scenario (b). In this paper we focus on scenario (c)
as it is plausible and straightforward to test. We next
consider independent evidence for the rheological
structure of the volcano.
Thermal considerations suggest that for any long-
lived magmatic system, rocks near the magma
chamber will be elevated above the brittle±ductile
transition temperature, and thus may not behave elas-
tically, depending on the time scale of deformation.
Laboratory data to be discussed suggest that many
crustal materials heated above the brittle-ductile tran-
sition temperature, as well as cooling rhyolitic liquids,
can be modeled as viscoelastic substances. Finally,
models incorporating viscoelastic rheology often
predict deformation that varies exponentially in
time, as observed at Long Valley in the 1997±1998
deformation episode.
In the model to be described, we assume that the
viscoelastic properties of rhyolitic material near the
top of the magma chamber, and/or hot country rock
nearby, play an important role in controlling the
surface deformation ®eld near the resurgent dome.
3.1. Zoned magma chambers
Before attempting to formulate and test a speci®c
model, we review current ideas about the nature of the
magmatic system at Long Valley and other silicic
calderas. A variety of ®eld, petrological and geochem-
ical observations suggest that magma chambers in
these systems are zoned or strati®ed, with lower
density, higher viscosity rhyolitic melts overlying
higher density, lower viscosity basaltic melts, or
their solidi®ed equivalents (e.g. Eichelburger and
Gooley, 1977; Hildreth, 1981; Dvorak and Dzurisin,
1997). This gradation re¯ects the process by which
rhyolitic magmas are thought to be generated,
whereby basaltic magma from the upper mantle or
lower crust intrudes into the middle or upper crust
(the likely level of neutral buoyancy), interacts with
more silica-rich country rock, and forms rhyolite
mainly by combined differentiation and assimilation
(Christiansen and Lipman, 1972; Hildreth, 1981;
Dvorak and Dzurisin, 1997). Most magma that is
eventually extruded at Long Valley has a silicic
composition, including the Holocene rhyolitic lavas
and pyroclastic material erupted along the Inyo volca-
nic chain at the northwest end of the caldera (Miller,
1985; Fink, 1985; Vogel et al., 1989). However, petro-
logic evidence suggests that silicic eruptions are often
ªtriggeredº by a pulse of basaltic magma intruded into
the lower magma chamber (Sparks et al., 1977;
Johnston, 1978; Bailey, 1984; Pallister et al., 1992).
At Long Valley, basalt injection and mixing may have
triggered post-caldera silicic volcanism at 0.3 Ma
(Bailey, 1984) and the 600-year-old Inyo eruption
(Varga et al., 1990).
Basaltic eruptions have been relatively common at
Long Valley in the last 400,000 years (Mankinen et
al., 1986; Bailey, 1989; Vogel et al., 1994; Cousens,
1996), and their mode of eruption may also re¯ect
magma chamber strati®cation and the contrasting
properties of basaltic and rhyolitic magma. Young
basaltic eruptions tend to be concentrated around the
margins of the resurgent dome, implying that their rise
within the magma chamber is hindered by the lower
density, higher viscosity rhyolitic ªcapº at the top,
forcing rising basaltic magma to migrate laterally
and ªleak outº around the edges (e.g. Bailey, 1984,
1989).
Most seismic studies agree that a likely explanation
for the unrest at Long Valley beginning in 1979 is
related to intrusion of new magma, based on low P-
wave velocities, high attenuation of S waves, and
other seismic anomalies indicative of the presence
of magma or ¯uid (e.g. Rundle et al., 1985; Rundle
and Hill, 1988; Hill et al., 1990). High attenuation of
seismic energy in the depth range 6±12 km beneath
the resurgent dome (Steck and Prothero, 1994;
Sanders et al., 1995; Sanders and Nixon, 1995), may
de®ne the magma chamber, or at least region where
A.V. Newman et al. / Journal of Volcanology and Geothermal Research 105 (2001) 183±206192

magma or ¯uid is present in amounts suf®cient to
affect seismic waves. A recent study exploiting the
intense earthquake swarm of 1997 places the top of
this possible magma chamber at one location near
CASA (the swarm location) at a depth of 7.8 km
(Stroujkova and Malin, 2000). Due to their location
and the general relation of surface deformation to
pressure changes at depth, CASA and KRAK are
more sensitive to shallow (less than 10 km) processes
compared to deeper-seated processes, even though the
latter are likely to be more fundamental in controlling
long-term evolution of the system. Thus the dominant
source of deformation at CASA and KRAK, at a depth
of 5±7 km, appears to be located near the top of the
seismically de®ned magma chamber. Since the
magma chamber is likely zoned, deformation at
CASA and KRAK probably re¯ects expansion or
pressure increase within the uppermost, rhyolitic
part of the chamber, or the region immediately
above it. This may be in response to heating or advec-
tive addition of magma from below, increased volume
of volatiles exsolving from rising magma and collect-
ing near the top of the chamber, or thermal expansion
of the region immediately above the magma chamber,
although the details of the ultimate source of activity
(presumably deeper-seated magmatic processes) need
not concern us here.
3.2. Thermal zone around a magma chamber
The rheological properties of the solidi®ed (but
presumably heated) country rock immediately
surrounding the magma chamber may also play an
important role in surface deformation, mediating the
effect of deeper pressure variations. Thermal consid-
erations suggest that for long-lived volcanic systems,
a considerable thickness of country rock around the
magma chamber may be heated above the brittle±
ductile transition temperature, and thus will not
behave in a perfectly elastic manner. Long Valley's
eruption history suggests that it has the longevity to
generate a relatively wide heated zone, even in the
presence of vigorous hydrothermal activity. The
system has been active for at least the last 2 Ma
(Bailey et al., 1976; Metz and Mahood, 1985).
Although the last major eruption, which formed the
Bishop Tuff and the present caldera (Bailey et al.,
1976; Hildreth and Mahood, 1986), occurred at
760,000 Ma (Izett and Obradovitch, 1994) both basal-
tic and rhyolitic eruptions have occurred in the last
200,000 years (Mankinen et al., 1986; Bailey, 1989;
Varga et al., 1990; Vogel et al., 1994). The most
recent rhyolitic eruptions occurred along the southern
part of the Mono±Inyo chain about 650 years ago
(Miller, 1985; Sieh and Bursik, 1986; Eichelburger
et al., 1988). This activity may be suf®cient to develop
a large, strati®ed magma chamber as well as a consid-
erable thickness of heated country rock around it, and
maintain these features for a considerable length of
time.
Field observations of eroded magmatic systems
suggest that high temperature contact metamorphic
aureoles surrounding these systems have dimensions
ranging from a few meters to a few kilometers, with
the smaller dimensions characteristic of smaller and/
or relatively dry magmatic systems, and the larger
dimensions characteristic of larger and/or relatively
wet systems, where ¯uids can advect heat far from
the magma chamber boundary. For example, oxygen
isotope and mineral stability data for the aureole
surrounding the Alta granitic stock in Utah indicate
temperatures of 3508C or higher up to 1.5 km from the
intrusive boundary (Marchildon and Dipple, 1998).
Studies of the Ballachulish aureole in Scotland
suggest temperatures in excess of 3508C 2 km or
more from that magmatic boundary (Ferry, 1996).
We interpret such metamorphic aureoles as represen-
tative of thermal boundary zones or ªshellsº that
surround modern magma chambers. Because of the
relatively high temperatures in these boundary
zones, their mechanical behavior can be modeled as
viscoelastic. Evidence discussed below suggests that
Long Valley rhyolites are relatively wet, thus the
corresponding thermal boundary zone is likely to be
relatively wide. In most of the models considered
below we set the shell diameter at 1.0 km.
3.3. Viscoelastic shell model
We now describe a model for observed deformation
on the resurgent dome. Although non-unique, the
model is consistent with all available data, including
our current understanding about the structure and
composition of zoned magma chambers and thermal
and rheological considerations about the country rock
immediately surrounding the magma chamber.
A.V. Newman et al. / Journal of Volcanology and Geothermal Research 105 (2001) 183±206 193

Consider a silicic magma chamber experiencing a new
in¯ux of basaltic magma from below. If the overlying
material has an elastic rheology (e.g. low temperature
silicate rock), the pressure increase associated with
this in¯ux is immediately expressed by deformation at
the surface. However, if the overlying material has a
viscoelastic rheology, there is a time dependence to
the surface response that depends on the viscosity of
the material. High temperature rhyolite at the top of the
magma chamber, or country rock surrounding the
magma chamber that is heated above the brittle±ductile
transition, can be considered a viscoelastic boundary
zone or shell around the magma chamber.
For a relatively wide range of temperatures and
strain rates, rhyolites and granites above the brittle±
ductile transition temperature can be characterized as
Maxwell viscoelastic solids (Dingwell and Webb,
1989; Dingwell, 1995; Richet and Bottinga, 1995;
Webb and Dingwell, 1995). The behavior of Maxwell
solids can be illustrated with a simple mechanical
analogue, a spring and dashpot (piston±cylinder
arrangement) in series, representing the elastic and
viscous parts of the response, respectively. Maxwell
solids are often characterized by two parameters,
the rigidity, G (also known as the shear modulus),
which describes short-term elastic (unrelaxed)
behavior, and the Newtonian shear viscosity, h ,
which describes longer-term viscous (relaxed)
behavior. For such materials, the relation between
characteristic response time (Maxwell time), t ,
shear viscosity, and rigidity is:
t � h=G �4�
These quantities differ depending on whether the
applied stress is shear or volumetric, but the
difference is small and can be ignored here
(Dingwell and Webb, 1989; Dingwell, 1995). For
time scales much shorter than the characteristic
time, elastic behavior (the ªspringº) dominates,
while for longer times, viscous behavior (the ªdash-
potº) dominates. Since G is similar for most silicate
glasses (log10 G� 100.5; Dingwell and Webb,
1989), and indeed for most crustal materials, the
shear viscosity of the material can be estimated
from the characteristic time. Eq. (4) is sometimes
written as t � 2h=G: Again the difference is small
compared to the order of magnitude estimates for
viscosity of interest here.
Dragoni and Magnanensi (1989) describe a
viscoelastic shell model for volcano deformation,
with a spherical pressure source (e.g. magma cham-
ber) surrounded by a concentric, spherical, Maxwell
viscoelastic shell, both embedded in an elastic full
space (in®nite domain). While a viscosity gradient
almost certainly exists near the magma chamber,
with lower viscosity material immediately adjacent
to the pressure source grading to higher viscosity
material further away, a single shell with an average
viscosity is probably an adequate approximation.
Even with this assumption, up to six parameters
describing the material properties are required to
completely specify the rheology of the system. For
the elastic material these are the bulk modulus, K1,
and shear modulus, G1. For the viscoelastic material
these are the bulk modulus, K2, and volume viscosity,
describing the material response to volumetric stres-
ses, and shear modulus, G2, and shear viscosity, h ,
describing the material response to shear stresses.
Following Dragoni and Magnanensi (1989), we
assume that the shell responds viscously to shear
stresses but elastically to volume stresses, i.e. effects
related to volume viscosity (sometimes termed
pressure viscosity) are ignored. Second, the shear
moduli of the two materials are assumed to be
equal �G1 � G2 � G�: Third, we assume K � 5=3G:
This is equivalent to assuming that Poisson's ratio, n ,
throughout both materials is constant and equal to
0.25. Finally, we assume that there is little varia-
tion in G throughout the crust, consequently this
parameter can be ®xed to a single value. We set
it to 5 £ 109 Pa (e.g. Bonafede et al., 1986),
somewhat lower than standard crustal values
(1±3 £ 1010 Pa) and perhaps representative of
volcanic regions. Thus instead of six material
properties, we need only specify three (G, n ,
and h ), of which only one (h ) is varied in our
models. Additional work is needed to assess the
validity of these assumptions, de®ne plausible
values for the rheological parameters, and deter-
mine the extent to which these parameters vary in the
region of high thermal gradients near the magma
chamber.
For a step-like, instantaneous pressure change, the
radial displacement, ur�r; t� for the viscoelastic shell
A.V. Newman et al. / Journal of Volcanology and Geothermal Research 105 (2001) 183±206194

model is:
ur�r; t� � 1
4
P0
G
R32
r31 2 1 2
R31
R32
!e2t=t
" #�5a�
(valid for r $ R2�; where P0 is the pressure increment,
t is time, R1 is the radius of the pressurized cavity
(magma chamber?), R2 is the radius of the larger
viscoelastic shell, and t is the characteristic time
whose de®nition is modi®ed to account for the physi-
cal dimensions of the shell:
t � 9
5
h
G
R2
R1
� �3
�5b�
Note that Eq. (5a) predicts displacement that is an
exponential function of time, even though the pressure
change is instantaneous, i.e. the viscoelastic response
of the shell ª®ltersº the effect of the pressure change.
For a more realistic trapezoidal pressure history,
where pressure grows linearly with time from 0 to
t1, remains constant until t2, then decays to 0 by t3,
the radial displacement for the viscoelastic shell
model of Dragoni and Magnanensi (1989) is:
ur�r; t� � 1
4
P0
G
R32
r2f1�t�2 1 2
R31
R32
!f2�t�
" #�6a�
where
f1�t� � t 2 �t 2 t1�H�t 2 t1�t1
1�t 2 t3�H�t 2 t3�2 �t 2 t2�H�t 2 t2�
t3 2 t2�6b�
f2�t� � tM 2 N
t11
O 2 P
t3 2 t2
� ��6c�
M � 1 2 e2t=t �6d�
N � H�t 2 t1�{1 2 e2�t2t1�=t} �6e�
O � H�t 2 t3�{1 2 e2�t2t3�=t} �6f�
P � H�t 2 t2�{1 2 e2�t2t2�=t} �6g�H�t� is the Heaviside step function �H � 1 when t . 0
and H � 0 for t , 0�; and t is de®ned by Eq. (5b).
Again, the model predicts deformation outside the
shell that has an exponential dependence on time.
By analogy with the Mogi elastic model (Mogi,
1958) the viscoelastic shell model is a point-like
source model, in the sense that the size of the source
(R1) cannot be uniquely determined from geodetic
A.V. Newman et al. / Journal of Volcanology and Geothermal Research 105 (2001) 183±206 195
Fig. 7. Deformation predicted by the analytical model of Dragoni and Magnanensi (1989) for the simple pressure history shown, 6 km from a
pressure source surrounded by a 1-km-thick viscoelastic shell.

data alone given the trade-off between source dimen-
sion and source pressure (P).
Fig. 7 shows the deformation predicted by such a
model for several values of shell viscosity and a
simple pressure history, namely a linear increase to
some maximum pressure, which then remains
constant. Note that although the pressure history in
this example is piecewise linear, the predicted surface
deformation is non-linear, depends on shell viscosity,
and is crudely similar to the pattern observed at Long
Valley. While this simple, two stage pressure model
cannot exactly match the pattern of surface deforma-
tion, it does suggest that at least some of the ªcurva-
tureº in the deformation pattern might be related to the
properties of viscoelastic material at depth.
In order to quantitatively compare predictions of
the viscoelastic shell model to the deformation data,
we require constraints on the dimensions and viscosity
of the shell, the ability to specify more sophisticated
pressure histories, and knowledge of the effect of the
free surface on the model predictions (the available
analytical solution is valid only for an elastic full
space; we require a half space model).
3.3.1. Shell dimensions and viscosity
At ®rst glance it might appear that estimates for the
shell viscosity are highly non-unique, being functions
of t , R1 and R2 (Eq. (5b)). However, while the abso-
lute dimensions of magma chambers and their high
temperature aureoles must vary greatly, variation in
the ratio R2=R1 is probably much less, since small
magma chambers tend to heat relatively small
volumes of adjacent country rock, while large
magma chambers heat correspondingly larger
volumes. For R2=R1 � 1:5±3:0 (a typical range?),
and t , 60 days, the variation in viscosity predicted
by the model is only about one order of magnitude
(Fig. 8). In contrast, for plausible temperature and
compositional ranges of volcanic materials, viscosity
can vary by at least 10 orders of magnitude. This
suggests that characteristic times for surface deforma-
tion in the viscoelastic shell model largely depend on
the rheological characteristics of the region near the
pressure source. Perhaps surface deformation data
might be used to ªprobeº this otherwise inaccessible
region. For t � 34±83 days and the simple model
described above, the implied average viscosity of
the shell is ,3 £ 1014±1016 Pa s, the viscosity of an
easily deformable solid.
This viscosity range is broadly consistent with our
expectations. For example, it is several orders of
magnitude lower than typical lower crustal viscosities
in non-volcanic regions, generally considered to be in
the range 1019±1020 Pa s (e.g. Thatcher, 1983; Savage
A.V. Newman et al. / Journal of Volcanology and Geothermal Research 105 (2001) 183±206196
Fig. 8. Characteristic time, t , versus shear viscosity, h , for various R2=R1 (Eq. (5b), text).

and Lisowski, 1998; Dixon et al., 2000; Kenner and
Segall, 2000; Pollitz et al., 2000). Typical lower crust
is probably more ma®c in composition than upper
crustal material at Long Valley and may also be
cooler, implying higher viscosity.
Consideration of the petrological and thermal
conditions of the magma chamber and surrounding
country rock provides additional information on visc-
osity. At a depth of 6 km, near the top of the seismi-
cally de®ned magma chamber at Long Valley and
equivalent to the shallow deformation source whose
effects dominate CASA and KRAK site velocities,
temperatures probably lie in the range 450±8008C,
depending in part on assumptions about the extent
of shallow hydrothermal circulation and the actual
location of the magma chamber (Sorey, 1985; Hill,
1992). The solidus temperature for wet rhyolite lies
in the middle of this range, 6708C (e.g. Winkler, 1974;
Maalùe and Wyllie, 1975). If rhyolite is present in
signi®cant quantities at the top of the magma
chamber, it will act as a thermal ªbuffer,º maintaining
the temperature of the surroundings near this value for
a considerable length of time. We will consider ®rst
the viscosity of the rhyolitic cap at the top of the
magma chamber as a function of water content,
temperature and crystal content. Second, we will
consider the temperature dependence of the viscosity
of the surrounding country rock.
The viscosity of a rhyolitic melt is a strong function
of water content. Studies of melt inclusions in quartz
in the Bishop Tuff indicate that rhyolites produced at
Long Valley during this eruption had pre-eruptive
water contents of 2±7 wt% (Newman et al., 1988;
Anderson et al., 1989; Skirius, 1990; Dunbar and
Hervig, 1992; Wallace et al., 1995), which reduces
the viscosity 6±7 log units relative to dry rhyolite
(Neuville et al., 1993; Richet et al., 1996; Schulze et
al., 1996). In the following discussion we take a value
of 5% water as representative. The viscosity of wet
rhyolitic melt is ,105±108 Pa s at temperatures of
650±8008C (wet rhyolite curve on Fig. 9), signi®-
cantly lower than the viscosity we infer from the
deformation time constant and the viscoelastic shell
model (,1014±1016 Pa s).
The existence of completely molten rhyolite at the top
of the magma chamber, however, is unlikely. For the
more likely case of a partly to largely crystallized rhyo-
lite, studies of the rheology of crystal-bearing silicate
melts (e.g. Marsh, 1981; Lejeune and Richet, 1995) and
partially-melted granites (e.g. Arzi, 1978a,b; van der
Molen and Paterson, 1979) show that viscosity varies
nonlinearly with crystal content, and is best described
over three distinct intervals of crystallinity. Between 0
and ,40% crystals, the system behaves as a suspension
of well-separated crystals in a melt, and can be consid-
ered a simple Newtonian ¯uid. Addition of up to ,40%
crystals will result in a viscosity increase of ,1 log unit.
Between ,40 and ,70% crystals, the system transitions
from being suspension-controlled to being granular-
controlled. Viscosity increases sharply by ,6 log
units over this crystallization interval. At crystal
contents .70%, the viscosity continues to increase
with crystal content, but gradually reaches a maximum
of ,8±10 log units greater than that of the homoge-
neous liquid. Addition of 80±90 vol% crystals to a
homogeneous liquid increases the viscosity ,7.5±9
log units above the crystal-free melt (Fig. 9). At these
high crystal contents, non-Newtonian behavior
becomes important, although an effective Newtonian
viscosity can still be de®ned. A hypothetical crystalliza-
tion±temperature±viscosity path with crystal content
and viscosity increasing sharply near the solidus
temperature is also shown in Fig. 9. A mostly crystalline,
wet rhyolite would have a viscosity of ,1015±1017 Pa s
at or near the solidus temperature of 6708C, similar to the
values inferred from our model.
Another candidate material for the viscoelastic
shell is the crystalline country rock surrounding the
magma chamber, material that is presumably some-
what cooler than the magma chamber, but consider-
ably warmer than crust at equivalent depth outside the
active volcanic region. At temperatures above about
300±3508C, the rheological behavior of most upper
crustal rocks will likely be dominated by ductile
deformation of its weakest component, quartz, as
long as quartz makes up at least ,10±15% of the
rock. This condition is likely satis®ed for the Paleo-
zoic metasediments, Mesozoic metavolcanics, and
Cretaceous granodiorites (Sierran batholithic rocks)
that comprise the country rock for the Long Valley
magma chamber (Bailey, 1989). Above 300±3508C,
quartz deforms by power law (non-Newtonian) dislo-
cation creep (Brace and Kohlstedt, 1980; Kirby and
Kronenburg, 1987). It is nevertheless possible to
de®ne an effective Newtonian viscosity at a given
strain rate. Based on experimental determinations of
A.V. Newman et al. / Journal of Volcanology and Geothermal Research 105 (2001) 183±206 197

Jaoul et al. (1984), Patterson and Luan (1990) and
Luan and Patterson (1992), Ivins (2000) estimated
an effective viscosity for wet crystalline quartz of
about 1017±1019 Pa s at temperatures of 500±6008C,
assuming a moderately high strain rate of 10213 s21
(Fig. 9). This viscosity range is somewhat higher
than that inferred from our model. However, the
model shell assumes a single viscosity value
(1016 Pa s) that may actually represent an average of
a range of values, for example partly molten rhyolite
(1014 Pa s) and cooler quartz-bearing country rock
(1018 Pa s).
In summary, largely crystallized rhyolite at or near
its solidus temperature (6708C) near the top of the
magma chamber (viscosity 1015±1017 Pa s) or
quartz-bearing crystalline country rock around the
magma chamber heated to ,500±6008C (effective
viscosity 1017±1019 Pa s), are broadly similar to
values inferred from a simple viscoelastic shell
model and characteristic times for surface deforma-
tion data of 34±83 days (,3 £ 1014±1016 Pa s). Most
of the model runs described below assume a shell
viscosity of 1016 Pa s, intermediate between this
range of values.
3.3.2. Effect of the free surface
One shortcoming of the analytical version of the
viscoelastic shell model formulated above is that the
elastic medium is assumed to be in®nite, i.e. the free
surface is not taken into account. However, if we wish
to make quantitative comparisons to surface deforma-
tion data, it is important to account for the effect of the
free surface, across which no stress is transmitted. We
have done this with a ®nite element approach, using
the commercial ®nite element code ªABAQUSº
(Hibbit, Karlsson and Sorenson, Inc., 1998). To
simplify the calculations, we assumed radial symme-
try, and restricted our investigations to a small (500 m
radius) spherical pressure source, similar to the Mogi
point-source approximation. Thus we do not account
A.V. Newman et al. / Journal of Volcanology and Geothermal Research 105 (2001) 183±206198
Fig. 9. Viscosity versus temperature for molten rhyolite (light solid curve, Wet Rhyolite), partially crystallized wet rhyolites (light solid curve,
WR 1 xtls) and quartz-rich country rock (dashed curves). Wet rhyolite curve assumes 5 wt% H2O and is calculated by reducing the viscosity of
dry rhyolite (Neuville et al., 1993) by 7 log units (Richet et al., 1996; Schulze et al., 1996). Curves for mostly crystallized rhyolite include melt
plus ,80 vol% crystals (wet rhyolite 1 7.5 log units) and melt plus ,90 vol% crystals (wet rhyolite 1 9 log units) (Lejeune and Richet, 1995;
Arzi, 1978a,b; van der Molen and Paterson, 1979). Dashed curves (top) represent effective viscosity of quartz-rich country rock (Ivins, 2000)
assuming a constant strain rate of 10213 s21 for (A) ªgelº or wet quartz experiments of Patterson and Luan (1990) and Luan and Patterson
(1992) and (B) wet Heavitree quartzite (Jaoul et al., 1984). Heavy solid line represents hypothetical viscosity path for a cooling and crystal-
lizing rhyolitic melt, showing slow increase in viscosity as system cools to ,7008C and crystallizes up to ,40%, sharp increase in viscosity as
system continues to cool and crystallizes ,40±70%, and continued increase in viscosity as system solidi®es at solidus, (vertical dashed lines at
670 ^ 108C), subsequently following crystalline quartz behavior. Horizontal dotted lines indicate viscosity range inferred from shell model and
characteristic deformation time for R2=R1 � 1:5±3:0:
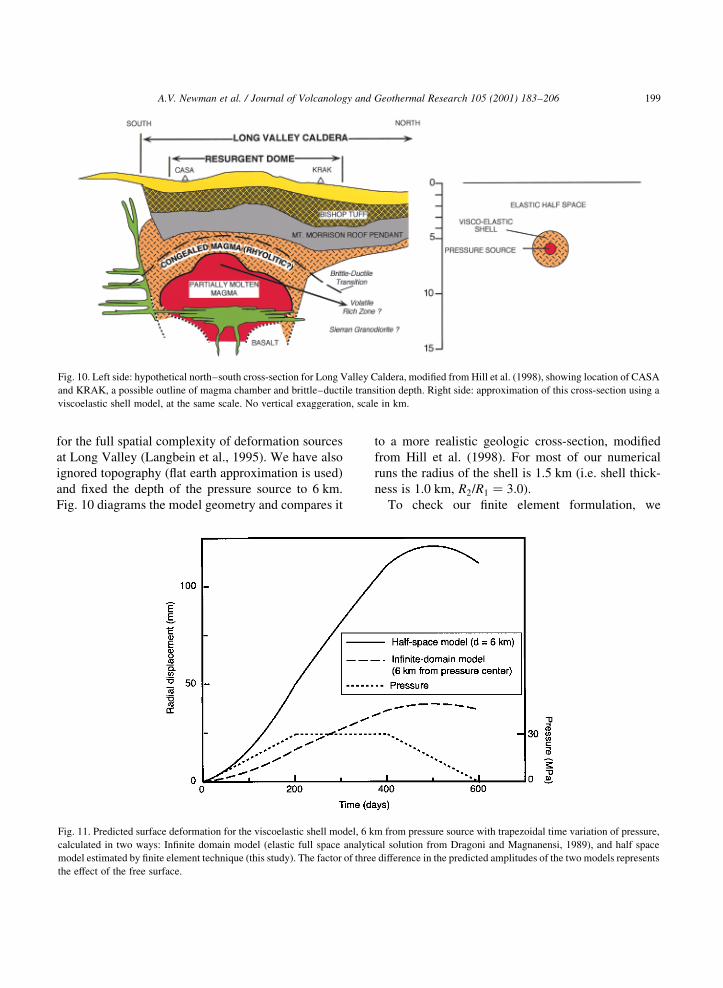
for the full spatial complexity of deformation sources
at Long Valley (Langbein et al., 1995). We have also
ignored topography (¯at earth approximation is used)
and ®xed the depth of the pressure source to 6 km.
Fig. 10 diagrams the model geometry and compares it
to a more realistic geologic cross-section, modi®ed
from Hill et al. (1998). For most of our numerical
runs the radius of the shell is 1.5 km (i.e. shell thick-
ness is 1.0 km, R2=R1 � 3:0�:To check our ®nite element formulation, we
A.V. Newman et al. / Journal of Volcanology and Geothermal Research 105 (2001) 183±206 199
Fig. 10. Left side: hypothetical north±south cross-section for Long Valley Caldera, modi®ed from Hill et al. (1998), showing location of CASA
and KRAK, a possible outline of magma chamber and brittle±ductile transition depth. Right side: approximation of this cross-section using a
viscoelastic shell model, at the same scale. No vertical exaggeration, scale in km.
Fig. 11. Predicted surface deformation for the viscoelastic shell model, 6 km from pressure source with trapezoidal time variation of pressure,
calculated in two ways: In®nite domain model (elastic full space analytical solution from Dragoni and Magnanensi, 1989), and half space
model estimated by ®nite element technique (this study). The factor of three difference in the predicted amplitudes of the two models represents
the effect of the free surface.
performed two tests. We ®rst set the rheology of the
shell to be elastic, obtaining results that are essentially
identical to the Mogi point source result (Mogi, 1958).
Second, we tested an in®nite domain (no free surface)
formulation, for comparison to the analytical solution,
calculating deformation in the elastic full space 6 km
from the center of the pressure source for a simple
pressure history. The analytical and ®nite element
results are identical, to better than 0.1 mm/yr (to our
knowledge, this is the ®rst numerical test of the analy-
tical viscoelastic shell model of Dragoni and Magna-
nensi (1989)). Finally, we imposed a free surface on
the ®nite element formulation of the shell model, and
performed a series of runs for comparison to the defor-
mation data and to the analytical solution. In one run
with a simple pressure history for which the corre-
sponding full space analytical solution is available,
the surface deformation patterns are very similar,
but the half space solution has three times the ampli-
tude (Fig. 11). In other words, for the tested conditions
and at a given distance from the source, a given
surface deformation can be obtained with a pressure
increment that is three times smaller if the free surface
is present compared to the full space solution. This is a
very useful result, because it suggests that even
though the analytical solution does not account for
A.V. Newman et al. / Journal of Volcanology and Geothermal Research 105 (2001) 183±206200
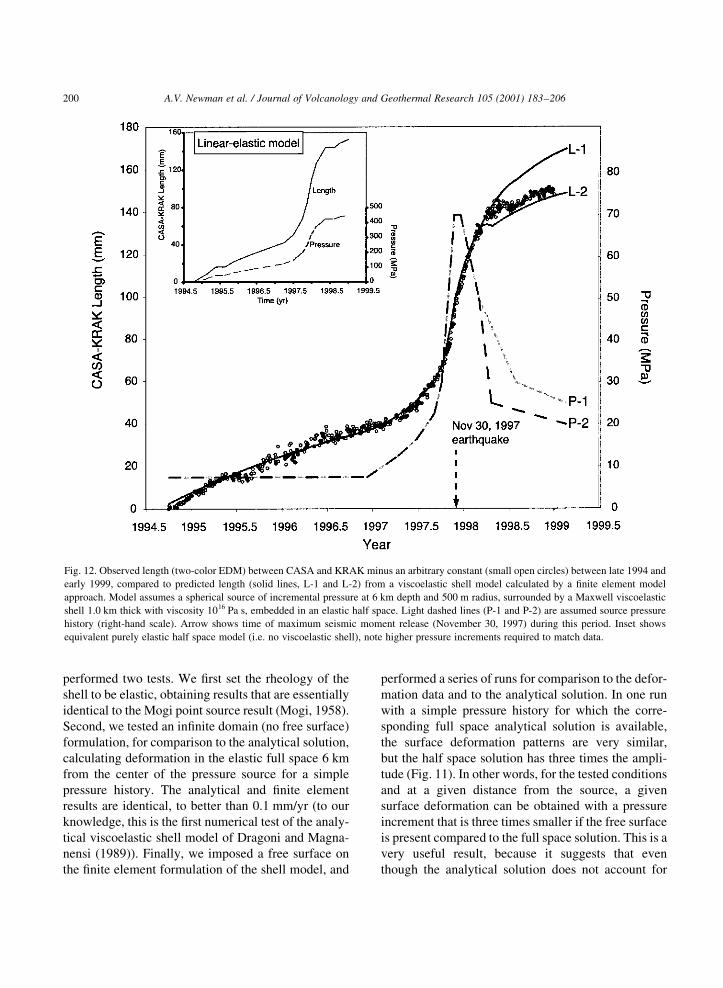
Fig. 12. Observed length (two-color EDM) between CASA and KRAK minus an arbitrary constant (small open circles) between late 1994 and
early 1999, compared to predicted length (solid lines, L-1 and L-2) from a viscoelastic shell model calculated by a ®nite element model
approach. Model assumes a spherical source of incremental pressure at 6 km depth and 500 m radius, surrounded by a Maxwell viscoelastic
shell 1.0 km thick with viscosity 1016 Pa s, embedded in an elastic half space. Light dashed lines (P-1 and P-2) are assumed source pressure
history (right-hand scale). Arrow shows time of maximum seismic moment release (November 30, 1997) during this period. Inset shows
equivalent purely elastic half space model (i.e. no viscoelastic shell), note higher pressure increments required to match data.

the free surface, it can be used to explore the in¯uence
of various model parameters without paying the
computational cost of the ®nite element approach, at
least within or near the range of conditions tested here.
Fig. 12 shows the surface deformation measured by
the two-color EDM on the CASA±KRAK baseline for
the 4.5-year period from late 1994 to early 1999,
compared to predicted deformation from the visco-
elastic shell model, implemented with the ®nite
element formulation (i.e. the free surface is taken
into account) and the corresponding pressure history.
We use the two-color EDM data here because it is
more precise than the GPS data, particularly for
short time-scale deformation events, and thus
provides a more rigorous test of the model.
In addition to the excellent agreement between
model and data, several other features in Fig. 12 are
noteworthy:
(1) Prior to the high deformation rate event of mid±
late 1997, the pressure increment required to match
the data is relatively small and constant.
(2) Prior to early 1997, the deformation rate is
slowly decreasing. This is a consequence of viscous
relaxation in the shell, perhaps representing a longer
term decline from a previous deformation episode.
(3) The entire deformation episode of mid-1997 to
early 1998 can be explained by a simple pressure
ªpulseº, in which pressure rises from background
values, reaches a peak, and then declines.
(4) Pressure started to increase by December 1996,
several months prior to the time when anomalous
surface deformation is reliably detected, around
April±May 1997 for the two-color EDM, or May±
June 1997 for the GPS. This re¯ects the lag time
imposed by the viscous response of the shell, the
initially slow rate of pressure increase, and data noise.
(5) Although we have modeled the pressure history
as piecewise linear, it is clear that in the early, rising
phase of deformation, an exponential-like growth in
pressure is required to match the data. This suggests
that the observed exponential surface deformation
re¯ects not only the in¯uence of the viscoelastic
shell, but also an exponential growth of pressure in
the source.
(6) The peak pressures reached are relatively small,
less than one half lithostatic pressure, and are main-
tained for a very short time, a few months or less. The
exact value of peak pressure estimated by the model
will depend on the size of the source, the size and
viscosity of the shell, and the value of rigidity
assigned to the elastic and viscoelastic media, re¯ect-
ing the tradeoff between rheology and source charac-
teristics.
(7) The cessation of pressure buildup coincides
with the timing of major seismic moment release
from mid±late November 1997 to early December
1997.
(8) A short duration but signi®cant decrease in
surface deformation rate occurred in mid-1998. By
inspection of pressure curve P-2, it is apparent that
this feature can be matched in the model simply by
a rapid decrease in pressure to nearly the background
value. A simple pressure history intermediate between
P-1 and P-2 in Fig. 12 can match the complicated
pattern of surface deformation observed in mid-1998
almost exactly.
Fig. 12 (inset) also shows the predicted deformation
and corresponding pressure history for a purely elastic
half space model, with the same parameters as the
shell model (source radius� 500 m, depth� 6 km,
rigidity� 5 £ 109 Pa) except that shell rheology is
set to that of the half space. The ®t of model to data
is equally good compared to the viscoelastic shell
model, however, the peak pressure required to
match the data (,500 MPa) is much higher for the
purely elastic model than for the shell model
(,70 MPa). This exceeds the lithostatic pressure at
6 km (,160 MPa) and thus is unrealistic. The peak
pressure required in the purely elastic model could be
reduced by using lower values of rigidity or larger
values of source radius. Also, in purely elastic models
it is possible to de®ne source effects in terms of
volume increments rather than pressure increments,
thereby avoiding unrealistically high pressures. The
volume increment approach may be associated with
permanent volume growth of the resurgent dome via
magma addition, because after a certain period of time
magma loss becomes unlikely due to cooling and
solidi®cation (only future observations can indicate
whether such growth has actually occurred; signi®-
cant future subsidence, beyond that expected from
thermal contraction of solidifying magma, would
tend to rule this out). Thus the high peak pressures
indicated in Fig. 12 (inset) for the purely elastic model
by themselves do not preclude consideration of such
rheology. Nevertheless, it is clear that for equivalent
A.V. Newman et al. / Journal of Volcanology and Geothermal Research 105 (2001) 183±206 201

source characteristics, the viscoelastic shell model can
generate the observed deformation with considerably
smaller, and thus more physically plausible, pressure
increments compared to purely elastic models.
A sensitivity analysis for all of the parameters in the
viscoelastic shell model has not been performed; we
hope to address this in future studies. For the tested
conditions �R2=R1 � 3�; acceptable ®ts to the data can
be obtained with shell viscosities between about
5 £ 1015 and 2 £ 1016 Pa s. As noted above this
range of viscosities is plausible given what we know
about the petrology and rheology of the magmatic
system at Long Valley and its surroundings.
4. Discussion
4.1. Elastic versus viscoelastic models
Elastic half space models for volcano deformation
are often justi®ed on the basis that they ®t available
data. However this is not always strictly true. Such
models may ®t surface deformation data, but they
often fail to account for other available data on
subsurface composition, thermal structure and rheol-
ogy. The known mineralogy and petrology of crustal
materials, laboratory data on the strength of such
materials as a function of temperature, and thermal
data that constrain the local depth of the transition
from brittle behavior, where elastic models are justi-
®ed, to ductile behavior, where they may not be, all
constitute major constraints that need to be incorpo-
rated into volcano deformation models. This is espe-
cially true for long-lived magmatic/deformation
episodes in continental terrains and silicic volcanoes,
where magma has time to heat its surroundings, where
the ubiquitous presence of quartz means that typical
crust enters the ductile deformation ®eld at relatively
low temperatures, and where the deformation time
scale is suf®ciently long to observe viscous behavior.
Elastic models are more likely to be good approxima-
tions on basaltic shield volcanoes such as Hawaii and
Iceland, where quartz is rare or absent, and for short-
lived magmatic/deformation episodes, a few days or
less, where heating times can be neglected and where
the elastic response of typical crustal material likely
dominates the viscous response.
The type of geodetic data that we seek to model
may also determine whether elastic or viscoelastic
models are appropriate. Strainmeters and tiltmeters
make precise measurements of strain and tilt on
time scales of seconds to days (e.g. Linde et al.,
1994). These time scales are short compared to the
viscoelastic relaxation time of many materials of
geologic interest, hence the elastic approximation is
valid. In contrast, displacement methods such as
leveling, EDM, GPS or interferomeric SAR are
capable of recording long term motions over months
or years. These time scales may require incorporation
of viscoelastic behavior in the rheological model for
the volcano in order to make accurate predictions
concerning processes at depth.
In summary, for Long Valley caldera, a long-lived
silicic volcanic center in continental crust where
leveling, EDM and GPS data record deformation
episodes lasting many months or years, incorporating
viscoelastic behavior into our rheological models may
be important when we seek to relate surface deforma-
tion to magmatic processes at depth.
4.2. Pressure variation and implications for magmatic
processes
The time history of pressure variation that we infer
from our ®nite element implementation of the viscoe-
lastic shell model, a fairly rapid pressure increase
followed by a slower decay, is critical to matching
the surface deformation data (Fig. 12). The viscoelas-
tic properties of the shell in our simple model, while
contributing to the character of surface deformation,
by themselves do not generate exponential surface
deformation for simple linear pressure histories (e.g.
linear increase followed by linear decrease). Thus the
observed surface deformation seems to require an
exponential process at depth.
The inferred pressure history gives some clues to the
underlying causes of the deformation episode at Long
Valley in mid- and late 1997. We suspect that the pres-
sure history is related to intrusion of basaltic magma at
the base of the magma chamber and subsequent mixing
and heating. Perhaps the pressure pulse is related to a
convective overturn event within the magma chamber,
associated with earlier or ongoing basaltic intrusion.
Intrusion of new basaltic magma or a subsequent over-
turn event may contribute to rising pressure near the top
of the magma chamber in at least three ways: increased
A.V. Newman et al. / Journal of Volcanology and Geothermal Research 105 (2001) 183±206202
magmatic volume at shallow levels, thermal expansion
of heated surroundings, and exsolution of magmatic
gas as saturated magma moves upward to lower pres-
sures (the solubility of volatiles in basaltic magma,
especially CO2, is a strong function of pressure in this
depth range (Dixon and Stolper, 1995), thus signi®cant
degassing is expected).
Magma and ¯uid volatiles are more likely to be
forcibly injected into surrounding country rock near
the time of peak pressure, providing a physically plau-
sible mechanism for subsequent pressure drop in the
source, and potentially causing: (1) expansion of
nearby dikes; (2) slip on nearby faults due to ¯uid
injection and consequent reduction of effective
normal stress; and (3) enhanced expulsion of
magmatic volatiles. The linear spatial trend of seismi-
city that we observe near the south moat in November
1997 is consistent with (1) or (2). Dreger et al. (2000)
note that four of these earthquakes with M . 4 had
signi®cant non-double couple components indicating
volumetric expansion, also consistent with (1) or (2).
McGee et al. (2000) note increased CO2 ¯ux in
September±October 1997 into the gas reservoir near
Mammoth Mountain (Farrar et al., 1995; Gerlach et
al., 1998), consistent with (3).
The elevated pressure at the top of the magma cham-
ber reached a maximum value in late November 1997,
coinciding with the time of maximum seismic moment
release (Fig. 12). One scenario consistent with this
timing is that pressure in or near the top of the
magma chamber increased due to magma rise, stressing
adjacent rock until brittle failure conditions were
reached somewhere nearby, and/or promoting injection
of ¯uids into pre-existing faults, lowering effective
normal stress and leading to large earthquakes.
The resulting shaking and rock fracture may have
facilitated loss of volatiles from the pressurized
magma chamber, and/or intrusion of magma into the
country rock, consequently pressure began to decline
rapidly. Thus the rapid losses of pressure that we infer
to have occurred in December 1997 and early 1998
(Fig. 12) may represent periods of signi®cant fracture
opening.
By mid-1999, pressure had declined to a relatively
low value, nearly the pre-deformation episode value.
Note that with the viscoelastic shell model, rapid uplift
continues for several months after pressure begins to
decline from its peak value, and the elevated state is
maintained for many months, even after pressure has
declined to near background values. In contrast, with
purely elastic models, the pressure increment must
remain at elevated values to maintain the uplifted
state (Fig. 12, inset). For long-lived, sustained uplift
such as currently characterizes the resurgent dome at
Long Valley, this may require maintaining pressure
increments approaching lithostatic values for extended
periods of time (Bonafede et al., 1986). The pressure
variation predicted by the viscoelastic shell model is
more physically plausible because peak pressures are
only maintained for a short time.
5. Conclusions
Surface deformation at Long Valley increased
exponentially in mid- and late 1997 with a time
constant of about 60 days, followed by an exponential
decrease with about the same time constant. We
explain this behavior with a model that incorporates
realistic rheology, whereby surface deformation on
the resurgent dome mainly re¯ects an exponential-
like pressure increase near the top of the magma
chamber, ®ltered by the viscoelastic response of a
ductile, semi-solid rhyolitic ªcapº near the top of
the magma chamber and/or quartz-bearing country
rock surrounding the magma chamber. The pressure
increase occurred over about one year, reaching peak
values at the end of November 1997, the time of major
seismic moment release, after which it declined.
Models that incorporate viscoelastic behavior near
the magma chamber are preferred over purely elastic
models for silicic volcanic centers like Long Valley,
particularly for geodetic data spanning several months
to years and recording long-lived deformation
episodes, where viscous relaxation may be important.
No eruption resulted from the high deformation rate
ªeventº of mid±late 1997, although one can imagine a
scenario involving higher surface deformation rates,
higher intrusion rates, and higher peak pressures at the
top of the magma chamber, culminating in eruption.
Perhaps the most important result from the observa-
tions described here is that continuous geodetic and
seismic monitoring may provide several months
warning for this class of volcanic hazard at silicic
calderas, as well as providing some constraints on
physical properties near the magma chamber.
A.V. Newman et al. / Journal of Volcanology and Geothermal Research 105 (2001) 183±206 203

Acknowledgements
We thank John Langbein for sharing unpublished
two-color EDM data, and the Northern California
Seismic network, supported by the US Geological
Survey, Menlo Park and the Seismological Labora-
tory, UC Berkeley for earthquake data. We also
thank Maurizio Bonafede, Michelle Dragoni, Don
Dingwell, Paul Wallace, Anke Freidrich, Dave Jack-
son, Paul Segall and Eric Ivins for discussions, Bob
Tilling for encouragement and Dave Hill for construc-
tive reviews. Several ®gures in this paper were
produced with GMT software (Wessel and Smith,
1995). This work was supported by grants from
NASA's Solid Earth and Natural Hazards Program
to T. Dixon and NSF grants OCE-9702795 to J.
Dixon and EAR-9615561 to T. Dixon.
References
Anderson Jr, A.T., Newman, S., Williams, S.N., Druitt, T.H.,
Skirius, C., Stolper, E., 1989. H2O, CO2, Cl, and gas in Plinian
and ash-¯ow Bishop rhyolite. Geology 17, 221±225.
Arzi, A.A., 1978a. Critical phenomena in the rheology of partially
melted rocks. Tectonophysics 44, 173±184.
Arzi, A.A., 1978b. Fusion kinetics, water pressure, water diffusion
and electrical conductivity in melting rock, interrelated. J.
Petrol. 19, 154±169.
Bailey, R.A., 1984. Chemical evolution and current state of the
Long Valley magma chamber. U.S. Geol. Surv., OFR 84-939,
pp. 24±40.
Bailey, R.A., 1989. Geologic map of the Long Valley Caldera,
Mono±Inyo Craters volcanic chain, and vicinity, Eastern
California. Map I-1933, U.S. Geol. Surv. Misc. Invest. Series.
Bailey, R.A., Dalrymple, G.B., Lanphere, M.A., 1976. Volcanism,
structure and geochronology of Long Valley Caldera, Mono
County, California. J. Geophys. Res. 81, 725±744.
Battaglia, M., Roberts, C., Segall, P., 1999. Magma intrusion
beneath Long Valley caldera con®rmed by temporal changes
in gravity. Science 285, 2119±2122.
Brace, W.F., Kohlstedt, D.L., 1980. Limits on lithospheric stress
imposed by laboratory experiments. J. Geophys. Res. 85,
6248±6252.
Bonafede, M., Dragoni, M., Quareni, F., 1986. Displacement and
stress ®elds produced by a centre of dilation and by a pressure
source in a viscoelastic half-space: application to the study of
ground deformation and seismic activity at Campi Flegrei, Italy.
Geophys. J. R. Astron. Soc. 87, 455±485.
Christiansen, R.L., Lipman, P.W., 1972. Cenozoic volcanism and
plate tectonic evolution of the western US, 2: Late Cenozoic.
Philos. Trans. R. Soc. London Ser. A 271, 249±284.
Cousens, B.L., 1996. Magmatic evolution of Quaternary ma®c
magmas at Long Valley Caldera and the Devil's Postpile,
California: effects of crustal contamination on lithospheric
mantle-derived magmas. J. Geophys. Res. 101, 27673±27689.
Dingwell, D.B., 1995. Relaxation in silicate melts: some applica-
tions. Mineral. Soc. Am. Rev. Mineral. 32, 21±66.
Dingwell, D.B., Webb, S.L., 1989. Structural relaxation in silicate
melts and non-Newtonian melt rheology in geologic processes.
Phys. Chem. Minerals 16, 508±516.
Dixon, J.E., Stolper, E.M., 1995. An experimental study of water
and carbon dioxide solubilities in mid-ocean ridge basaltic
liquids, part II: applications to degassing. J. Petrol. 36,
1633±1646.
Dixon, T.H., Mao, A., Bursik, M., He¯in, M., Langbein, J., Stein,
R., Webb, F., 1997. Continuous monitoring of surface deforma-
tion at Long Valley Caldera, California, with GPS. J. Geophys.
Res. 102, 12017±12034.
Dixon, T.H., Miller, M., Farina, F., Wang, H., Johnson, D., 2000.
Present-day motion of the Sierra Nevada block and some
tectonic implications for the Basin and Range province, North
America Cordillera. Tectonics 19, 1±24.
Dragoni, M., Magnanensi, C., 1989. Displacement and stress produced
by a pressurized, spherical magma chamber, surrounded by a
viscoelastic shell. Phys. Earth Planet. Inter. 56, 316±328.
Dreger, D.S., Tkalcic, H., Johnston, M., 2000. Dilational processes
accompanying earthquakes in the Long Valley Caldera. Science
288, 122±125.
Dunbar, N.W., Hervig, R.L., 1992. Petrogenesis and volatile strati-
graphy of the Bishop Tuff: evidence from melt inclusion
analysis. J. Geophys. Res. 97, 15129±15150.
Dvorak, J.J., Dzurisin, D., 1997. Volcano geodesy: the search for
magma reservoirs and the formation of eruptive vents. Rev.
Geophys. 35, 343±384.
Dvorak, J., Okamura, A.T., 1987. A hydraulic model applied to
variations in tilt rate during summit subsidence events at Hawai-
ian volcanoes. In: Decker, R.W., Wright, T.L., Stauffer, P.H.
(Eds.), Volcanism in Hawaii vol. 2. US Geol. Surv. Prof Pap.
1350, pp. 1281±1296.
Farrar, C.D., Sorey, M.L., Evans, W.C., Howle, J.F., Kerr, B.D.,
Kennedy, B.M., 1995. Forest-killing diffuse CO2 emission at
Mammoth Mountain as a sign of magmatic unrest. Nature
376, 675±678.
Eichelburger, J.C., Gooley, R., 1977. Evolution of silicic magma
chambers and their relationship to basaltic volcanism. In:
Heacock, J.G. (Ed.), The Earth's Crust Ð Its Nature and
Physical Properties. Geophysics Monograph Series, vol. 20.
American Geophysical Union, Washington, DC, pp. 57±77.
Eichelburger, J.C., Vogel, T.A., Younker, L.W., Miller, C.D.,
Keiken, G.H., Wohletz, K.H., 1988. Structure and strati-
graphy beneath a young phreatic vent: south Inyo Crater,
Long Valley caldera, California. J. Geophys. Res. 93, 13208±
13220.
Ferry, J.M., 1996. Three novel isograds in metamorphosed siliceous
dolomites from the Ballachulish aureole, Scotland. Am.
Mineral. 81, 485±494.
Fink, J.H., 1985. The geometry of silicic dikes beneath the Inyo
Domes. J. Geophys. Res 90, 11127±11134.
Gerlach, T.M., Doukas, M.P., McGee, K.A., Kessler, R., 1998.
Three year decline of magmatic CO2 emissions from soils of
A.V. Newman et al. / Journal of Volcanology and Geothermal Research 105 (2001) 183±206204

a Mammoth Mountain tree kill: Horseshoe Lake, CA,
1995±1997. Geophys. Res. Lett. 25, 1947±1950.
Hanks, T.C., Kanamori, H., 1979. A moment±magnitude scale. J.
Geophys. Res. 84, 2348±2350.
Hibbit, Karlsson, Sorenson, Inc., 1998. ABAQUS User's Manual,
version 5.8, Hibbit, Karlsson and Sorenson, Inc., Pawtucket,
Rhode Island.
Hildreth, W., 1981. Gradients in silicic magma chambers: implications
for lithospheric magmatism. J. Geophys. Res. 86, 10153±10192.
Hildreth, W., Mahood, G.A., 1986. Ring fracture eruption of the
Bishop tuff. Geol. Soc. Am. Bull. 97, 396±403.
Hill, D.P., Johnston, M.J.S., Langbein, J.O., McNutt, S.R., Miller,
C.D., Mortensen, C.E., Pitt, A.M., Rojstaczer, S., 1991. Response
plans for volcanic hazards in the Long Valley Caldera and Mono
Craters area, California. U.S. Geol. Surv. OFR 91-270.
Hill, D.P., Ellsworth, W.L., Johnston, M.J.S., Langbein, J.O., Oppen-
heimer, D.H., Pitt, A.M., Reasenberg, P.A., Sorey, M.L., McNutt,
S.R., 1990. The 1989 Earthquake swarm beneath Mammoth
Mountain, California: An Initial Look at the 4 May through 30
September Activity. Bull. Seismol. Soc. Am. 80, 325±339.
Hill, D.P., Sorey, M.L., Ellsworth, W.L., 1998. Scienti®c drilling
continues in Long Valley Caldera, California. EOS, Trans. Am.
Geophys. Union 79, 429.
Hill, D.P., 1992. Temperatures at the base of the seismogenic crust
beneath Long Valley Caldera, California, and the Phlegrean
Fields Caldera, Italy. In: Gasparini, P., Scarpa, R., Aki, K.
(Eds.), Volcanic Seismology. IAVCEI Proceedings in Volcanol-
ogy, vol. 3. Springer, Berlin, pp. 432±461.
Ivins, E.R., 2000. Correction to Transient creep of a composite
lower crust 2. A polymineralic basis for rapidly evolving post-
seismic deformation modes. J. Geophys. Res. 105, 3229±3232.
Izett, G.A., Obradovitch, J.D., 1994. 40Ar±39Ar age constraints for
the Jaramillo normal subchron and the Matuyama±Brunhes
geomagnetic boundary. J. Geophys. Res. 99, 2925±2934.
Jaoul, O., Tullis, J., Kronenburg, A., 1984. The effect of varying
water contents on the creep behavior of Heavitree quartzite. J.
Geophys. Res. 89, 4298±4312.
Johnston, D.A., 1978. Volatiles, magma mixing, and the mechanism
of eruption of Augustine volcano, Alaska. PhD thesis, Univer-
sity of Washington, Seattle, WA.
Kenner, S.J., Segall, P., 2000. Post-seismic deformation following
the 1906 San Francisco earthquake. J. Geophys. Res. 105,
13195±13210.
Kirby, S.H., Kronenburg, A.K., 1987. Rheology of the lithosphere:
selected topics. Rev. Geophys. Space Phys. 25, 1219±1244.
Langbein, J.O., 1989. Deformation of the Long Valley Caldera,
eastern California, from mid-1983 to mid-1988: measure-
ments using a two color geodimeter. J. Geophys. Res. 94,
3833±3849.
Langbein, J.O., Hill, D.P., Parker, T.N., Wilkinson, S.K., 1993. An
episode of re-in¯ation of the Long Valley Caldera, eastern Cali-
fornia, 1989±1991. J. Geophys. Res. 98, 15851±15870.
Langbein, J.O., Dzurisin, D., Marshall, G., Stein, R., Rundle, J.,
1995. Shallow and peripheral volcanic sources of in¯ation
revealed by modeling two-color geodimeter and leveling data
from Long Valley caldera, California, 1988±1992. J. Geophys.
Res. 100, 12487±12495.
Langbein, J., Wilkinson, S., Johnston, M., Feinberg, J., Bilham, R.,
1998. The 1997±98 in¯ation episode of Long Valley caldera
and comparison with the 1989±95 episode. EOS: Trans. Am.
Geophys. Union 79 (45), F963.
Lejeune, A.-M., Richet, P., 1995. Rheology of crystal-bearing sili-
cate melts: an experimental study at high viscosities. J.
Geophys. Res. 100, 4215±4229.
Linde, A., Agustssin, K., Sacks, I.S., Stefansson, R., 1994. Mechan-
ism of the 1991 eruption of Hekla from continuous borehole
strain monitoring. Nature 365, 737±740.
Luan, F.C., Patterson, M.S., 1992. Preparation and deformation of
synthetic aggregates of quartz. J. Geophys. Res. 97, 301±320.
Maalùe, S., Wyllie, P., 1975. Water content of a granite magma
deduced from the sequence of crystallization determined experi-
mentally with water-undersaturated conditions. Contrib.
Mineral. Petrol. 52, 175±191.
Mankinen, E.A., Gromme, M.C.S., Dalyrymple, G.B., Lanphere,
M.A., Bailey, R.A., 1986. Paleomagnetism and K±Ar ages of
volcanic rocks from Long Valley Caldera, California. J.
Geophys. Res. 91, 633±652.
Marchildon, N., Dipple, G.M., 1998. Irregular isograds, reaction
instabilities and the evolution of permeabiliy during meta-
morphism. Geology 26, 15±18.
Marsh, B.D., 1981. On the crystallinity, probability of occurrence,
and rheology of lava and magma. Contrib. Mineral. Petrol. 78,
85±98.
Mao, A., Harrison, C.G., Dixon, T.H., 1999. Noise in GPS coordi-
nate time series. J. Geophys. Res 104, 2797±2816.
McGee, K.A., Gerlach, T.M., Kessler, R., Douglas, M.P., 2000.
Geochemical evidence for a magmatic CO2 degassing event at
Mammoth Mountain, California, September±December 1997.
J. Geophys. Res. 105, 8447±8456.
Metz, J.M., Mahood, G.A., 1985. Precursors to the Bishop Tuff
eruption: Glass Mountain, Long Valley, California. J. Geophys.
Res. 90, 11121±11126.
Miller, C.D., 1985. Holocene eruptions at the Inyo volcanic chain,
California: implications for possible eruptions in Long Valley
Caldera. Geology 13, 14±17.
Mogi, K., 1958. Relations between the eruptions of various volca-
noes and the deformations of the ground surfaces around them.
Bull. Earthquake Res. Inst., Univ. Tokyo 36, 99±134.
Neuville, D.R., Courial, P., Dingwell, D.B., Richet, P., 1993.
Thermodynamic and rheological properties of rhyolite and
andesite melts. Contrib. Mineral. Petrol. 113, 572±581.
Newman, S., Epstein, S., Stolper, E., 1988. Water carbon dioxide
and hydrogen is glasses from the ca. 1340 AD eruption of the
Mono Craters, California: constraints on degassing phenomena
and initial volatile content. J. Volcanol. Geotherm. Res. 35, 75±96.
Owen, S., Segall, P., Lisowski, M., Miklius, A., Bevis, M., Foster,
J., 1997. The January 30, 1997 ®ssure eruption in Kilauea's East
Rift Zone as measured by continuous GPS. EOS, Trans. Am.
Geophys. Union 78, S105.
Pallister, J.S., Hoblitt, R.P., Reyes, A.G., 1992. A basalt trigger
for the 1991 eruptions of Pinatubo volcano?. Nature 356,
426±428.
Patterson, M.S., Luan, F.C., 1990. Quartzite rheology under
geological conditions. In: Knipe, R.J., Rutter, E.H. (Eds.),
A.V. Newman et al. / Journal of Volcanology and Geothermal Research 105 (2001) 183±206 205

Deformation Mechanisms, Rheology and Tectonics. Geol. Soc.,
London, Spec. Publ. 54. 299±307.
Pollitz, F.F., Peltzer, G., BuÈrgmann, R., 2000. Mobility of continen-
tal mantle: evidence from post-seismic geodetic observations
following the 1992 Landers earthquake. J. Geophys. Res. 105,
8035±8054.
Richet, P., Bottinga, Y., 1995. Rheology and con®gurational
entropy of silicate melts. Mineral. Soc. Am. Rev. Mineral. 32,
67±93.
Richet, P., Lejeune, A.-M., Holtz, F., Roux, J., 1996. Water and
viscosity of andesite melts. Chem. Geol. 128, 185±197.
Rundle, J., et al., 1985. Seismic imaging in Long Valley, California,
by surface and borehole techniques: an investigation of active
tectonics. EOS: Trans. Geophys. Union 66, 194±210.
Rundle, J.B., Hill, D.P., 1988. The geophysics of a restless caldera
Ð Long Valley, California. Annu. Rev. Earth Planet. Sci. 16,
251±271.
Sanders, C.O., Nixon, L.D., 1995. S wave attenuation structure in
Long Valley caldera, California from three-component S to P
amplitude ratio data. J. Geophys. Res. 100, 12395±12404.
Sanders, C.O., Ponko, S.C., Nixon, L.D., Schwartz, E.A., 1995.
Seismological evidence for magmatic and hydrothermal struc-
ture in Long Valley caldera from local earthquake attenuation
and velocity tomography. J. Geophys. Res. 100, 8311±8326.
Savage, J.C., Cockerham, R.S., 1984. Earthquake swarm in Long
Valley Caldera, California, January 1983: evidence for dike
in¯ation. J. Geophys. Res. 89, 8315±8324.
Savage, J.C., Cockerham, R.S., Estrem, J.E., Moore, L.R., 1987.
Deformation near Long Valley Caldera, Esastern California,
1982±1986. J. Geophys. Res. 92, 2721±2746.
Savage, J.C., Lisowski, M., 1998. Viscoelastic coupling model of
the San Andreas fault along the big bend, southern California. J.
Geophys. Res. 103, 7281±7292.
Schulze, F., Behrens, H., Holtz, F., Roux, J., Johannes, W., 1996.
The in¯uence of H2O on the viscosity of a haplogranitic melt.
Am. Mineral. 81, 1155±1165.
Sieh, K., Bursik, M., 1986. Most recent eruption of the Mono
Craters, eastern central California. J. Geophys. Res. 91,
12539±12571.
Sillard, P., Altamimi, Z., Boucher, C., 1998. The ITRF96 realization
and its associated velocity ®eld. Geophys. Res. Lett. 25,
3222±3226.
Skirius, C., 1990. Pre-eruptive water and carbon-dioxide content of
Plinian and ash-¯ow Bishop Tuff Magma. PhD thesis, Univer-
sity of Chicago, Chicago, IL.
Sorey, M.L., 1985. Evolution and present state of the hydrothermal
system in Long Valley Caldera. J. Geophys. Res. 90,
11219±11229.
Sparks, S.R., Sigurdson, H., Wilson, L., 1977. Magma mixing a
mechanism for triggering acid explosive eruptions. Nature
267, 315±318.
Steck, L.K., Prothero, W.A., 1994. Crustal structure beneath Long
Valley caldera from modeling of teleseismic P-wave polariza-
tions and Ps converted waves. J. Geophys. Res. 99, 6881±6898.
Stroujkova, A.F., Malin, P.E., 2000. A magma mass beneath Casa
Diablo? Further evidence from re¯ected seismic waves. Bull.
Seismol. Soc. Am. 90, 500±511.
Thatcher, W., 1983. Non-linear strain build-up and the earthquake
cycle on the San Andreas fault. J. Geophys. Res. 88,
5893±5902.
Trygvason, E., 1980. Subsidence events in the Kra¯a area, north
Iceland, 1975±1979. J. Geophys. Res. 47, 141±153.
van der Molen, I., Paterson, M.S., 1979. Experimental deformation
of partially-melted granite. Contrib. Mineral. Petrol. 70,
299±318.
Varga, R.J., Bailey, R.A., Suemnicht, G.A., 1990. Evidence for 600
year old basalt and magma mixing at Inyo Craters volcanic
chain, Long Valley Caldera, California. J. Geophys. Res. 95,
21441±21450.
Vogel, T.A., Eichelberger, J.C., Younker, L.W., Schuraytz, B.,
Horkowitz, J., Stockman, H., Westrich, H., 1989. Petrology
and emplacement of intrusive and extrusive rhyolites of Obsi-
dian Dome, Inyo Craters volcanic chain, eastern California. J.
Geophys. Res. 94, 17937±17956.
Vogel, T.A., Woodbourne, T.B., Eichelberger, J.C., Layer, P.W.,
1994. Chemical evolution and periodic eruption of ma®c lava
¯ows in the west moat of Long Valley Caldera, California. J.
Geophys. Res. 99, 19829±19842.
Wallace, P.J., Anderson Jr, A.T., Davis, A.M., 1995. Quanti®cation
of pre-eruptive exsolved gas contents in silicic magmas. Nature
377, 612±616.
Webb, S.L., Dingwell, D.B., 1995. Viscoelasticity. Mineral. Soc.
Am. Rev. Mineral. 32, 95±119.
Wessel, P., Smith, W.H.F., 1995. New version of Generic Mapping
Tools. EOS 16, 329.
Winkler, J.G.F., 1974. Petrogenesis of Metamorphic Rocks.
Springer, New York, 276 pp.
Zumberge, J.F., He¯in, M., Jefferson, D., Watkins, M., Webb, F.,
1997. Precise point positioning for ef®cient and robust analysis
of GPS data. J. Geophys. Res. 102, 5005±5017.
A.V. Newman et al. / Journal of Volcanology and Geothermal Research 105 (2001) 183±206206