geographer’s tools what they use to help them analyze spatial relationships
TRANSCRIPT
Geographer’s Tools
What they use to help them analyze spatial relationships.
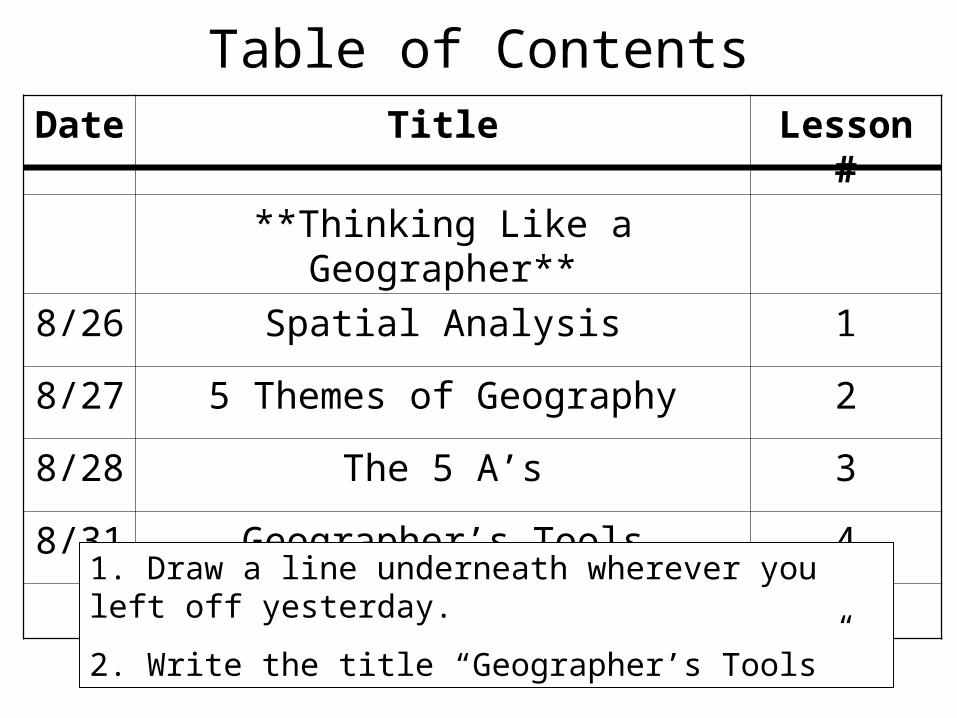
Table of ContentsDate Title Lesson #
**Thinking Like a Geographer**
8/26 Spatial Analysis 1
8/27 5 Themes of Geography 2
8/28 The 5 A’s 3
8/31 Geographer’s Tools 4
1. Draw a line underneath wherever you left off yesterday.
2. Write the title “Geographer’s Tools”
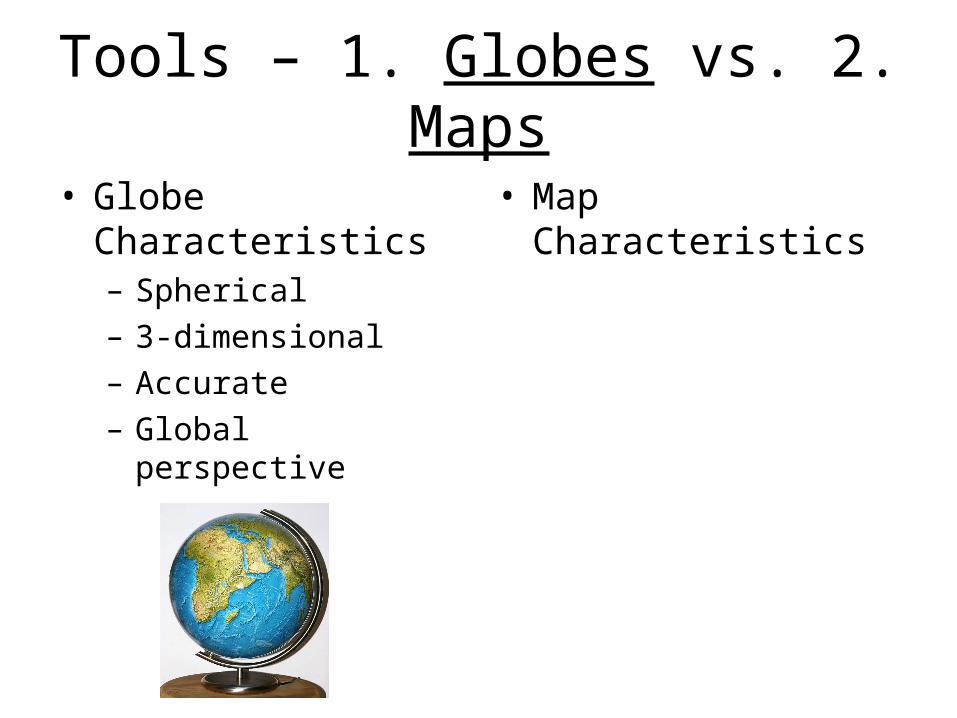
Tools – 1. Globes vs. 2. Maps
• Globe Characteristics– Spherical– 3-dimensional– Accurate– Global perspective
• Map Characteristics
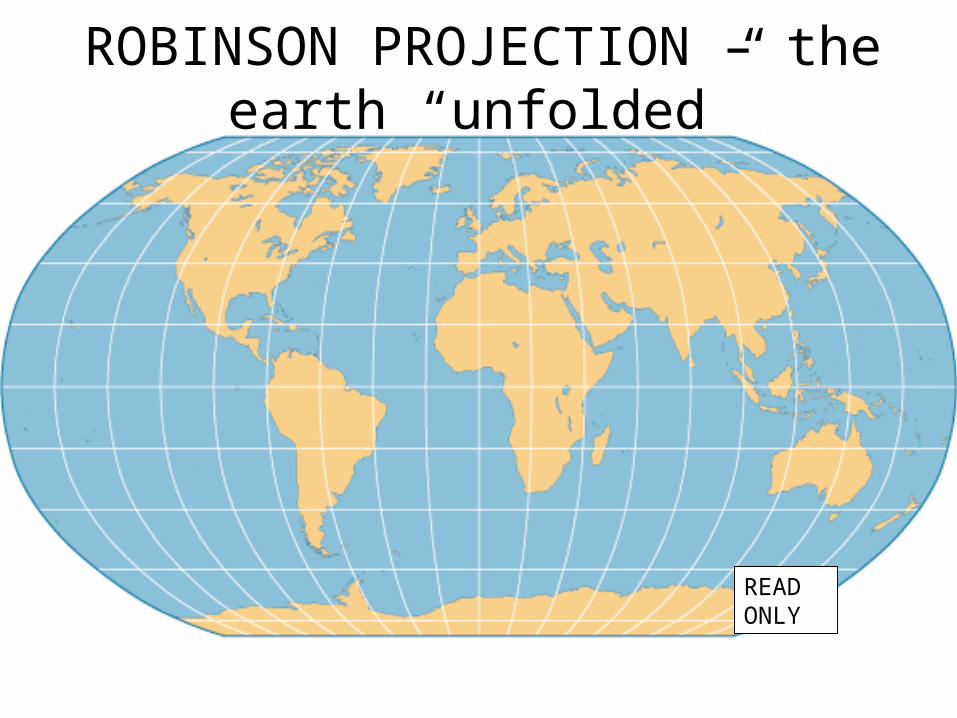
ROBINSON PROJECTION – the earth “unfolded”
READ ONLY
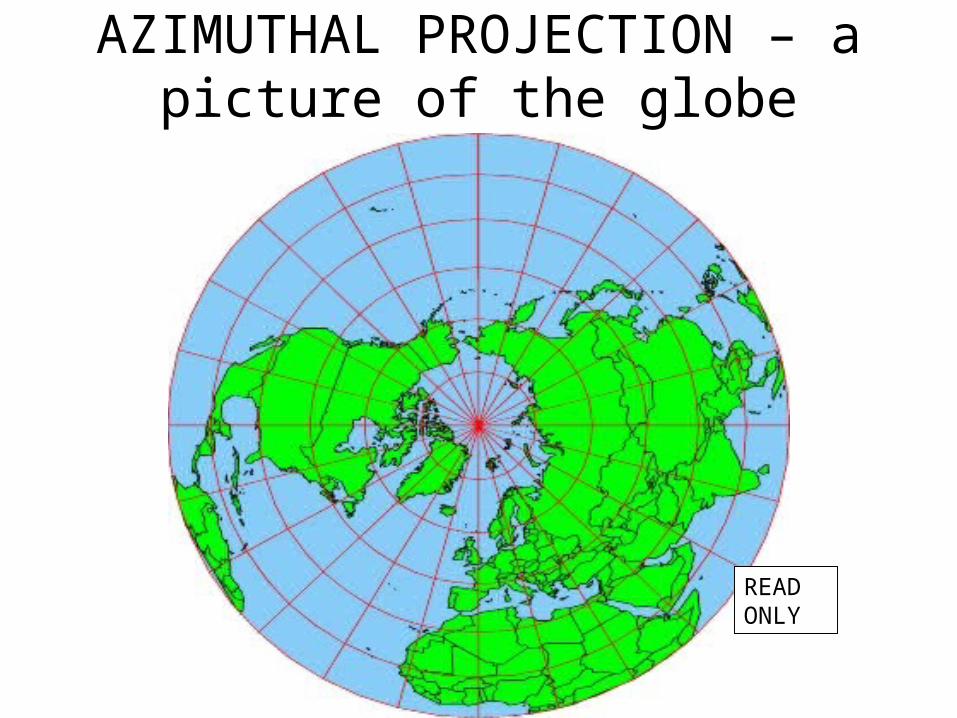
AZIMUTHAL PROJECTION – a picture of the globe
READ ONLY
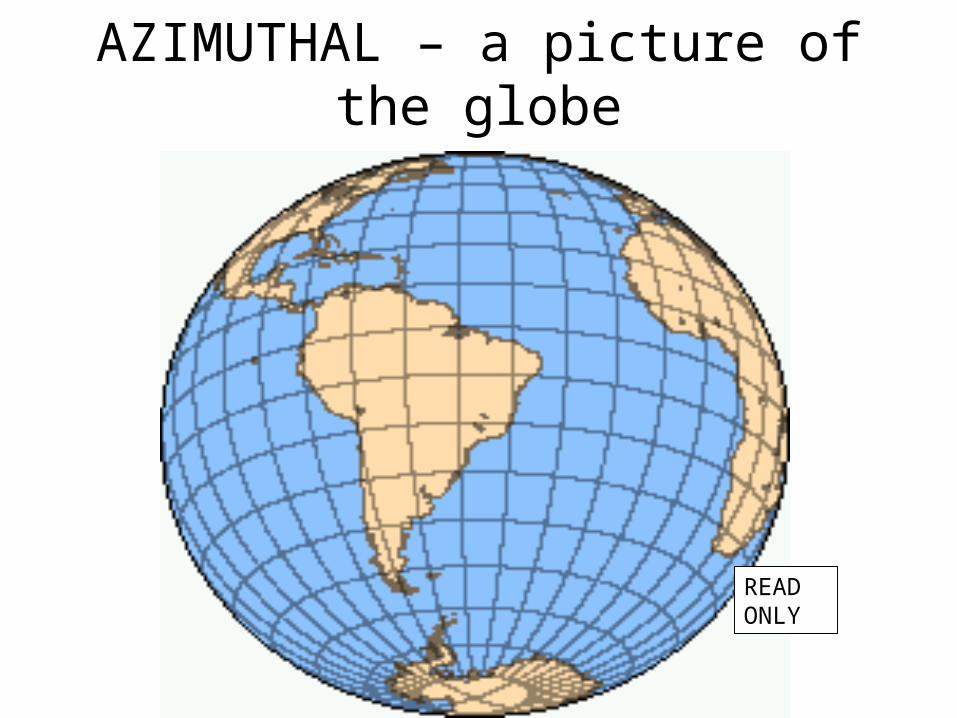
AZIMUTHAL – a picture of the globe
READ ONLY
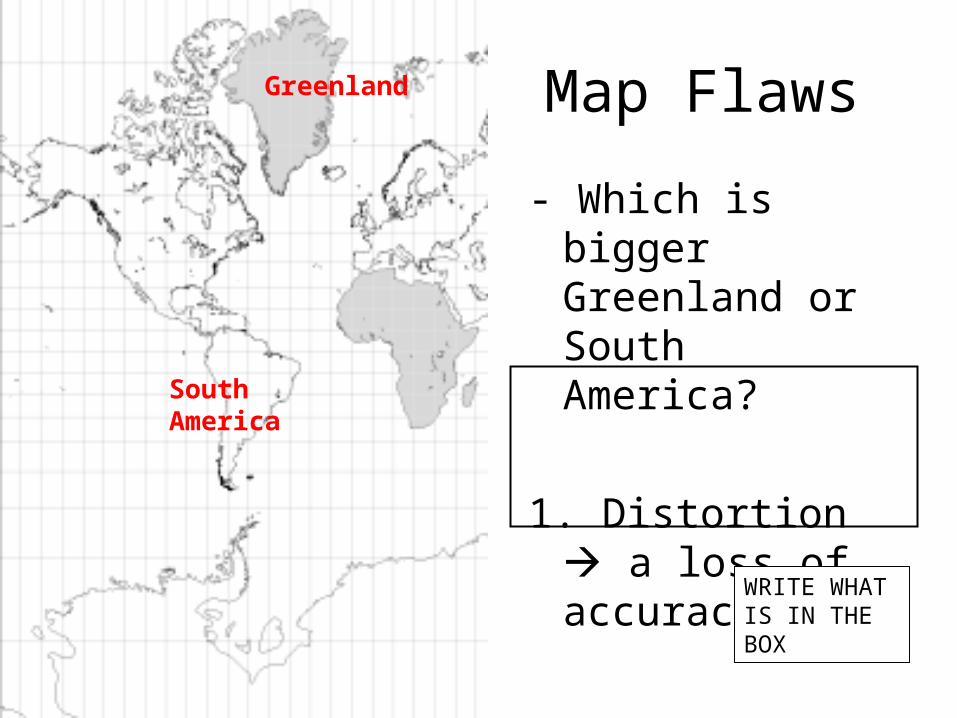
Map Flaws
- Which is bigger Greenland or South America?
1. Distortion a loss of accuracy
Greenland
South America
WRITE WHAT IS IN THE BOX
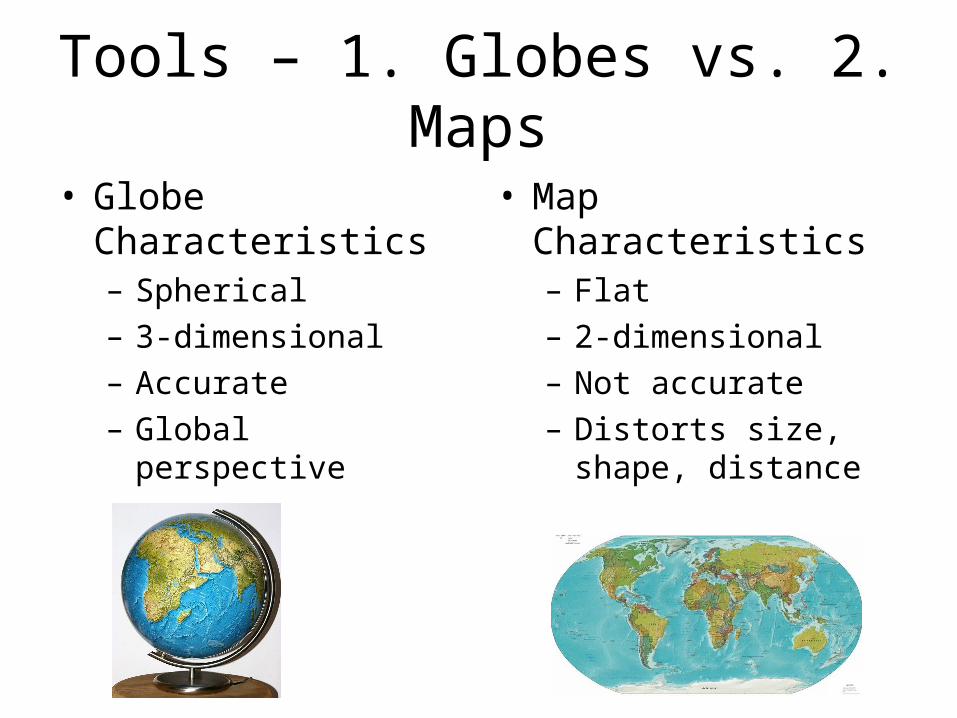
Tools – 1. Globes vs. 2. Maps
• Globe Characteristics– Spherical– 3-dimensional– Accurate– Global perspective
• Map Characteristics– Flat– 2-dimensional– Not accurate– Distorts size, shape,
distance
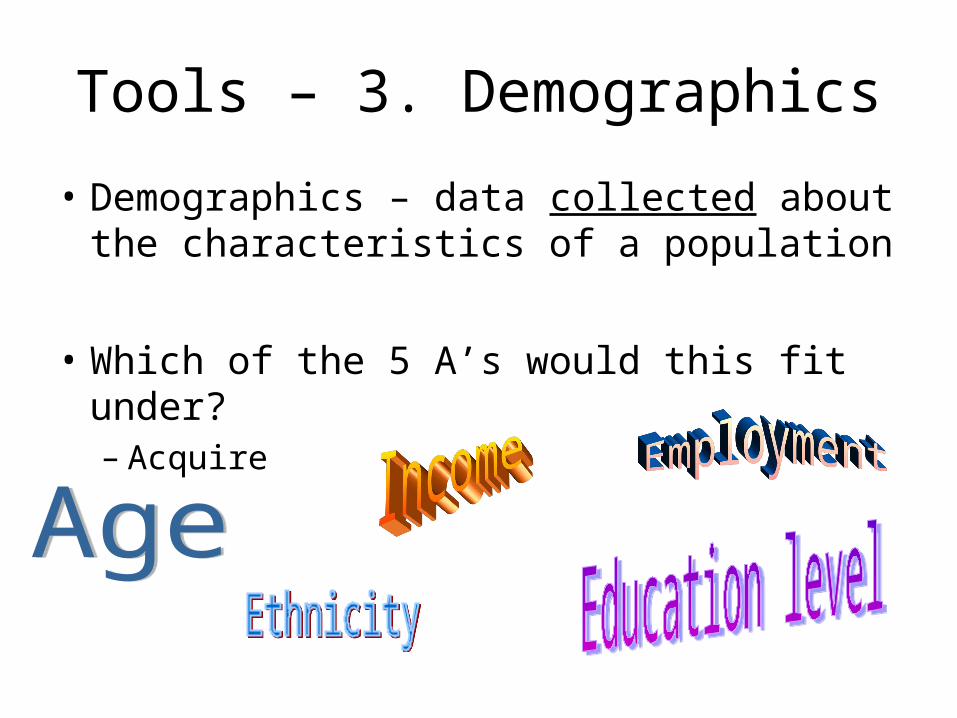
Tools – 3. Demographics
• Demographics – data collected about the characteristics of a population
• Which of the 5 A’s would this fit under?– Acquire
READ ONLY
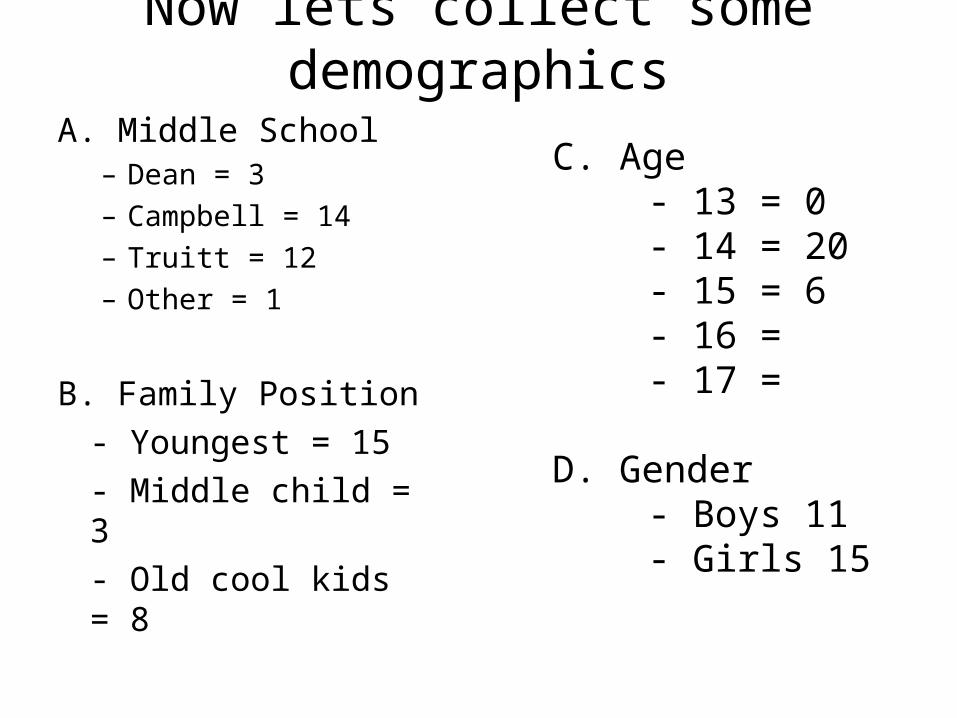
Now lets collect some demographics
A. Middle School – Dean = 3– Campbell = 14– Truitt = 12– Other = 1
B. Family Position
- Youngest = 15
- Middle child = 3
- Old cool kids = 8
C. Age- 13 = 0- 14 = 20- 15 = 6- 16 = - 17 =
D. Gender- Boys 11- Girls 15
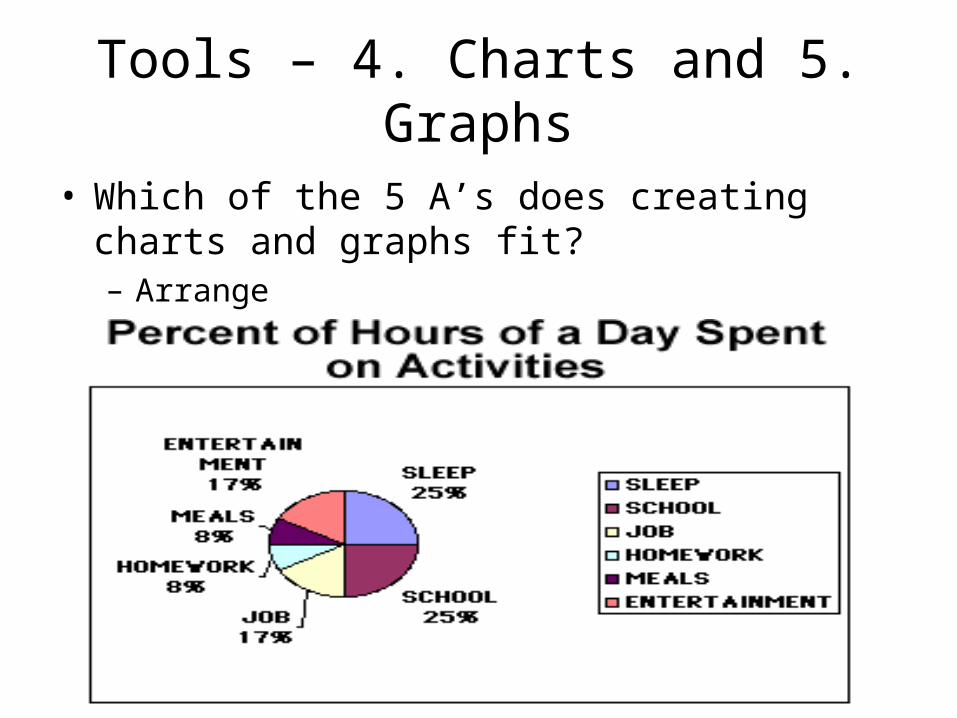
Tools – 4. Charts and 5. Graphs
• Which of the 5 A’s does creating charts and graphs fit? – Arrange
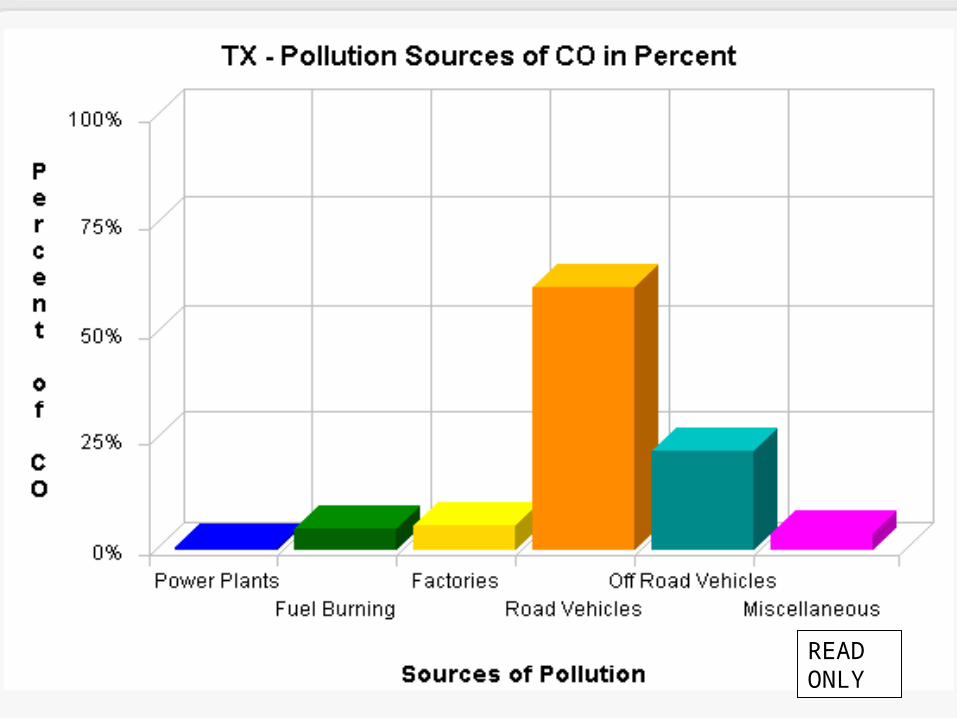
READ ONLY
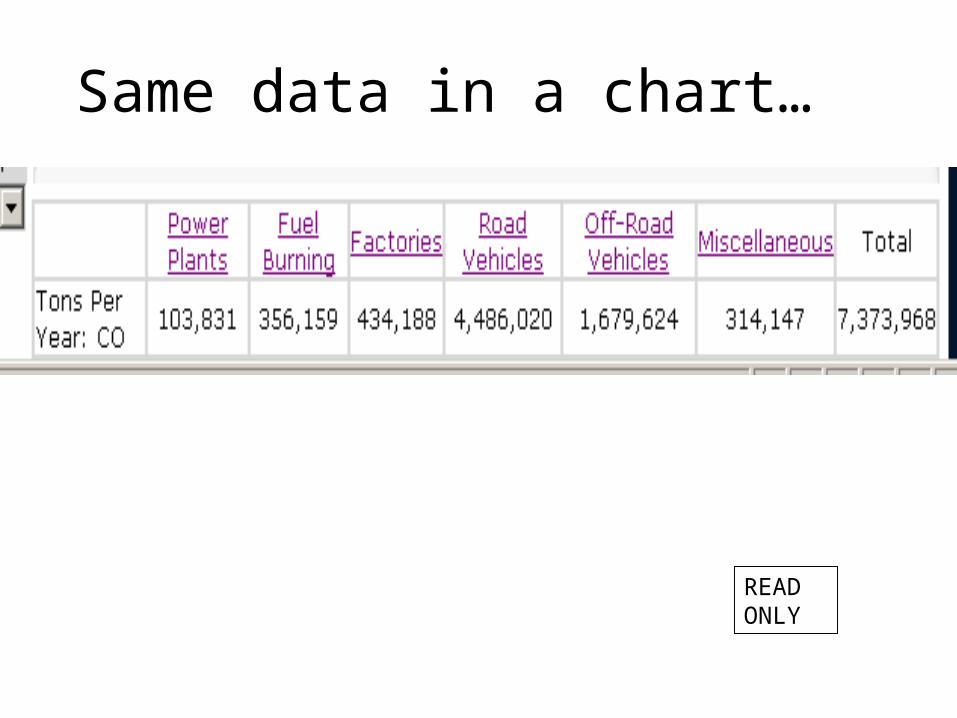
Same data in a chart…
READ ONLY
Task
• Use the data we collected to create 1 bar graph using the demographics we collected about the class– Include labels on each axis– Include a key and title
• Create 1 pie graph using the demographics we collected about the class– Calculate the correct percentages and try to create
accurate pie graphs– Label the percentages– Include a key and title
Baltimore Crime Map
• As you look at the map. Figure out the following: – After this information is presented to you as
mayor what is one thing you would do? – Who else would make decisions based on this
map?
READ ONLY
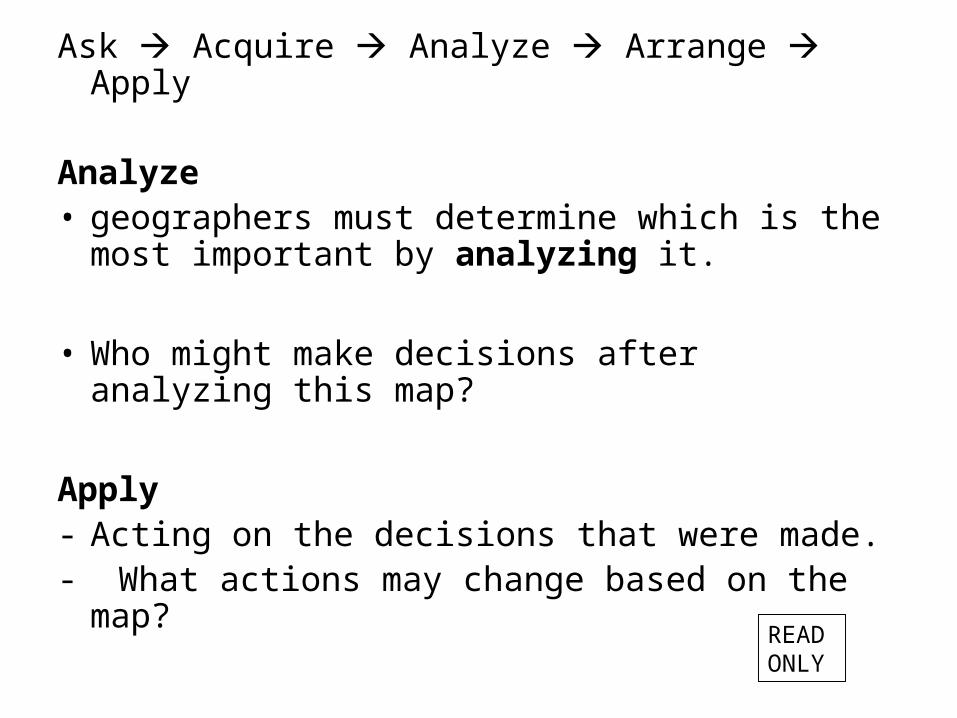
Ask Acquire Analyze Arrange Apply
Analyze• geographers must determine which is the most
important by analyzing it.
• Who might make decisions after analyzing this map?
Apply- Acting on the decisions that were made.- What actions may change based on the map?
READ ONLY
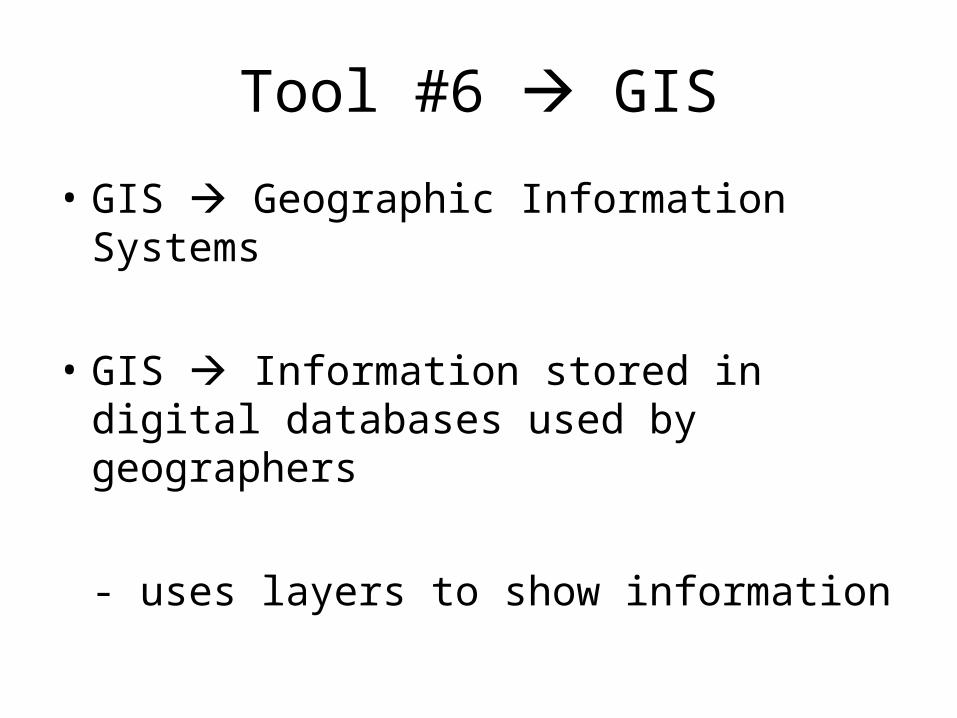
Tool #6 GIS
• GIS Geographic Information Systems
• GIS Information stored in digital databases used by geographers
- uses layers to show information
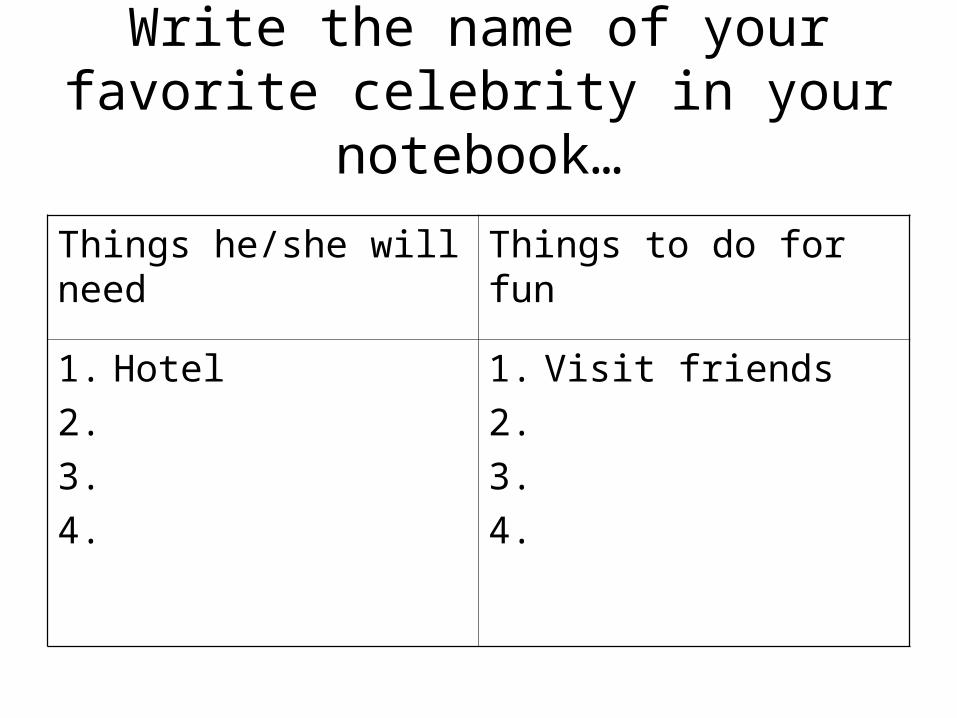
Write the name of your favorite celebrity in your notebook…
Things he/she will need Things to do for fun
1. Hotel
2.
3.
4.
1. Visit friends
2.
3.
4.
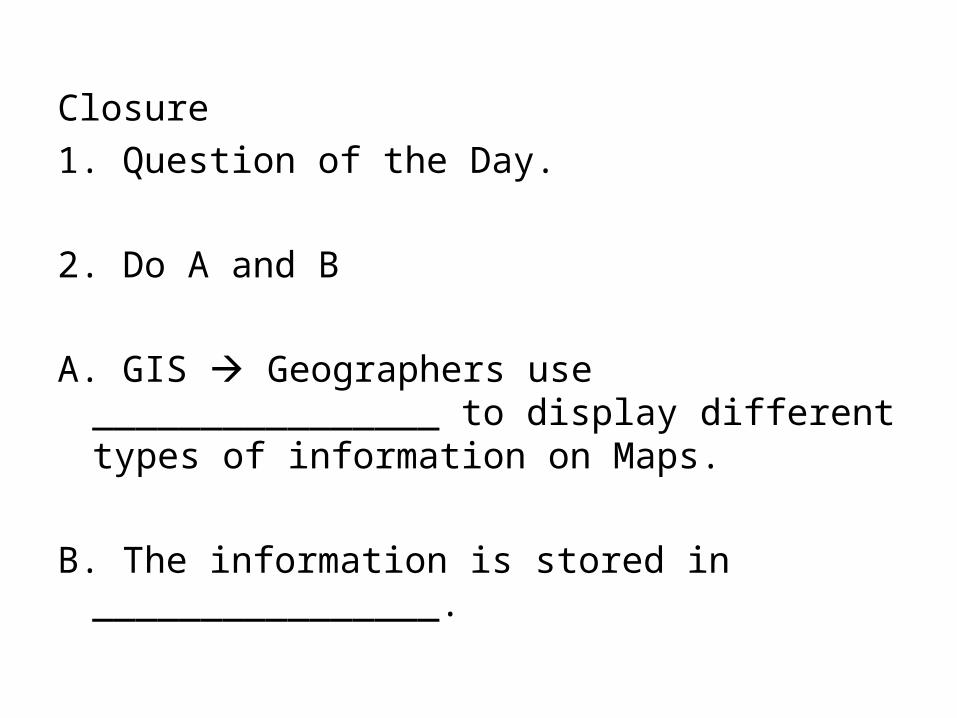
Closure
1. Question of the Day.
2. Do A and B
A. GIS Geographers use ________________ to display different types of information on Maps.
B. The information is stored in ________________.
Crisis!
• Your celebrity friend has only one day to spend with you.
• What tool could you use to ensure that you do everything on your list in one day?
READ ONLY
Tool #7 - GPS
• GPS Global Positioning System
• Definition – directions are given using satellites to determine absolute location
• Clip: – Explain how turn-by-turn directions work.– How could this help a geographer?
Task
• Pretend you have a GPS in your hand. Create turn-by-turn directions to the lunch room, auditorium, gym, your bus line, Wal-Mart, etc.