geographic operating range evaluation … operating range evaluation of a nir soil sensor ... cation...
TRANSCRIPT

PURCHASfD8V USDA~DR ~~I CIAt USf
GEOGRAPHIC OPERATING RANGE EVALUATION
OF A NIR SOIL SENSOR
K. A. Sudduth, J. W. Hummel
ABSTRACT.A previously developed prototype soil sensor which used near infrared (NIR) reflectance techniques was testedin the laboratory. The test set of soils included 30 Illinois soils and another 33 soils collected from across the continentalU.S., all prepared at soil moisture tensions ranging from 1.5 MPa (wilting point) to 0.033 MPa (field capacity). As thegeographic range represented by the included samples was increased, the predictions of organic carbon, cation exchangecapacity, and soil moisture became less accurate. Calibrations obtained with soils from several states of the lower CornBelt (Illinois, Missouri, Indiana, and Ohio) were only slightly less predictive of soil organic carbon than calibrationsdeveloped for the Illinois soils alone. Extension of the geographic range westward or northward from this area reducedthe organic carbon prediction accuracy to an unacceptable level. Keywords. Organic matter; Soil moisture,Spectrophotometry, Instrumentation, Precision agriculture.
Cropping system management is generallypracticed on a field basis, with fertilizers,pesticides, and seed applied at a uniform rate overthe whole field. Actual needs for these inputs can
commonly vary by a factor of two or more over the field sothat a uniform rate based on the spatially averagedrequirements is too high for some areas and too low forothers. Over-application results in increased productioncosts and may also cause environmental damage due toexcess chemical contaminating surface water orgroundwater. Under-application can result in decreasedyields due to poor control of pests and inadequate fertilitylevels. Ideally, application rates should be adjusted to meetthe requirements for each part of the field.
With many soil-applied herbicides, the application raterequired for effective weed control increases as soil organiccarbon content (or organic matter content*) increases, dueto adsorption of the herbicide on the cation exchangecomplex of the organic matter. Meggitt (1970) reported thata linear increase in herbicide dose was required to maintainweed control as organic matter increased up to 15%, whenusing compounds such as s-triazines, thiocarbamates, andpyridazinones. Variations in organic matter of almost 100%were observed along an 80-m transect in a flat, apparentlyuniform field in central Illinois (Sudduth and Hummel,
Article was submitted for publication in October 1995; reviewed andapproved for publication by the Power and Machinery Div. of ASAE inJune 1996.
The authors are Kenneth A. Sudduth, ASAE Member Engineer,
Agricultural Engineer, Cropping Systems and Water Quality Research Unit,USDA-Agricultural Research Service, Agricultural Engineering Building,University of Missouri, Columbia; and John W. Hummel, ASAE MemberEngineer, Agricultural Engineer, Crop Protection Research Unit, USDA-Agricultural Research Service, University of Illinois, Urbana.Corresponding author: Kenneth A. Sudduth, USDA-ARS CroppingSystems and Water Quality Research Unit, Agric. Engineering Building,University of Missouri, Columbia, MO 65211; telephone: (573) 882-4090; fax: (573)882-1115; e-mail: <[email protected]>.* In the context of this research, soil organic matter content is defined as
1.72 times the organic carbon content.
1993b); larger variations might be expected in areas withmore variable topography or over longer distances. Withthis level of variability, significant opportunity exists forcost savings through input optimization of soil-appliedherbicides based on soil organic matter content.
Higher organic matter content soils are generally lessreflective than soils with lower organic matter contents.Researchers have developed several optical soil organicmatter sensors based on this reflectance difference, withvarying degrees of success. Other soil variables important inspatially variable cropping system management have alsobeen sensed on the basis of soil reflectance properties. Theseinclude nutrient level (for control of fertilizer applicationrate), cation exchange capacity (soil-applied herbicide ratecontrol), and soil moisture (seeding depth control).
Sudduth and Hummel (1993a,b) developed a soil propertysensor based on near infrared (NIR) reflectance and tested itin the laboratory and field with representative lllinois soils.This study, an extension of that work, focused on developingand evaluating NIR-based estimations of soil organic carbon,soil moisture, and cation exchange capacity (CEC) for a suiteof soils obtained over a wider geographic area.
LITERATURE REVIEWSeveral researchers have developed optical soil organic
matter (SaM) sensors designed to be used as a controlinput for variable-rate herbicide application(Krishnan et aI., 1980; Griffis, 1985; Pitts et aI., 1986;Gunsaulis et aI., 1991; Shonk et aI., 1991). A generalreview of past progress in soil organic matter sensingresearch was given by Sudduth et aI. (1991).
In development of the sensor used in this study, Sudduthand Hummel conducted extensive laboratory tests using arepresentative set of 30 Illinois mineral soils. These testsindicated that NIR data analyzed by partial least squaresregression (PLSR) held the most promise for prediction ofsoil organic carbon content. PLSR, a latent variableregression method, was used to reduce the set of collinearindependent variables (reflectances) to a smaller set of
VOL. 39(5): 1599-1604
Transactions of the ASAE
15991996 American Society of Agricultural Engineers
orthogonal components which represented most of thevariability in the original data and contained a reducedamount of random measurement noise (Martens and Naes,1987). The analytical technique was evidently able tominimize the effect of moisture, resulting in improvedSOM prediction as compared to single-wavelength sensing.Excellent correlation [r2 = 0.92, standard error ofprediction(SEP)=0.34% SOM] was obtained when theNIR data were smoothed to a 60 nm data point spacing andthe wavelength range reduced to 1720 to 2380 nm, for atotal of only 12 data points used. Similar correlations wereobtained with a 40 nm data spacing and a slightly smallerwavelength range (Sudduth and Hummel, 1991).
A rugged, portable NIR spectrophotometer wasdeveloped to implement this prediction method, andlaboratory and field tests were completed (Sudduth andHummel, 1993a,b). The sensor used a circular variablefilter (CVF) spinning at 5 Hz to sequentially providemonochromatic, chopped light from a broadband quartz-halogen source. A fiber optic bundle transmitted themonochromatic light to the soil surface, allowing remotemounting of the major portion of the sensor. A lead sulfidephotodetector captured the energy diffusely reflected fromthe soil surface. The output from the detector wasconditioned by an AC-coupled preamplifier and input to acomputer through a 12-bit analog-to-digital converter. Theeffective sensing range was from 1630 to 2650 nm, on a52 nm bandpass. The portable spectrophotometer predictedorganic matter in the laboratory, across a range of soil typesand moisture contents, with a predictive capability (r2 =0.89, SEP = 0.40% SOM) approaching that of dataobtained on the same soils with a research-gradespectrophotometer. Field operation of the prototype sensordid not yield acceptable results (SEP =0.91% SOM), dueat least in part to errors introduced by the movement of soilpast the sensor during the scanning process (Sudduth andHummel, 1993b).
Soil properties other than organic carbon also have aneffect on reflectance characteristics, e.g., moisture, particlesize, and iron content (Baumgardner et aI., 1985). Sudduthand Hummel (1993b) predicted soil moisture and cationexchange capacity for 30 Illinois soils using NIRreflectance techniques. Other researchers have alsopredicted soil moisture content using NIR reflectancemethods (Kano et aI., 1985; Christensen and Hummel,1985; Dalal and Henry, 1986).
In all previous research, calibration of soil organicmatter sensors has been accomplished either within a givensoil catenat (Shonk et aI., 1991) or for a representative setof soils from a single state (Krishnan et aI., 1980; Griffis,1985; Pitts et aI., 1986; Gunsaulis et aI., 1991; Sudduth andHummel, 1993b). However, investigators interested in soilclassification (as opposed to sensing for herbicideapplication rate control) have investigated correlationsbetween organic matter and reflectance or color propertiesfor a wider range of soils. McKeague et aL (1971)correlated Munsell value with organic matter content of thesurface horizons of 115 soils collected in various parts of
t A sequence of soils of about the same age, derived from similar parentmaterial, and occurring under similar climatic conditions, but havingdifferent characteristics due to variation in relief and in drainage.
1600
Canada, obtaining an r2 of 0.36. Stoner and Baumgardner(1980) correlated average reflectance in 100 nm and widerspectral bands with physical and chemical properties of481 soils collected from across the continental U.S. Theyobtained an r2 of 0.46 when considering all 481 soils, and amaximum r2 of 0.66 when analyzing correlationsseparately by climatic zone.
OBJECTIVES
The overall objective of this research was to investigatethe effect of geographic range on the accuracy of soilproperty estimation by NIR reflectance. Specific objectiveswere to:
1. Evaluate organic carbon calibrations of the sensordeveloped by Sudduth and Hummel (1993a) whenusing soils obtained from an expanded geographicrange, as compared to the previous work which usedonly Illinois soils.
2. Investigate NIR estimation of soil moisture contentand CEC over an expanded geographic range usingdata from the same sensor.
3. Evaluate the effect of increasing geographic range onorganic carbon estimations obtained with anindependent set of soil reflectance data, forcomparison to sensor results.
MATERIALS AND METHODSTwo sets of data were used to evaluate the geographic
range of organic carbon prediction. One set of data wasderived from surface samples of 33 soils collected for theUSDA Water Erosion Prediction Project (WEPP). The otherdata were obtained from the Laboratory for ApplicationsofRemote Sensing (LARS) at Purdue University.These LARSsoil property and laboratory reflectance data for 481 soilsamples collected within the continental U.S. were obtainedand analyzed by Stoner and Baumgardner (1980, 1981).Soilmoisturecontent and CEC estimationsbased uponWEPPsoilreflectancedata were alsoevaluated.
WEPP SOILSThe soils selected by the WEPP investigators were
chosen to span a broad range of soil physical, chemical,biological, and mineralogical properties; to be subject toerosion; and to be of regional or national importance(Alberts et aI., 1987). At an erosion study plot within eachchosen soil, three types of soil samples were collected foranalysis: (1) pedon samples from each soil horizon, (2)bulk surface samples, and (3) undisturbed cores. Physicaland chemical properties of the pedon samples weremeasured at the USDA Natural Resources ConservationService National Soil Survey Laboratory (NRCS NSSL).These analyses included particle size, moisture tension,cation exchange capacity, organic carbon, total carbon, andtotal nitrogen (West et aI., 1987).
Surface soil samples were collected at 16 sites withineach plot, on a 4-row x 4-column grid with approximately2 m between samples. The four samples in each columnwere combined, creating four composite samples torepresent the variability in surface soil characteristics(West et aI., 1987). Subsamples of these four compositesurface samples for each of 33 soils (table 1) wereavailable for use in this project.
TRANSACfIONSOFmE ASAE

Soil from each of the 132 samples (4 composite samplesof each of 33 soils) was oven-dried, hand-cleaned toremove foreign material, and crushed to pass through a2 mm sieve. Approximately 150 g was prepared by addingby volume the amount of water required to reach the1.5 MPa (wilting point) moisture tension level asdetermined by the pedon analysis at the USDA-NRCSNSSL (table 1). Water was added to a second subsample toreach the 0.033 MPa (field capacity) moisture tensionlevel. The samples were placed in plastic bags andmanipulated by hand to distribute the added water. Theywere then refrigerated for at least 5 days to allow time forthe added moisture to equilibrate with the soil. Total carbonwas determined by dry combustion of duplicate samples inan induction furnace. Each soil was tested for the presenceof carbonates, to indicate if total carbon was equivalent toorganic carbon. Organic matter content was thendetermined in the standard manner as 1.72 times theorganic carbon content.
Soil samples were analyzed with the NIR laboratorysensor (Sudduth and Hummel, 1993a) in two groups. Thefirst group consisted of three replications of the firstcomposite sample of each soil at each of the two moisturetension levels (n =198).The second group consisted of tworeplications of the three remaining composite samples ofeach soil at each of the two moisture tension levels
VOL. 39(5): 1599-1604
(n =396). The order of data collection was randomizedwithin each replication.
Reflectance data were obtained in the laboratory onprepared samples, using the same procedures reported in theprevious study with 30 Illinois soils (Sudduth and Hummel,1993b).These data were averaged to a 40 nm bandpass andtransformedfrom reflectance to optical density [aD, definedas log 10 (l/reflectance)]. The data covered centerwavelengths from 1640 nm to 2640 nm, for a total of 26processed reflectance readings in each spectrum.Correlationof soil spectralaD data and chemical/physicalproperty datawas accomplished using partial least squares regression(PLSR). The 0.033 MPa and 1.5 MPa moisture tension datawere analyzed as a group to bracket the moisture conditionslikely to be encounteredin field operation.
LARS SOILSThe LARS soil database used" by Stoner and
Baumgardner (1980, 1981) was obtained from PurdueUniversity. This database included information on surfacesoil samples of 242 U.S. soil series. For 239 of these series,duplicate samples were obtained from another site 1 to30 km distant from the primary sampling location,resulting in 481 total samples. The soil series were selectedat random within climatic strata (defined as a temperatureregime - moisture zone combination) from 1,300 U.S.benchmark soils. The samples came from 17 continental
1601
Table 1. Textural class and characteristics of each of 33 soils collected for the USDA Water Erosion Prediction Project (WEPP)
CEC* Soil Moisture*:1: (%)Organic Carbont (%)
(mEql 1.5 0.033State Soil Name Textural Class* Site 1 Site 2 Site 3 Site 4 100g) MPa MPa
Calif. Academy Loam 0.38 0.40 0.35 0.40 5.3 3.5 8.6Los Banos Clay loam 1.78 1.85 1.83 1.88 38.8 19.1 28.4Whitney Sandy loam 0.28 0.27 0.19 0.23 3.4 2.6 6.7
Ga. Bonifay Sand 0.27 0.26 0.21 0.22 1.8 1.1 4.8Cecil Sandy clay loam 0.65 0.62 0.78 0.73 3.5 8.3 14.2Hiwassee Sandy loam 0.63 0.57 0.61 0.56 4.4 6.4 13.8Tifton Loamy sand 0.46 0.48 0.50 0.47 2.1 2.1 6.0
Idaho Portneuf Silt loam 0.72 0.72 0.72 0.72 12.6 8.3 24.7Ind. Lewisburg Clay loam 1.06 0.89 0.98 0.86 12.5 11.3 17.3
Miami Silt loam 0.86 0.77 0.75 0.86 13.3 10.0 22.7Md. Frederick Gravelly silt 1.21 1.17 1.27 1.32 8.4 6.8 26.6
Manor Loam 0.49 0.77 0.88 0.94 11.9 11.7 25.9Opequon Silt loam 1.59 1.57 1.61 1.54 12.9 14.2 25.3
Maine Caribou Gravelly loam 1.99 1.84 1.93 1.61 12.8 8.9 26.9Minn. Bames Loam 1.64 1.71 1.69 1.82 19.5 9.3 21.8
Sverdrup Sandy loam 0.75 0.73 1.28 0.91 11.0 5.4 13.4Mo. Mexico Silt loam 1.54 1.50 1.58 1.56 21.3 11.5 32.1Miss. Grenada Silt loam 1.01 0.85 0.85 0.99 12.0 10.9 23.5Mont. Zahl Loam 1.52 1.61 1.71 1.79 20.0 11.0 20.3N.C. Gaston Clay loam 1.07 1.04 1.07 1.08 9.2 14.8 22.0N.Dak. Bames Loam 2.52 2.43 2.33 2.67 22.8 12.7 28.5
Williams Loam 1.75 1.75 1.75 1.75 22.6 11.9 23.5Nebr. Hersh Fine sandy loam 0.53 0.33 0.32 0.36 7.2 4.3 12.7
Keith Loam 0.98 0.81 0.96 0.91 18.3 10.3 19.6Sharpsburg Silty clay loam 1.75 1.81 1.74 1.83 29.4 17.4 27.0
NY Collamer Silt loam 1.06 0.99 0.98 1.00 8.9 6.9 24.7Ohio Miamian Silt loam 3.19 3.13 2.97 2.62 14.4 10.9 17.8Okla. Woodward Fine sandy loam 0.76 0.69 0.68 0.76 12.6 7.4 14.4S.Dak. Pierre Clay 1.40 1.37 1.44 1.40 34.9 19.1 26.6Tex. Amarillo Fine sandy loam 0.14 0.18 0.14 0.16 5.1 3.4 7.3
Heiden Silty clay 1.36 1.36 1.36 1.36 33.3 18.9 28.8Wash. Nansene Silt loam 1.23 1.30 1.32 1.31 15.1 7.3 34.0
Palouse Silt loam 1.18 1.35 1.28 1.36 19.6 9.0 26.3* Determined by pedon sample analysis at USDA-NRCS National Soil Survey Laboratory.t Organic carbon content from analysis of four surface samples collected for each soil.:1: Soil moisture tension of 1.5 MPa is termed "wilting point", and 0.033 MPa is termed "field capacity".
U.S. climatic zones and included soils from 28 subordersof 9 soil orders (Stoner and Baumgardner, 1981).
The soil fraction passing a 2 mm sieve was used forlaboratory determination of chemical, physical, andreflectance properties, including Walkley-Black organiccarbon. Stoner and Baumgardner (1981) obtainedreflectance measurements using a spectroradiometer, onsoil samples equilibrated to 0.010 MPa moisture tension.Spectral readings were taken every 10 nm over the rangefrom 520 nm to 2320 nm. Six spectral scans on each soilsample were averaged to generate the mean scan stored inthe LARS database (Stoner and Baumgardner, 1980). Datafor 84 soil series from 12 Midwestern states (Iowa, Illinois,Indiana, Kansas, Michigan, Minnesota, Missouri, NorthDakota, Nebraska, Ohio, South Dakota, and Wisconsin)were extracted from the LARS database, averaged to a60 nm spacing and transformed from reflectance to OD.These data covered a range of center wavelengths from595 nm to 2295 nm. Correlation of spectral informationand Walkley-Black organic carbon was accomplished usingPLSR applied to various subsets of the data.
RESULTS AND DISCUSSIONWEPP SOILS
Soil organic carbon (table 1) for the four surfacesamples of the 33 soils ranged from 0.14% to 3.19%, witha standard deviation of 0.65% organic carbon. Inorganiccarbon was detected in three of the test soils: Portneuf SiltLoam (Idaho), Williams Loam (N.Dak.), and Heiden SiltyClay (Tex.). For these soils, the entries in table 1 werethose determined by analysis of pedon samples at theUSDA-NRCS NSSL. Entries for the other soils weredetermined by dry combustion of subsamples of the fourspatial samples of each soil. The within-soil standarddeviation averaged 0.06% organic carbon, with a maximumof 0.22% organic carbon, indicating the presence of someheterogeneity among the four samples of each soil. Withthis amount of variability, care should be taken incorrelating soil properties determined by the USDA-NRCSNSSL with spectral characteristics. These properties weredetermined on a characteristic pedon from within thesampling site, but could vary from the properties actuallypresent in each of the four surface samples.
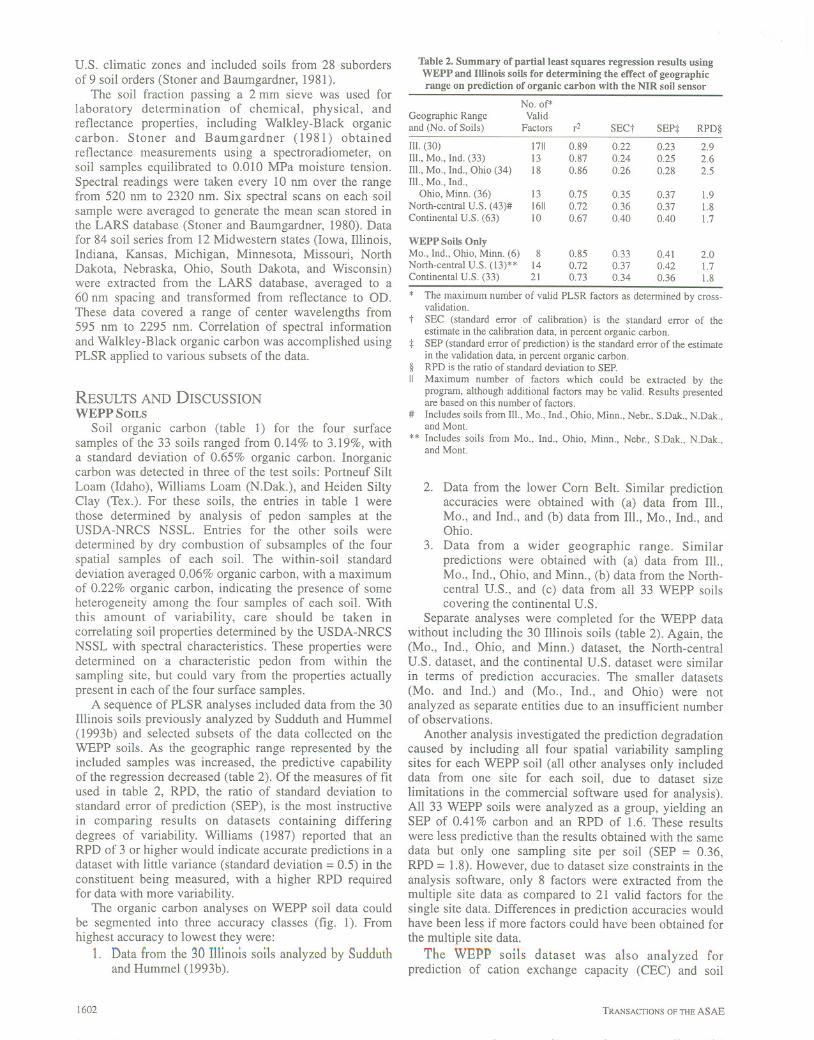
A sequence of PLSR analyses included data from the 30Illinois soils previously analyzed by Sudduth and Hummel(1993b) and selected subsets of the data collected on theWEPP soils. As the geographic range represented by theincluded samples was increased, the predictive capabilityof the regression decreased (table 2). Of the measures of fitused in table 2, RPD, the ratio of standard deviation tostandard error of prediction (SEP), is the most instructivein comparing results on datasets containing differingdegrees of variability. Williams (1987) reported that anRPD of 3 or higher would indicate accurate predictions in adataset with little variance (standard deviation =0.5) in theconstituent being measured, with a higher RPD requiredfor data with more variability.
The organic carbon analyses on WEPP soil data couldbe segmented into three accuracy classes (fig. 1). Fromhighest accuracy to lowest they were:
1. Data from the 30 Illinois soils analyzed by Sudduthand Hummel (1993b).
1602
* The maximum number of valid PLSR factors as determined by cross-validation.
t SEC (standard error of calibration) is the standard error of the
estimate in the calibration data, in percent organic carbon.:j: SEP (standard error of prediction) is the standard error of the estimate
in the validation data, in percent organic carbon.§ RPD is the ratio of standard deviation to SEP.
II Maximum number of factors which could be extracted by theprogram, although additional factors may be valid. Results presentedare based on this number of factors.
# Includes soils from 111.,Mo., Ind., Ohio, Minn., Nebr., S.Dak., N.Dak.,and Mont.
** Includes soils from Mo., Ind., Ohio, Minn., Nebr., S.Dak., N.Dak.,and Mont.
2. Data from the lower Corn Belt. Similar predictionaccuracies were obtained with (a) data from Ill.,Mo., and Ind., and (b) data from 111.,Mo., Ind., andOhio.
3. Data from a wider geographic range. Similarpredictions were obtained with (a) data from Ill.,Mo., Ind., Ohio, and Minn., (b) data from the North-central U.S., and (c) data from all 33 WEPP soilscovering the continental U.S.
Separate analyses were completed for the WEPP datawithout including the 30 Illinois soils (table 2). Again, the(Mo., Ind., Ohio, and Minn.) dataset, the North-centralU.S. dataset, and the continental U.S. dataset were similarin terms of prediction accuracies. The smaller datasets(Mo. and Ind.) and (Mo., Ind., and Ohio) were notanalyzed as separate entities due to an insufficient numberof observations.
Another analysis investigated the prediction degradationcaused by including all four spatial variability samplingsites for each WEPP soil (all other analyses only includeddata from one site for each soil, due to dataset sizelimitations in the commercial software used for analysis).All 33 WEPP soils were analyzed as a group, yielding anSEP of 0.41 % carbon and an RPD of 1.6. These resultswere less predictive than the results obtained with the samedata but only one sampling site per soil (SEP = 0.36,RPD =1.8). However, due to dataset size constraints in theanalysis software, only 8 factors were extracted from themultiple site data as compared to 21 valid factors for thesingle site data. Differences in prediction accuracies wouldhave been less if more factors could have been obtained forthe multiple site data.
The WEPP soils dataset
prediction of cation exchangewas also analyzed forcapacity (CEC) and soil
TRANSACTIONS OF THE ASAE
Table 2. Summary of partial least squares regression results usingWEPP and Illinois soils for determining the effect of geographicrange on prediction of organic carbon with the NIR soil sensor
No. of*
Geographic Range Validand (No. of Soils) Factors r2 SECt SEP:j: RPD§
111.(30) 1711 0.89 0.22 0.23 2.9Ill., Mo., Ind. (33) 13 0.87 0.24 0.25 2.6111.,Mo., Ind., Ohio (34) 18 0.86 0.26 0.28 2.5111..Mo., Ind.,
Ohio, Minn. (36) 13 0.75 0.35 0.37 1.9North-central U.S. (43)# 1611 0.72 0.36 0.37 1.8Continental U.S. (63) 10 0.67 0.40 0.40 1.7
WEPP Soils OnlyMo., Ind., Ohio, Minn. (6) 8 0.85 0.33 0.41 2.0North-central U.S. (13)** 14 0.72 0.37 0.42 1.7Continental U.S. (33) 21 0.73 0.34 0.36 1.8

*-c0.D~
CO<..)0
'2COC)~0'0Q)-0'6~c..
04
Table 3. Summary of partial least squares regression results usingWEPP and Illinois soils for determining the effect of geographicrange on prediction of cation exchange capacity (CEC) and soil
moisture with the NIR soil sensor
* The maximum number of valid Pl,-SR factors as determined by cross-validation.
t SEC (standard error of calibration) is the standard error of theestimate in the calibration data, in units of mEq/l OOg (for CEC) orpercent water.
t SEP (standard error of prediction) is the standard error of the estimatein the validation data, in units of mEq/l DOg (for CEC) or percentwater.
§ RPD is the ratio of standard deviation to SEP.
II Includes soils from Mo., Ind., Ohio, Minn., Nebr., S.Dak., N.Dak.,and Mont.
analyses, but are presented for comparison. As with organiccarbon, predictions of soil moisture content weresignificantly less precise when the geographic range wasincreased. Except for one outlier, CEC predictionaccuracies remained relatively constant with increasinggeographic range. This relative robustness of CECestimations with respect to geographic range indicates thatvariable-rate herbicide application based on sensor-derivedCEC data may warrant further investigation.
/ LARS SOILS
Organic carbon prediction with the LARS soil data(table 4) showed trends similar to those found with the WEPPsoils. Again, data obtained from states in the lower Corn Belt
3
rz = 0.72 (n = 258)
SEP = 0.37stdev = 0.67
RPD= 1.8/
Table 4. Summary of partial least squares regression results usingLARS soils for determining the effect of geographic range onprediction of organic carbon using spectral reflectance data
* The maximum number of valid PLSR factors as determined by cross-validation.
t SEC (standard error of calibration) is the standard error of theestimate in the calibration data, in percent organic carbon.
t SEP (standard error of prediction) is the standard error of the estimatein the validation data, in percent organic carbon.
§ RPD is the ratio of standard deviation to SEP.II Includes soils from Ill., Mo., Ind., Ohio, Iowa, Minn., Wise., Mich.,
Kans., Nebr., S.Dak., and N.Dak.
Figure I-Comparison of organic carbon predictions from each ofthree accuracy classes. From top to bottom, predictions are for (a) 30Illinois soils; (b) 34 soils from Ill., Mo., Ind., and Ohio; and (c) 43soils from the North-central U.S.
/
2
moisture content (table 3). Data from the 30 Illinois soilswere not combined with the WEPP soils data for these
1 0
00 123
Measured Organic Carbon, %
VOL. 39(5): 1599-1604 1603
4I
rz = 0.89 (n = 180) /S!:;p = O.2 /*- ._-0.67
fie: 3 RPD=2.90-eCO<..)0'2
2 ICO
0'0 1"Q)-0'6
c..
0 u '94 .
rz= 0.86 (n = 204) /
*-SEP I: 0.28 0/
r .--0.70 1'ic-3 RPD =2.50-eCO
<..) 00
'2 2CO
dl0'0 0Q)-
10'6
c..
No. of*Geographic Range Validand (No. of Soils) Factors r2 SECt SEPt RPD§
Cation Exchange Capacity (CEC)Ill. (30) 11 0.86 3.45 3.59 2.4Mo., Ind, Ohio, Minn. (6) 8 0.63 2.34 2.79 1.4North-central U.S. (13)11 9 0.84 2.95 3.19 2.3Continental U.S. (33) 14 0.85 3.61 3.76 2.5
Soil MoistureIll. (30) 10 0.97 1.48 1.59 5.1Mo., Ind., Ohio, Minn. (6) 9 0.96 1.36 1.98 3.5North-central U.S. (13)11 7 0.85 2.55 2.87 2.3Continental U.S. (33) 21 0.80 3.49 3.92 2.0
No. of*Geographic Range Validand (No. of Soils) Factors r2 SECt SEPt RPD§
Ill., Mo., Ind., Ohio (34) 7 0.90 0.29 0.43 2.2Ill., Mo., Ind. Ohio,
Iowa (48) 9 0.90 0.26 0.38 2.3Ill., Mo., Ind., Ohio, Iowa,
MN (78) 9 0.89 0.39 0.58 2.04 Ill., Mo., Ind., Ohio, Minn.,
Wise., Mich. (107) 9 0.82 0.50 0.65 1.8North-central U.S. (164)11 7 0.72 0.63 0.71 1.7

(fiI., Mo., Ind., Ohio, and Iowa) were most predictive oforganic carbon. Prediction accuracy was reduced byextendingthe range north to include Minn.,Wisc., and Mich.,and further reduced by extending the range west to includeKans., Nebr., S.Dak., and N.Dak. The complete continentalU.S. group of LARS soils was not analyzed, due to datasetsize limitationsin the PLSR analysisprogram.
Analysis of the LARS data was useful to confirm thegeneral effects of geographic range on prediction accuracy.However,direct comparison of the LARS and WEPPdatasetswas not possible due to differencesbetween the two datasets.Shortcomings of the LARS data included more noise,reduced sensingrange at higher wavelengths,data at only onemoisture tension level (0.01 MPa), and no replication ofreflectance spectra. On the other hand, the LARS sensingrange was extended at lower wavelengths, and the duplicatesamples of most soils collected at a 1 Ian or greater spacingprovidedmore realisticspatial variabilityinformation.
Based on the results obtained with the WEPP and LARSdatasets, it was apparent that organic carbon prediction byNIR reflectance would be less accurate for widergeographic ranges. Analyses which included soils frommore than one temperature/moisture regime yielded lessaccurate predictions than analyses where all soils werefrom the same climatic regime. All WEPP soil predictionsgenerated for the lower Corn Belt (Mo., Ill., Ind., Ohio, andIowa) yielded an SEP of less than 0.29% organic carbon(0.50% organic matter) and could be consideredacceptable. However, additional soils from thatgeographical area should be analyzed to ensure thatacceptable predictions could be maintained for the range ofagriculturally important soils present in each state.
CONCLUSIONSThe geographic range over which a set of soil samples
was obtained affected the accuracy of NIR predictions oforganic carbon, CEC, and soil moisture. Specifically:
1. Predictions of organic carbon and soil moisturebecame less accurate as soil samples from a widergeographic range were considered. Estimations ofCEC, a parameter which is also related to requiredherbicide application rate, exhibited a relativelyconstant accuracy.
2. Acceptable organic carbon prediction accuracies wereretained when NIR data from the lower Corn Belt(Ill., Mo., Ind., and Ohio) was considered as a group.
3. Additional soil samples, representative of thevariability encountered in the agricultural soils of thelower Corn Belt, should be analyzed to verify theseresults.
1604
REFERENCES
Alberts, E. E., C. S. Holzhey, L. T. West and J. O. Nordin. 1987.Soil selection: USDA water erosion prediction project (WEPP).ASAE Paper No. 87-2542. St. Joseph, Mich.: ASAE.
Baumgardner, M. F., L. F. Silva, L. L. Biehl and E. R. Stoner.1985. Reflectance properties of soils. In Advances inAgronomy, Vol. 38. Orlando, Fla.: Academic Press.
Christensen, D. A. and J. W. Hummel. 1985. A real-time soilmoisture content sensor. ASAE Paper No. 85-1589. St. Joseph,Mich.: ASAE.
Dalal, R. C. and R. 1. Henry. 1986. Simultaneous determination ofmoisture, organic carbon, and total nitrogen by near infraredreflectance spectrophotometry. Soil Sci. Soc. Am. J. 50(1): 120-123.
Griffis, C. L. 1985. Electronic sensing of soil organic matter.Transactions of the ASAE 28(3): 703-705.
Gunsaulis, F. R., M. F. Kocher and C. L. Griffis. 1991. Surfacestructure effects on close-range reflectance as a function of soilorganic matter content. Transactions of the ASAE 34(2): 641-649.
Kano, Y., W. F. McClure and R. W. Skaggs. 1985. A near infraredreflectance soil moisture meter. Transactions of the ASAE28(6): 1852-1855.
Krishnan, P., J. D. Alexander, B. J. Butler and J. W. Hummel.1980. Reflectance technique for predicting soil organic matter.Soil Sci. Soc. Am. J. 44(6): 1282-1285.
McKeague, 1. A., J. H. Day and 1. A. Shields. 1971. Evaluatingrelationships among soil properties by computer analysis. Can.J. Soil Sci. 51(1): 1O5-111.
Martens, H. and T. Naes. 1987. Multivariate calibration by datacompression. In Near-Infrared Technology in the Agriculturaland Food Industries, 57-88. St. Paul, Minn.: AmericanAssociation of Cereal Chemists.
Meggitt, W. F. 1970. Herbicide activity in relation to soil type. InPesticides in the Soil: Ecology, Degradntion, and Movement.East Lansing, Mich.: Michigan State University.
Pitts, M. J., J. W. Hummel and B. J. Butler. 1986. Sensors utilizinglight reflection to measure soil organic matter. Transactions ofthe ASAE 29(2): 422-428.
Shonk, J. L., L. D. Gaultney, D. G. Schulze and G. E. Van Scoyoc.1991. Spectroscopic sensing of soil organic matter content.Transactions of the ASAE 34(5): 1978-1984.
Stoner, E. R. and M. F. Baumgardner. 1980. Physicochemical, site,and bidirectional reflectance factor characteristics of uniformlymoist soils. Tech. Report 111679. West Lafayette, Ind.:Laboratory for Applications of Remote Sensing, Purdue Univ.
Stoner, E. R. and M. F. Baumgardner. 1981. Characteristicvariations in reflectance of surface soils. Soil Sci. Soc. Am. J.45(6): 1161-1165.
Sudduth, K. A. and 1. W. Hummel. 1991. Evaluation of reflectancemethods for soil organic matter sensing. Transactions of theASAE 34(4): 1900-1909.
Sudduth, K. A., J. W. Hummel and M. D. Coon. 1991. Soil organicmatter sensing- A developing science. In Automated Agric.for the 21st Century, 307-316. St. Joseph, Mich.: ASAE.
Sudduth, K. A. and J. W. Hummel. 1993a. Portable, near-infraredspectrophotometer for rapid soil analysis. Transactions of theASAE36(1): 185-193.
Sudduth, K. A. and J. W. Hummel. 1993b. Soil organic matter,CEC, and moisture sensing with a portable NIRspectrophotometer. Transactions of the ASAE 36(6): 1571-1582.
West, L. T., E. E. Alberts, C. S. Holzhey and L. P. Dunnigan. 1987.Soil measurements: USDA water erosion prediction project(WEPP). ASAE Paper No. 87-2543. St. Joseph, Mich.: ASAE.
Williams, P. C. 1987. Variables affecting near-infrared reflectancespectroscopic analysis. In Near-Infrared Techno!. in the Agric.and Food Industries, 143-168. St. Paul, Minn.: Am. Assoc. ofCereal Chemists.
TRANSACfIONSOFmE ASAE