geographical detector-based risk assessment of...
TRANSCRIPT

Geographical Detector-Based Risk Assessment of theUnder-Five Mortality in the 2008 Wenchuan Earthquake,ChinaYi Hu1,2, Jinfeng Wang2*, Xiaohong Li3, Dan Ren3, Jun Zhu3*
1 School of Earth and Mineral Resource, China University of Geosciences, Beijing, China, 2 State Key Laboratory of Resources and Environmental Information System,
Institute of Geographic Sciences and Natural Resources Research, Chinese Academy of Sciences, Beijing, China, 3 National Office for Maternal and Child Health
Surveillance, West China Second Hospital, Sichuan University, Chengdu, Sichuan, China
Abstract
On 12 May, 2008, a devastating earthquake registering 8.0 on the Richter scale occurred in Sichuan Province, China, takingtens of thousands of lives and destroying the homes of millions of people. Many of the deceased were children, particularchildren less than five years old who were more vulnerable to such a huge disaster than the adult. In order to obtaininformation specifically relevant to further researches and future preventive measures, potential risk factors associated withearthquake-related child mortality need to be identified. We used four geographical detectors (risk detector, factor detector,ecological detector, and interaction detector) based on spatial variation analysis of some potential factors to assess theireffects on the under-five mortality. It was found that three factors are responsible for child mortality: earthquake intensity,collapsed house, and slope. The study, despite some limitations, has important implications for both researchers and policymakers.
Citation: Hu Y, Wang J, Li X, Ren D, Zhu J (2011) Geographical Detector-Based Risk Assessment of the Under-Five Mortality in the 2008 Wenchuan Earthquake,China. PLoS ONE 6(6): e21427. doi:10.1371/journal.pone.0021427
Editor: Abdisalan Mohamed Noor, Kenya Medical Research Institute - Wellcome Trust Research Programme, Kenya
Received February 14, 2011; Accepted May 30, 2011; Published June 27, 2011
Copyright: � 2011 Hu et al. This is an open-access article distributed under the terms of the Creative Commons Attribution License, which permits unrestricteduse, distribution, and reproduction in any medium, provided the original author and source are credited.
Funding: This study was supported by the NSFC (41023010), MOST, China (2009ZX10004-201, 2008BAI56B02, 2007DFC20180, 2007AA12Z233, 2006BAK01A13)and the CAS, China (KZCX2-YW-308). The funders had no role in study design, data collection and analysis, decision to publish, or preparation of the manuscript.
Competing Interests: The authors have declared that no competing interests exist.
* E-mail: [email protected] (JW); [email protected] (JZ)
Introduction
On May 12th, 2008, at 2:28 p.m. local time, an earthquake
registering 8.0 on the Richter scale hit the north-western part of
Sichuan Province, China, with the epicenter in Wenchuan
County. The devastating earthquake claimed more than 69,000
lives, many of which were children, particularly children less than
five years old [1]. Child health development, as an essential part of
global economic and social progress, has received wide attention
from the international community. Particularly, the under-five
mortality is one important indicator of a country or district’s
health level.
As part of ongoing efforts to understand spatial patterns and
epidemiological characteristics of child mortality and to help take
preventive measures in reconstruction, potential risk factors
associated with earthquake-related child mortality need to be
identified. Previous epidemiologic studies on earthquake-related
mortality had identified associations between seismic deaths and
structural damage in earthquakes [2,3,4,5]. The effect of physical
factors on mortality had also been reported [6,7,8]. The
demographic patterns of mortality due to the immediate or
prolonged effects of earthquakes, however, were inconsistent in
previous studies.
Numerous risk assessment methods for deaths and injuries have
been proposed. Usually, an epidemiological method is used to
measure risk factors. For example, a multivariable logistic
regression model was used to analyze risk factors for deaths and
injuries in an earthquake in Afyon, Turkey [6]. Armenian et al.
used a univariate and multivariate analysis model for the same
purpose for an earthquake in Armenia [9]. However, the previous
models or methods involve many assumptions, e.g. homoscedas-
ticity and normality, and violation of such assumptions can have a
major impact on model validity. Moreover, it is difficult to
interpret interactions in classic models and the inclusion of
interactions when a study was not specifically designed to assess
them can make it difficult to estimate the other effects in the
model. Therefore, there is a need to develop suitable, if not better,
techniques for assessing the risk of child mortality in the present
study.
In this study, we use a method of geographical detector proposed
by Wang et al. [10] of assessing association between the under-five
mortality and risk factors by means of spatial variance analysis
(SVA). The basic idea of SVA is to measure the degree to which the
spatial distribution of health problem (e.g. mortality rate) is
consistent with that of risk factors (e.g. earthquake intensity,
population density, structural damage, etc). Four detectors (factor
detector, interaction detector, risk detector, and ecological detector)
using concept of Power of Determinant (PD) were proposed to assess
the main and interactive effect of potential risk factors on health
problem. They offer a novel approach to extracting the implicit
interrelationships between risk factors and child mortality without
any assumptions or restrictions with respect to explanatory and
response variables, and they also recognize the spatial patterns of
risk factors and child mortality which are difficult to model using
PLoS ONE | www.plosone.org 1 June 2011 | Volume 6 | Issue 6 | e21427

classic epidemiological methods. The Geographical detectors are
usable for both quantitative data and nominal data. The later can
cause trouble with classic regression when there are too many
categories [11]. We first identify and map the spatial distribution of
the under-five mortality at the township level, and then report on
other relevant physical, social, and structural factors, such as
earthquake intensity, population density, and collapsed house.
Finally, we employ the four detectors to assess the association
between child mortality and those factors and make discussion in
terms of the results.
Methods
Mortality dataNational Office for Maternal and Child Health Surveillance
provided under-five mortality data collected at township level in
the Wenchuan earthquake and population of children under five
in the middle of 2008. The under-five mortality was defined as
earthquake-related deaths among children below the age of five,
either part of the local population or floating population, a phrase
that describes unprecedented migrant flows, moving from where
they were born, mostly the underdeveloped area to developed
area, looking for works or leading a life. Two types of mortality
were classified: direct and indirect death. Direct deaths were
defined as being caused by structural failure, by being struck or
trapped by an object dislodged during the shaking, or by a fall
during the earthquake; indirect deaths included those caused by
the aftermath of earthquake damage such as fires and secondary
geological disasters or traffic control failure like car collisions.
Our study area includes 21 earthquake-hit counties confirmed
by the Ministry of Civil Affairs, which are located in northeastern
Sichuan Province. There are, up to May 2009, a total of 934
earthquake-related deaths of children under five in 115 townships,
with 683 cases of direct death and 251 cases of indirect death.
We calculated township-specific mortality rate for each of the
115 townships in the study area. A Hierarchical Bayesian (HB)
model [12] was employed to address the problem of small
population in explorative mapping of mortality rate in such small
areas [13]. Details of how HB model was implemented are given
in Text S1. Administrative code boundaries at the township scale
in the form of shapefile were provided by the State Key
Laboratory of Resources and Environmental Information Systems
(LREIS) from the Institute of Geographic Sciences and Natural
Resources Research (IGSNRR), Chinese Academy of Science
(CAS). A final map of HB mortality rate using a Geographic
Information System (GIS) environment is shown in Figure 1.
Determinants of under-five mortality and their proxiesKey determinants leading to child mortality were diverse and
complex, such as structural failure, object falling, fire, land slide,
car collision, and etc. It is difficult to analyze those determinants
directly as risk factors, e.g. it would be problematic to treat fire or
car collision as risk factors. Actually, these complex determinants
act through at least two geographic layers which are easy and
convenient to implement with a GIS environment. These layers
could be grouped as follows:
1. Physical factors that are spatially distributed. Magnitude
measuring the energy released at the source of the earthquake
and intensity measuring the strength of shaking produced by
the earthquake at a certain location determine damages to
building, residential structure, infrastructures and etc.; and the
type of geomorphology like hill or mountain can determine
whether secondary geological disasters would happen after-
wards which could cause more destruction.
2. Social factors that are spatially distributed. The economic
condition affects structural characteristics and construction
materials of houses determining the resistance to earthquake
Figure 1. Hierarchical Bayesian smoothed under-five mortality rate at the township level in the Wenchuan earthquake (China,2008). Thematic categories are based on the Jenks natural breaks method.doi:10.1371/journal.pone.0021427.g001
Risk Assessment of the Under-Five Mortality
PLoS ONE | www.plosone.org 2 June 2011 | Volume 6 | Issue 6 | e21427

damage and infrastructures that are associated with fire, traffic
control failure, and etc.
Figure 2 illustrates a conceptual framework that involves the
direct determinants and their explicit geographical proxies. The
physical and social factors were collected: elevation, slope, distance
from township to fault, geomorphology, earthquake intensity,
population density, and Gross Domestic Product (GDP). In
addition, structural factor of collapsed houses at township level
was collected. Figure 3 and Figure 4 present maps of these factors.
The topographic elevation was obtained from Digital Elevation
Model (DEM). The DEM used in this study was derived from The
Shuttle Radar Topography Mission (SRTM), an international
project spearheaded by the U.S. National Geospatial-Intelligence
Agency (NGA) and the U.S. National Aeronautics and Space
Administration (NASA).
Slope is defined by a plane tangent to a topographic surface, as
modeled by the DEM at a point [14]. Slope presents the percent
change in elevation over a certain distance. The output slope can
be calculated as either the percent of slope or degree of slope. In
this study, degree of slope was chosen.
The geomorphology data were provided by the State Key
LREIS of the IGSNRR of CAS. The geomorphology of the study
area can be divided into seven classes: plain, terrace, hill, low-relief
mountain, middle-relief mountain, high-relief mountain.
Earthquake intensity in the study area was taken from Modified
Mercalli Intensity (MMI) scale map produced by China
Earthquake Administration. The MMI scale is divided into twelve
continuous categories [15]. The lower degrees of the MMI scale
generally deal with the manner in which the earthquake was felt
by people. The higher degrees are based on observed structural
damage. The earthquake intensity in the study area ranged from
VII to XI.
There are a series of thrust faults that affect the study area, for
example, the Wenchuan-Maoxian, Yingxiu-Beichuan and An-
xian-Guanxian faults. The earthquake intensity zones are
elliptical, with those faults as major axes. Townships in the same
intensity zone suffered the same devastating power described
above, though some are closer to the epicenter. In addition,
geologically, the rupturing of the crust around those faults is the
main cause of structural damage. Consequently, we assumed that
studying distance to faults to be more meaningful than studying
distance to the epicenter. Using a GIS environment, some buffers
around faults could be drawn.
Collapsed houses were measured by the proportion of
completely collapsed houses among all registered houses. The
completely collapsed house defined by the local government refers
to house that had to be torn down and rebuilt for future
occupancy. Collapsed house data at the township level were
obtained from the Evaluation of Bearing Capacity of Resources
and Environment (EBCRE) database, which was set up by
IGSNRR, CAS, from the national reconstruction plan in 2009.
Only 101 townships, however, in our study area have collapsed
house data record, hence a method of inverse distance weighted
interpolation [16] is used to predict the distribution of collapsed
houses in the study area. The population density and GDP of 2007
were also sourced from EBCRE database as well.
Statistical analysisWe assume that the child mortality would exhibit a spatial
distribution similar to that of a risk factor if the risk factor leads to
the mortality. The mechanism is quantified by power value as
follows:
In our study area, V, (as shown in Figure 5) let the mortality be
measured by the rates in grids, h1, h2, , hn; and let C and D be two
potential risk factors associated with the mortality. Measurement
of C and D can be continuous or categorical variable. Then, V is
assumed to be stratified by the attribute of C and D, denoted as
subareas {c1, c2, c3} and {d1, d2, d3}, respectively. For example,
if the study area is stratified by geomorphology (measured by
qualitative variable) then subareas denotes one type of geomor-
phology, or if the study area is stratified by elevation (measured by
quantitative variable) then subareas can be obtained by any kind
Figure 2. Relationship between determinants of mortality and their proxy variables.doi:10.1371/journal.pone.0021427.g002
Risk Assessment of the Under-Five Mortality
PLoS ONE | www.plosone.org 3 June 2011 | Volume 6 | Issue 6 | e21427

of discretization method depending on optimal classification or
prior knowledge [17,18].
The mortality layer H is overlaid by a potential factor layer, such
as D for example. The average mortality rates, together with their
variances, of the mortality in each subarea and in the study area Vare denoted by �yyd1, �yyd2, �yyd3, �yyD, and Vard1, Vard2, Vard3, VarD,
respectively. One hand, if the mortality is completely controlled by
factor D, the rate will be identical everywhere in each of the subarea
{d1, d2, d3}, and therefore, Vardi (i = 1, 2, 3) will be zero. On the
other hand, if the mortality is completely independent of factor D,
the accumulated area’s weighted dispersion variances of the rate of
the subareas will be no different from the pooled area’s weighted
dispersion variances of the study area V. The mechanism is
measured by the Power of Determinant (PD):
PD~1{Nd1Vard1zNd2Vard2zNd3Vard3ð Þ
N|VarD
ð1Þ
where N and Ndi denote the areas of the study area V and the
subarea di, respectively. If factor D completely controls the
mortality PD equals 1; if factor D is completely unrelated to the
mortality PD equals 0. Usually the value of PD lies in [0, 1]. The
larger the value of PD, the greater is the impact of D on the
mortality. Thus, the PD value quantifies the association between
the under-five mortality and risk factors
Specially, the geographical detectors are composed of the
following four detectors:
Figure 3. Maps of physical factors of the under-five mortality.doi:10.1371/journal.pone.0021427.g003
Risk Assessment of the Under-Five Mortality
PLoS ONE | www.plosone.org 4 June 2011 | Volume 6 | Issue 6 | e21427

Figure 4. Maps of structural and social factors of the under-five mortality.doi:10.1371/journal.pone.0021427.g004
Figure 5. mortality distribution H and spatial patterns of suspect factors C and D in study area [10].doi:10.1371/journal.pone.0021427.g005
Risk Assessment of the Under-Five Mortality
PLoS ONE | www.plosone.org 5 June 2011 | Volume 6 | Issue 6 | e21427
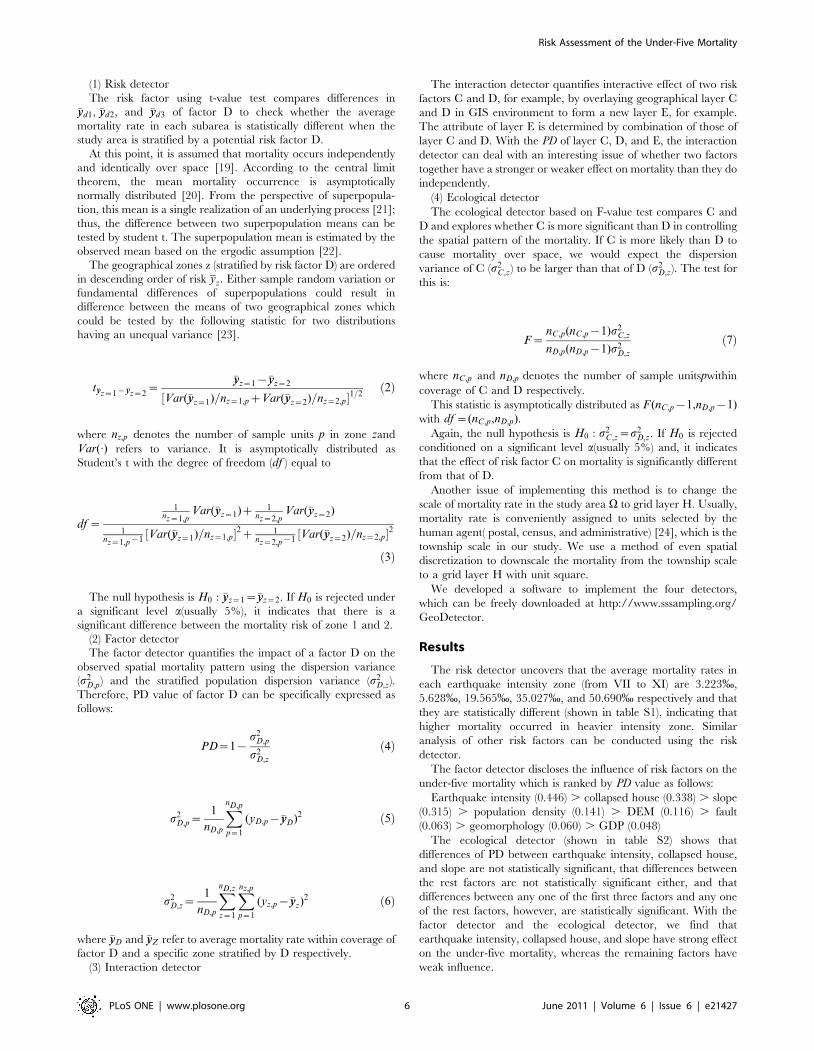
(1) Risk detector
The risk factor using t-value test compares differences in�yyd1, �yyd2, and �yyd3 of factor D to check whether the average
mortality rate in each subarea is statistically different when the
study area is stratified by a potential risk factor D.
At this point, it is assumed that mortality occurs independently
and identically over space [19]. According to the central limit
theorem, the mean mortality occurrence is asymptotically
normally distributed [20]. From the perspective of superpopula-
tion, this mean is a single realization of an underlying process [21];
thus, the difference between two superpopulation means can be
tested by student t. The superpopulation mean is estimated by the
observed mean based on the ergodic assumption [22].
The geographical zones z (stratified by risk factor D) are ordered
in descending order of risk yz. Either sample random variation or
fundamental differences of superpopulations could result in
difference between the means of two geographical zones which
could be tested by the following statistic for two distributions
having an unequal variance [23].
t�yyz~1{�yyz~2~
�yyz~1{�yyz~2
½Var(�yyz~1)=nz~1,pzVar(�yyz~2)=nz~2,p�1=2ð2Þ
where nz,p denotes the number of sample units p in zone zand
Var(:) refers to variance. It is asymptotically distributed as
Student’s t with the degree of freedom (df ) equal to
df ~
1nz~1,p
Var(�yyz~1)z 1nz~2,p
Var(�yyz~2)
1nz~1,p{1
½Var(�yyz~1)=nz~1,p�2z 1nz~2,p{1
½Var(�yyz~2)=nz~2,p�2
ð3Þ
The null hypothesis is H0 : �yyz~1~�yyz~2. If H0 is rejected under
a significant level a(usually 5%), it indicates that there is a
significant difference between the mortality risk of zone 1 and 2.
(2) Factor detector
The factor detector quantifies the impact of a factor D on the
observed spatial mortality pattern using the dispersion variance
(s2D,p) and the stratified population dispersion variance (s2
D,z).
Therefore, PD value of factor D can be specifically expressed as
follows:
PD~1{s2
D,p
s2D,z
ð4Þ
s2D,p~
1
nD,p
XnD,p
p~1
(yD,p{�yyD)2 ð5Þ
s2D,z~
1
nD,p
XnD,z
z~1
Xnz,p
p~1
(yz,p{�yyz)2 ð6Þ
where �yyD and �yyZ refer to average mortality rate within coverage of
factor D and a specific zone stratified by D respectively.
(3) Interaction detector
The interaction detector quantifies interactive effect of two risk
factors C and D, for example, by overlaying geographical layer C
and D in GIS environment to form a new layer E, for example.
The attribute of layer E is determined by combination of those of
layer C and D. With the PD of layer C, D, and E, the interaction
detector can deal with an interesting issue of whether two factors
together have a stronger or weaker effect on mortality than they do
independently.
(4) Ecological detector
The ecological detector based on F-value test compares C and
D and explores whether C is more significant than D in controlling
the spatial pattern of the mortality. If C is more likely than D to
cause mortality over space, we would expect the dispersion
variance of C (s2C,z) to be larger than that of D (s2
D,z). The test for
this is:
F~nC,p(nC,p{1)s2
C,z
nD,p(nD,p{1)s2D,z
ð7Þ
where nC,p and nD,p denotes the number of sample unitspwithin
coverage of C and D respectively.
This statistic is asymptotically distributed as F (nC,p{1,nD,p{1)with df ~(nC,p,nD,p).
Again, the null hypothesis is H0 : s2C,z~s2
D,z. If H0 is rejected
conditioned on a significant level a(usually 5%) and, it indicates
that the effect of risk factor C on mortality is significantly different
from that of D.
Another issue of implementing this method is to change the
scale of mortality rate in the study area V to grid layer H. Usually,
mortality rate is conveniently assigned to units selected by the
human agent( postal, census, and administrative) [24], which is the
township scale in our study. We use a method of even spatial
discretization to downscale the mortality from the township scale
to a grid layer H with unit square.
We developed a software to implement the four detectors,
which can be freely downloaded at http://www.sssampling.org/
GeoDetector.
Results
The risk detector uncovers that the average mortality rates in
each earthquake intensity zone (from VII to XI) are 3.223%,
5.628%, 19.565%, 35.027%, and 50.690% respectively and that
they are statistically different (shown in table S1), indicating that
higher mortality occurred in heavier intensity zone. Similar
analysis of other risk factors can be conducted using the risk
detector.
The factor detector discloses the influence of risk factors on the
under-five mortality which is ranked by PD value as follows:
Earthquake intensity (0.446) . collapsed house (0.338) . slope
(0.315) . population density (0.141) . DEM (0.116) . fault
(0.063) . geomorphology (0.060) . GDP (0.048)
The ecological detector (shown in table S2) shows that
differences of PD between earthquake intensity, collapsed house,
and slope are not statistically significant, that differences between
the rest factors are not statistically significant either, and that
differences between any one of the first three factors and any one
of the rest factors, however, are statistically significant. With the
factor detector and the ecological detector, we find that
earthquake intensity, collapsed house, and slope have strong effect
on the under-five mortality, whereas the remaining factors have
weak influence.
Risk Assessment of the Under-Five Mortality
PLoS ONE | www.plosone.org 6 June 2011 | Volume 6 | Issue 6 | e21427

Joint impacts of two factors measured by PD value are shown in
table S3 and can be compared with their separate impacts. The
interactive effects between earthquake intensity and population
density (0.584), earthquake intensity and slope (0.552), earthquake
intensity and collapsed house (0.541), earthquake intensity and
GDP (0.524), and earthquake intensity and DEM (0.475) are
stronger than the effect of earthquake intensity (0.446) which has
the strongest main effect on the under-five mortality, whereas the
interactions between earthquake intensity and geomorphology
(0.437) and earthquake intensity and fault (0.405) weaken the
effect of earthquake intensity. Similarly, interactions between slope
and other factors are fluctuating compared to main effect of slope.
Collapsed house when interacting with any other factors, however,
is even more devastating compared to itself (0.338) as a separate
factor. Even of those factors with least impact, interactions
between them enhance their separate effects on the mortality.
These findings indicate that interaction between factors plays an
important role in the under-five mortality.
Discussion
In this study, we used four geographical detectors (GeoDetec-
tors) to assess effects of some physical, social, and structural factors
on the under-five mortality. We believe this method to be novel in
that it extracts the interrelationships between health problem and
risk factors by the correspondence of their spatial distribution and
that it’s easy to implement. This easy and efficient tool is extremely
welcome in those undeveloped areas where health resources are
limited in determinant detection for intervention and prevention.
Of more concern is which factor has the greatest role in the
under-five mortality. With the four detectors we found that
earthquake intensity, collapsed house, and slope were mainly
responsible for the under-five mortality; that the higher MMI was
the heavier mortality occurred, and so was collapsed house and
slope; and that interactive effects between pairs of earthquake
intensity, collapsed house, and slope are even stronger than their
separate effects. Although elevation, fault, geomorphology,
population density, and GDP were found to have weak effect on
the under-five mortality they contributed a lot to the mortality
when interacting with earthquake intensity, collapsed house, or
slope, indicating the importance of these three factors.
Both earthquake intensity and collapsed house describe damage
to residential houses and buildings. Trauma caused by partial or
completes collapse of buildings and infrastructures is the
overwhelming cause of death and injury in most earthquakes
[25,26]. The findings in our study highlight the importance of
structural factor in causing lots of direct deaths. Masonry structure
with timber roof and reinforced masonry structures were two types
of structures which were widely used in most residential buildings,
school buildings in the rural area, and some of factories, old
residential and office buildings in the cities [27]. A lot of buildings
like those completely collapsed or were heavily damaged in the
earthquake. Some general reasons of their vulnerability are of long
time use, lack of maintenance, poor redundancy of structural
system, poor connections of pre-cast slabs, and etc.
One explanation for slope identified as an important contrib-
utor to child mortality could be secondary geological disasters
triggered by earthquakes. Slope of topography is commonly
regarded as directly related to landslide initiation; it is an
important factor in landslide hazard analysis, and mudslides
usually start on steep slopes and can be activated by natural
disasters [28]. This indicates slope can be an agency to reflect the
secondary geological disaster following the earthquake. The
earthquake had a great impact on the local geological environ-
ment, resulting in large-scale disasters in Sichuan province like
landslides, mud-rock flows, and quake lakes which leaded to lots of
indirect death (as defined in this study). Preliminarily judging,
about 1/3 of the whole Wenchuan earthquake losses were not by
the direct result of the earthquake, but by the secondary geological
disasters [29].
Our approach highlights a number of limitations and areas for
further work. First, it is easy for the detectors to deal with qualitative
factors, the values of which are determined by their nature or
attributes, such as geomorphology. When dealing with quantitative
factors, however, some prior knowledge is needed to discretize those
quantitative variables. Arbitrary methods of discretization may not
characterize actual association between risk factors and child
mortality. Methodological problems related to the compilation of
survey data sets constitute a further limitation to our analysis. Case
data were collected in field surveys, with great attention given to
minimizing missing data. For example, immediately after the
earthquake, a three-level surveillance network, which was adapted
from the national three-level maternal and children surveillance
system, was established by the National Office of Maternal and
Child Health Surveillance to collect under-five mortality data in the
earthquake-hit areas. In this specialized system, interviewers at the
county-level were recruited from local maternal and child health
hospitals in the study areas; interviewers at the township-level were
recruited from town hospitals, while interviewers at village-level
were composed of village doctors, village chiefs, and village union
directors. 80% of the interviewers in this system had been working
on child health data collection for several years and had valuable
experience in data collection. More importantly, the village-level
interviewers had been living locally for many years and they were
familiar with each family in their villages. However, all the
interviewers were still arranged for to receive training on interview
techniques. This system was similar to the national maternal and
child health surveillance system that was used to survey under-five
child mortality in China. A HB algorithm was employed to further
reduce the uncertainty of the rate due to the small area. Collapsed
house data in the EBCRE database were available for only 101
townships in the study area, leaving those of 14 townships unknown.
To address this problem, we estimated collapsed house at these 14
townships using inverse weighted interpolation, which was proven
to have a smaller Root Mean Square (RMS) error compared to
other methods of interpolation using leave-one-out cross validation.
Despite some limitations, we still believe this study to be
meaningful. Firstly, it is in an area of great public health interest
and in which limited information was available. Most of previous
earthquake-related studies mainly focused on general population.
Seldom, however, did those pay attention to children under five.
Psychologically and physically, children under five are largely
dependent on their families, lack the ability to protect themselves
in response to sudden disasters, and thus are more vulnerable to
natural disasters like earthquakes. Secondly, results from this study
help researchers to understand the epidemiological characteristics
and spatial patterns of child mortality and provide clues to further
studies. Finally, the implications from this study give to policy
makers some clues to how and where to reconstruct new townships
after earthquakes. Specifically, with regard to structural factor, the
local government can alter building design practices in earth-
quake-prone areas and strictly supervise the resistant quality of
buildings to ensure the structures’ resistance to earthquakes.
What’s more, slope is a top priority when considering new sites for
habitation. A topographic slope of 15u to 25u was the threshold for
landslides and mud-rock flows in Sichuan Province [30]. It would
be better to choose new township sites with a topographic slope
below 15u. In addition, consideration of the slope of the land is
Risk Assessment of the Under-Five Mortality
PLoS ONE | www.plosone.org 7 June 2011 | Volume 6 | Issue 6 | e21427
important not only to minimize risks form natural hazards like
earthquake and landslides, but to reduce construction costs and
impacts of proposed development on natural resources such as soil,
vegetation, and water systems.
Supporting Information
Table S1
(DOC)
Table S2
(DOC)
Table S3
(DOC)
Text S1 Appendix.
(DOC)
Acknowledgments
We thank the Ministry of Health of the People’s Republic of China, the
World Health Organization for supporting this program, and all the
working staff in data collection.
Author Contributions
Conceived and designed the experiments: JZ JW. Performed the
experiments: YH DR XL. Analyzed the data: YH. Contributed
reagents/materials/analysis tools: JW. Wrote the paper: YH.
References
1. Watts J (2008) Chinese quake forced 3m children from homes. pp 2008–2023.
2. Peek-Asa C, Kraus J, Bourque L, Vimalachandra D, Yu J, et al. (1998) Fatal andhospitalized injuries resulting from the 1994 Northbridge earthquake. Interna-
tional Journal of Epidemiology. pp 456–465.3. Peek-Asa C, Ramirez M, Shoaf K, Seligson H, Kraus J (2000) GIS mapping of
earthquake-related deaths and hospital admissions from the 1994 North-ridge,California, earthquake. Annals of Epidemiology. pp 5–13.
4. De Bruycker M, Greco D, Lechat MF, Annino I, De Ruggiero N, et al. (1985)
The 1980 earthquake in Southern Italy–morbidity and mortality. InternationalJournal of Epidemiology 14: 113–117.
5. Peek-Asa C, Ramirez M, Seligson H, Shoaf K (2003) Seismic, structural, andindividual factors associated with earthquake related injury. Injury Prevention 9:
62–66.
6. Ellidokuz H, Ucku R, Aydin UY, Ellidokuz E (2005) Risk factors for death andinjuries in earthquake: cross-sectional study from Afyon, Turkey. Croatian
Medical Journal 46: 613–618.7. Pai C, Tien Y, Teng T (2007) A study of the human-fatality rate in near-fault
regions using the Victim Attribute Database. Natural Hazards 42: 19–35.
8. Gutierrez E, Taucer F, De Groeve T (2005) Analysis of worldwide earthquakemortality using multivariate demographic and seismic data. American Journal of
Epidemiology 161: 1151–1158.9. Armenian HK, Melkonian A, Noji EK, Hovanesian AP (1997) Deaths and
injuries due to the earthquake in Armenia: A cohort approach. InternationalJournal of Epidemiology 26: 806–813.
10. Wang JF, Li XH, Christakos G, Liao YL, Zhang T, et al. (2010) Geographical
Detectors-Based Health Risk Assessment and its Application in the Neural TubeDefects Study of the Heshun Region, China. International Journal of
Geographical Information Science 24: 107–127.11. Allen MP (1997) Regression analysis with dummy variables. Understanding
Regression Analysis. New York: Plenum Press.
12. Clark JS (2007) Models for Ecological Data: An Introduction: PrincetonUniversity Press. 632 p.
13. Hu Y, Wang JF, Zhu J, Ren D (2011) Mapping under-five mortality in theWenchuan earthquake using hierarchical Bayesian modeling. International
Journal of Environmental Health Research. pp 1–8.14. Burrough PA (1986) Principles of Geographical Information Systems for Land
Resources Assessment. Oxford, England: Clarendon Press.
15. Wood HO, Neumann F (1931) Modified Mercalli Intensity Scale of 1931.Bulletin of the Seismological Society of America 21: 277–283.
16. Fisher NITL, Embleton BJJ (1987) Statistical Analysis Of Spherical Data.
Cambridge University Press. 329 p.
17. Li L, Wang J, Cao Z, Zhong E (2008) An information-fusion method to identify
pattern of spatial heterogeneity for improving the accuracy of estimation.
Stochastic Environmental Research And Risk Assessment 22: 689–704.
18. Wang J, Haining R, Cao Z (2010) Sample surveying to estimate the mean of a
heterogeneous surface: reducing the error variance through zoning. Interna-
tional Journal of Geographical Information Science 24: 523–543.
19. Brus DJ, Gruijter JJ (1997) Random sampling or geostatistical modelling?
Choosing between design-based and model-based sampling strategies for soil
(with discussion). Geoderma 80: 1–44.
20. Grimmett RR, Stirzaker DR (1994) Probability and Random Processes. Oxford:
Oxford Science Publications.
21. Griffith DA, Haining R, Arbia G (1994) Heterogeneity of attribute sampling
error in spatial data sets. Geographical Analysis 26: 300–320.
22. Haining R (1988) Estimating spatial means with an application to remote sensing
data. Communication Statistics 17: 537–597.
23. Press W, Teukolsky A, Vetterling W, Flannery B (1992) Numerical Recipes in C.
Second edition. New York: Cambridge University Press.
24. Liao Y, Wang J, Meng B, Li X (2010) Integration of GP and GA for mapping
population distribution. International Journal of Geographical Information
Science 24: 47–67.
25. Tiedemann H (1989) Casualties as a function of building quality and earthquake
intensity. Proceedings of the International Workshop on Earthquake Injury
Epidemiology for Mitigation and Response. Baltimore: Johns Hopkins
University. pp 420–434.
26. Spence RJS, Coburn AW, Sakai S (1990) Reducing human casualties in building
collapse: Methods of optimising disaster plans to reduce injury levels. Martin
Center for Architectural and Urban Studies Cambridge University. pp 1–55.
27. Lieping Y, Xinzheng L, Zhe Q, Peng F (2008) Analysis on Building Seismic
Damage in the Wenchuan Earthquake. The 14th World Conference on
Earthquake Engineering. Beijing, China.
28. Chen CT, Wang TT (2009) New slope indexes for landslide potential analysis in
debris flow Stream. Geophysical Research Abstracts 11: 5615.
29. Liu Z, Sun S (2009) The Disaster of May 12th Wenchuan Earthquake and Its
Influence on Debris Flows. Journal of Geography and Geology 1: 26–30.
30. Fan J (2009) Overview. Evaluation of Bearing Capacity of Resources and
Environment. Beijing, China: Science Press. pp 19–22.
Risk Assessment of the Under-Five Mortality
PLoS ONE | www.plosone.org 8 June 2011 | Volume 6 | Issue 6 | e21427