geography and environment 24/7 population modelling for natural hazard assessment alan smith...
TRANSCRIPT
Geography and Environment
24/7 Population modelling for natural hazard assessment
Alan SmithUniversity of Southampton, UKColloquium on Spatial Analysis, Copenhagen, 10 January 2013

2
Acknowledgments
Developing the “Pop 24/7” methodologies:
• Professor David Martin
• Samantha Cockings
Part of a PhD funded by the Economic and Social Research Council
3
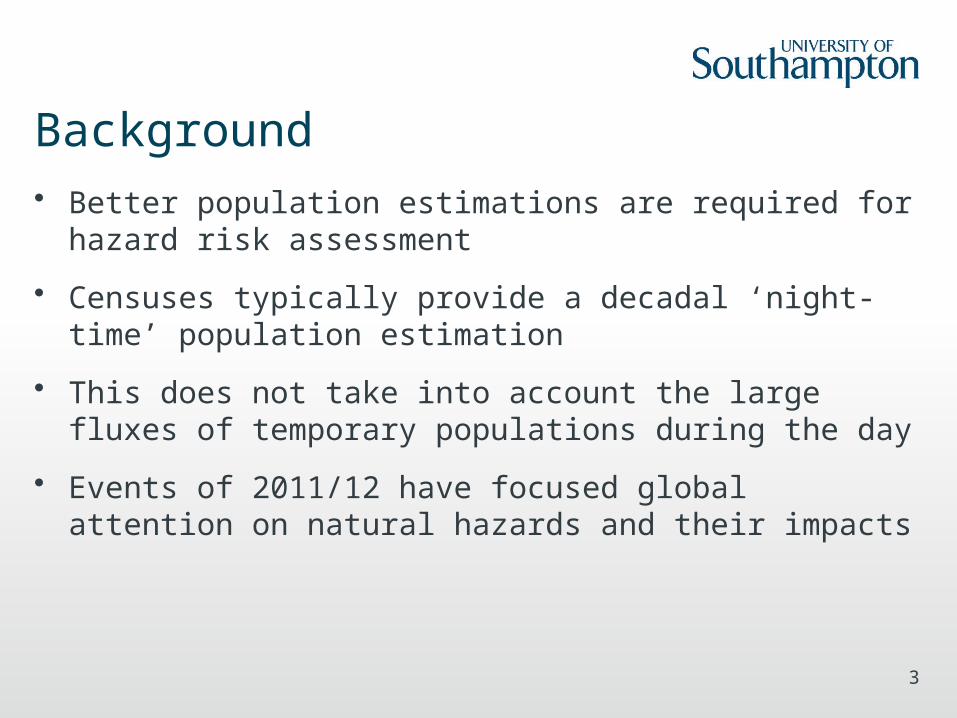
Background• Better population estimations are required for
hazard risk assessment
• Censuses typically provide a decadal ‘night-time’ population estimation
• This does not take into account the large fluxes of temporary populations during the day
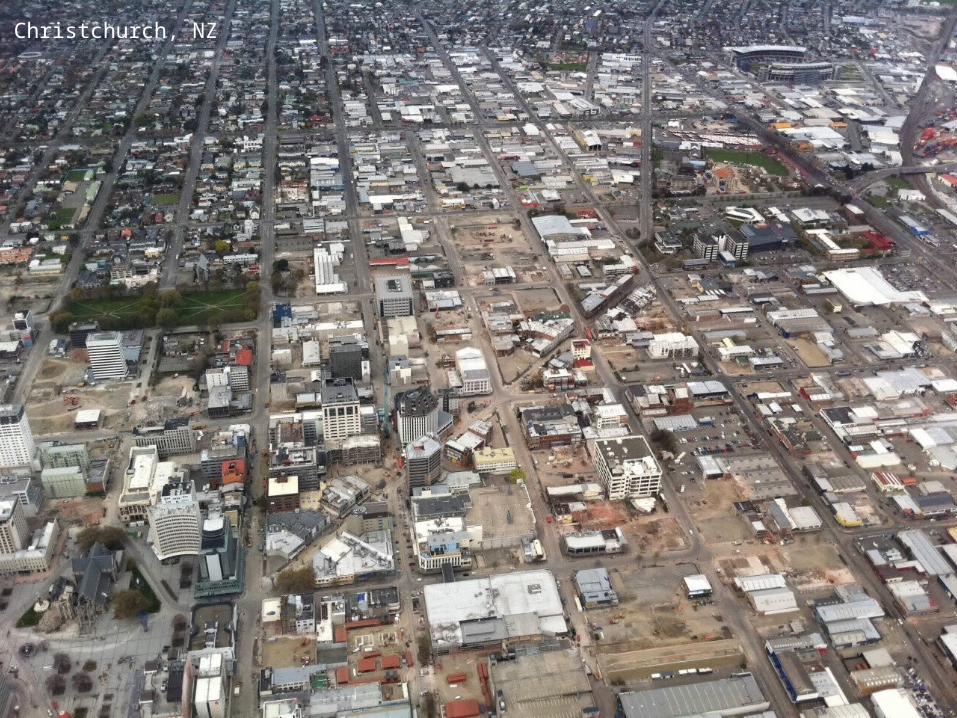
• Events of 2011/12 have focused global attention on natural hazards and their impacts
4
Christchurch, NZ
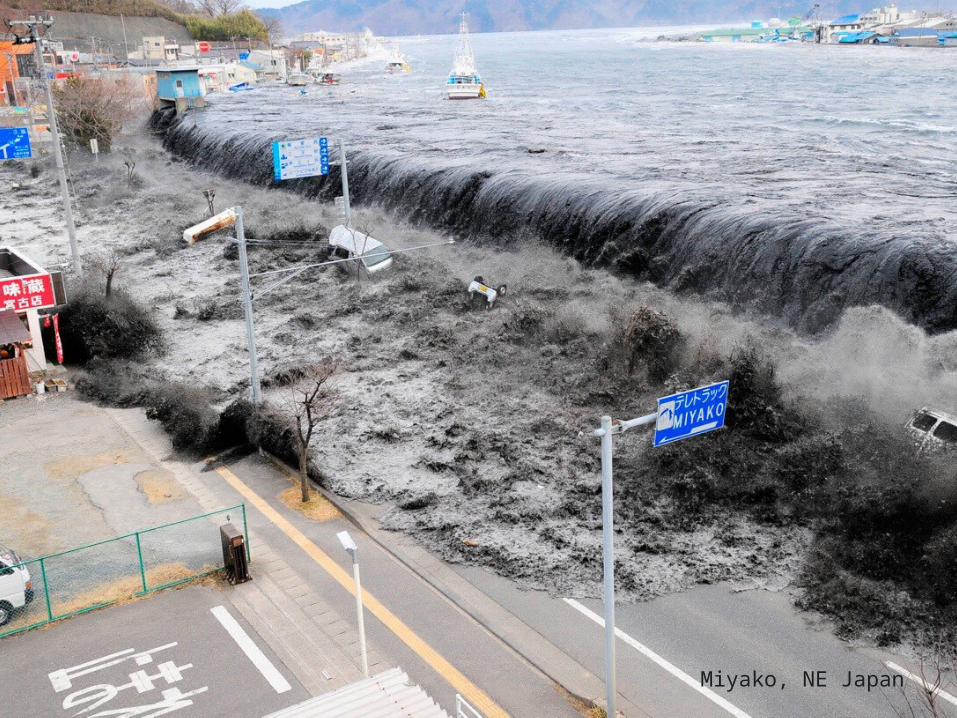
5Miyako, NE Japan
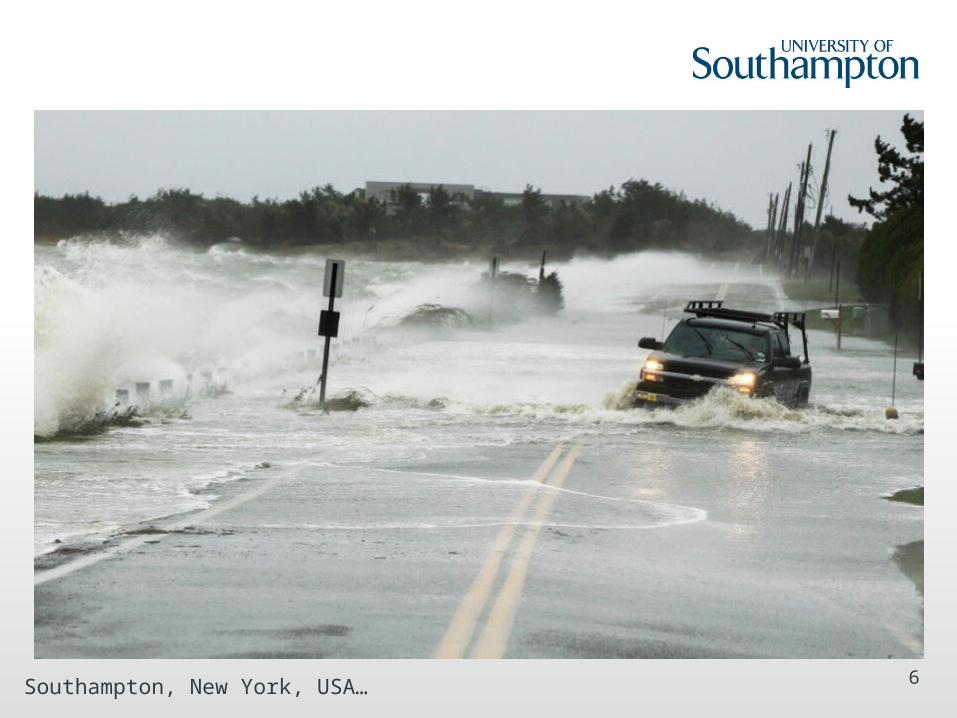
6Southampton, New York, USA…
7
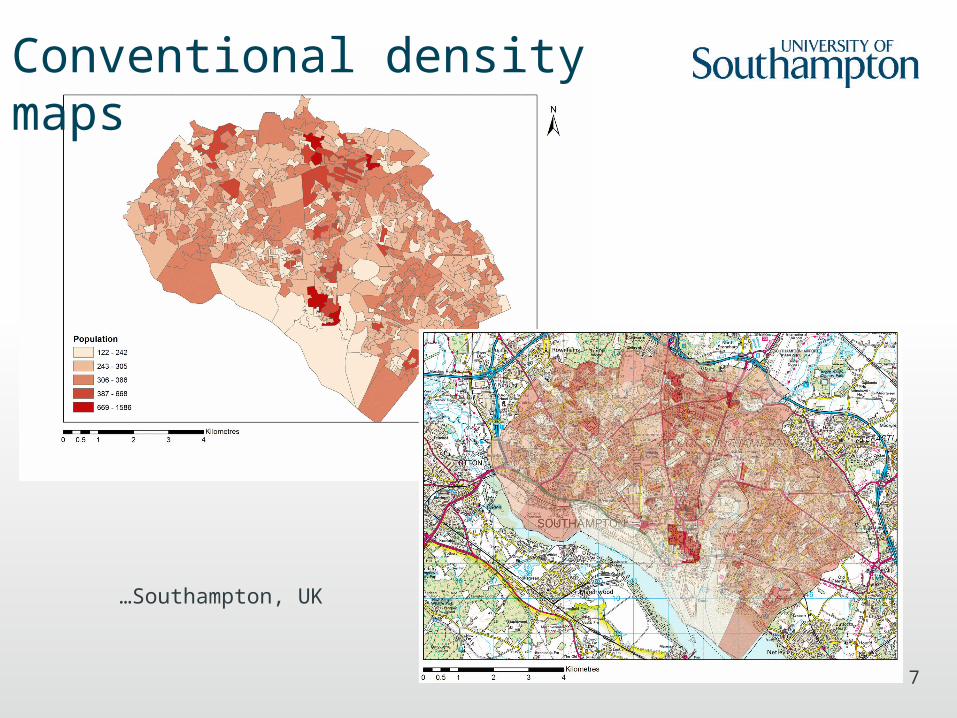
…Southampton, UK
Conventional density maps
8
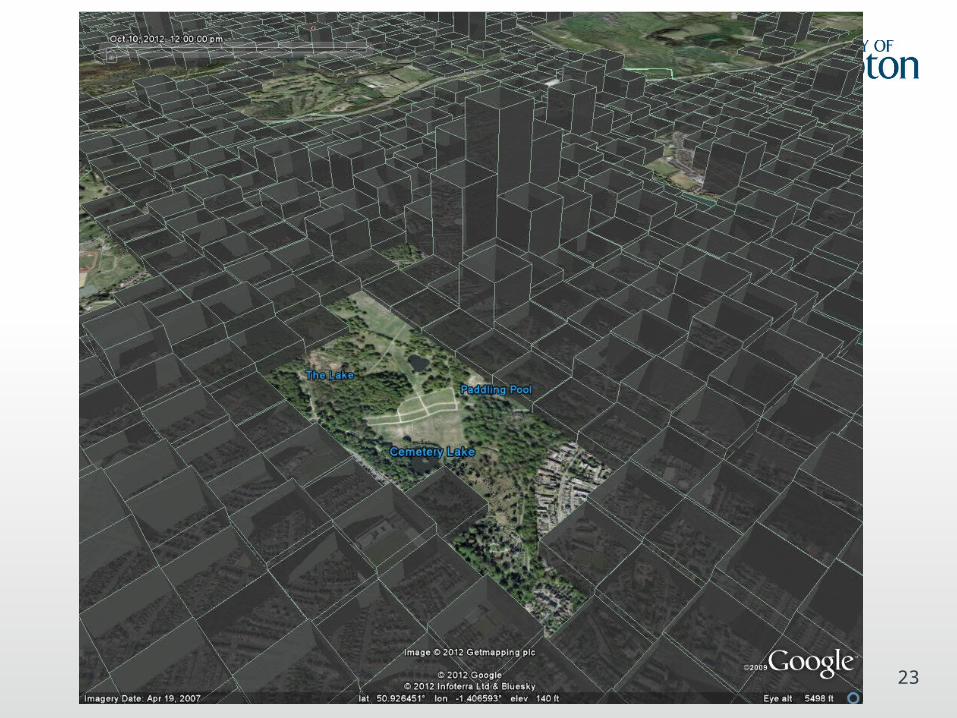
“Pop 24/7” overview• Spatio-temporal gridded population modelling
– Variable kernel density estimation (KDE)– Utilises population centroids– Redistributes resident populations according to
a temporal profile– Population subgroups
• Removal of arbitrary administrative boundaries
• Allows locations of zero population density (Eg. Water)
9
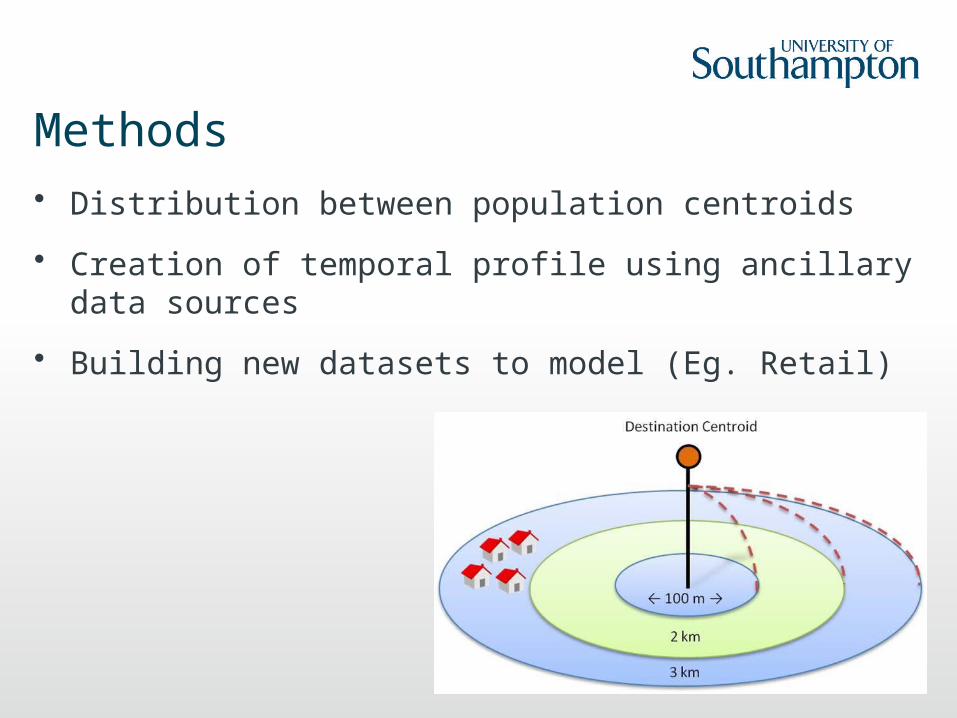
Methods• Distribution between population centroids
• Creation of temporal profile using ancillary data sources
• Building new datasets to model (Eg. Retail)
10
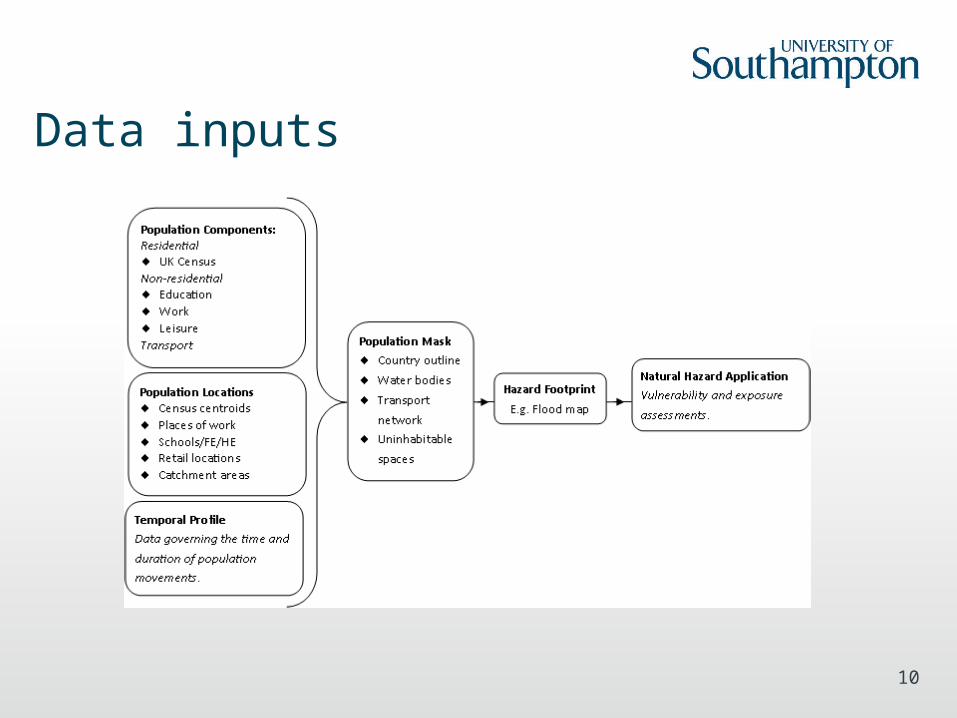
Data inputs
11
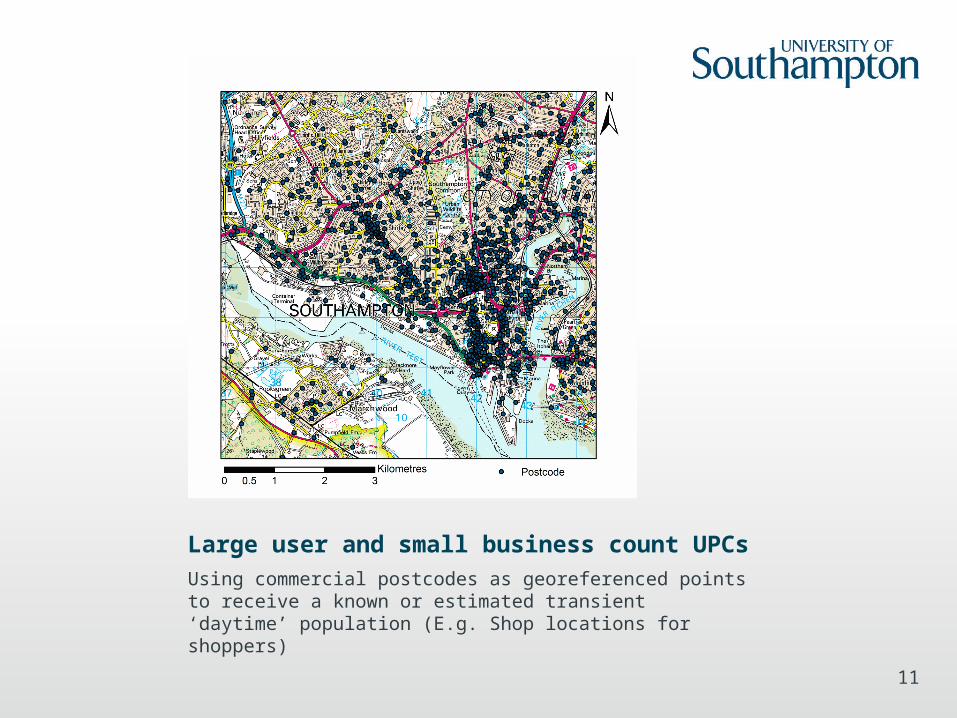
Large user and small business count UPCsUsing commercial postcodes as georeferenced points to receive a known or estimated transient ‘daytime’ population (E.g. Shop locations for shoppers)
12
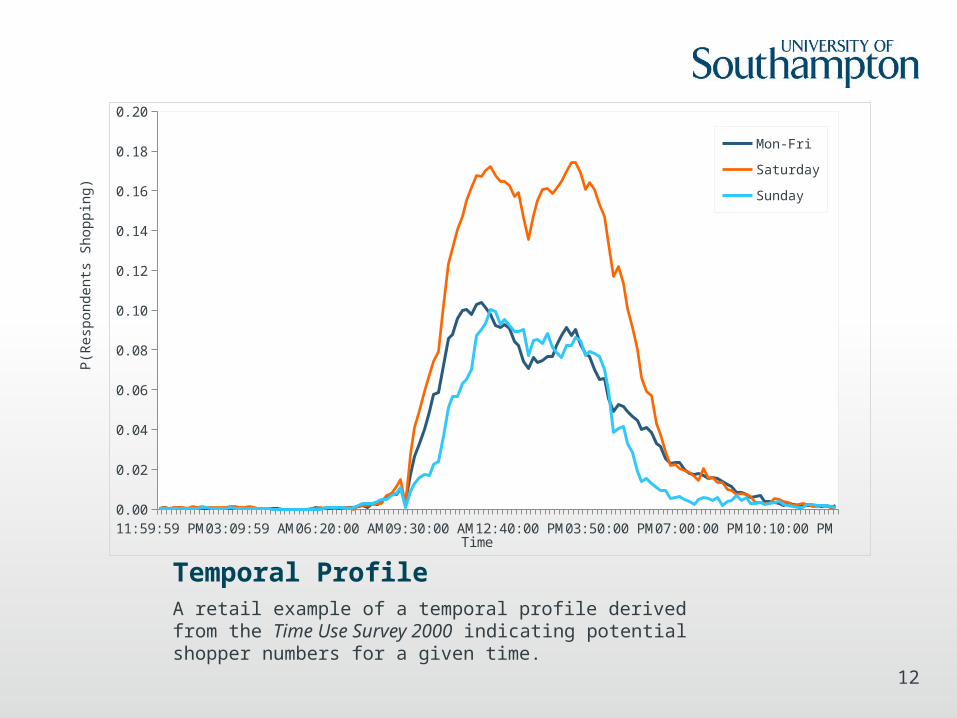
Temporal ProfileA retail example of a temporal profile derived from the Time Use Survey 2000 indicating potential shopper numbers for a given time.
11:59:59 PM 03:19:59 AM 06:40:00 AM 10:00:00 AM 01:20:00 PM 04:40:00 PM 08:00:00 PM 11:20:00 PM0.00
0.02
0.04
0.06
0.08
0.10
0.12
0.14
0.16
0.18
0.20
Mon-Fri
Saturday
Sunday
Time
P(R
esp
ondents
Shoppin
g)
13
Results• Variable grid size, currently using 250 metre
resolution
• Visualization for public communication
• Population weighted to background mask
• Combination and analysis with hazard footprint data
• Application to a UK flooding scenario, using the Environment Agency’s ‘Flood Map’.
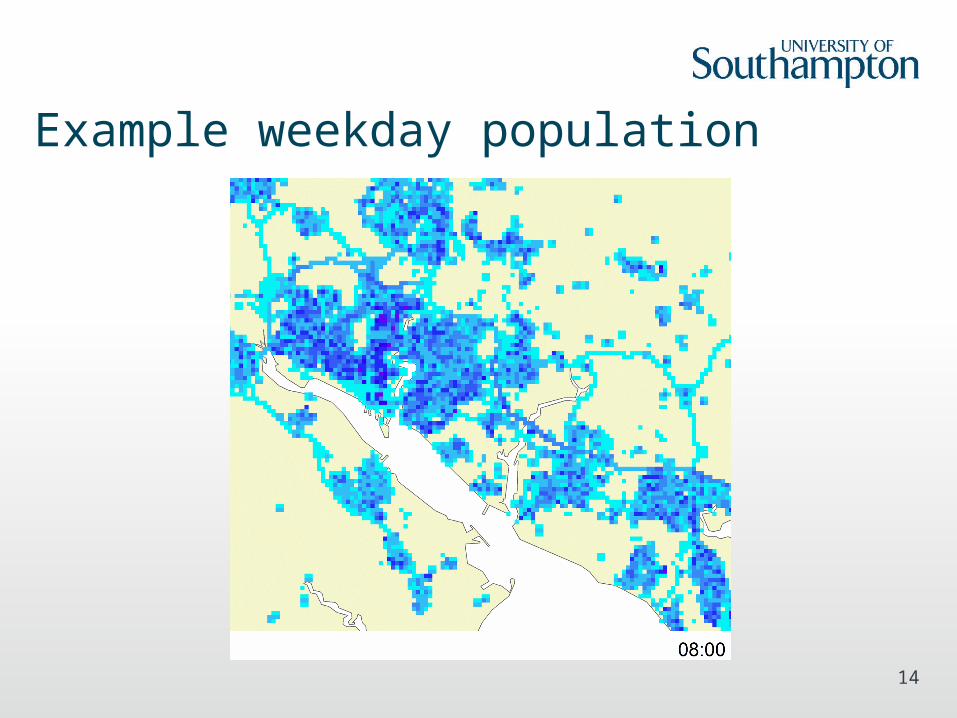
14
Example weekday population

15
Example weekday population

16
Example weekday population

17
Example weekday population
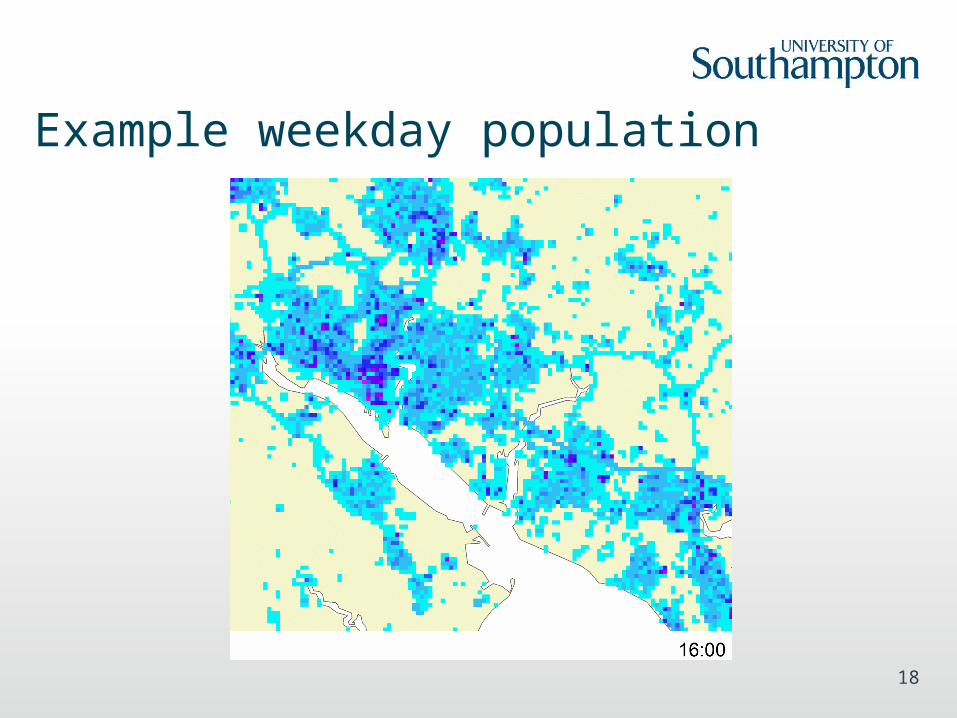
18
Example weekday population
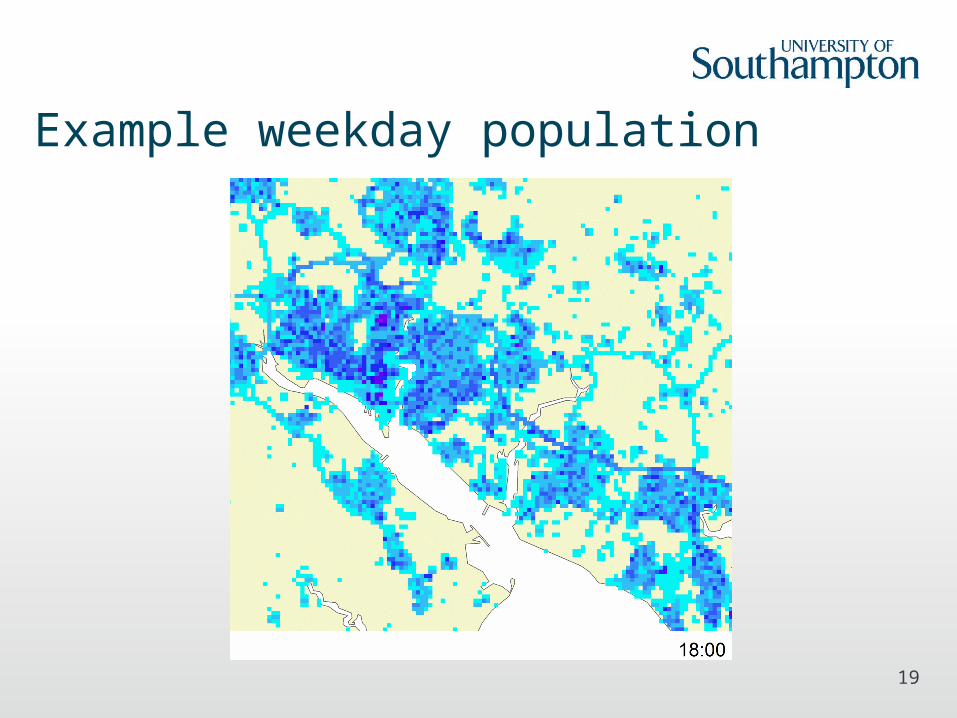
19
Example weekday population

20
Example weekday population

21
Example weekday population
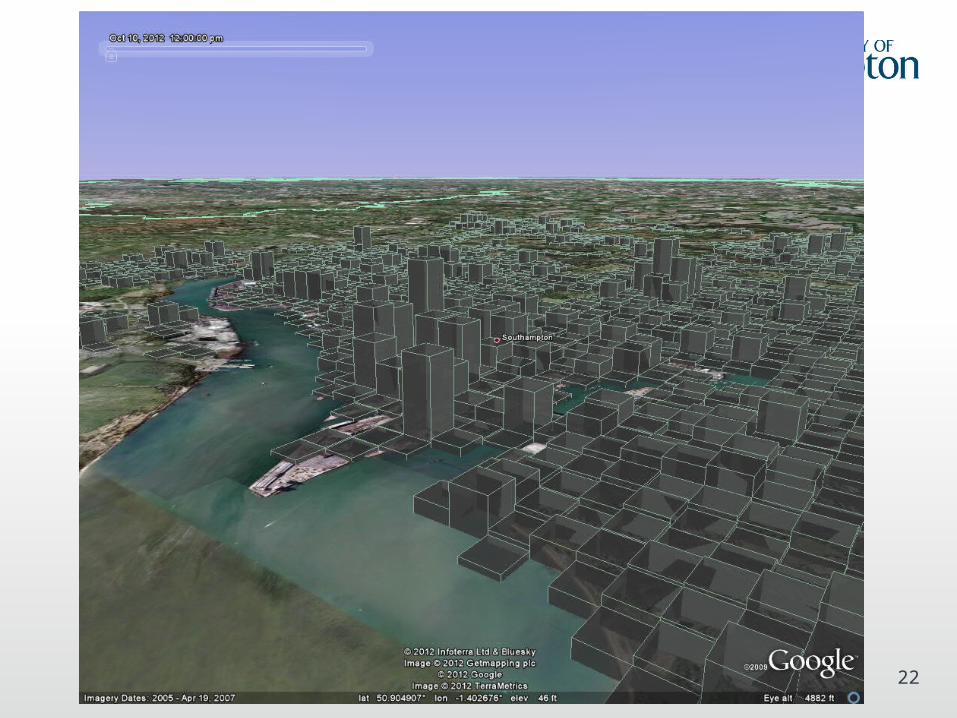
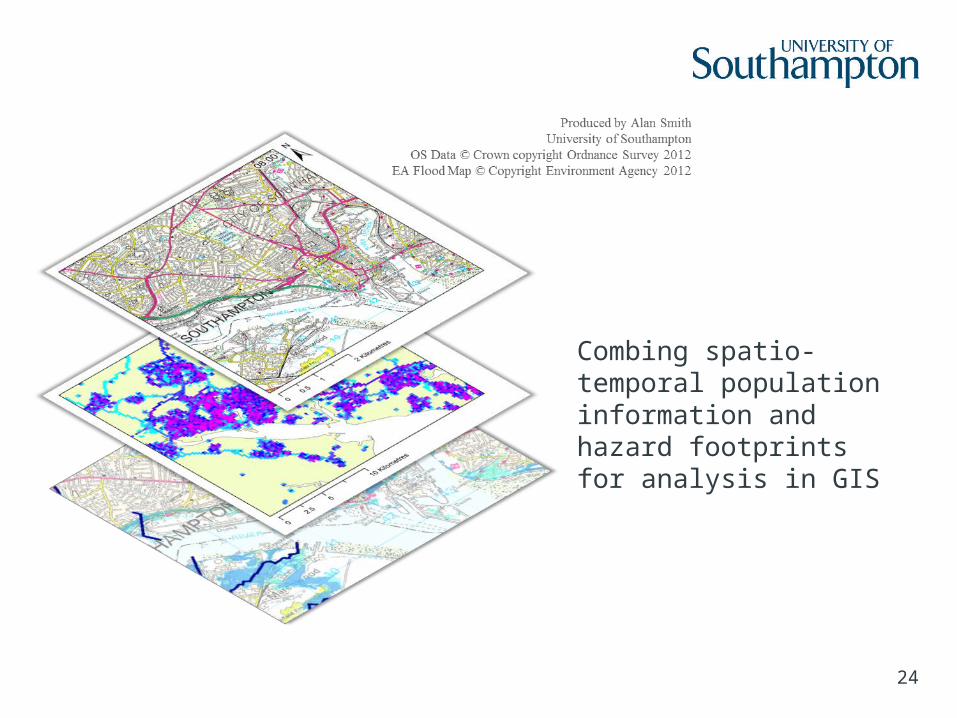
24
Combing spatio-temporal population information and hazard footprints for analysis in GIS
25
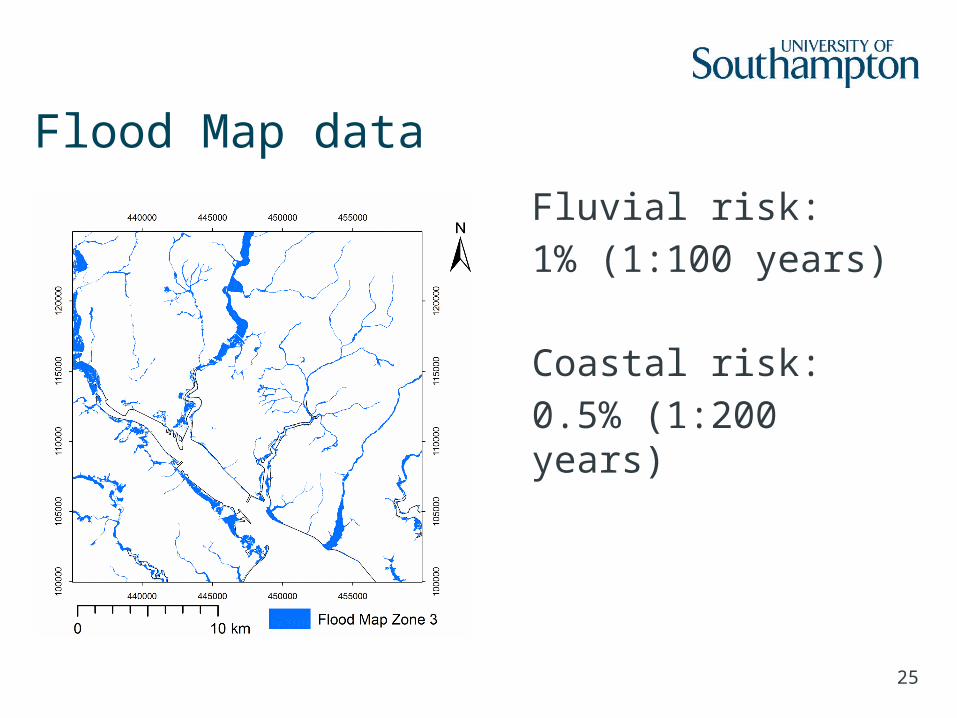
Flood Map data
Fluvial risk:1% (1:100 years)
Coastal risk:0.5% (1:200 years)
26
Next steps• Further analysis of results
• Continued development of datasets and temporal profiles
• Application to a hazard scenario
• Demonstrate improved exposure estimations
• Advances in natural hazard risk management
• Many more potential applications…
