geography: methods and materials lecture 1: true maps, false impressions describe basic...
TRANSCRIPT

Geography: Methods and Materials
Lecture 1: True Maps, False Impressions Describe basic characteristics of maps, Describe various ways landscapes are portrayed
I. The Nature of Maps
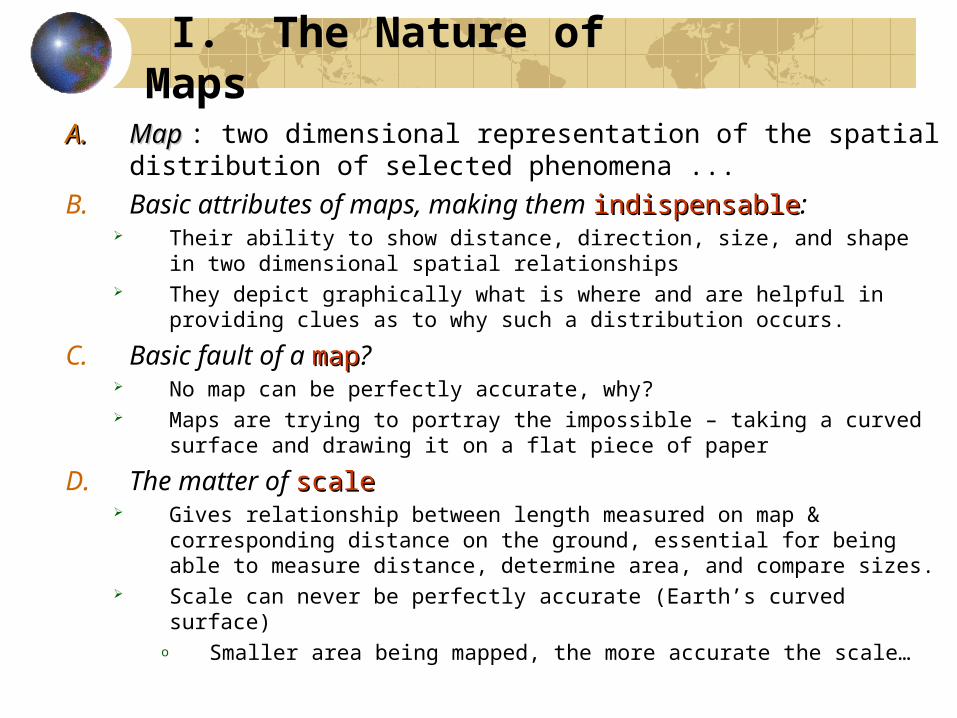
A.A. Map Map : two dimensional representation of the spatial distribution of selected phenomena ...
B. Basic attributes of maps, making them indispensableindispensable: Their ability to show distance, direction, size, and shape in two
dimensional spatial relationships They depict graphically what is where and are helpful in providing clues
as to why such a distribution occurs.
C. Basic fault of a mapmap? No map can be perfectly accurate, why? Maps are trying to portray the impossible – taking a curved surface and
drawing it on a flat piece of paper
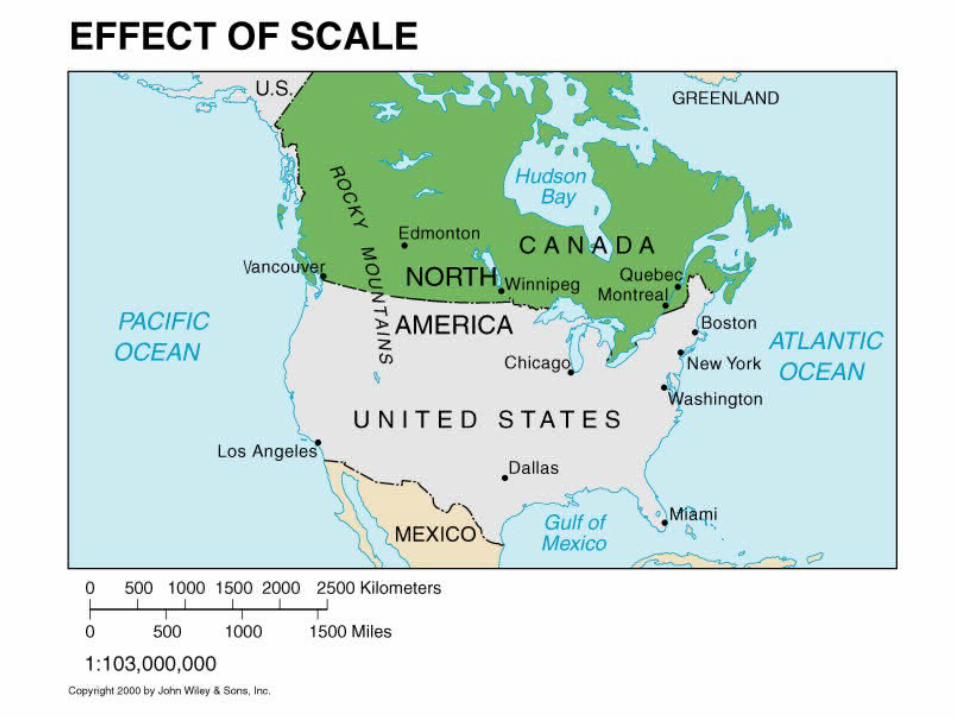
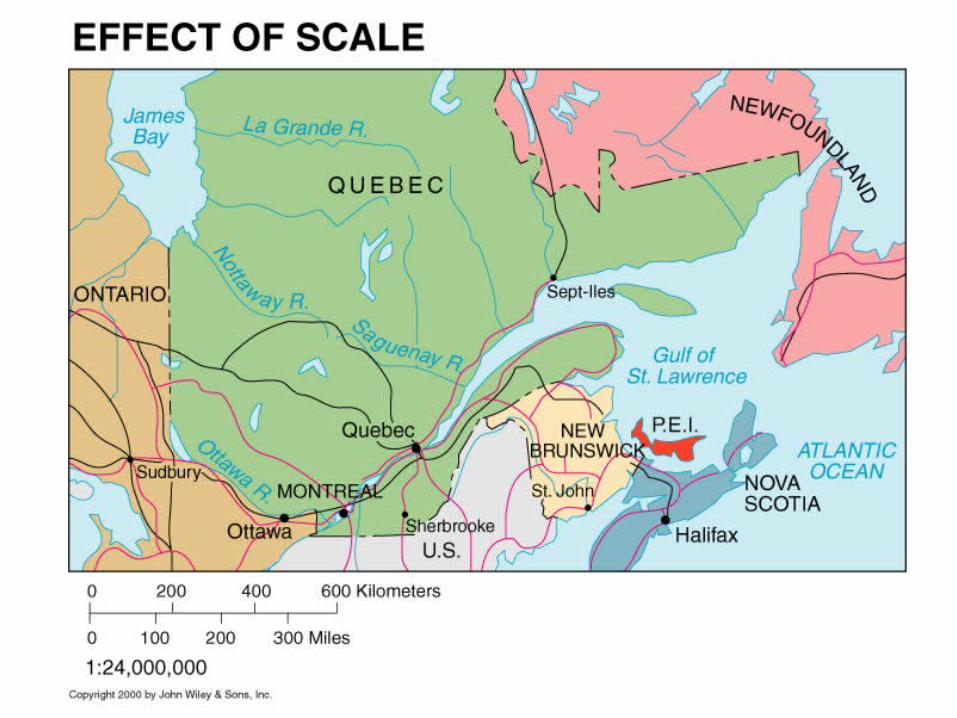
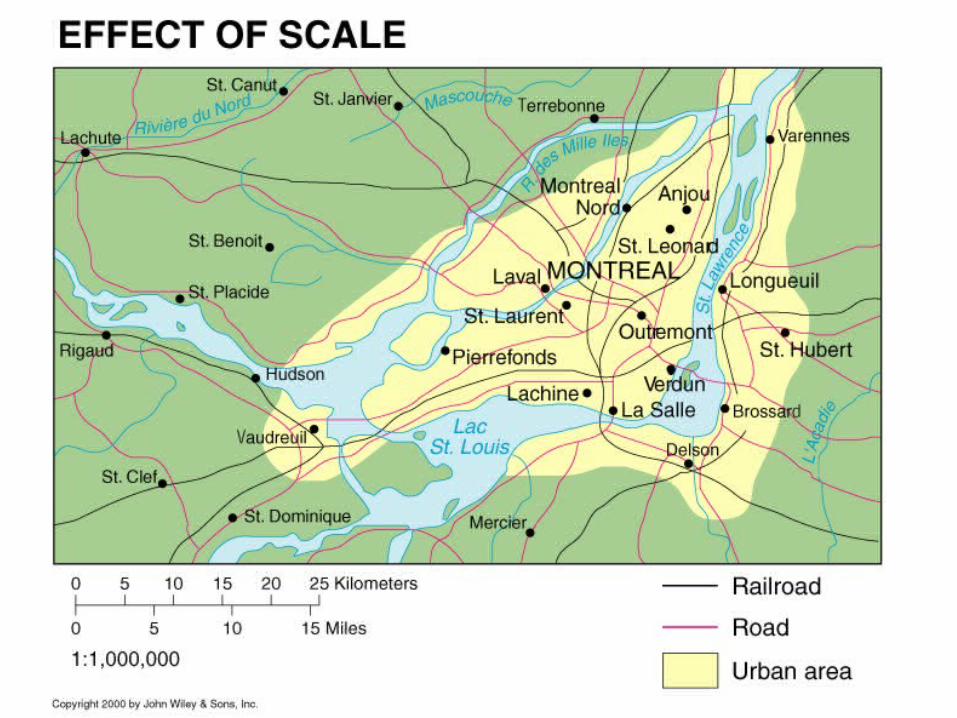
D. The matter of scalescale Gives relationship between length measured on map & corresponding
distance on the ground, essential for being able to measure distance, determine area, and compare sizes.
Scale can never be perfectly accurate (Earth’s curved surface)o Smaller area being mapped, the more accurate the scale…
Location
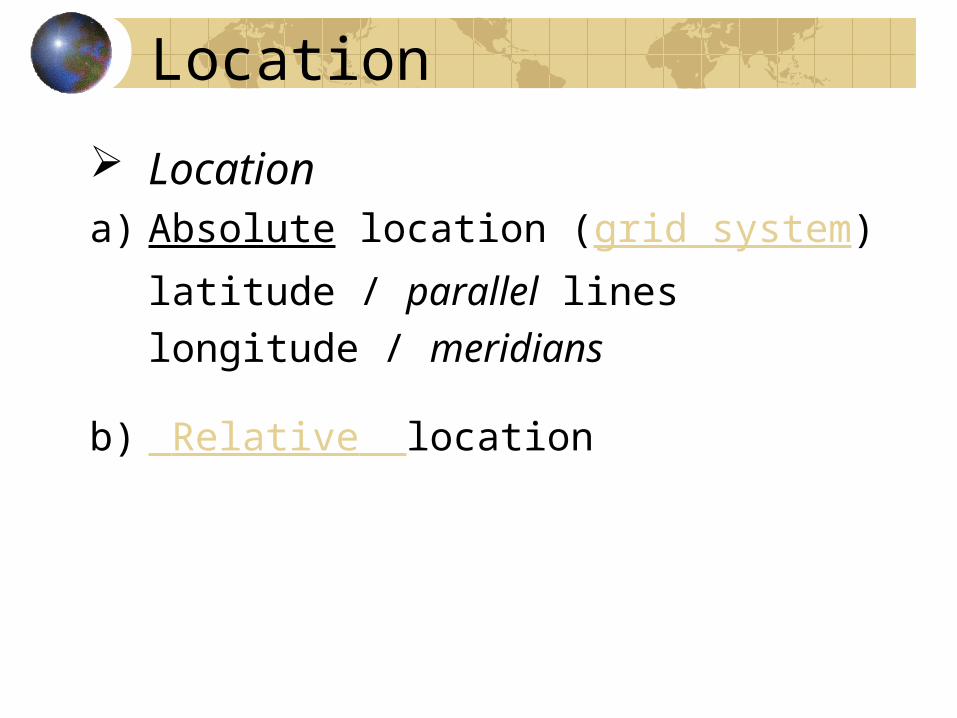
Location
a) Absolute location (grid system)
latitude / parallel lines
longitude / meridians
b) Relative location
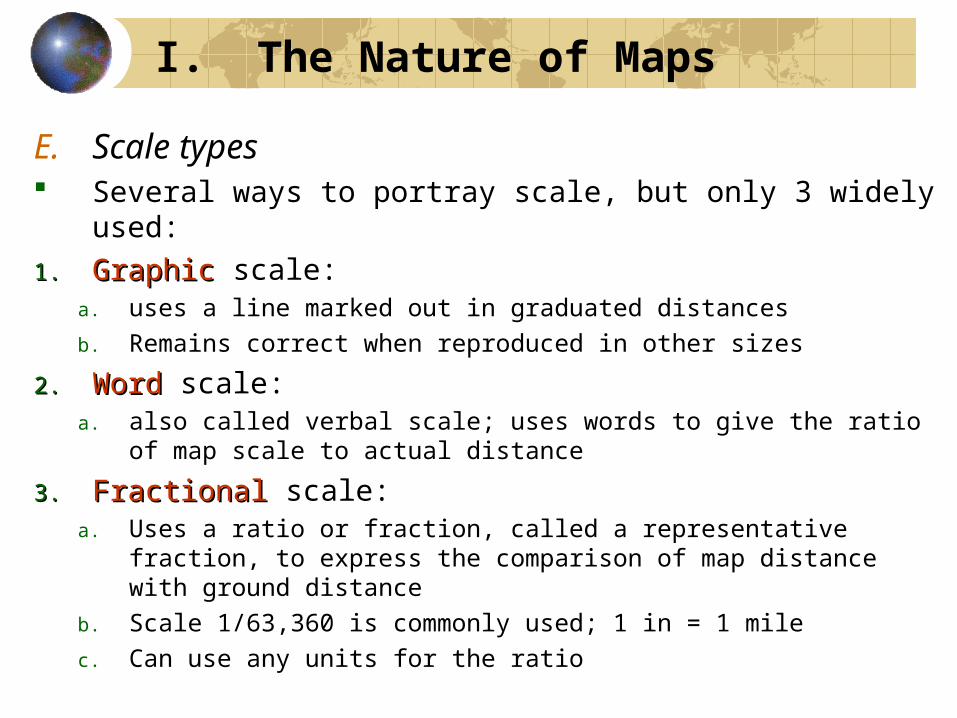
E. Scale types Several ways to portray scale, but only 3 widely used:
1.1. GraphicGraphic scale: a. uses a line marked out in graduated distancesb. Remains correct when reproduced in other sizes
2.2. WordWord scale:a. also called verbal scale; uses words to give the ratio of map
scale to actual distance
3.3. FractionalFractional scale:a. Uses a ratio or fraction, called a representative fraction, to
express the comparison of map distance with ground distanceb. Scale 1/63,360 is commonly used; 1 in = 1 milec. Can use any units for the ratio
I. The Nature of Maps
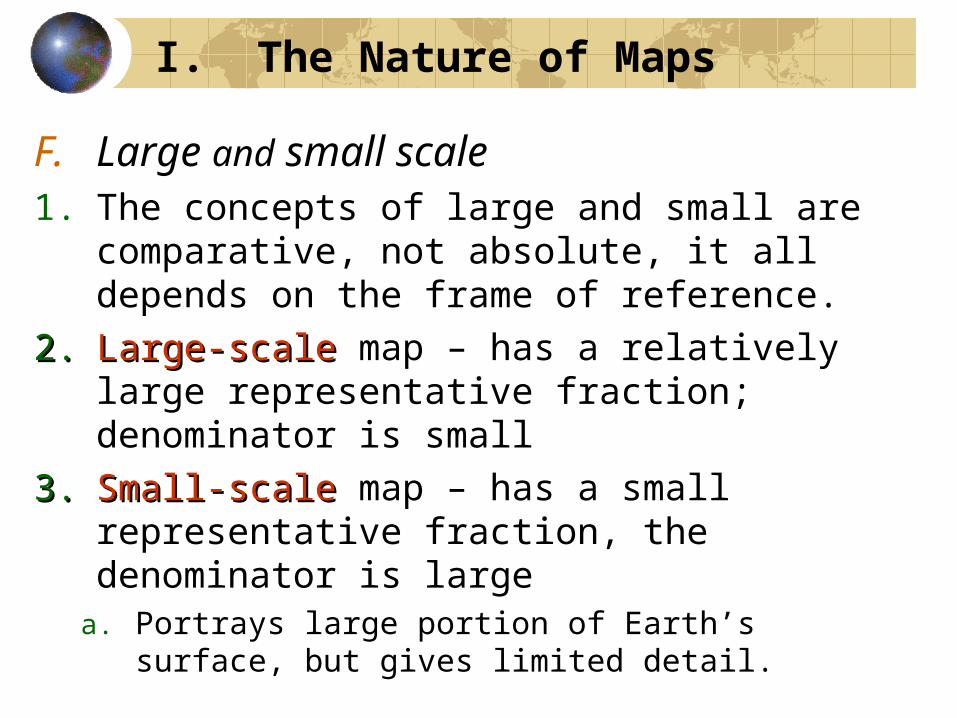
F. Large and small scale1. The concepts of large and small are
comparative, not absolute, it all depends on the frame of reference.
2.2. Large-scaleLarge-scale map – has a relatively large representative fraction; denominator is small
3.3. Small-scaleSmall-scale map – has a small representative fraction, the denominator is large
a. Portrays large portion of Earth’s surface, but gives limited detail.
I. The Nature of Maps

A. Globes have several advantages:1. Can maintain correct geometric
relationships of meridian to parallel, of equator to pole, of continents to oceans,
2. Can show comparative distances, comparative sizes & accurate directions,
3. Can represent without distortion the spatial relationships of features on Earth’s surface.
II. The Role of Globes
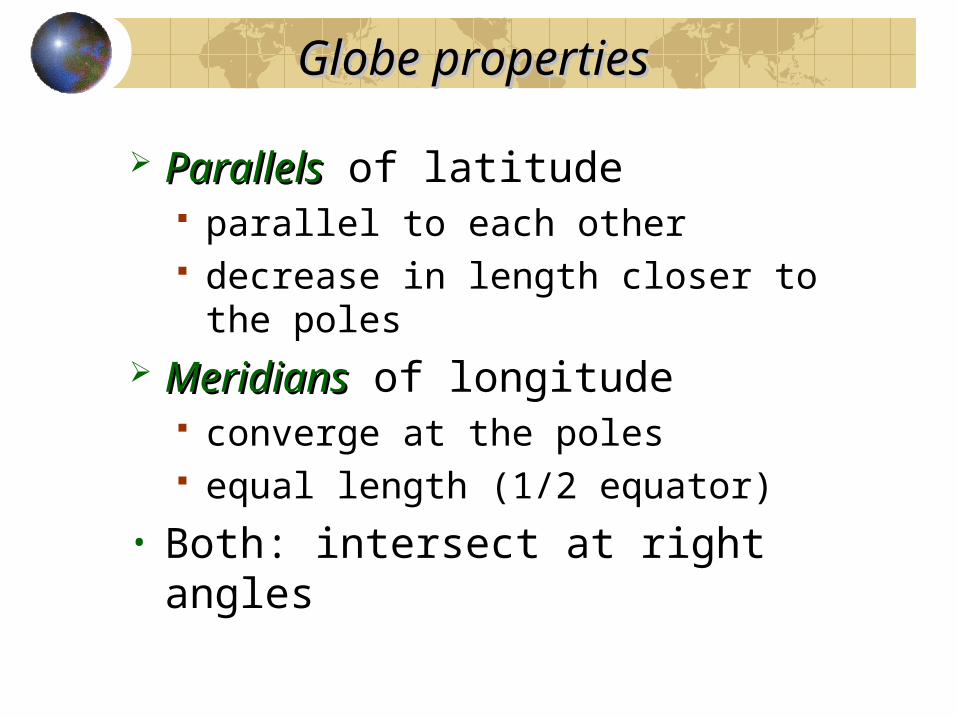
Globe Globe propertiesproperties
ParallelsParallels of latitude parallel to each other decrease in length closer to the
poles MeridiansMeridians of longitude
converge at the poles equal length (1/2 equator)
• Both: intersect at right angles
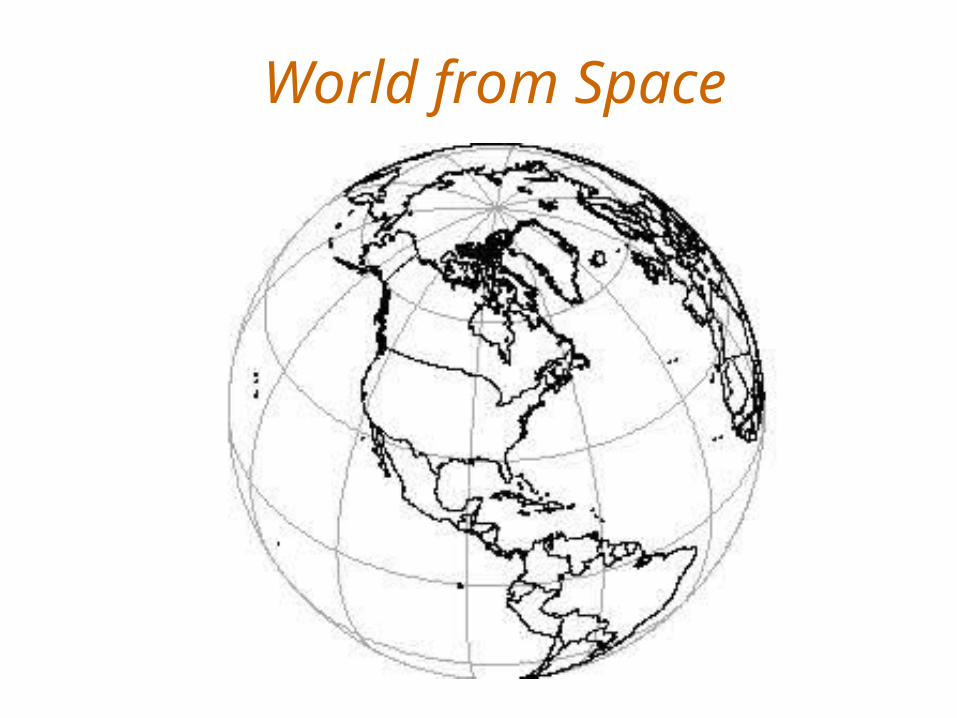
World from Space
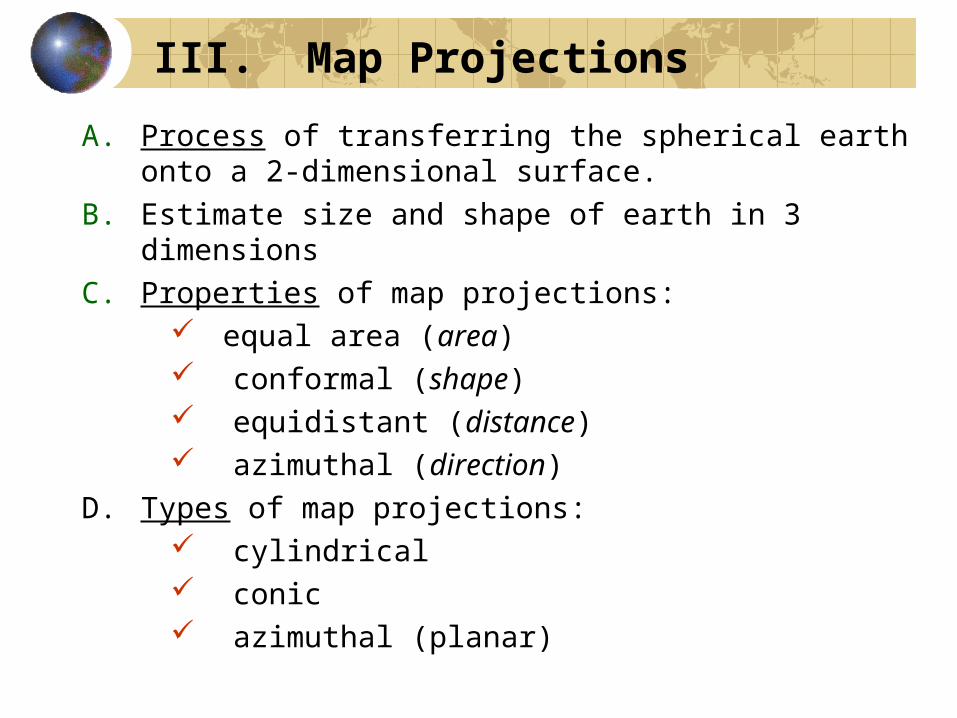
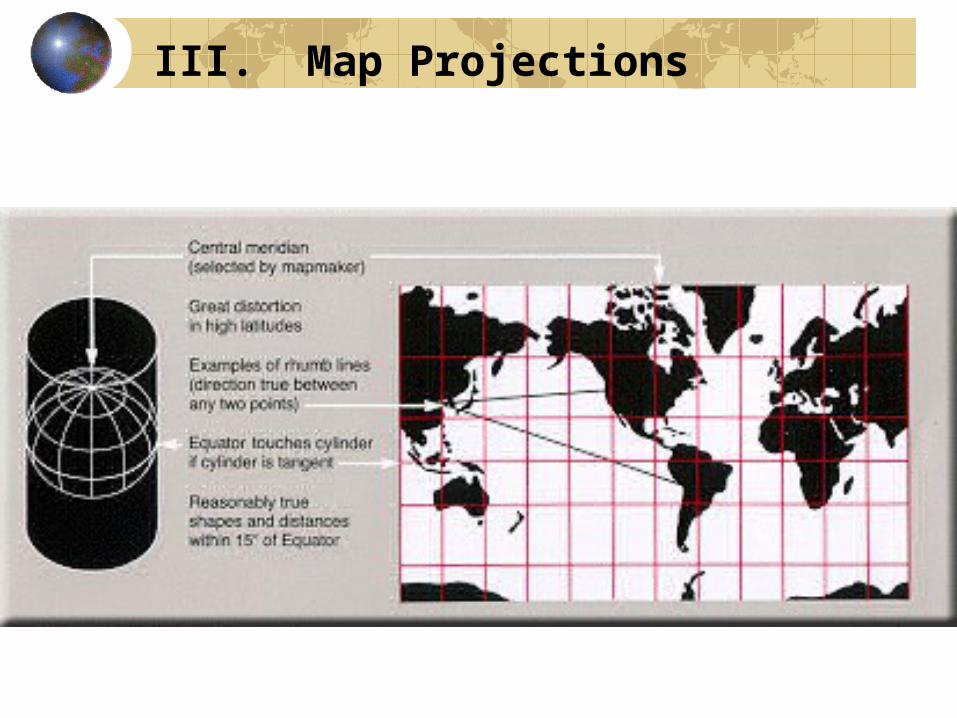
III. Map Projections
A. Process of transferring the spherical earth onto a 2-dimensional surface.
B. Estimate size and shape of earth in 3 dimensionsC. Properties of map projections:
equal area (area) conformal (shape) equidistant (distance) azimuthal (direction)
D. Types of map projections: cylindrical conic azimuthal (planar)
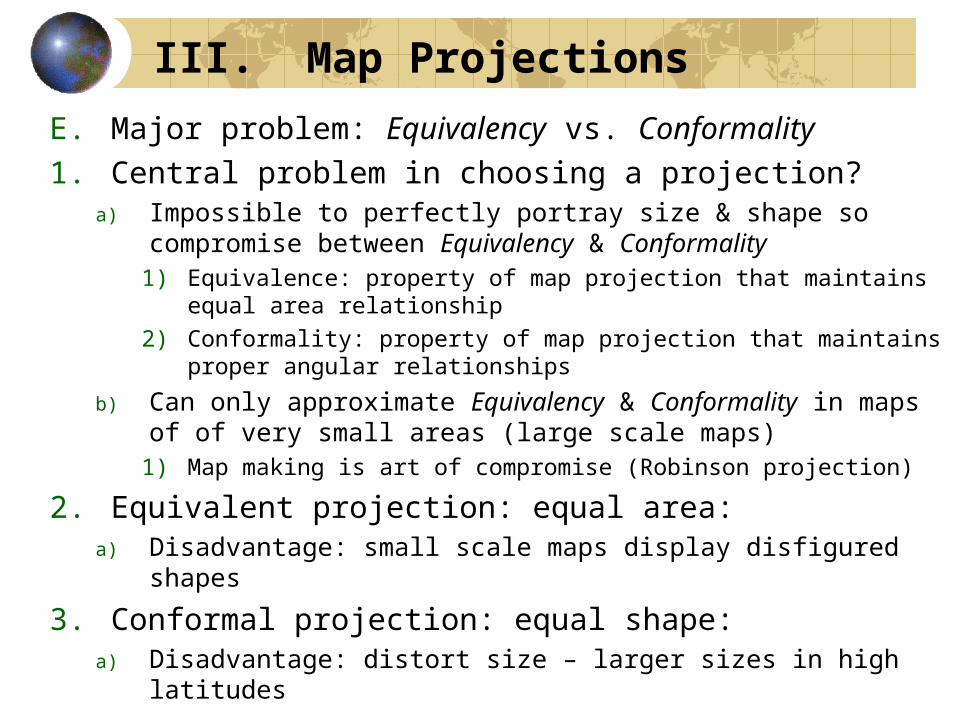
III. Map Projections
E. Major problem: Equivalency vs. Conformality1. Central problem in choosing a projection?
a) Impossible to perfectly portray size & shape so compromise between Equivalency & Conformality
1) Equivalence: property of map projection that maintains equal area relationship
2) Conformality: property of map projection that maintains proper angular relationships
b) Can only approximate Equivalency & Conformality in maps of of very small areas (large scale maps)
1) Map making is art of compromise (Robinson projection)
2. Equivalent projection: equal area:a) Disadvantage: small scale maps display disfigured shapes
3. Conformal projection: equal shape:a) Disadvantage: distort size – larger sizes in high latitudes
III. Map Projections
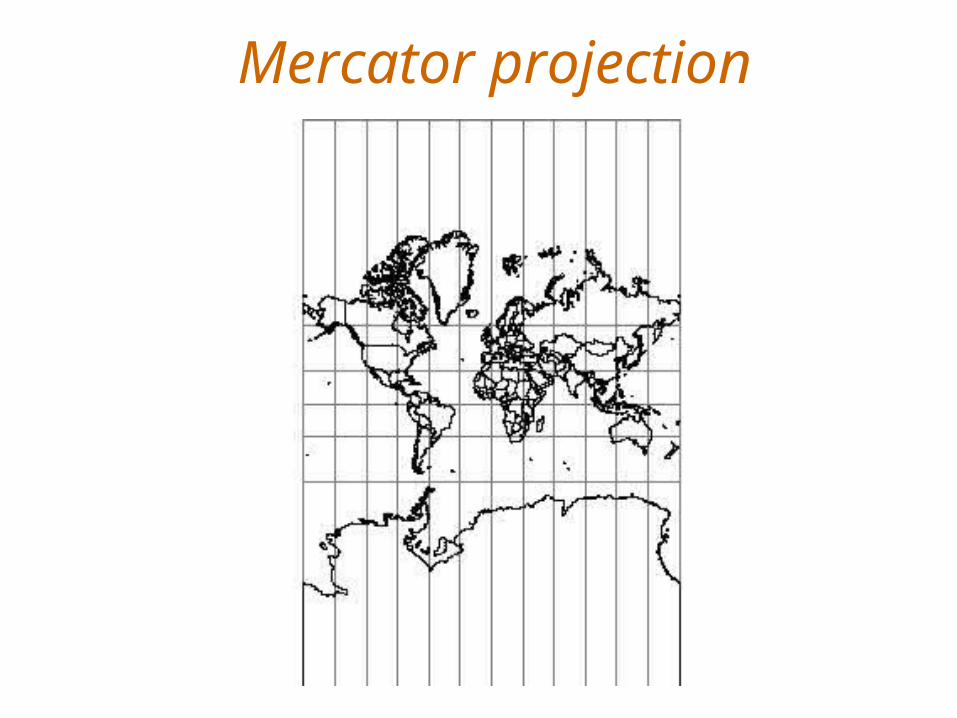
Mercator projection
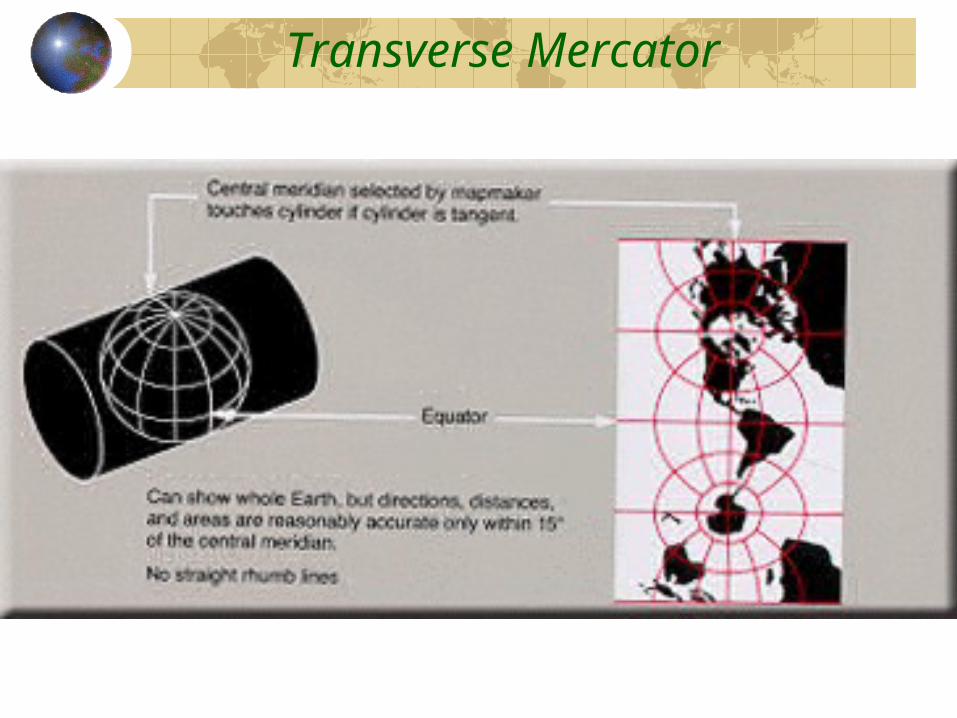
Transverse Mercator

Albers conic (equal area)

Azimuthal
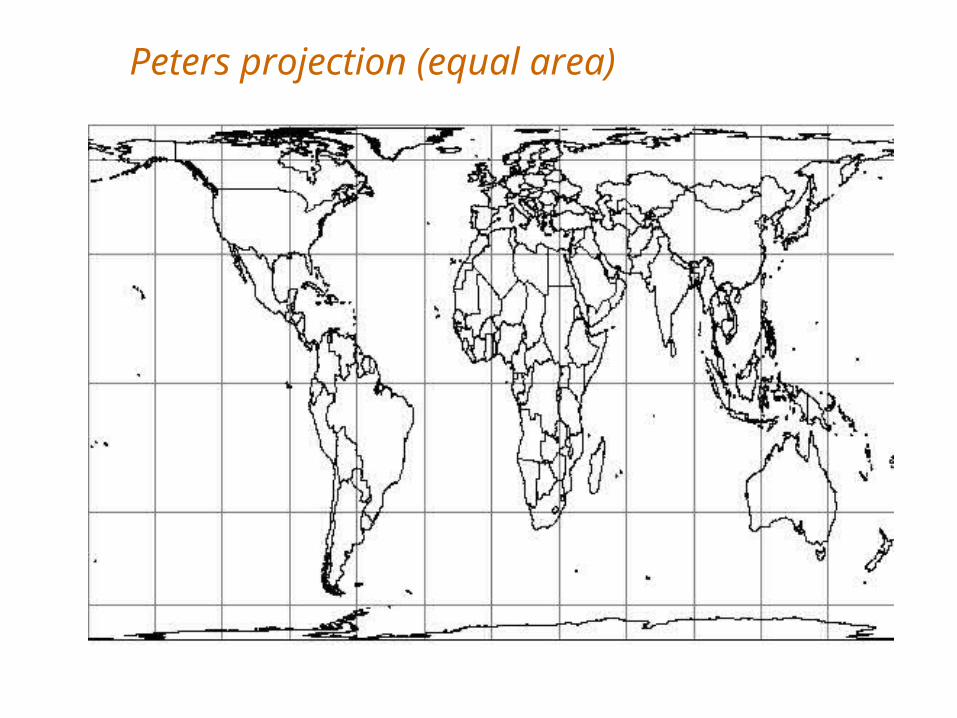
Peters projection (equal area)
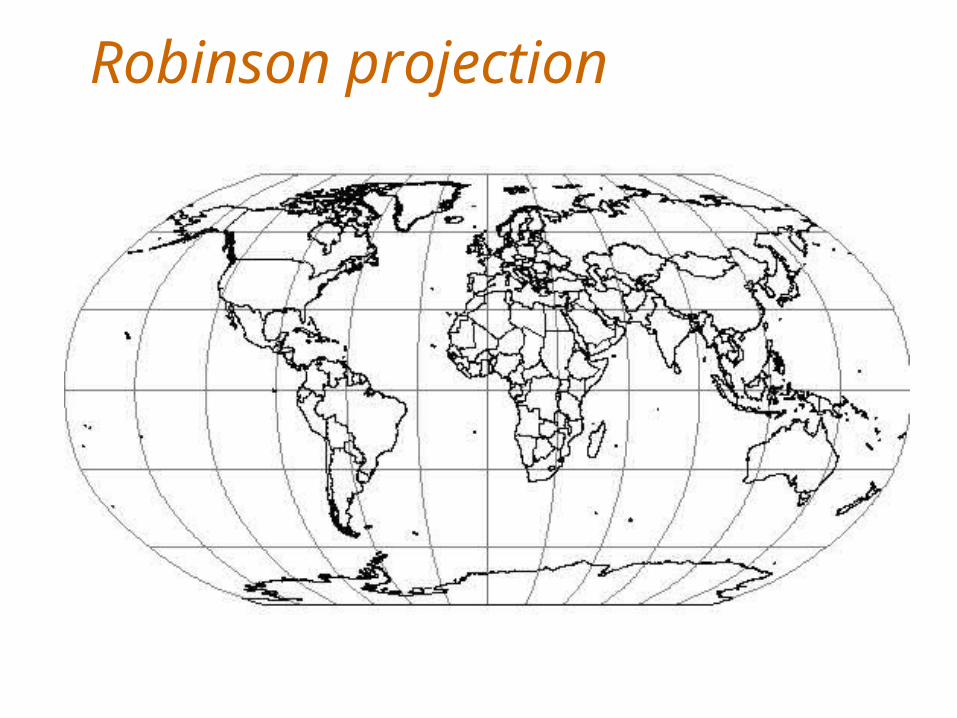
Robinson projection
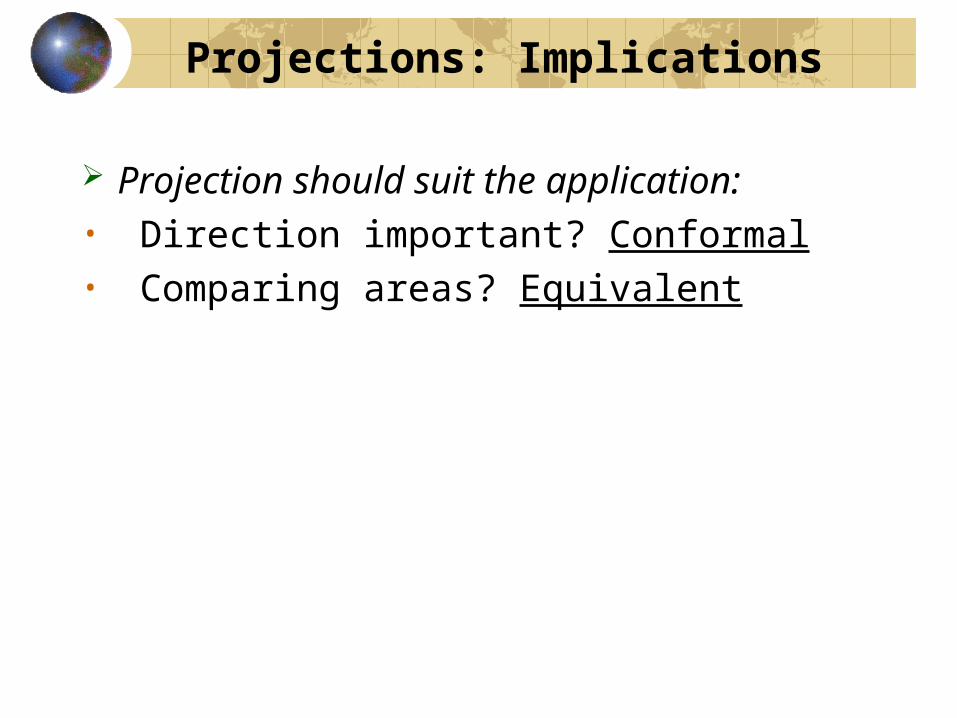
Projections: Implications
Projection should suit the application:• Direction important? Conformal• Comparing areas? Equivalent

A. Computer technology has provided several great benefits to cartography:
• Improved speed and data handling ability,
• Reduced time involved in map production,
• Ability for cartographer to examine alternative maps layout.
IV. Automated Cartography
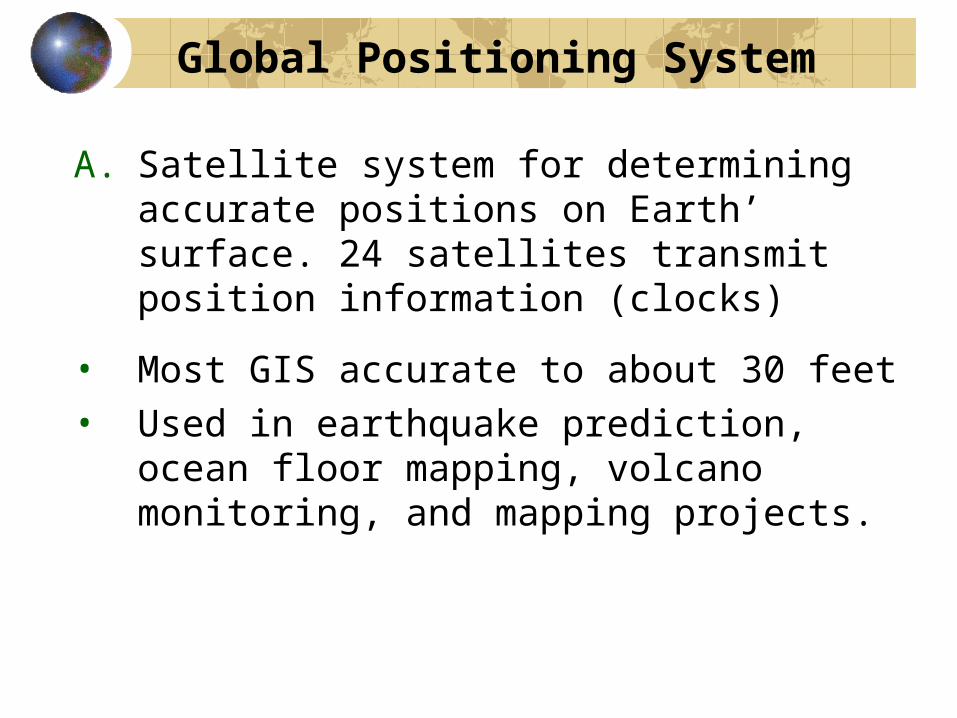
A. Satellite system for determining accurate positions on Earth’ surface. 24 satellites transmit position information (clocks)
• Most GIS accurate to about 30 feet• Used in earthquake prediction, ocean
floor mapping, volcano monitoring, and mapping projects.
Global Positioning System
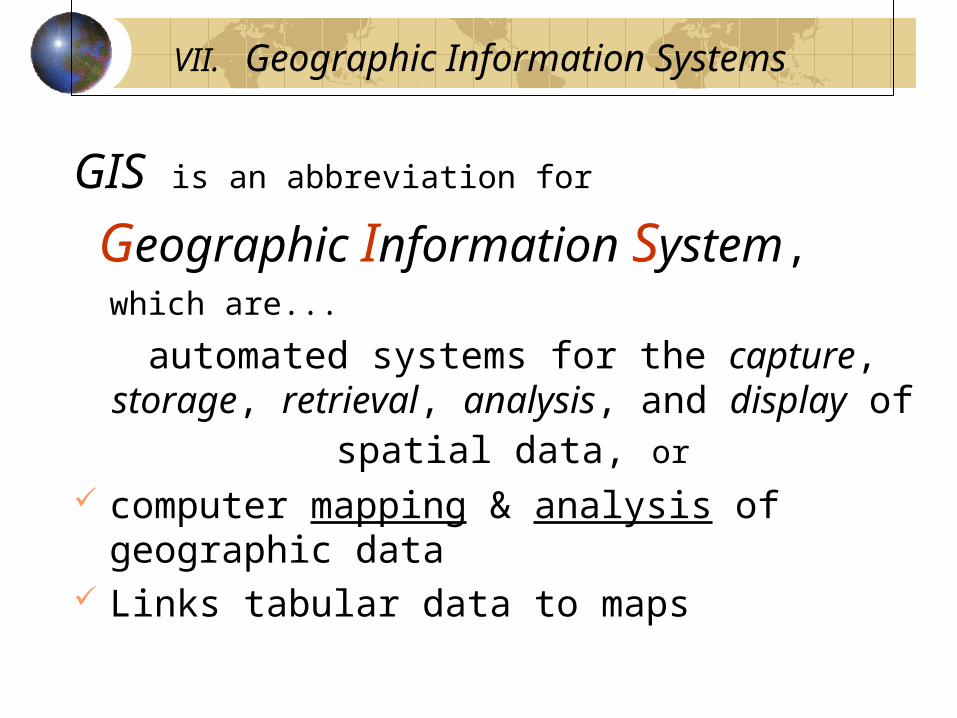
VII. Geographic Information Systems
GIS is an abbreviation for
Geographic Information System, which are...
automated systems for the capture, storage, retrieval, analysis, and display of
spatial data, or
computer mapping & analysis of geographic data
Links tabular data to maps
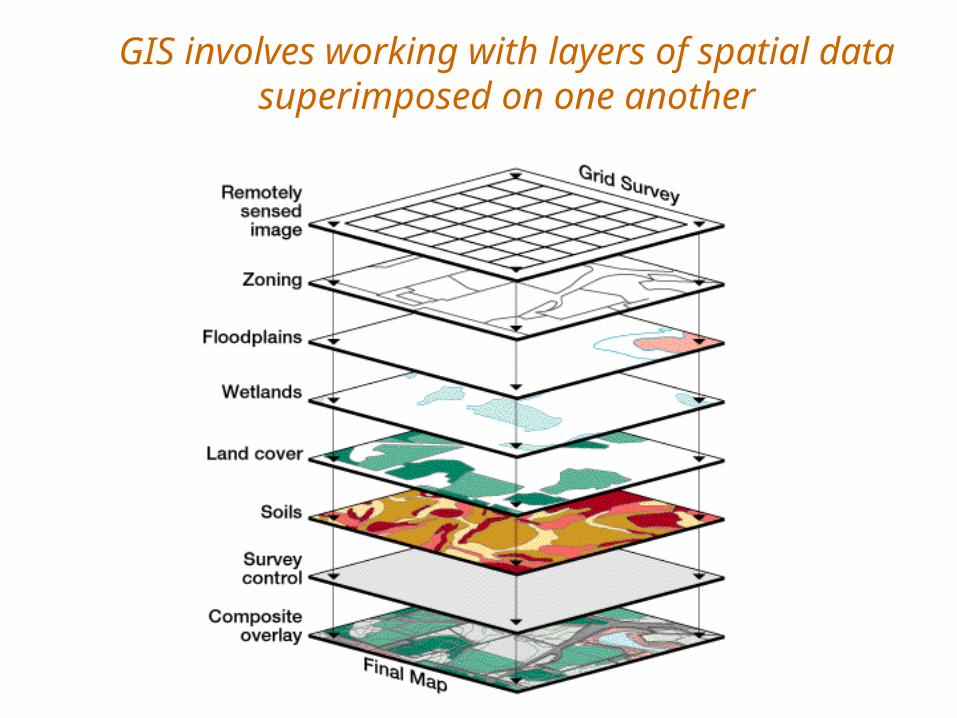
GIS involves working with layers of spatial data superimposed on one another

What Are the Componentsof a GIS?
• Hardware• Software• Data• Methods• People
VIII. Remote Sensing
A. Study of the Earth’s surface from a distance
1. recording instruments operating from high altitudea) Different kinds of remote sensing
1) Aerial photos, color & infrared sensing, thermal infrared sensing, microwave, SPOT
B. Aerial Photographs
1. First form of remote sensing2. Aerial photograph: photo taken from elevated
platform such as balloon, rocket, airplane, satellitea) Either oblique or vertical
1) Oblique: Angle less than 90 degrees2) Vertical: camera angle perpendicular
a) photogrammetry
VIII. Remote Sensing
C. Orthophoto Maps
1. Multicolored distortion free photographic maps produced from computerized rectification of aerial imagery.
a) Landscape in detailb) Precise measurement of distance, shows subtle
topographic detail
D. Color infrared
1. Color – visible light region of EM spectruma) Evaluate health of crops & treesb) Landsat – satellites image Earth every 9 days