geography years 7–10 advice on programming and assessment
TRANSCRIPT

Geography Years 7–10
Advice on Programming and Assessment

Acknowledgements ‘Sample study: The Barbie doll’ on p 21 refers to ‘Billion Dollar Barbie’, New Wave Geography, 2003, pp 76, 77, 79, Geography Teachers Association of Victoria Inc. ‘Worksheet 1: Conducting a Survey’ on page 25 is extracted from Geography for Global Citizens, Parker et al., 1999, p 330, reproduced by permission Macmillan Education Australia. © 2003 Copyright Board of Studies NSW for and on behalf of the Crown in right of the State of New South Wales. This document contains Material prepared by the Board of Studies NSW for and on behalf of the State of New South Wales. The Material is protected by Crown copyright. All rights reserved. No part of the Material may be reproduced in Australia or in any other country by any process, electronic or otherwise, in any material form or transmitted to any other person or stored electronically in any form without the prior written permission of the Board of Studies NSW, except as permitted by the Copyright Act 1968. School students in NSW and teachers in schools in NSW may copy reasonable portions of the Material for the purposes of bona fide research or study. When you access the Material you agree: • to use the Material for information purposes only • to reproduce a single copy for personal bona fide study use only and not to reproduce any major extract or the entire
Material without the prior permission of the Board of Studies NSW • to acknowledge that the Material is provided by the Board of Studies NSW • not to make any charge for providing the Material or any part of the Material to another person or in any way make
commercial use of the Material without the prior written consent of the Board of Studies NSW and payment of the appropriate copyright fee
• to include this copyright notice in any copy made • not to modify the Material or any part of the material without the express prior written permission of the Board of
Studies NSW. The Material may contain third party copyright materials such as photos, diagrams, quotations, cartoons and artworks. These materials are protected by Australian and international copyright laws and may not be reproduced or transmitted in any format without the copyright owner’s specific permission. Unauthorised reproduction, transmission or commercial use of such copyright materials may result in prosecution. The Board of Studies has made all reasonable attempts to locate owners of third party copyright material and invites anyone from whom permission has not been sought to contact the Copyright Officer, ph (02) 9367 8289, fax (02) 9279 1482. Published by Board of Studies NSW GPO Box 5300 Sydney NSW 2001 Australia Tel: (02) 9367 8111 Fax: (02) 9367 8484 Internet: www.boardofstudies.nsw.edu.au October 2003 Revised September 2011 ISBN 1 7409 9838 3 20110725

Contents
1 Introduction .................................................................................................................. 5 2 Establishing a Scope and Sequence Plan...................................................................... 6
2.1 Sample Stage 4 Mandatory Scope and Sequence Plan ....................................... 6 2.2 Sample Stage 5 Mandatory Scope and Sequence Plan ....................................... 6 2.3 Sample Stage 5 Elective Scope and Sequence Plan ............................................ 7 2.4 Sample Stage 5 Elective Scope and Sequence Plan ............................................ 7
3 Advice on Assessment .................................................................................................. 8 3.1 Assessment for Learning ..................................................................................... 8
3.2 Planning for Effective Learning and Assessment ............................................... 9 3.3 Designing Effective Learning and Assessment ................................................ 11 3.4 Annotated Assessment for Learning Activity ................................................... 11 3.5 Sharing Learning and Assessment Intentions ................................................... 14
3.6 Effective Feedback to Students ......................................................................... 14 3.7 Recording Evidence for Assessment ................................................................. 14
4 Programming Units of Work ...................................................................................... 16 5 Sample Units of Work ................................................................................................ 17
5.1 Stage 4 Mandatory Sample Unit of Work: Global Change .............................. 18 5.1.1 Sample assessment for learning activity: Communicating the
survey results ........................................................................................... 22 Worksheet 1: Conducting a survey .......................................................... 24 Worksheet 2: Sample survey ................................................................... 25 Worksheet 3: Survey summary and analysis ........................................... 26 5.2 Stage 5 Mandatory Sample Unit of Work: Changing Australian
Communities ..................................................................................................... 27 5.2.1 Sample assessment for learning activity: Demographic research .......... 32 Worksheet 1: Demographic research ....................................................... 34 Worksheet 2: Peer assessment ................................................................. 35 5.3 Stages 4/5 Elective Sample Unit of Work: Physical Geography ...................... 36 5.3.1 Sample assessment for learning activity: Graphic outline activity .......... 42 Worksheet 1: Graphic outline .................................................................. 45 Worksheet 2: Peer assessment ................................................................. 46


Geography Years 7–10: Advice on Programming and Assessment
5
1 Introduction This support document has been designed to help teachers understand key aspects of the new Geography Years 7–10 Syllabus and to provide guidance for implementation. The document shows how these aspects can be incorporated in teaching and learning programs, and how these programs are underpinned by the principles of assessment for learning (Geography Years 7–10 Syllabus, pages 81–82). The document provides advice about constructing a program that will cover the scope of Geography for two stages. It sets out a process for planning and sequencing units of work, and developing teaching and learning activities. The sample stage program plans and the sample units of work in this document demonstrate ways in which teachers can build a teaching and learning program and develop units of work to ensure coverage of the scope of the syllabus. This document contains three sample units of work: Stage 4 Mandatory Course – The Changing Nature of the World – Globalisation • an eight-hour unit that introduces Topic 4G3 – Global Change. Stage 5 Mandatory Course – Changing Australian Communities • a 25-hour unit that explains how communities in Australia are responding to change. Stage 5 Elective Course – Physical Geography • a 40-hour unit on the geographical processes that form and transform the physical world. These sample units can be used as models for planning units of work. They include: • relevant outcomes and content • assessment activities that have been designed and integrated into the units of work • different types of possible feedback • a variety of teaching and learning experiences • opportunities for student reflection. An assessment activity from each unit has been selected to show how assessment can fit into teaching and learning sequences. They are described in some detail to illustrate the process of assessment for learning. Teachers would not provide this level of detail in day-to-day classroom situations. The units of work and activities may be modified or amended to suit the needs, interests and abilities of students. For a small percentage of students with special education needs who are undertaking Life Skills outcomes and content, support materials will be provided which will assist in the development of a meaningful and relevant program of study related to the Geography Years 7–10 Syllabus. Units of work adapted for students undertaking Geography Life Skills will be included in a consolidated document that will be distributed to schools early in 2004.

Geography Years 7–10: Advice on Programming and Assessment
6
2 Establishing a Scope and Sequence 2.1 Sample Stage 4 Mandatory Scope and Sequence Students must undertake 100 hours of study in Global Geography (Stage 4). In this sample, each of the four mandatory focus areas is allocated equal time of 25 hours. The sample below indicates the course being implemented over one year or over two years. In a semesterised system, focus areas 4G1 and 4G2 would be taught in Year 7 and focus areas 4G3 and 4G4 in Year 8.
Focus Area Term / Semester
T1/S1 – 25h T2/S2 – 25h T3/S3 – 25h T4/S4 – 25h 4G 1 - Investigating the World (25 hours) An introduction to the discipline of Geography and the nature of geographical inquiry. Outcomes: 4.1, 4.2, 4.3, 4.4, 4.5, 4.6, 4.10 Geographical tools - maps, fieldwork, photographs
* Nature of geography, our world and geographical research – local area fieldwork * World Heritage site: Great Wall of China
4G 2 - Global Environments (25 hours)
The geographical processes that form and transform global environments, and human interactions within environments. Outcomes: 4.1, 4.2, 4.3, 4.4, 4.6, 4.8, 4.10 Geographical tools - maps, graphs & statistics, photographs
* Types of global environments – overview * Global environment study – Amazon River * Global community study; Quichua people
4G 3 - Global Change (25 hours) The changing nature of the world and responses to these changes. Outcomes: 4.1, 4.2, 4.3, 4.4, 4.5, 4.7, 4.9, 4.10 Geographical tools - maps, graphs & statistics, photographs
* Changing nature of the world * Global inequalities * Global organisations: UNICEF
4G 4 - Global Issues and the Role of Citizenship (25 hours)
Global geographical issues and appropriate methods of citizenship for their management. Outcomes: 4.2, 4.3, 4.4, 4.7, 4.8, 4.9, 4.10 Geographical tools - maps, fieldwork, graphs & statistics, photographs
* Global geographical issues - overview * Two geographical issues: - climate change - access to fresh water; including local area fieldwork.
Geography Years 7–10: Advice on Programming and Assessment
7
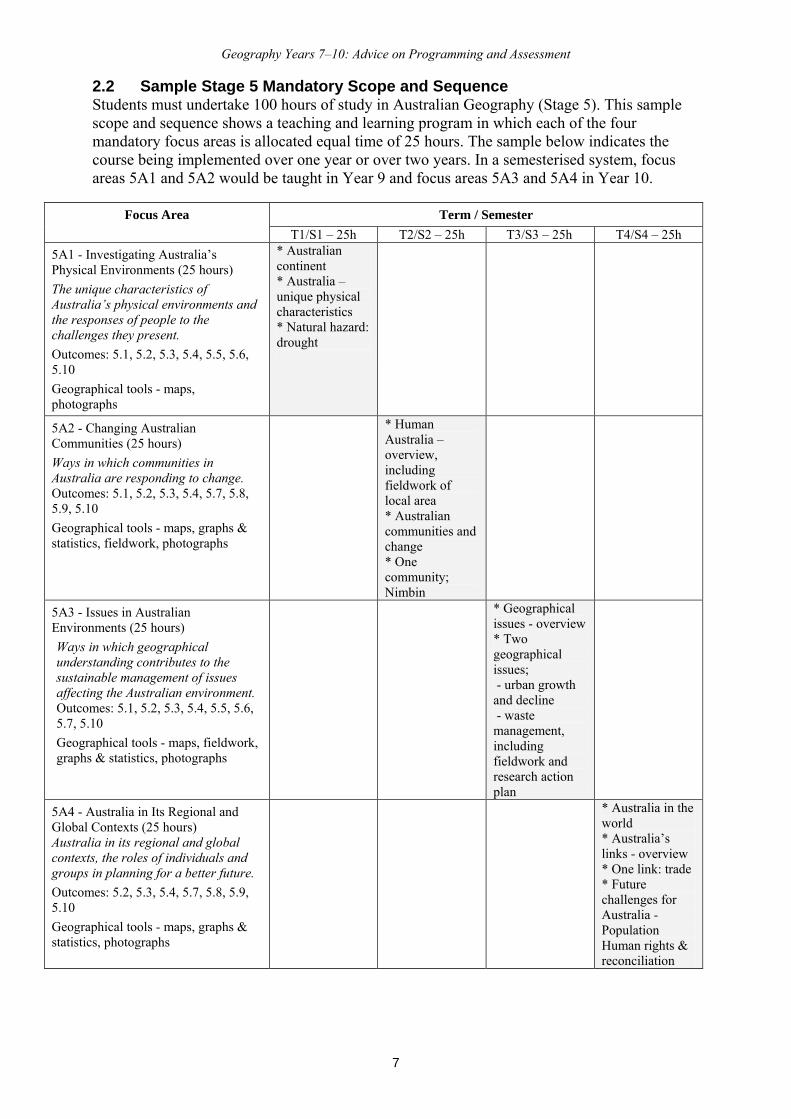
2.2 Sample Stage 5 Mandatory Scope and Sequence Students must undertake 100 hours of study in Australian Geography (Stage 5). This sample scope and sequence shows a teaching and learning program in which each of the four mandatory focus areas is allocated equal time of 25 hours. The sample below indicates the course being implemented over one year or over two years. In a semesterised system, focus areas 5A1 and 5A2 would be taught in Year 9 and focus areas 5A3 and 5A4 in Year 10.
Focus Area Term / Semester
T1/S1 – 25h T2/S2 – 25h T3/S3 – 25h T4/S4 – 25h 5A1 - Investigating Australia’s Physical Environments (25 hours) The unique characteristics of Australia’s physical environments and the responses of people to the challenges they present. Outcomes: 5.1, 5.2, 5.3, 5.4, 5.5, 5.6, 5.10 Geographical tools - maps, photographs
* Australian continent * Australia – unique physical characteristics * Natural hazard: drought
5A2 - Changing Australian Communities (25 hours) Ways in which communities in Australia are responding to change. Outcomes: 5.1, 5.2, 5.3, 5.4, 5.7, 5.8, 5.9, 5.10 Geographical tools - maps, graphs & statistics, fieldwork, photographs
* Human Australia – overview, including fieldwork of local area * Australian communities and change * One community; Nimbin
5A3 - Issues in Australian Environments (25 hours) Ways in which geographical understanding contributes to the sustainable management of issues affecting the Australian environment. Outcomes: 5.1, 5.2, 5.3, 5.4, 5.5, 5.6, 5.7, 5.10 Geographical tools - maps, fieldwork, graphs & statistics, photographs
* Geographical issues - overview * Two geographical issues; - urban growth and decline - waste management, including fieldwork and research action plan
5A4 - Australia in Its Regional and Global Contexts (25 hours) Australia in its regional and global contexts, the roles of individuals and groups in planning for a better future. Outcomes: 5.2, 5.3, 5.4, 5.7, 5.8, 5.9, 5.10 Geographical tools - maps, graphs & statistics, photographs
* Australia in the world * Australia’s links - overview * One link: trade * Future challenges for Australia -Population Human rights & reconciliation

Geography Years 7–10: Advice on Programming and Assessment
8
2.3 Sample Stage 5 Elective Scope and Sequence
Students may undertake 100 or 200 hours of Elective Geography. This scope and sequence indicates a teaching and learning program for a 100 hour course in which each focus area is allocated equal time of 25 hours.
Focus Area Term / Semester
T1/S1 – 25h T2/S2 – 25h T3/S3 – 25h T4/S4 – 25h E1. Physical Geography The geographical processes that form and transform the physical world. Outcomes: E5.1, E5.2, E5.3, E5.4, E5.5, E5.6, E5.10, E5.11 Geographical tools and ICT
* plate tectonics * weathering & mass movement, erosion & deposition * one landscape - mountains - climate & weather - biogeography - one vegetation community; alpine forests
E2. Oceanography The features and importance of the world’s oceans and issues associated with them. Outcomes: E5.1, E5.2, E5.3, E5.4, E5.5, E5.6, E5.7, E5.9, E5.10, E5.11 Geographical tools and ICT
* features of the world’s oceans * importance of the world’s oceans * ownership and control of oceans * one issue for oceans – fishing, including fieldwork
E3. Geography of Primary Production The patterns, functions and issues associated with primary production. Outcomes: E5.1, E5.2, E5.3, E5.4, E5.5, E5.7, E5.8, E5.9, E 5.10, E5.11 Geographical tools and ICT
Primary production * types * global patterns * multinationals One primary production at a local scale: aquaculture
E5. Australia’s Neighbours The environments of Australia’s neighbours and specific geographical issues within the Asia–Pacific Region. Outcomes: E5.1, E5.2, E5.3, E5.4, E5.5, E5.6, E5.8, E5.9, E5.10, E5.11 Geographical tools and ICT
* Asia-Pacific region: - major physical features - settlement - cultural diversity * One country: Japan: - physical - population - settlement - economy - international - future directions
Geography Years 7–10: Advice on Programming and Assessment
9
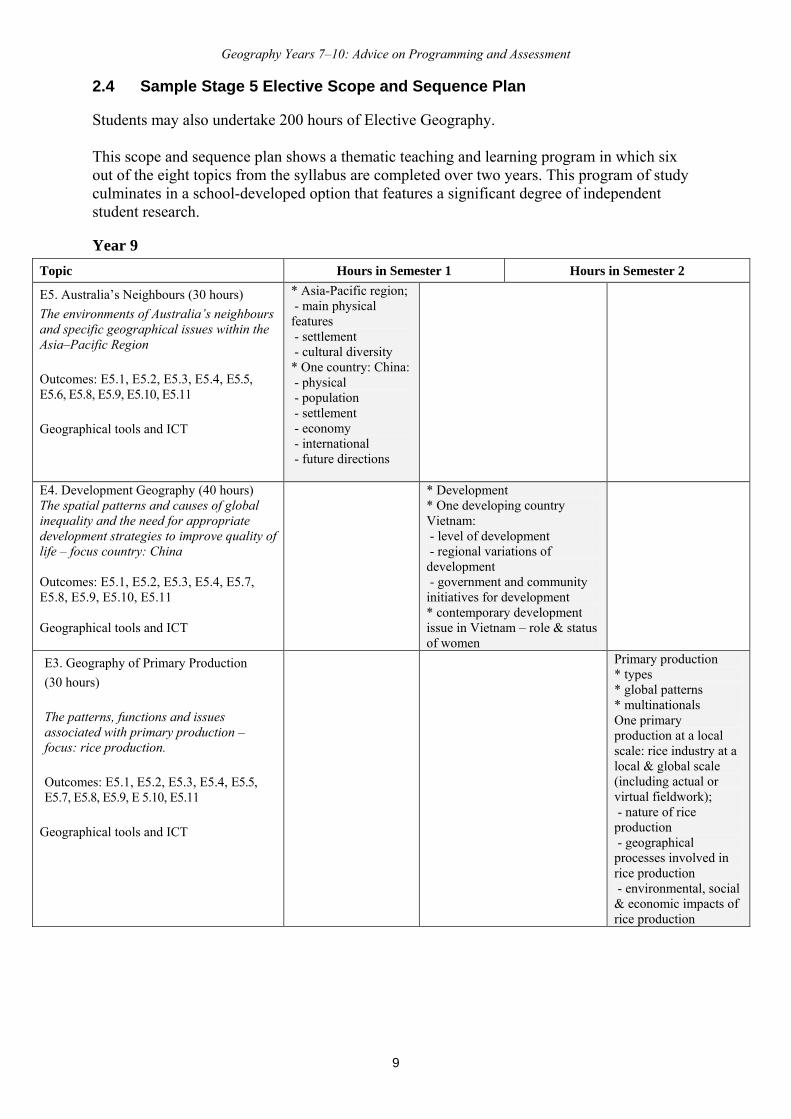
2.4 Sample Stage 5 Elective Scope and Sequence Plan Students may also undertake 200 hours of Elective Geography. This scope and sequence plan shows a thematic teaching and learning program in which six out of the eight topics from the syllabus are completed over two years. This program of study culminates in a school-developed option that features a significant degree of independent student research. Year 9
Topic Hours in Semester 1 Hours in Semester 2
E5. Australia’s Neighbours (30 hours) The environments of Australia’s neighbours and specific geographical issues within the Asia–Pacific Region Outcomes: E5.1, E5.2, E5.3, E5.4, E5.5, E5.6, E5.8, E5.9, E5.10, E5.11 Geographical tools and ICT
* Asia-Pacific region; - main physical features - settlement - cultural diversity * One country: China: - physical - population - settlement - economy - international - future directions
E4. Development Geography (40 hours) The spatial patterns and causes of global inequality and the need for appropriate development strategies to improve quality of life – focus country: China Outcomes: E5.1, E5.2, E5.3, E5.4, E5.7, E5.8, E5.9, E5.10, E5.11 Geographical tools and ICT
* Development * One developing country Vietnam: - level of development - regional variations of development - government and community initiatives for development * contemporary development issue in Vietnam – role & status of women
E3. Geography of Primary Production (30 hours) The patterns, functions and issues associated with primary production – focus: rice production. Outcomes: E5.1, E5.2, E5.3, E5.4, E5.5, E5.7, E5.8, E5.9, E 5.10, E5.11
Geographical tools and ICT
Primary production * types * global patterns * multinationals One primary production at a local scale: rice industry at a local & global scale (including actual or virtual fieldwork); - nature of rice production - geographical processes involved in rice production - environmental, social & economic impacts of rice production

Geography Years 7–10: Advice on Programming and Assessment
10
Year 10 Topic Hours in Semester 1 Hours in Semester 2 E7. Interactions and Patterns along a Continental Transect (30 hours) The factors responsible for causing variation in spatial patterns across a continent from one specific location to another Outcomes: E5.1, E5.2, E5.3, E5.4, E5.5, E5.6, E5.7, E5.8, E5.9, E5.10 Geographical tools and ICT
* Nile River from source in central Africa to mouth in Mediterranean Sea: - climate - topography - vegetation - fauna - land use - settlement - population - resource use - significant places - culture & religion * One geographical issue – access to the water from the Nile
E6. Political Geography (40 hours) The nature and distribution of political tensions and conflicts, and strategies towards effective resolutions – Focus: India-Pakistan Outcomes: E5.1, E5.2, E5.3, E5.4, E5.6, E5.7, E5.8, E5.9, E5.11 Geographical tools and ICT
* Nation-states – key features of India & Pakistan * Tension & conflict between India & Pakistan: - nature & causes of the conflict - location of conflict - groups involved in the conflict * Ways to resolve conflict: - communication, groups & governments - trade, sport, other links - conflict resolution and the future
E8. School-developed Option (30 hours) Ways in which the spatial and ecological dimensions interact and the role of informed and active citizenship in the interaction. Focus: student research project Outcomes: E5.1, E5.2, E5.3, E5.4, E5.5, E5.6, E5.7, E5.8, E5.9, E5.10, E5.11 Geographical tools and ICT
*Each student is to complete an individual or group research project and report about an aspect of Geography course. * Research and report to include: - spatial, ecological and civics & citizenship aspects of the study - a variety of sources of information - use of ICT for research and presentation of findings

Geography Years 7–10: Advice on Programming and Assessment
11
3 Advice on Assessment 3.1 Assessment for Learning The Board’s revised syllabuses advocate assessment for learning. Assessment that enhances learning recognises that learners use their current understanding to discover, develop and incorporate new knowledge, understanding and skills. Assessment for learning helps teachers and students to know if that current understanding is a suitable basis for future learning. Assessment occurs as an integral part of teaching and learning. Teacher instruction and assessment influence student learning and learning processes. This involves using assessment activities to clarify student understanding of concepts, and planning ways to remedy misconceptions and promote deeper understanding. Assessment for learning encourages self-assessment and peer assessment. Students can develop and use a range of strategies to actively monitor and evaluate their own learning and the learning strategies they use. The feedback that students receive from completing assessment activities will help teachers and students decide whether they are ready for the next phase of learning or whether they need further learning experiences to consolidate their knowledge, understanding and skills. Teachers should consider the effect that assessment and feedback have on student motivation and self-esteem, and the importance of the active involvement of students in their own learning. By integrating learning and assessment, the teacher can choose which aspects of a student’s performance to record. These records can be used to monitor the student’s progress, determine what to teach next and decide the level of detail to be covered. At key points, such as the end of the year, this information is also available for the teacher to use to form a judgement of the student’s performance against levels of achievement. This judgement can be used to inform parents, the next teacher and especially the student, of the student’s progress. Consequently, teachers using their professional judgement in a standards-referenced framework are able to extend the process of assessment for learning into the assessment of learning. Principles of assessment for learning Assessment for learning: AP1 emphasises the interactions between learning and manageable assessment strategies
that promote learning AP2 clearly expresses for the student and teacher the goals of the learning activity AP3 reflects a view of learning in which assessment helps students learn better, rather than
just achieve a better mark AP4 provides ways for students to use feedback from assessment AP5 helps students take responsibility for their own learning AP6 is inclusive of all learners. Details on how these principles translate in practice can be found on page 82 of the Geography Years 7–10 Syllabus. One activity in this document has been annotated to show how the principles of assessment for learning feature in that activity. It can be found on pages 12–13.

Geography Years 7–10: Advice on Programming and Assessment
12
3.2 Planning for Effective Learning and Assessment
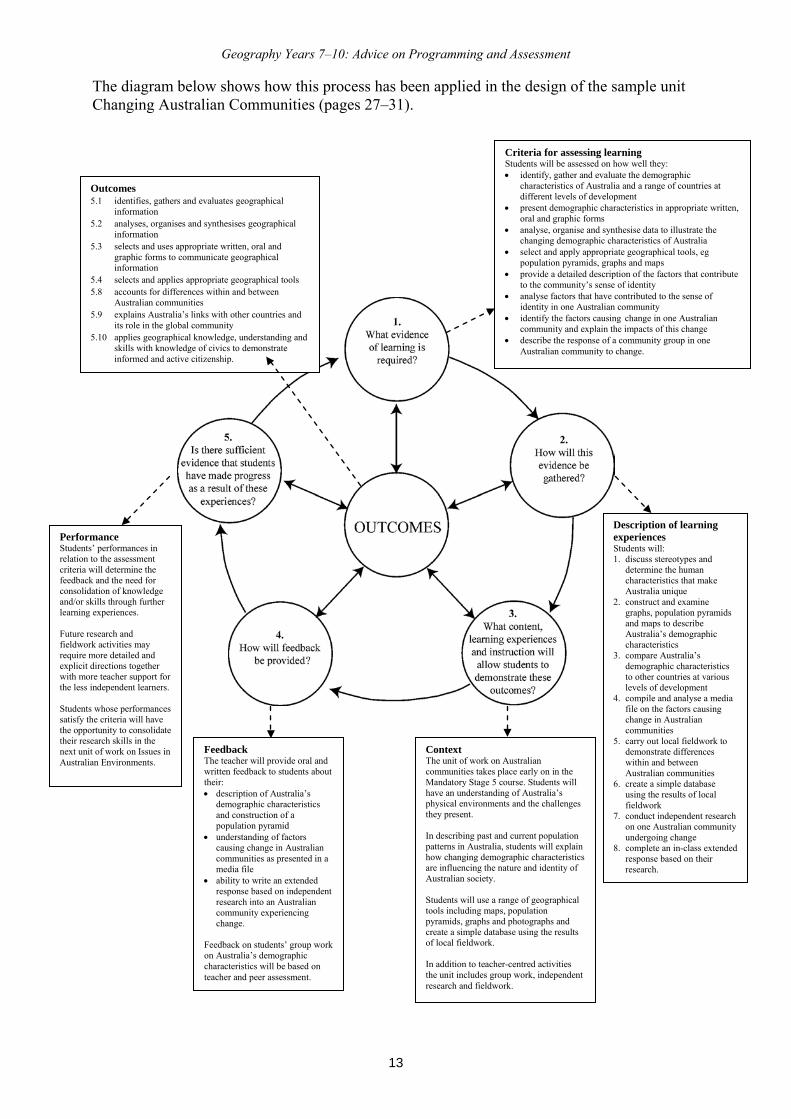
The diagram below summarises a model for integrating learning and assessment. It emphasises that outcomes are central to the decisions teachers make about the learning to be undertaken and the evidence of learning that needs to be collected. This evidence enables teachers to determine how well students are achieving in relation to the outcomes and to provide students with feedback on their learning. Evidence of learning assists teachers and students to decide if students are ready for the next phase of learning or if teachers need to adapt programs to provide further learning experiences to consolidate students’ knowledge, understanding and skills.
Geography Years 7–10: Advice on Programming and Assessment
13
The diagram below shows how this process has been applied in the design of the sample unit Changing Australian Communities (pages 27–31).
Criteria for assessing learning Students will be assessed on how well they: • identify, gather and evaluate the demographic
characteristics of Australia and a range of countries at different levels of development
• present demographic characteristics in appropriate written, oral and graphic forms
• analyse, organise and synthesise data to illustrate the changing demographic characteristics of Australia
• select and apply appropriate geographical tools, eg population pyramids, graphs and maps
• provide a detailed description of the factors that contribute to the community’s sense of identity
• analyse factors that have contributed to the sense of identity in one Australian community
• identify the factors causing change in one Australian community and explain the impacts of this change
• describe the response of a community group in one Australian community to change.
Performance Students’ performances in relation to the assessment criteria will determine the feedback and the need for consolidation of knowledge and/or skills through further learning experiences. Future research and fieldwork activities may require more detailed and explicit directions together with more teacher support for the less independent learners. Students whose performances satisfy the criteria will have the opportunity to consolidate their research skills in the next unit of work on Issues in Australian Environments.
Feedback The teacher will provide oral and written feedback to students about their: • description of Australia’s
demographic characteristics and construction of a population pyramid
• understanding of factors causing change in Australian communities as presented in a media file
• ability to write an extended response based on independent research into an Australian community experiencing change.
Feedback on students’ group work on Australia’s demographic characteristics will be based on teacher and peer assessment.
Context The unit of work on Australian communities takes place early on in the Mandatory Stage 5 course. Students will have an understanding of Australia’s physical environments and the challenges they present. In describing past and current population patterns in Australia, students will explain how changing demographic characteristics are influencing the nature and identity of Australian society. Students will use a range of geographical tools including maps, population pyramids, graphs and photographs and create a simple database using the results of local fieldwork. In addition to teacher-centred activities the unit includes group work, independent research and fieldwork.
Description of learning experiences Students will: 1. discuss stereotypes and
determine the human characteristics that make Australia unique
2. construct and examine graphs, population pyramids and maps to describe Australia’s demographic characteristics
3. compare Australia’s demographic characteristics to other countries at various levels of development
4. compile and analyse a media file on the factors causing change in Australian communities
5. carry out local fieldwork to demonstrate differences within and between Australian communities
6. create a simple database using the results of local fieldwork
7. conduct independent research on one Australian community undergoing change
8. complete an in-class extended response based on their research.
Outcomes 5.1 identifies, gathers and evaluates geographical
information 5.2 analyses, organises and synthesises geographical
information 5.3 selects and uses appropriate written, oral and
graphic forms to communicate geographical information
5.4 selects and applies appropriate geographical tools 5.8 accounts for differences within and between
Australian communities 5.9 explains Australia’s links with other countries and
its role in the global community 5.10 applies geographical knowledge, understanding and
skills with knowledge of civics to demonstrate informed and active citizenship.
Geography Years 7–10: Advice on Programming and Assessment
14
3.3 Designing Effective Learning and Assessment Designing effective learning experiences requires the selection of activities that develop students’ knowledge, understanding and skills and that allow evidence of learning to be gathered. Methods of gathering evidence could include informal teacher observation, questioning, peer evaluation and self-evaluation, as well as more structured assessment activities. Assessment should be an integral part of each unit of work and should support student learning. When designing assessment activities, teachers should consider whether the activity: • has explicitly stated purposes that address the outcomes • is integral to the teaching and learning program • shows a clear relationship between the outcomes and content being assessed • allows students to demonstrate the extent of their knowledge, understanding and skills • focuses on what was taught in class and what students were informed would be assessed • provides opportunities to gather information about what further teaching and learning is
required for students to succeed • provides valid and reliable evidence of student learning and is fair. 3.4 Annotated Assessment for Learning Activity The Assessment for Learning Principles provide the criteria for judging the quality of assessment materials and practices. The Stage 5 sample assessment activity, Demographic Research, has been annotated on pages 12–13 to show these principles.

Geography Years 7–10: Advice on Programming and Assessment
15
Sample assessment for learning activity: Demographic research Context This activity takes place early in the Stage 5 unit Changing Australian Communities (5A2). The activity builds on students’ skills in identifying, gathering and evaluating statistical data through the detailed examination of the ‘human characteristics that make Australia unique’ involving demographic comparisons between Australia and a selection of other countries. Outcomes A student: 5.1 identifies, gathers and evaluates geographical information 5.2 analyses, organises and synthesises geographical information 5.3 selects and uses appropriate written, oral and graphic forms to communicate geographical
information 5.7 analyses the impacts of different perspectives on geographical issues at local, national and
global scales. 1
2
Criteria for assessing learning (These criteria would normally be communicated to students with the activity.) Students will be assessed on their ability to: • identify, select and organise comparative demographic characteristics of Australia and a
range of countries at different levels of development • present the demographic characteristics in tabulated form • analyse data to illustrate the unique characteristics of Australia • communicate geographical information orally.
Description of activity Students collect demographic information from a variety of sources including the internet, complete a table of selected countries and global averages and analyse the research findings. • Students work in small groups to gather simple demographic characteristics for
Australia, other selected countries and global averages. Groups could be assigned to each of the topics (column headings) on the table.
• Groups research and complete their part of the table. • Teacher directs the collation of the information on an overhead transparency
projector and students complete their tables. • Students analyse the findings of the research. • Class discuss oral reports from the various groups, and address questions about how
this table illustrates the unique human characteristics of Australia. • Students submit their completed tables and analysis for marking. The activity will take approximately one hour.
Students are given clear instructions and support to facilitate their learning
Activity builds on previous learning AP2
The activity is appropriate for the outcomes being addressed AP1
Students are given clear instructions and support to facilitate their learning AP2
Activity has capacity to engage the learner AP3
The activity is inclusive in providing for different kinds of learners AP6
Geography Years 7–10: Advice on Programming and Assessment
16
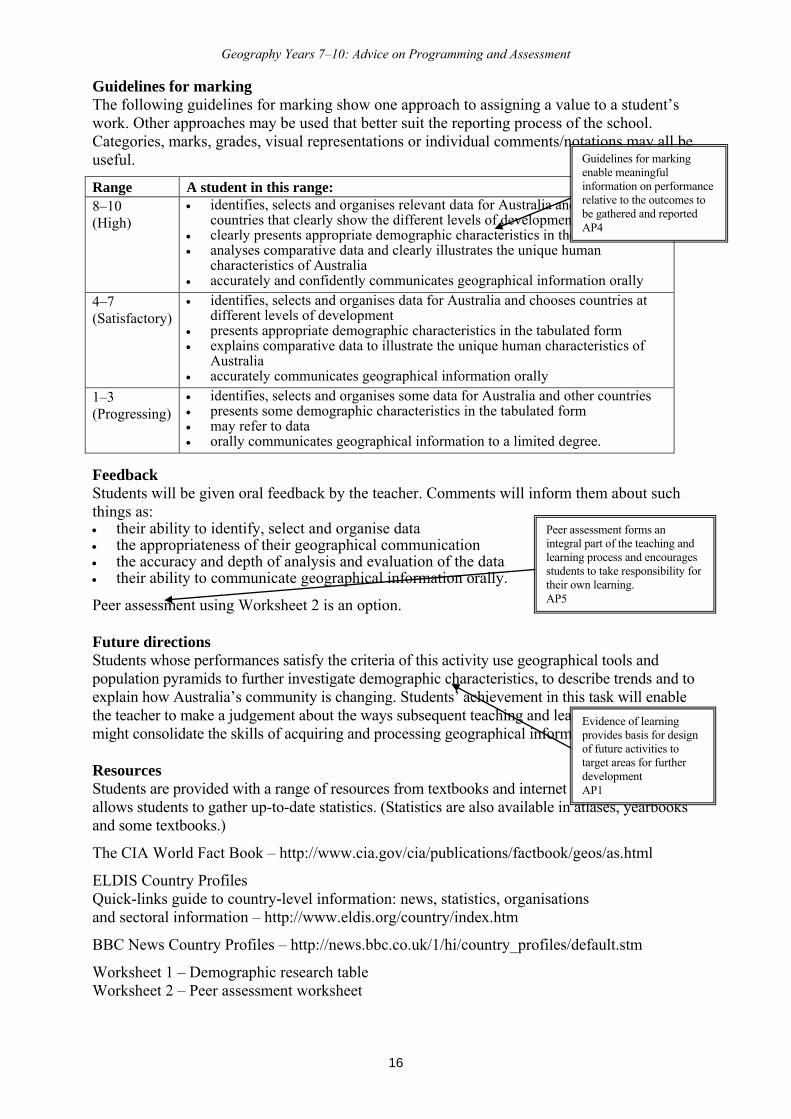
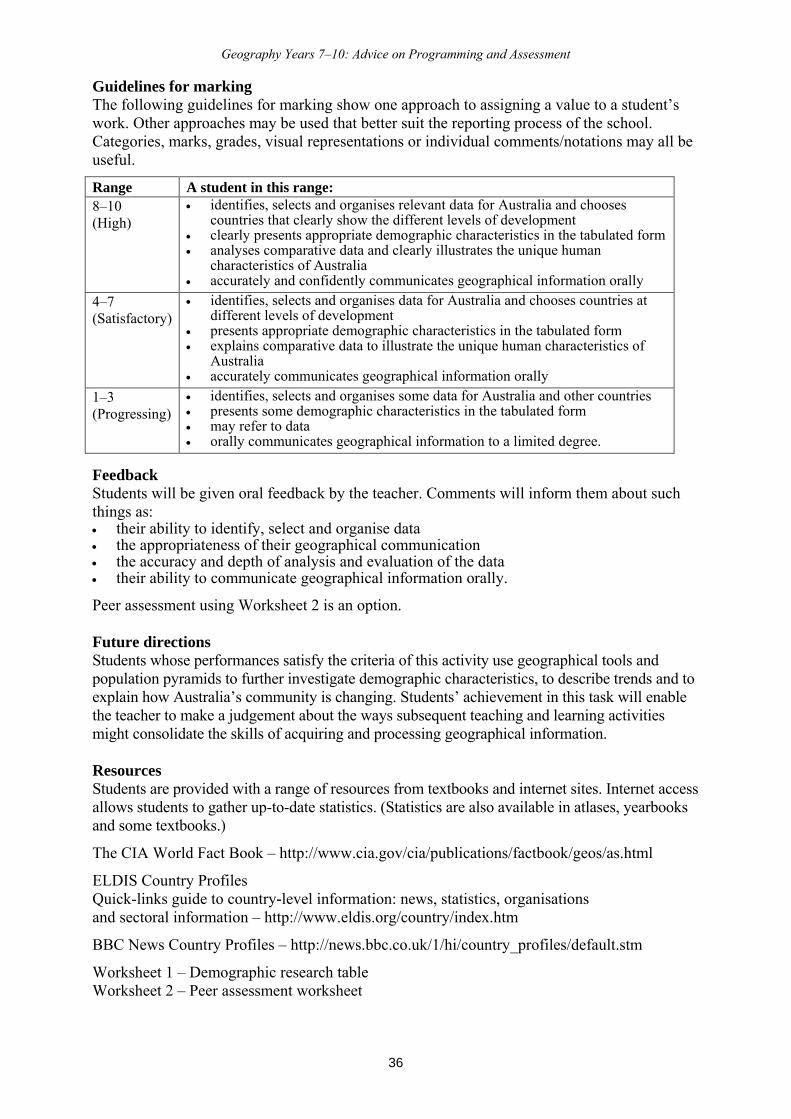
Guidelines for marking The following guidelines for marking show one approach to assigning a value to a student’s work. Other approaches may be used that better suit the reporting process of the school. Categories, marks, grades, visual representations or individual comments/notations may all be useful.
Range A student in this range: 8–10 (High)
• identifies, selects and organises relevant data for Australia and chooses countries that clearly show the different levels of development
• clearly presents appropriate demographic characteristics in the tabulated form • analyses comparative data and clearly illustrates the unique human
characteristics of Australia • accurately and confidently communicates geographical information orally
4–7 (Satisfactory)
• identifies, selects and organises data for Australia and chooses countries at different levels of development
• presents appropriate demographic characteristics in the tabulated form • explains comparative data to illustrate the unique human characteristics of
Australia • accurately communicates geographical information orally
1–3 (Progressing)
• identifies, selects and organises some data for Australia and other countries • presents some demographic characteristics in the tabulated form • may refer to data • orally communicates geographical information to a limited degree.
Feedback Students will be given oral feedback by the teacher. Comments will inform them about such things as: • their ability to identify, select and organise data • the appropriateness of their geographical communication • the accuracy and depth of analysis and evaluation of the data • their ability to communicate geographical information orally. Peer assessment using Worksheet 2 is an option. Future directions Students whose performances satisfy the criteria of this activity use geographical tools and population pyramids to further investigate demographic characteristics, to describe trends and to explain how Australia’s community is changing. Students’ achievement in this task will enable the teacher to make a judgement about the ways subsequent teaching and learning activities might consolidate the skills of acquiring and processing geographical information. Resources Students are provided with a range of resources from textbooks and internet sites. Internet access allows students to gather up-to-date statistics. (Statistics are also available in atlases, yearbooks and some textbooks.) The CIA World Fact Book – http://www.cia.gov/cia/publications/factbook/geos/as.html ELDIS Country Profiles Quick-links guide to country-level information: news, statistics, organisations and sectoral information – http://www.eldis.org/country/index.htm BBC News Country Profiles – http://news.bbc.co.uk/1/hi/country_profiles/default.stm Worksheet 1 – Demographic research table Worksheet 2 – Peer assessment worksheet
Guidelines for marking enable meaningful information on performance relative to the outcomes to be gathered and reported AP4
Peer assessment forms an integral part of the teaching and learning process and encourages students to take responsibility for their own learning. AP5
Evidence of learning provides basis for design of future activities to target areas for further development AP1
Geography Years 7–10: Advice on Programming and Assessment
17
3.5 Sharing Learning and Assessment Intentions Students must be aware of what they need to do to demonstrate evidence of learning. This information could be conveyed informally or formally by the teacher, as appropriate for the learning activity. Students should be informed of the criteria that will be used to assess their learning. They should be clear about the meaning of the language used, and the subject-specific terminology. They also need to be clear about any sources or stimulus material that are appropriate to the activity. It may be helpful to give students models of good responses and templates, or procedures to help them demonstrate the extent of their knowledge, understanding and skills. 3.6 Effective Feedback to Students The aim of feedback is to communicate to students how well their knowledge, understanding and skills are developing in relation to the outcomes. Feedback enables students to recognise their strengths and areas for development, and to plan with their teacher the next steps in their learning. They are then given opportunities to improve and further develop their knowledge, understanding and skills. Teacher feedback about student work is essential for students and is integral to the teaching and learning process. Student self-reflection and peer evaluation can also provide valuable feedback to students. Students should be provided with regular opportunities to reflect on their learning. Feedback should: • focus on the activity and what was expected • be constructive, providing meaningful information to students about their learning • correct misunderstandings • identify and reinforce students’ strengths and state clearly how students can improve. Forms of feedback include: • oral discussion with class, groups or individual students • written annotations • general comments to the class about those aspects of the activity in which students
excelled and those aspects that still need addressing • examples of good responses • peer evaluation and self-evaluation. 3.7 Recording Evidence for Assessment Recording student performance needs to be manageable. Teachers should make decisions about which aspects of student performance on an activity should be recorded, and in what format. The teacher can use this information to ascertain students’ progress, what needs to be taught next and to what level of detail, and to form a judgement of student achievement at key points. Record-keeping should reflect the reporting processes of the school and may take the form of individual comments or notations, marks, grades or visual representations for the activities.

Geography Years 7–10: Advice on Programming and Assessment
18
A scale such as the one below may be a useful way to summarise the extent of students’ learning. This example shows how individual students performed on the same assessment activity. Student Activity – Demographic Research
A xB x C x D x E x F x
Progressing Satisfactory High
This method can be adapted to capture evidence of an individual student’s strengths and weaknesses on various elements of one activity, or the performance of a particular student, class, group or cohort of students, across a range of assessment activities.

Geography Years 7–10: Advice on Programming and Assessment
19
4 Programming Units of Work The sample units of work have been developed using the following process: 1 identify the outcomes that will be addressed in the unit 2 decide on the focus of the unit of work 3 decide on the evidence of learning that will be required, how students will demonstrate
learning in relation to the outcomes and how this evidence will be gathered and recorded 4 select the relevant syllabus content for the identified outcomes relating to the knowledge,
understanding and skills that students will develop 5 plan the learning experiences and instruction, and identify the assessment for learning
strategies that will provide the evidence of learning, checking that: • a range of assessment strategies is used • meaningful feedback in a variety of forms can be given to students • opportunities are provided to reflect on student progress and modify future learning
experiences accordingly.

Geography Years 7–10: Advice on Programming and Assessment
20
5 Sample Units of Work The sample units of work that follow are designed to assist teachers in planning for the implementation of the Geography Years 7–10 Syllabus. The units provide programming ideas for selected syllabus content. Sample units show ways in which teachers can meet the needs, interests and abilities of their students, while assessing their progress towards a demonstration of outcomes. The sample units also illustrate ways in which assessment activities may be integrated into the teaching and learning sequence. They will assist teachers to understand the importance of: • being explicit about the outcomes and content they are addressing • being explicit about the evidence required to demonstrate student learning • providing meaningful feedback to students • adapting teaching and learning programs to students’ demonstrated needs • having a sound basis for modifying future teaching and learning programs (in light of
students’ demonstrated needs). The sample units provide opportunities for students to engage in questioning and dialogue, self-assessment, peer assessment and reflections. Through these activities students can become clear about their own learning, understanding and needs. Note that the assessment activities are described here in some detail to illustrate the process of assessment for learning. Teachers would not provide this level of detail in day-to-day classroom situations.

Geography Years 7–10: Advice on Programming and Assessment
21
5.1 Stage 4 Mandatory Sample Unit of Work: Global Change (4G3) Focus: the changing nature of the world and responses to these changes.
Time allocation for unit: 8 hours Targeted outcomes A student: 4.1 identifies and gathers geographical information 4.2 organises and interprets geographical information 4.3 uses a range of written, oral and graphic forms to communicate geographical
information 4.4 uses a range of geographical tools 4.5 demonstrates a sense of place about global environments 4.7 identifies and discusses geographical issues from a range of perspectives 4.10 explains how geographical knowledge, understanding and skills combine with
knowledge of civics to contribute to informed citizenship.
Resources Atlas, blank world map outline, worksheets 1 to 3 Top 100 economic entities table: http://www.corporations.org/systems/top100.html
Students learn about:
Students learn to: Integrated teaching, learning and assessment Evidence of learning/feedback
• globalisation − the
globalisation process
− changes in technology
• outline the process of globalisation
• recognise the
role of technology in changing global relationships in business
Literacy activity on the concept of globalisation: Read and interpret short articles defining the concept. Focus question: How has technology changed? Students create a mind map of technological change in their lives, eg changes in the areas of medicine, transport, communications, business, fashion, food etc.
Class discussion results in students creating a relevant definition of globalisation. Students correctly identify examples of technological change in their own home/life and present their thoughts in the form of a mind map.

Geography Years 7–10: Advice on Programming and Assessment
22
Students learn about:
Students learn to: Integrated teaching, learning and assessment Evidence of learning/feedback
− impacts of
globalistaion
• identify examples
of economic and cultural integration that are shaping the world today as part of globalisation
Students identify positive and negative perspectives of technological change and create a simple table of different perspectives. Classroom discussion on the concept of technological change. Teacher issues students with a task requiring them to interview a senior member of the community about technological change. Elements of the task include: 1 Instruction is given on survey methodology
(Worksheet 1). 2 Students collectively design a survey for the
class to use (Worksheet 2). 3 Students individually administer standardised
survey to members of their community. 4 Communicating the survey results activity:
Students individually graph, interpret and communicate collective data from the class survey (Worksheet 3).
Focus question: What is economic integration? Teacher issues students with a research worksheet to identify and record details about the country of production, location of the corporate HQ for at least 10 products.
Students are able to construct a table contrasting positive and negative perspectives of technological change. Students’ contributions to class discussion demonstrate their understanding of the concept of technological change. Feedback: Teacher collates student responses on OHP in table format. Students are able to compile a satisfactory survey for the class to use. Students are able to complete the interview and gather data on the survey sheet. Students demonstrate ability to discern patterns in raw data through the construction of a range of graphical and statistical representations, eg histogram, pie-graph. Feedback: Teacher gives written and oral feedback following class discussion. Outlines the requirements of good surveys and graphs. Students can identify and recognise global companies and products, therefore reflecting economic integration. Class discussion.

Geography Years 7–10: Advice on Programming and Assessment
23
Students learn about:
Students learn to: Integrated teaching, learning and assessment Evidence of learning/feedback
Focus question: What does this tell us about our world? Students work in groups to compile a collage of global products and brands. Teacher issues students with stimulus material from ‘SMH – Top 100 World Economic Entities’. Students identify the top 20 global companies on the table and create their own table ranking them and presenting information on country of origin and industry or product type. Focus question: What is cultural integration? Class brainstorm the meaning and dimensions of culture. Focus question: Is there a global culture? Group discussion considering various cultural features: sport, music, food, language, religion, toys/games, the media, fashion. Groups provide an example of each and an associated personality. Sample study: The Barbie doll – an example of economic and cultural integration. Mapping Economic and Cultural Integration activity: Teacher issues students with worksheet on changing patterns of Mattel’s manufacturing plants.
Collages displayed in classroom. Feedback: Oral feedback from teacher on strengths and weaknesses of collages and the ability of students to rank and locate countries of origin of global products. Students demonstrate their ability to analyse and extract information from the news article ‘Top 100 World Economic Entities’ by compiling a table of top 20 global corporations. Class discussion and self-assessment of students’ tables. Students demonstrate awareness of cultural differences and similarities through their contribution to class brainstorm. Groups report findings of discussion to class. Students are able to deduce that cultures are interlinked and that a global culture is evident in various cultural features. Feedback: Peer assessment and discussion. Oral feedback by teacher commenting on the student’s understanding of cultural integration. Students are able to create a world map showing changes, over time, in the location of manufacturing sites for Mattel products.

Geography Years 7–10: Advice on Programming and Assessment
24
Students learn about:
Students learn to: Integrated teaching, learning and assessment Evidence of learning/feedback
• changing global
relationships
• describe
changing global relationships as a result of globalisation
Students plot locations of Mattel factories on a world outline map to show the changes in the location of Barbie manufacture. Students explore reasons for changes in location using a comprehension worksheet and passage on changes in marketing and manufacture of Barbie. Focus question: What is a ‘global business’? Extension activity: Internet research: What is Barbie up to now? (Note: This activity could be adapted for use with Coke, Nike, Sony etc) Global Forum activity: Students role-play to examine the issues associated with whaling and how they have changed over time. Characters: Norwegian commercial whaler, Japanese whaler, indigenous person, Tokyo restaurateur, Australian school student, whale-watching tour operator, environmentalist, scientist, commercial fisher, UN representative
Feedback: Teacher checks and annotates student worksheets using identified criteria. Teacher comments on the students’ understanding of the spatial changes in the manufacture of Mattel products over time and the causes of these changes. Feedback will also be given on their use of mapping conventions. Students are able to suggest reasons for changes in the location of Mattel factories. Students are able to communicate reasons for changing manufacturing locations over time. Feedback: Teacher annotates student’s maps according to the identified criteria. Students demonstrate an understanding of changing global relationships through informed and active participation in the global forum. Feedback: Teacher provides oral feedback on participation and the arguments presented by the participants.
Geography Years 7–10: Advice on Programming and Assessment
25
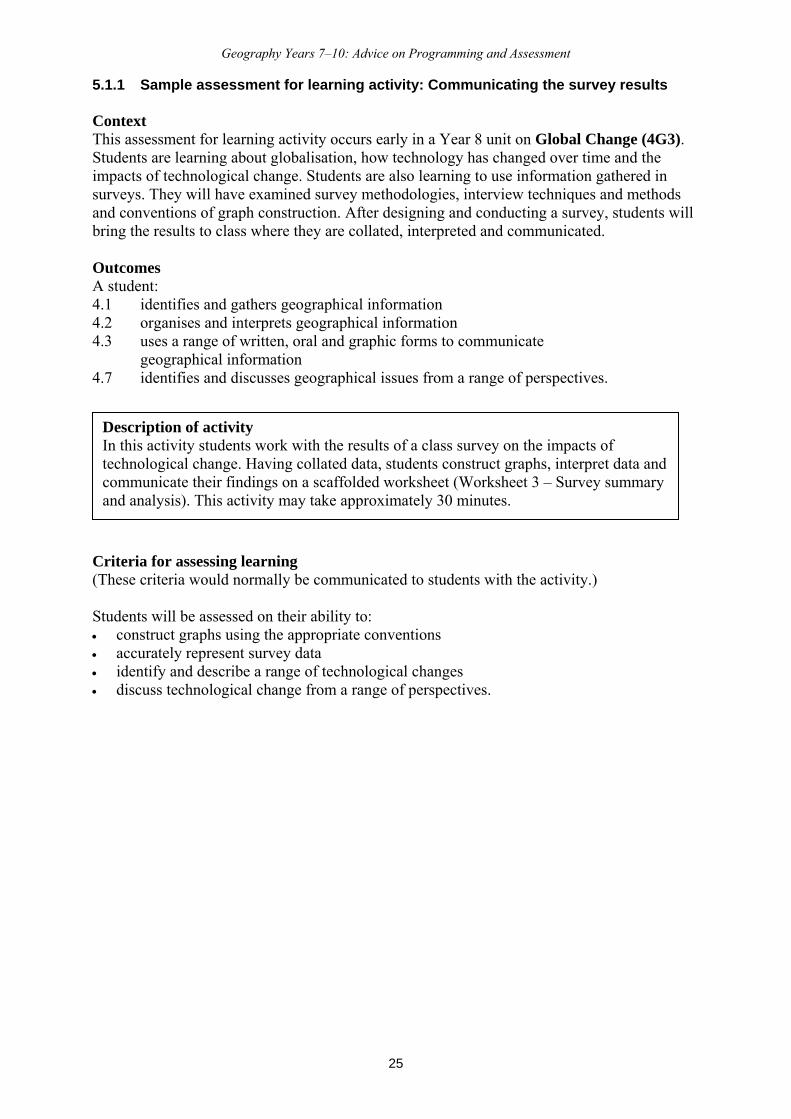
5.1.1 Sample assessment for learning activity: Communicating the survey results Context This assessment for learning activity occurs early in a Year 8 unit on Global Change (4G3). Students are learning about globalisation, how technology has changed over time and the impacts of technological change. Students are also learning to use information gathered in surveys. They will have examined survey methodologies, interview techniques and methods and conventions of graph construction. After designing and conducting a survey, students will bring the results to class where they are collated, interpreted and communicated. Outcomes A student: 4.1 identifies and gathers geographical information 4.2 organises and interprets geographical information 4.3 uses a range of written, oral and graphic forms to communicate geographical information 4.7 identifies and discusses geographical issues from a range of perspectives. Criteria for assessing learning (These criteria would normally be communicated to students with the activity.) Students will be assessed on their ability to: • construct graphs using the appropriate conventions • accurately represent survey data • identify and describe a range of technological changes • discuss technological change from a range of perspectives.
Description of activity In this activity students work with the results of a class survey on the impacts of technological change. Having collated data, students construct graphs, interpret data and communicate their findings on a scaffolded worksheet (Worksheet 3 – Survey summary and analysis). This activity may take approximately 30 minutes.

Geography Years 7–10: Advice on Programming and Assessment
26
Guidelines for marking The following guidelines for marking show one approach to assigning a value to a student’s work. Other approaches may be used that better suit the reporting process of the school. Categories, marks, grades, visual representations or individual comments/notations may all be useful. Range A student in this range: High • applies appropriate graphing conventions such as the use of a
title, labelling, an accurate scale and units of measurement • constructs graphs that accurately reflect the survey data • identifies and describes a range of issues related to
technological change identified from the data • discusses technological change from a range of perspectives
Satisfactory • applies some of the appropriate graphing conventions such as the use of a title, labelling, an accurate scale and units of measurement
• constructs graphs that accurately reflect the survey data • identifies and describes a limited range of issues related to
technological change identified from the data • discusses technological change from a narrow perspective
Progressing • few appropriate graphing conventions such as a title, labelling, an accurate scale or units of measurement
• constructs graphs that may not accurately reflect the survey data • possibly identifies and describes only one issue related to
technological change from the data • discusses technological change from only one perspective.
Feedback Students receive written feedback indicating their level of achievement in relation to the assessment for learning criteria and in relation to the class. Comments will inform students on: • using appropriate graphing conventions • constructing graphs that accurately reflect the survey data • identifying and describing issues relating to technological change • recognising the range of perspectives survey respondents hold in relation to technological
change. Future directions Teacher assess students’ readiness for the next stage of learning based on their performance in this activity. Students experiencing difficulty in satisfactorily completing the graphing activity would need additional teacher support in future activities of a similar nature. It may also be appropriate to program lessons reviewing and reinforcing graph conventions and the need for accuracy in manipulating survey data. Having discovered how people in their community perceive technological change students are better able to understand that technological change is integral to the concept of economic integration and globalistaion, which is covered later in the unit. Resources Survey data Worksheet 1 – Conducting a survey Worksheet 2 – Sample survey Worksheet 3 – Survey summary and analysis

Geography Years 7–10: Advice on Programming and Assessment
27
WORKSHEET 1 Conducting a survey One of the easiest ways of finding out information about people or places is to survey or interview individuals. Geographers find a lot of their information from surveys. A survey is a series of questions related to a specific topic. It is usually in the form of a written questionnaire. The advantage of using a survey as a geographical tool is that you can find out exactly what you need to know by asking individuals a series of questions. Surveys should be reasonably short and the questions should be clear and easy to understand. People do not want to spend too long answering questions. One method used to limit the amount of time a survey may take to complete is to categorise responses as shown in [the following SAMPLE SURVEY]. This means options for answers are given and one response is circled or ticked. Surveys that have categorised responses are able to show results quickly. The benefit of using the categorised system is that the person asking the questions (the interviewer) does not have to write down everything the interviewee (the person answering the question) says. The results can then be tallied quickly because they are quick, concise responses. Extract from Geography for Global Citizens, Parker et al., 1999, p 330, reproduced by permission Macmillan Education Australia.

Geography Years 7–10: Advice on Programming and Assessment
28
WORKSHEET 2
SAMPLE SURVEY 1 Age of respondent: 26–35 years 46–55 years 36–45 years 56+ years 2 Gender of respondent: Male Female 3 Rank the following in terms of greatest change in your lifetime: (1 = most) (5 = least) transport communications (internet, TV etc) agriculture manufacturing medicine/health other Please name: ___________________ 4 (a) Which of the above has improved your quality of life?
____________________________________________________________________
(b) In what way?
____________________________________________________________________
____________________________________________________________________
5 Where do you expect change to be greatest in the future?
_____________________________________________________________________
_____________________________________________________________________
_____________________________________________________________________
_____________________________________________________________________

Geography Years 7–10: Advice on Programming and Assessment
29
WORKSHEET 3
SURVEY SUMMARY AND ANALYSIS Draw two graphs representing your survey results using the outlines below. (a)
(b)
(c) What did you learn about technological change?
_____________________________________________________________________
_____________________________________________________________________
_____________________________________________________________________
_____________________________________________________________________
_____________________________________________________________________
_____________________________________________________________________
_____________________________________________________________________
_____________________________________________________________________
_____________________________________________________________________
_____________________________________________________________________
_____________________________________________________________________

Geography Years 7–10: Advice on Programming and Assessment
30
5.2 Stage 5 Mandatory Sample Unit of Work: Changing Australian Communities (5A2) Focus: ways in which communities in Australia are responding to change.
Time allocation for unit: 25 hours
Targeted outcomes A student: 5.1 identifies, gathers and evaluates geographical information 5.2 analyses, organises and synthesises geographical information 5.3 selects and uses appropriate written, oral and graphic forms to communicate geographical
information 5.4 selects and applies appropriate geographical tools 5.8 accounts for differences within and between Australian communities 5.9 explains Australia’s links with other countries and its role in the global community 5.10 applies geographical knowledge, understanding and skills with knowledge of civics to
demonstrate informed and active citizenship.
Resources Existing textbooks CD of the song ‘We Are One’ Geographic Information Systems: http://www.uprct.nsw.gov.au SBS World Guide: http://www.theworldnews.com.au/Worldguide/index.php3 Australian Bureau of Statistics data: http://www.abs.gov.au and other internet sources US Census Bureau International Data Base: http://www.census.gov/ipc/www/idbpyr.html
Students learn about: Students learn to: Integrated teaching, learning and assessment Evidence of learning/feedback • human
characteristics that make Australia unique: Aboriginal heritage, multicultural society, rural culture, urban/coastal lifestyle
• describe trends in Australia’s demographic characteristics
Teacher begins topic by examining stereotypical Australians – Crocodile Dundee, Norm, Crocodile Hunter, Kath and Kim. Class brainstorm: Who is a typical Australian? Students are asked to bring in something ‘Australian’ for next lesson. Students work in groups at breaking down stereotypes – photo interpretation of a variety of communities – create a collage of ‘Australian’ faces. Groups report on their selection of images. Students listen to ‘We Are One’ CD – brainstorm Australia’s human characteristics.
Students demonstrate understanding of stereotypes through their involvement in the discussion and note-taking. Feedback: Teacher collates student responses on board in mind-map format. Oral feedback to individual students as they respond on their understanding of trends in Australia’s demographic characteristics. Display of group collages on walls of room. Teacher provides oral feedback to groups following each report on their ability to portray in their collage the variety of human characteristics that make Australia unique.

Geography Years 7–10: Advice on Programming and Assessment
31
Students learn about: Students learn to: Integrated teaching, learning and assessment Evidence of learning/feedback • Australia’s
demographic characteristics: − population size − distribution − growth rates − age structure − ethnic
composition • types of
communities including Indigenous communities
• describe trends in Australia’s demographic characteristics using graphs and statistics
• identify a range
of Australian communities based on shared space and/or social organisation
General introduction on changing demographic characteristics – define terms. Demographic Characteristics activity: Is the human face of Australia unique? In-class construction of a table showing demographic characteristics of Australia over time, and compared to a range of other countries (see Worksheet 1). Population Pyramid activity: Students construct a population pyramid using up-to-date statistics. Teacher supplies worksheet with grid on which students plot their graph. Further activities: • Australian population timeline • transect from CBD to outback • flow maps – immigration and internal migration. Students will examine and map the distribution of Australia’s population using various strategies: • night-time satellite image • choropleth map v dot maps • climate and population distribution • land use and population distribution • GIS as explained on the Upper Parramatta River
Catchment Trust website: www.uprct.nsw.gov.au
Students demonstrate their understanding of the trends in Australia’s demographic characteristics through the completion of the table and a written comment on what the table shows. Feedback: Teacher provides oral comments and/or peer assessment (see Worksheet 2). Comments inform students on their ability to identify, organise and analyse data and how well they communicate geographically. Students provide evidence of their understanding of Australia’s demographic characteristics through the completion of the pyramid and a comment on what the pyramid shows. Feedback: Teacher provides both oral and written feedback on student work samples. Comments inform students on how well they can draw a population pyramid and describe Australia’s demographic characteristics. Students demonstrate ability to describe a range of Australian communities through the completion of the activities and brief written notes on what the geographical tools show. Students will show that they are able to describe the distribution of Australia’s population through the construction of maps, note-taking and structured analysis. Feedback: Teacher provides oral feedback to students and reviews the students’ notes.

Geography Years 7–10: Advice on Programming and Assessment
32
Students learn about: Students learn to: Integrated teaching, learning and assessment Evidence of learning/feedback • overview of factors
causing change in Australian communities: − new
technologies − globalisation of
economic activity
− demographic change
− lifestyle expectations
− intercultural exchange
− changing nature and pattern of work
− recognition of Native Title
− resource depletion
− natural disasters
• describe the factors causing change in Australian communities
• account for
differences within and between Australian communities
Teacher introduces the concept of change by focusing on a local issue – using satellite images, aerial photos and topographic maps. Class discussion and brainstorm on the factors causing change. Students compile an annotated media file of newspaper articles on factors causing change in Australian communities, some of which are provided by the teacher, others collected and circulated by the class. Students will construct a pie diagram of ethnic composition based on data from atlas or ABS. Define ‘ethnic’. • Graph generations of students, parents,
grandparents. • Plot places of origin on world map. • Construct divided bar and column graphs of
ethnic composition. Fieldwork: Plotting along a transect the types of businesses owned by NESB families. Students create a simple database to collate findings as follow-up to fieldwork. Teacher provides class with data from a similar study from a transect in a regional community. Students create a simple word-processed report comparing data from fieldwork with teacher-supplied data.
Students demonstrate understanding of the factors causing change in Australian communities through their involvement in the discussion and note-taking. Feedback: Teacher collates student responses on OHP in mind-map format. Oral feedback to individual students as they respond. Students display an understanding of the factors causing change through the depth and diversity of their media file and the accuracy of their annotations. Feedback: Teacher collects and annotates students’ media files. Teacher annotations advise students on their ability to identify factors causing change in Australian communities within media articles. Students show their understanding of the differences within and between Australian communities by organising and synthesising geographical information in the form of various maps, graphs and diagrams. Students participate in fieldwork activity and collect appropriate data. Students demonstrate their ability to design, create and manipulate data in word-processed report. Feedback: Teacher provides oral feedback to students and reviews the students’ reports. Comments inform students with regard to their ability to create a simple word-processed report, incorporate fieldwork data and compare the two sets of data.

Geography Years 7–10: Advice on Programming and Assessment
33
Students learn about: Students learn to: Integrated teaching, learning and assessment Evidence of learning/feedback • Australian
communities responding to change: At least one case study to illustrate the impacts of change, including: − factors that
contribute to the community’s sense of identity
− factors causing change
− the individuals, groups and levels of gover-nment involved in the process of change
− community responses to change
• define the
community in terms of its shared space and/or social organisation
• describe the factors causing change
• analyse the actions of individuals, groups and different levels of government in responding to change
• explain the impacts of change on the community
Extension: Teacher reintroduces population pyramids comparing Australia to other countries. ICT lesson – internet research using the US Census Bureau International Data Base: www.census.gov/ipc/www/idbpyr.html This activity allows forward projections and stimulates discussion of implications. Teacher introduces class discussion on what contributes to a sense of community. Students draw a diagram from the discussion to illustrate the range of factors. Students are asked to create a diagram to illustrate the different communities they belong to and to note how it has changed over a five-year period. Students identify different communities by completing a matching exercise eg: Titles: Community Land use Broken Hill mining Students create a map of the various types of communities from the table, with emphasis on various mapping tools. Teacher provides the class with a variety of stimulus material on a case study of an Australian community responding to change. Teacher provides worksheets to guide the students in their analysis of the actions of: • individuals • groups • different levels of government in responding to
change.
Feedback: Teacher provides oral feedback to students within class discussion activity on their understanding of the concept of community, and reviews the students’ notes. Students demonstrate an understanding of the concept of community through their diagram and the identification of factors causing change. Students correctly match the various types of communities and are able to map them demonstrating competency in the use of various targeted mapping tools. Feedback: Teacher provides oral feedback to students during the tasks and reviews the students’ notes on completion. Students get feedback on their mapping skills as well as their understanding of the various types of communities found in Australia. Students are able to analyse a range of stimulus material and outline the actions of individuals, groups and different levels of government in responding to change by completing the worksheets. Feedback: Teacher provides oral feedback to students, annotates and reviews the completed student worksheets, providing students with advice on their ability to work with a range of stimulus material.

Geography Years 7–10: Advice on Programming and Assessment
34
Students learn about: Students learn to: Integrated teaching, learning and assessment Evidence of learning/feedback
• identify a community group and describe how it responds to change.
Researching a community activity: students undertake an independent research activity in preparation for an in-class extended response. The activity will include: • a description of the character of the community • an identification and analysis of factors
contributing to the sense of community • an explanation of how this community has
changed over time. Teacher issues a research worksheet for the task and assessment criteria to the class. Students complete an in-class extended response based on their research. Extension: Students deliver class presentations on the community studies they have researched.
Feedback: Teacher provides students with oral feedback during the research process. Students demonstrate satisfactory completion of research and extended response tasks. Feedback: Teacher assesses and annotates extended responses. This provides each student with an assessment mark based on the quality of their: • description of the character of the community • identification and analysis of factors contributing to the
sense of community • explanation of how the community has changed over time. Oral presentations reveal the students’ knowledge and understanding of the character of the selected community, the factors contributing to the sense of community and how the community has changed over time. Feedback: Teacher provides students with oral feedback on class presentation; peer/self-assessment is also possible at this point.
Geography Years 7–10: Advice on Programming and Assessment
35
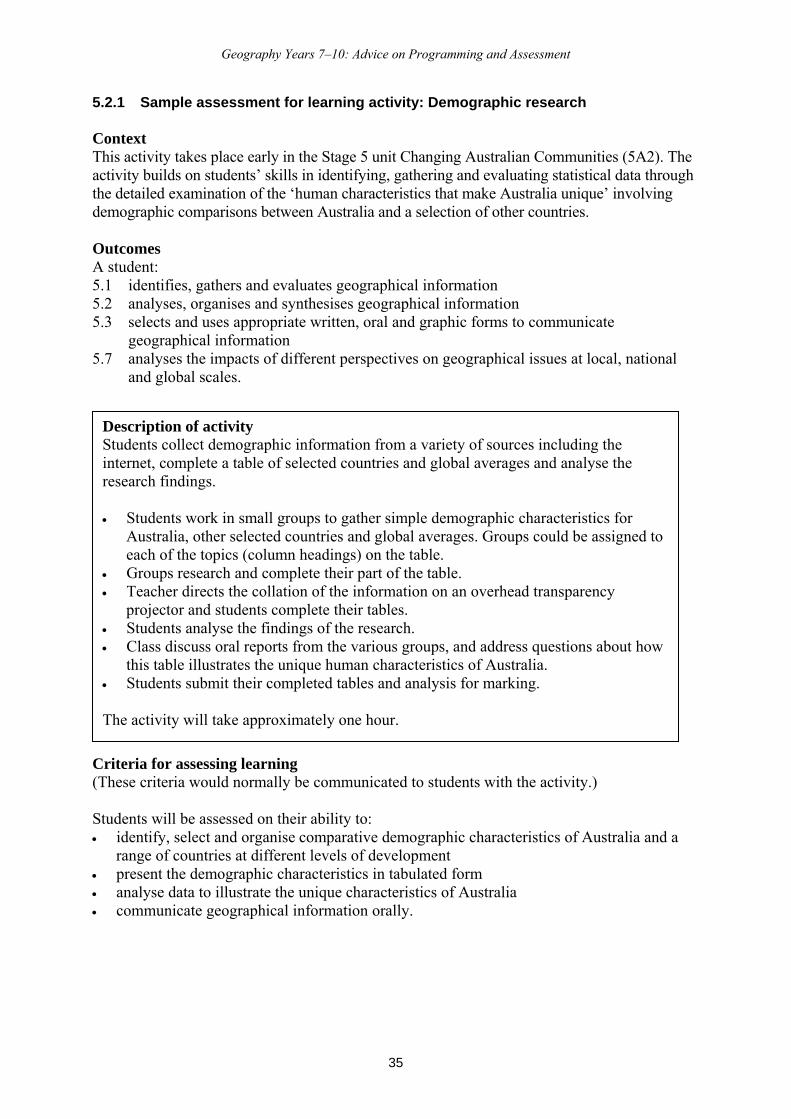
5.2.1 Sample assessment for learning activity: Demographic research Context This activity takes place early in the Stage 5 unit Changing Australian Communities (5A2). The activity builds on students’ skills in identifying, gathering and evaluating statistical data through the detailed examination of the ‘human characteristics that make Australia unique’ involving demographic comparisons between Australia and a selection of other countries. Outcomes A student: 5.1 identifies, gathers and evaluates geographical information 5.2 analyses, organises and synthesises geographical information 5.3 selects and uses appropriate written, oral and graphic forms to communicate
geographical information 5.7 analyses the impacts of different perspectives on geographical issues at local, national
and global scales. 3
4
Criteria for assessing learning (These criteria would normally be communicated to students with the activity.) Students will be assessed on their ability to: • identify, select and organise comparative demographic characteristics of Australia and a
range of countries at different levels of development • present the demographic characteristics in tabulated form • analyse data to illustrate the unique characteristics of Australia • communicate geographical information orally.
Description of activity Students collect demographic information from a variety of sources including the internet, complete a table of selected countries and global averages and analyse the research findings. • Students work in small groups to gather simple demographic characteristics for
Australia, other selected countries and global averages. Groups could be assigned to each of the topics (column headings) on the table.
• Groups research and complete their part of the table. • Teacher directs the collation of the information on an overhead transparency
projector and students complete their tables. • Students analyse the findings of the research. • Class discuss oral reports from the various groups, and address questions about how
this table illustrates the unique human characteristics of Australia. • Students submit their completed tables and analysis for marking. The activity will take approximately one hour.
Students are given clear instructions and support to facilitate their learning
Geography Years 7–10: Advice on Programming and Assessment
36
Guidelines for marking The following guidelines for marking show one approach to assigning a value to a student’s work. Other approaches may be used that better suit the reporting process of the school. Categories, marks, grades, visual representations or individual comments/notations may all be useful.
Range A student in this range: 8–10 (High)
• identifies, selects and organises relevant data for Australia and chooses countries that clearly show the different levels of development
• clearly presents appropriate demographic characteristics in the tabulated form • analyses comparative data and clearly illustrates the unique human
characteristics of Australia • accurately and confidently communicates geographical information orally
4–7 (Satisfactory)
• identifies, selects and organises data for Australia and chooses countries at different levels of development
• presents appropriate demographic characteristics in the tabulated form • explains comparative data to illustrate the unique human characteristics of
Australia • accurately communicates geographical information orally
1–3 (Progressing)
• identifies, selects and organises some data for Australia and other countries • presents some demographic characteristics in the tabulated form • may refer to data • orally communicates geographical information to a limited degree.
Feedback Students will be given oral feedback by the teacher. Comments will inform them about such things as: • their ability to identify, select and organise data • the appropriateness of their geographical communication • the accuracy and depth of analysis and evaluation of the data • their ability to communicate geographical information orally. Peer assessment using Worksheet 2 is an option. Future directions Students whose performances satisfy the criteria of this activity use geographical tools and population pyramids to further investigate demographic characteristics, to describe trends and to explain how Australia’s community is changing. Students’ achievement in this task will enable the teacher to make a judgement about the ways subsequent teaching and learning activities might consolidate the skills of acquiring and processing geographical information. Resources Students are provided with a range of resources from textbooks and internet sites. Internet access allows students to gather up-to-date statistics. (Statistics are also available in atlases, yearbooks and some textbooks.) The CIA World Fact Book – http://www.cia.gov/cia/publications/factbook/geos/as.html ELDIS Country Profiles Quick-links guide to country-level information: news, statistics, organisations and sectoral information – http://www.eldis.org/country/index.htm BBC News Country Profiles – http://news.bbc.co.uk/1/hi/country_profiles/default.stm Worksheet 1 – Demographic research table Worksheet 2 – Peer assessment worksheet
Geography Years 7–10: Advice on Programming and Assessment
37
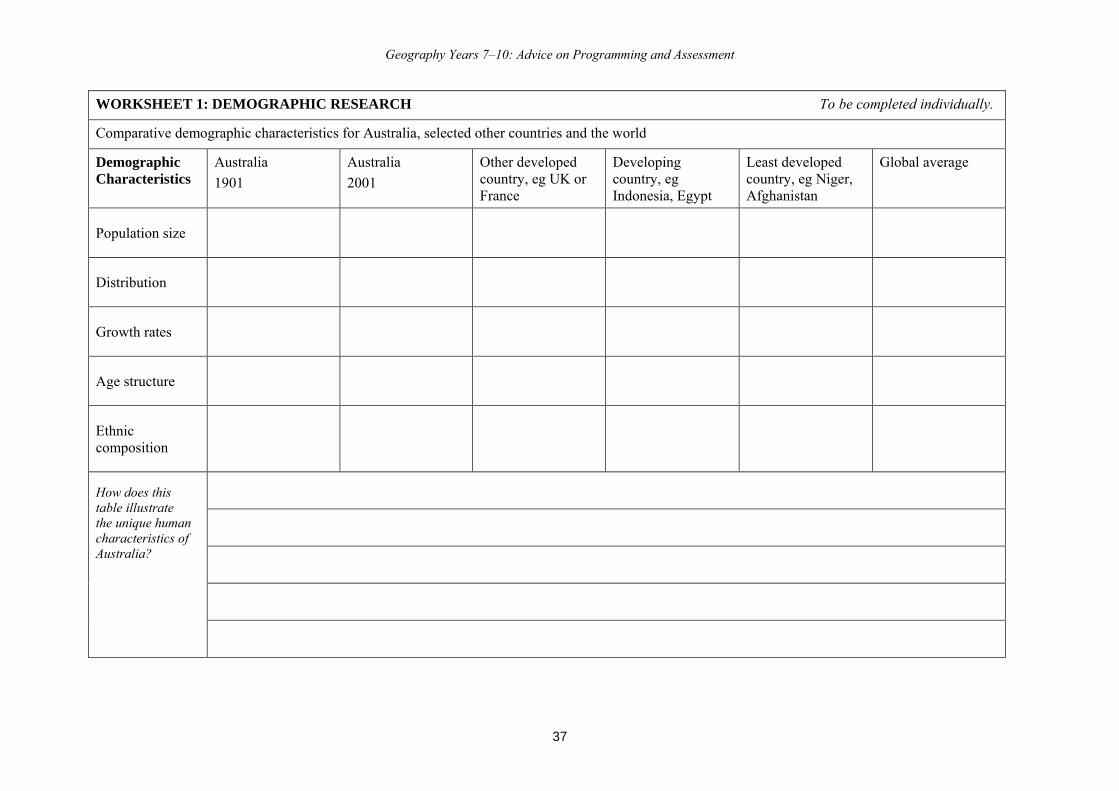
WORKSHEET 1: DEMOGRAPHIC RESEARCH To be completed individually.
Comparative demographic characteristics for Australia, selected other countries and the world
Demographic Characteristics
Australia 1901
Australia 2001
Other developed country, eg UK or France
Developing country, eg Indonesia, Egypt
Least developed country, eg Niger, Afghanistan
Global average
Population size
Distribution
Growth rates
Age structure
Ethnic composition
How does this table illustrate the unique human characteristics of Australia?

Geography Years 7–10: Advice on Programming and Assessment
38
Worksheet 2
PEER ASSESSMENT Your name
Classmate’s name
Place a tick in the appropriate space on the table below to assess your classmate’s work.
Table of performance P – progressing S– satisfactory H – high
He/she meets the following criteria at the level indicated:
P S H
a selects and organises relevant data for Australia and chooses countries that clearly show the different levels of development.
b presents appropriate demographic characteristics in the table format.
c provides data that illustrates the unique human characteristics of Australia when compared with other countries.
d orally communicates geographical information to me.

Geography Years 7–10: Advice on Programming and Assessment
39
5.3 Stages 4/5 Elective Sample Unit of Work: Physical Geography Focus: the geographical processes that form and transform the physical world. Time allocation for unit: 30 hours Targeted outcomes: A student: E5.1 identifies, gathers and evaluates geographical information E5.2 analyses, organises and synthesises geographical information E5.3 selects and uses appropriate written, oral and graphic forms to communicate geographical information E5.4 selects and applies appropriate geographical tools E5.5 explains the geographical processes that form and transform environments E5.6 analyses the importance of the world’s environments and issues associated with them.
Resources: Current available texts, world maps, globes, CD-ROMs, Encarta and Britannia, satellite images, graphic charts, daily newspapers, video and DVD, internet. Recommended sites: http://volcano.und.nodak.edu/vw.html http://neic.usgs.gov/neis/current/world.html http://www.bom.gov.au/
Students learn about:
Students learn to: Integrated teaching, learning and assessment Evidence of learning/feedback
• the functioning of the physical environment
• plate tectonics
• locate the major tectonic plates and their boundaries
• interpret geographical information about these places from a variety of sources
• explain the relation-ships between plate boundaries and major physical features
• investigate the impacts of current tectonic processes on the environment
Students: • draw a map of world, name and place
tectonic plates and their boundaries • view videos explaining plate tectonics,
earthquakes and volcanos • construct a model of a basic volcano using
paper/clay • complete crossword and find-a-word
puzzles focusing on key terms and definitions
• draw maps, diagrams and cross-sections of volcanos mountains, label and explain
• use internet sites to explore current volcanic and earthquake activity.
Students demonstrate their knowledge and understanding of plate movements, earthquakes and volcanos through oral discussion and note-taking from videos. Feedback: Summary note sheets from videos are marked by the teacher and returned with feedback on students’ ability to make notes from video. Teacher provides oral feedback during discussion. In the construction of a volcano students also demonstrate their understanding of the physical process involved in volcanic events. Feedback: Teacher displays models in classroom and school library. Teacher gives written feedback to students on the accuracy of the processes shown in their models.

Geography Years 7–10: Advice on Programming and Assessment
40
Students learn about:
Students learn to: Integrated teaching, learning and assessment Evidence of learning/feedback
• weathering
• describe mechanical and chemical weathering
• explain the role of weathering in shaping the landscape
Teacher briefs students in the ‘Jigsaw technique’. Individual students may need structured worksheets to assist. Students complete a jigsaw activity on mass wasting. Individual students become ‘experts’ on various aspects of a topic through research. Students report their ‘expert’ findings to a group. Graphic outline activity on types of weathering and their physical characteristics. Students complete graphic outline with the aid of a worksheet issued by the teacher. Class discussion on findings of graphic outline activity.
Students write a short news article based on their internet research, which is marked by the teacher. Teacher observes and provides oral feedback during the jigsaw activity. Peer assessment and class review of group answers takes place. Jigsaw activity demonstrates the ability of students to analyse information, work in groups and present summary of information in a meaningful way to peers. Feedback: Peer discussion and oral assessment. Teacher observation and group (student) review/evaluation through discussion of outcomes achieved. Feedback advises students on their ability to: • analyse information • work in groups • present information in an oral report to peers. Students demonstrate their ability to select and organise information from a text in their graphic outlines. Student participation in class discussion demonstrates their understanding of types of weathering. Feedback: Teacher annotates and marks the students’ graphic outlines on their ability to select and organise information from a text.

Geography Years 7–10: Advice on Programming and Assessment
41
Students learn about: Students learn to: Integrated teaching, learning and assessment Evidence of learning/feedback • mass movement • erosion and
deposition • at least one case
study of a landscape produced by one of the following: − landform
processes − human
interactions.
• examine the role of humans in the process of mass movement
• identify the aspects of erosion and deposition
• distinguish between weathering and erosion
• recognise the main landforms in the study
• explain the processes that create landforms
• describe human interactions with the landscape.
Teacher leads class through a fieldwork program designed to demonstrate erosion and deposition and the landforms these processes create. Students: • complete a case study report on the
landform creation process from fieldwork and human interactions
• collect samples, photos and data for their report • make field sketches Teacher provides students with a structured case study outline and a range of resources on various human interactions causing mass movement, sample studies such as the Thredbo landslide (1997), avalanches and the like. Students: • read and discuss sample studies of human
interaction causing mass movement • draw cross-sectional diagrams showing
physical processes of mass movement events • examine the work of groups responding to
such mass movement events through completing a comprehension activity.
Research assignment based on one landscape produced by either landform processes or human interaction.
Fieldwork demonstrates student collaborative skills, data collection, graphic synthesis and critical analysis skills. Feedback: Teacher annotates and marks the students’ case study report on the landform creation process from fieldwork. Teacher comments on students’ skills in data collection, graphic synthesis and critical analysis. Students demonstrate their understanding of human interaction causing mass movement through their participation in class discussion, annotated diagrams and their responses to the comprehension activity. Feedback: Oral feedback occurs during class discussion. Teacher provides written feedback on annotated diagrams and their responses to the comprehension activity. Formal feedback on the submitted report – annotated statements and grade/mark showing students’ achievements in research and report writing.
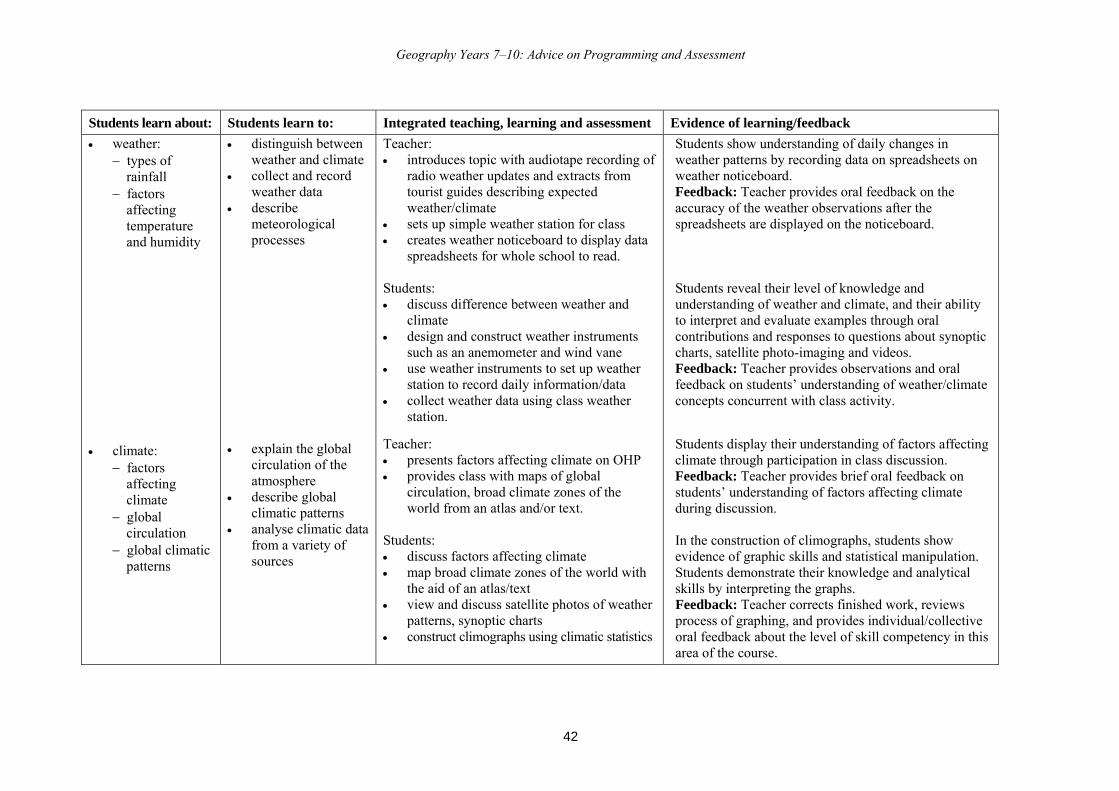
Geography Years 7–10: Advice on Programming and Assessment
42
Students learn about: Students learn to: Integrated teaching, learning and assessment Evidence of learning/feedback • weather:
− types of rainfall
− factors affecting temperature and humidity
• climate:
− factors affecting climate
− global circulation
− global climatic patterns
• distinguish between weather and climate
• collect and record weather data
• describe meteorological processes
• explain the global
circulation of the atmosphere
• describe global climatic patterns
• analyse climatic data from a variety of sources
Teacher: • introduces topic with audiotape recording of
radio weather updates and extracts from tourist guides describing expected weather/climate
• sets up simple weather station for class • creates weather noticeboard to display data
spreadsheets for whole school to read. Students: • discuss difference between weather and
climate • design and construct weather instruments
such as an anemometer and wind vane • use weather instruments to set up weather
station to record daily information/data • collect weather data using class weather
station. Teacher: • presents factors affecting climate on OHP • provides class with maps of global
circulation, broad climate zones of the world from an atlas and/or text.
Students: • discuss factors affecting climate • map broad climate zones of the world with
the aid of an atlas/text • view and discuss satellite photos of weather
patterns, synoptic charts • construct climographs using climatic statistics
Students show understanding of daily changes in weather patterns by recording data on spreadsheets on weather noticeboard. Feedback: Teacher provides oral feedback on the accuracy of the weather observations after the spreadsheets are displayed on the noticeboard. Students reveal their level of knowledge and understanding of weather and climate, and their ability to interpret and evaluate examples through oral contributions and responses to questions about synoptic charts, satellite photo-imaging and videos. Feedback: Teacher provides observations and oral feedback on students’ understanding of weather/climate concepts concurrent with class activity. Students display their understanding of factors affecting climate through participation in class discussion. Feedback: Teacher provides brief oral feedback on students’ understanding of factors affecting climate during discussion. In the construction of climographs, students show evidence of graphic skills and statistical manipulation. Students demonstrate their knowledge and analytical skills by interpreting the graphs. Feedback: Teacher corrects finished work, reviews process of graphing, and provides individual/collective oral feedback about the level of skill competency in this area of the course.

Geography Years 7–10: Advice on Programming and Assessment
43
Students learn about: Students learn to: Integrated teaching, learning and assessment Evidence of learning/feedback
– climate change • extreme weather
events: droughts, floods, storms
• examine issues
resulting from climatic change
• create a multimedia
presentation assessing the impacts of an extreme weather event on a community
• interpret various climographs from around the globe
• calculate max and min, total, range, rank and mean data for climate
• access Bureau of Meteorology on internet • complete information and data tables and
charts. Teacher: • provides short newspaper article on issues
resulting from climatic change. Students: • write a short summary of newspaper article
on issues resulting from climatic change • collect and summarise two other articles or
provide short newspaper article on issues resulting from climatic change.
Students: • view and discuss extracts from the movie
Twister and videos on extreme weather events and news footage and recent events
• draw diagrams relating to complete worksheets and spreadsheets on weather events and their statistics.
Teacher issues worksheet outlining a library research and oral presentation activity on an extreme weather event of student’s choice.
Students demonstrate their ability to use the internet for research by collecting data from the Bureau of Meteorology site: http://www.bom.gov.au/ Feedback: Teacher provides oral feedback on students’ ability to use internet for research. Students demonstrate their understanding of the issue of climate change through their ability to select and summarise newspaper articles. Feedback: Teacher gives written and oral feedback on the students’ summaries of articles collected.
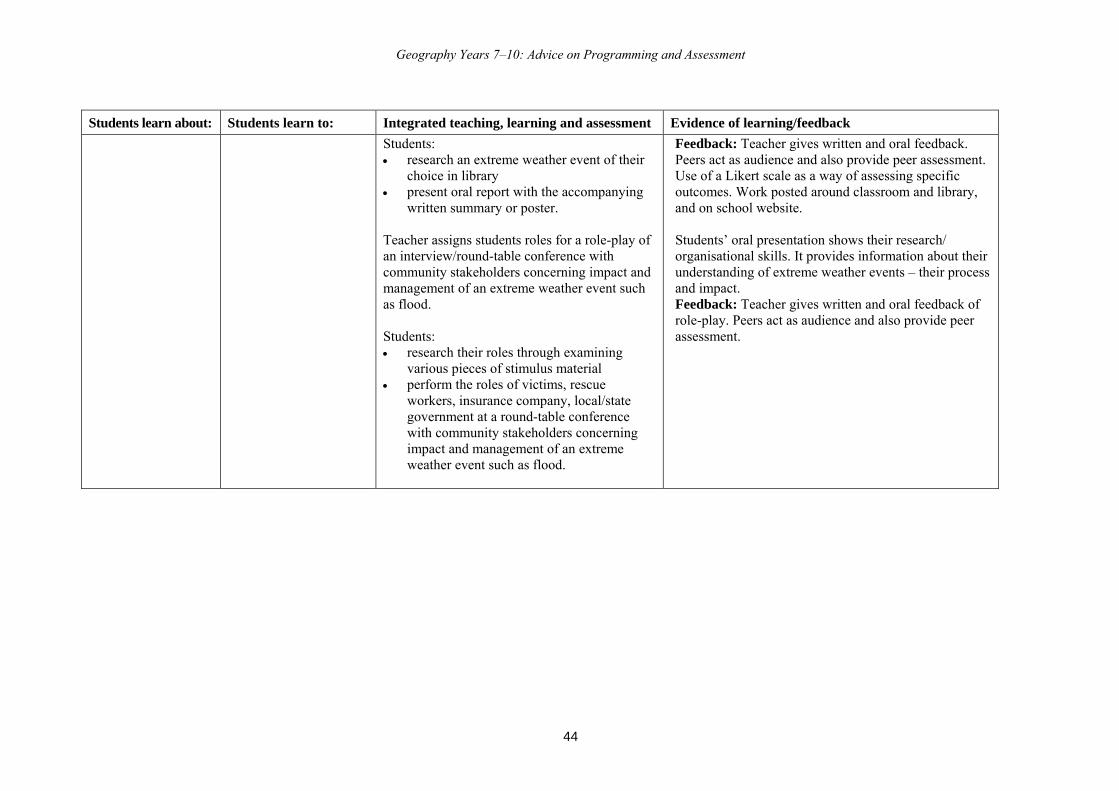
Geography Years 7–10: Advice on Programming and Assessment
44
Students learn about: Students learn to: Integrated teaching, learning and assessment Evidence of learning/feedback
Students: • research an extreme weather event of their
choice in library • present oral report with the accompanying
written summary or poster. Teacher assigns students roles for a role-play of an interview/round-table conference with community stakeholders concerning impact and management of an extreme weather event such as flood. Students: • research their roles through examining
various pieces of stimulus material • perform the roles of victims, rescue
workers, insurance company, local/state government at a round-table conference with community stakeholders concerning impact and management of an extreme weather event such as flood.
Feedback: Teacher gives written and oral feedback. Peers act as audience and also provide peer assessment. Use of a Likert scale as a way of assessing specific outcomes. Work posted around classroom and library, and on school website. Students’ oral presentation shows their research/ organisational skills. It provides information about their understanding of extreme weather events – their process and impact. Feedback: Teacher gives written and oral feedback of role-play. Peers act as audience and also provide peer assessment.

Geography Years 7–10: Advice on Programming and Assessment
45
5.3.1 Sample assessment for learning activity: Graphic outline activity Context This activity occurs quite early on in the Physical Geography topic. Students would have an understanding of the geomorphology of plate tectonics and mountain building. Students have also investigated the impacts of current tectonic processes on the environment. Prior to this activity students would have viewed videos, constructed maps and diagrams and completed cross-sections, and dealt with key terms and definitions. In this activity students will develop an understanding of the various concepts associated with weathering. They will also exercise their skills of comprehension, synthesis, collation, summarising and mapping of data and information from written texts. Outcomes A student: E5.2 analyses, organises and synthesises geographical information E5.3 selects and uses appropriate written, oral and graphic forms to communicate
geographical information E5.5 explains the geographical processes that form and transform environments. 5
Description of activity This activity has three distinct phases and involves the completion of a graphic outline/flow chart on the concept of weathering. In phase one each student is provided with a graphic outline worksheet and is briefed on the requirements of the activity. With the aid of the school text the students are to skim read, comprehend and summarise each component of weathering in point form on the graphic outline. In phase two students work in pairs, collaborating to refine and amend their summary of weathering. In phase three the students participate in a class discussion on the aspects of weathering. This activity should take no longer than one 50-minute lesson. The suggested breakdown of the lesson activity is 20–25 minutes for individual reading and point-form summation, 5–10 minutes for pair collaboration and 15 minutes for whole-class review. The teacher reviews the students’ graphic outlines and the group’s collaboration, and communication is assessed by peer evaluation.

Geography Years 7–10: Advice on Programming and Assessment
46
Criteria for assessing learning (These criteria would normally be communicated to students with the activity.) Students will be assessed on how well they: • analyse, organise and synthesise information on weathering • explain the processes that form and transform environments • communicate geographical information in oral and graphic forms.
Guidelines for marking The following guidelines for marking show one approach to assigning a value to a student’s work. Other approaches may be used that better suit the reporting process of the school. Categories, marks, grades, visual representations or individual comments/notations may all be useful. Range A student in this range: 8–10 marks (High)
• thoroughly analyses, organises and synthesises information on weathering
• provides a detailed explanation of the processes that form and transform environments with several examples
• accurately presents the information in point form on the graphic outline and confidently communicates this information orally to their classmates
4–7 marks (Satisfactory)
• analyses, organises and synthesises information from the text on weathering
• explains the processes that form and transform environments with examples
• presents the information in point form on the graphic outline and communicates this information orally to their classmates
1–3 marks (Progressing)
• copies some information from the text on weathering • provides a limited explanation of some of the processes that
form and transform environments • presents some information in point form on the graphic outline
and may communicate this information orally to the their classmates.
Feedback Students receive oral feedback from the teacher and their peers during the activity. A simple assessment sheet is given to students to assist their appraisal of their peers’ performance in the activity. Students receive further feedback during the review session at the end of the lesson. The teacher marks the worksheets after students have incorporated input from their classmates. The teacher provides comment on the student’s ability to analyse and synthesise information from a written source and present that information in diagrammatic form. Comments are also provided on their ability to communicate their findings to their peers.

Geography Years 7–10: Advice on Programming and Assessment
47
Future directions With an understanding of weathering, students can move on to examine other microscale processes that shape the Earth’s surface – mass movement, erosion, deposition. This individual and collaborative form of activity develops students’ skills in gathering, analysing and evaluating data from a variety of sources. It also provides a model for summarising information in later learning activities and assessment preparation. Working in pairs also develops communication and critical thinking skills. Students experiencing difficulty in this activity may require additional assistance in summarising skills and/or more time in future activities of a similar nature. Resources A range of Geography textbooks covering weathering. Worksheet 1 – Graphic outline Worksheet 2 – Peer assessment sheet
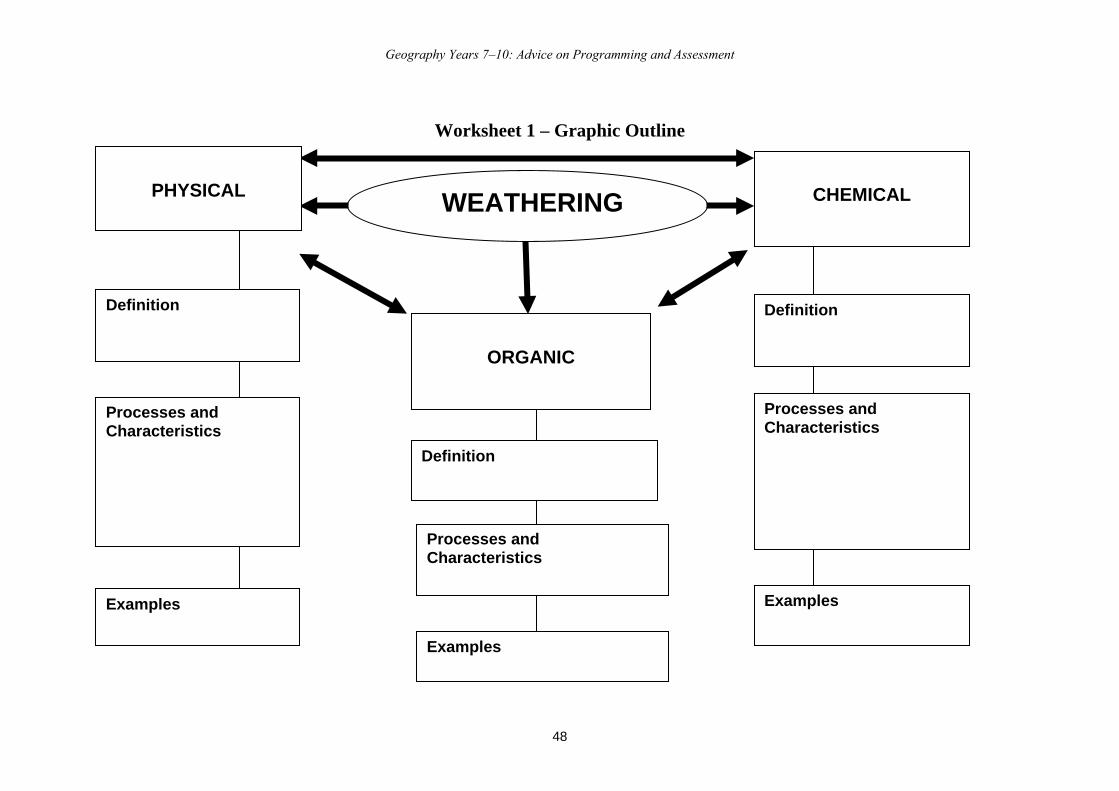
Geography Years 7–10: Advice on Programming and Assessment
48
Worksheet 1 – Graphic Outline
CHEMICAL
ORGANIC
WEATHERING
Definition
Definition
Definition
Processes and Characteristics
Processes and Characteristics
Processes and Characteristics
Examples
Examples
Examples
PHYSICAL
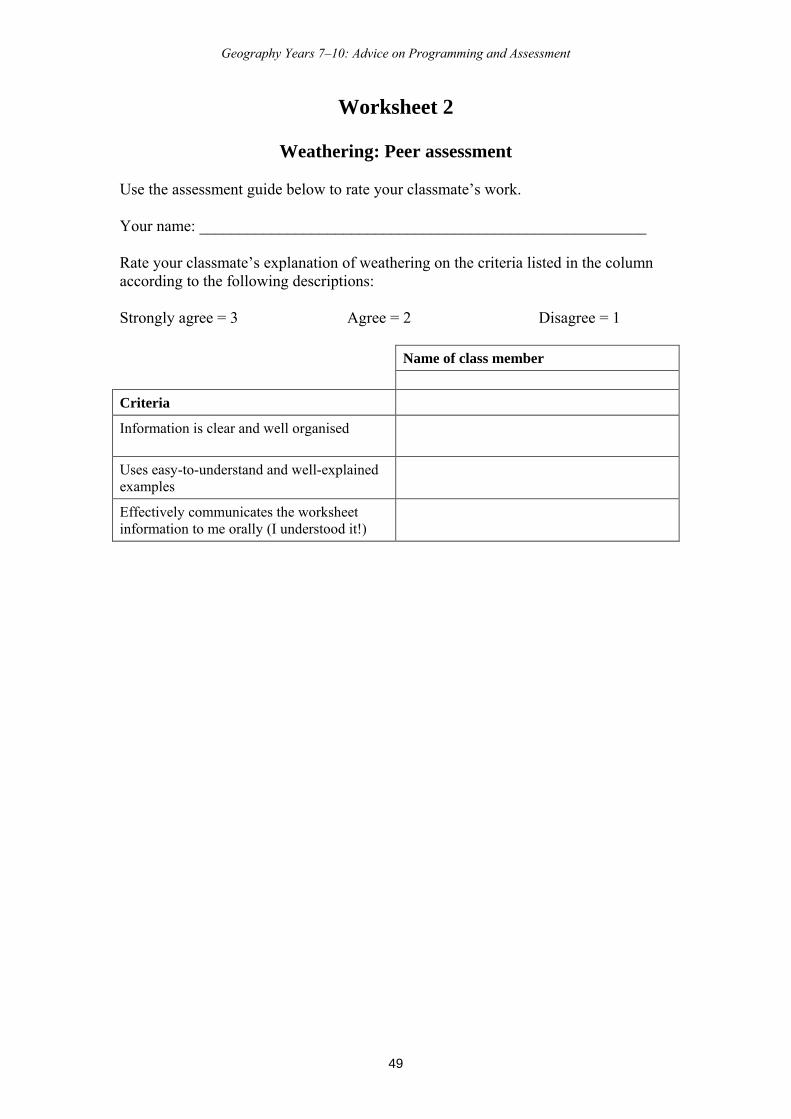
Geography Years 7–10: Advice on Programming and Assessment
49
Worksheet 2
Weathering: Peer assessment
Use the assessment guide below to rate your classmate’s work. Your name: ________________________________________________________ Rate your classmate’s explanation of weathering on the criteria listed in the column according to the following descriptions: Strongly agree = 3 Agree = 2 Disagree = 1 Name of class member Criteria
Information is clear and well organised
Uses easy-to-understand and well-explained examples
Effectively communicates the worksheet information to me orally (I understood it!)