geologic assessment of undiscovered oil and gas resources ... · u.s. department of the interior...
TRANSCRIPT

U.S. Department of the InteriorU.S. Geological Survey
Open-File Report 2013 –1257
Geologic Assessment of Undiscovered Oil and Gas Resources—Oligocene Frio and Anahuac Formations, United States Gulf of Mexico Coastal Plain and State Waters

This page intentionally left blank

Geologic Assessment of Undiscovered Oil and Gas Resources—Oligocene Frio and Anahuac Formations, United States Gulf of Mexico Coastal Plain and State Waters
By Sharon M. Swanson, Alexander W. Karlsen, and Brett J. Valentine
Open-File Report 2013–1257
U.S. Department of the InteriorU.S. Geological Survey

U.S. Department of the InteriorSALLY JEWELL, Secretary
U.S. Geological SurveySuzette M. Kimball, Acting Director
U.S. Geological Survey, Reston, Virginia: 2013
For more information on the USGS—the Federal source for science about the Earth, its natural and living resources, natural hazards, and the environment, visit http://www.usgs.gov or call 1–888–ASK–USGS.
For an overview of USGS information products, including maps, imagery, and publications, visit http://www.usgs.gov/pubprod
To order this and other USGS information products, visit http://store.usgs.gov
Any use of trade, firm, or product names is for descriptive purposes only and does not imply endorsement by the U.S. Government.
Although this information product, for the most part, is in the public domain, it also may contain copyrighted materials as noted in the text. Permission to reproduce copyrighted items must be secured from the copyright owner.
Suggested citation:Swanson, S.M., Karlsen, A.W., and Valentine B.J., 2013, Geologic assessment of undiscovered oil and gas resources—Oligocene Frio and Anahuac Formations, United States Gulf of Mexico coastal plain and State waters: U.S. Geological Survey Open-File Report 2013–1257, 66 p., http://dx.doi.org/10.3133/ofr20131257.
ISSN 2331–1258 (online)

iii
Contents
Abstract ...........................................................................................................................................................1Introduction.....................................................................................................................................................2Geologic Setting of Frio and Anahuac Formations ..................................................................................4
Stratigraphy ..........................................................................................................................................4Depositional Systems ...........................................................................................................................4
Frio Formation ...............................................................................................................................4Hackberry Trend of the Frio Formation .....................................................................................5Anahuac Formation .....................................................................................................................7
Structural Features ............................................................................................................................12Upper Jurassic-Cretaceous-Tertiary Composite Total Petroleum System .......................................12
Total Petroleum System Model .........................................................................................................12Source Rocks ......................................................................................................................................16Maturation of the Wilcox Group .......................................................................................................19Migration ..............................................................................................................................................21
Reservoir Rocks ...........................................................................................................................................23Frio Formation ......................................................................................................................................23Hackberry Trend of the Frio Formation ............................................................................................23Anahuac Formation ............................................................................................................................25Reservoirs in Relation to Shelf Margin Deltas ...............................................................................26
Porosity and Permeability...........................................................................................................................26Frio Formation ......................................................................................................................................26
Traps and Seals ............................................................................................................................................27Frio Formation ......................................................................................................................................27Hackberry Trend of the Frio Formation ............................................................................................29Anahuac Formation ............................................................................................................................29
Resource Assessment ................................................................................................................................29Geologic Model Used to Define Paleogene Assessment Units ..................................................29Assessment Units ...............................................................................................................................31
Boundaries Used to Define Assessment Units ....................................................................31Limit of Thermally Mature Source Rocks .....................................................................36 Limit of Potential for Biogenic Gas ...............................................................................36Updip Extent of Oligocene Rocks ...................................................................................36State/Federal Water Boundaries ...................................................................................36
Frio Basin Margin Assessment Unit .......................................................................................36Frio Stable Shelf Oil and Gas Assessment Unit ...................................................................37Frio Expanded Fault Zone Oil and Gas Assessment Unit ...................................................41Hackberry Oil and Gas Assessment Unit ..............................................................................46Frio Slope and Basin Floor Gas Assessment Unit ...............................................................49Anahuac Oil and Gas Assessment Unit .................................................................................51
Assessment Results ....................................................................................................................................55Conclusions...................................................................................................................................................56Acknowledgments .......................................................................................................................................57References Cited..........................................................................................................................................57Appendix 1.....................................................................................................................................................66

iv
Figures 1 Generalized stratigraphic section of the northern Gulf of Mexico coastal plain,
with the Frio Formation and Anahuac Formation highlighted in blue ..................................3 2. Stratigraphic section of the Tertiary and younger strata in the Northern Gulf
of Mexico coastal plain showing nomenclature for geographic regions, with the Frio Formation and Anahuac Formation highlighted in blue ...........................................5
3. Schematic diagram of the Hackberry trend of the Frio Formation and related strata, Jefferson County area, Texas, and diagnostic foraminifera .....................................7
4. Principal sediment sources, basins and uplift, and depositional systems in the northern Gulf of Mexico during the late Oligocene .........................................................8
5. Stratigraphic dip section through the Gueydan fluvial system and Norias delta system in south Texas .......................................................................................................9
6. Paleogeographic reconstruction of Buna and Hackberry depositional environments in southeastern Texas ......................................................................................10
7. Generalized depositional environments of the Hackberry trend and production fields within western Calcasieu Parish, with approximate location of “Hartburg flexure” ..................................................................................................10
8. Generalized locations of hydrocarbon plays for the Frio and Anahuac Formations, as reported in the literature ................................................................................11
9. Schematic cross section though central Texas from the early Cretaceous shelf margin to the present shelf margin, showing growth faults, the Vicksburg and Frio fault zones, and the extent of assessment units .................................13
10. Simplified schematic cross section showing formation of successive growth-faulted subbasins, modified from Brown and others .............................................14
11. Cross section of the Frio Formation showing thickening and vertical displacement in the Vicksburg and Frio fault zones in south Texas...................................15
12. Map showing interpretation of the extent of oils and gases sourced from source rock intervals, based on oil geochemistry characteristics of source rock extracts ................................................................................................................................17
13. Upper Jurassic-Cretaceous-Tertiary Composite Total Petroleum System for the Gulf of Mexico basin, within areas assessed by the USGS for Tertiary stratigraphic intervals ...............................................................................................................18
14. Tertiary burial-history curves for four wells where Ro and bottomhole temperature data were available .............................................................................................20
15. Cross section showing general model for onshore source rocks and migration pathways ....................................................................................................................22
16. Structure contours showing depth to the top of the Frio Formation and total thickness of the Frio Formation .......................................................................................24
17. Schematic cross section of reservoirs of the Tom O’Connor field, Refugio County, Texas ...............................................................................................................................27
18. Schematic diagram of Frio fluvial depositional environments in south Texas .................28 19. Geologic model used to define the assessment units ..........................................................30 20. Assessment units for the Frio Formation ................................................................................32 21. Petroleum system events chart in the Upper-Jurassic-Cretaceous-
Tertiary Composite Total Petroleum System for Frio and Anahuac hydrocarbon reservoirs .............................................................................................................34

v
22. Boundaries and areas used to define assessment units for the Frio and Anahuac Formations ..................................................................................................................35
23. The Frio Stable Shelf Oil and Gas Assessment Unit, with boundaries used to define the assessment unit ...................................................................................................38
24. Plots of accumulation discovery year versus cumulative grown oil and accumulation discovery year versus cumulative grown gas volume demonstrate the degree of maturity for oil and gas production in the Frio Stable Shelf Oil and Gas Assessment Unit .........................................................................................................39
25. Oil and gas accumulation sizes versus discovery years for discovered fields within the Frio Stable Shelf Oil and Gas Assessment Unit showing how the estimates of field sizes for undiscovered fields were determined. Production data are divided into 1st, 2nd, and 3rd thirds of production, each third having an equal number of discovered fields .....................................................................................40
26. The Frio Expanded Fault Zone Oil and Gas Assessment Unit, with boundaries used to define the assessment unit .........................................................................................42
27. Plots of accumulation discovery year versus cumulative grown oil volume and accumulation discovery year versus cumulative grown gas volume demonstrate the degree of maturity for oil and gas production in the Frio Expanded Fault Zone Oil and Gas Assessment Unit .............................................................43
28. Plots of reservoir discovery year versus reservoir depth for gas for the Frio Expanded Fault Zone Oil and Gas Assessment Unit .....................................................44
29. Oil and gas accumulation size versus discovery years for discovered fields within the Frio Expanded Fault Zone Oil and Gas Assessment Unit, showing how the estimates of field sizes for undiscovered fields were determined .....................45
30. The Hackberry Oil and Gas Assessment Unit, with the extent of Hackberry play as defined by Cossey and Jacobs ...................................................................................46
31. Plots of accumulation discovery year versus cumulative grown oil volume and accumulation discovery year versus cumulative grown gas volume demonstrate the degree of maturity for oil and gas production in the Hackberry Oil and Gas Assessment Unit ................................................................................47
32. Oil and gas accumulation sizes versus discovery years for discovered fields within the Hackberry Oil and Gas Assessment Unit, showing how the estimates of field sizes for undiscovered fields were determined .....................................48
33. The Frio Slope and Basin Floor Gas Assessment Unit, with boundaries used to define the assessment unit .........................................................................................50
34. Assessment unit for the Anahuac Formation, with boundaries used to define the AU ..........................................................................................................................52
35. Plots of accumulation discovery year versus cumulative grown oil and accumulation discovery year versus cumulative grown gas volume demonstrate the degree of maturity for oil and gas production in the Anahuac Oil and Gas Assessment Unit ..................................................................................53
36. Oil and gas accumulation sizes versus discovery years for discovered fields within the Anahuac Oil and Gas Assessment Unit, showing how the estimates of field sizes for undiscovered fields were determined .......................................................54

vi
Tables 1. Compilation of biostratigraphic zones for the Frio and Anahuac Formations
from the literature .........................................................................................................................6 2. Summary of the assessment results for the Frio Formation and the
Anahuac Formation (one assessment unit) by resource type ............................................55

vii
Conversion FactorsMultiply By To obtain
Length
foot (ft) 0.3048 meter (m)kilometer (km) 0.6214 mile (mi)
Volume
barrel (bbl), (petroleum, 1 barrel=42 gal)
0.1590 cubic meter (m3)
cubic foot (ft3) 28.32 cubic decimeter (dm3) cubic foot (ft3) 0.02832 cubic meter (m3)
Temperature in degrees Fahrenheit (°F) may be converted to degrees Celsius (°C) as follows:
°C=(°F–32)/1.8
Total dissolved solids (TDS) concentrations are given in milligrams per liter (mg/L).
Permeabilities are given in millidarcies (md).

viii
This page intentionally left blank

AbstractThe Oligocene Frio and Anahuac Formations were assessed as part of the 2007 U.S. Geological Survey (USGS) assessment
of Tertiary strata of the U.S. Gulf of Mexico Basin onshore and State waters. The Frio Formation, which consists of sand-rich fluvio-deltaic systems, has been one of the largest hydrocarbon producers from the Paleogene in the Gulf of Mexico. The Ana-huac Formation, an extensive transgressive marine shale overlying the Frio Formation, contains deltaic and slope sandstones in Louisiana and Texas and carbonate rocks in the eastern Gulf of Mexico. In downdip areas of the Frio and Anahuac Formations, traps associated with faulted, rollover anticlines are common. Structural traps commonly occur in combination with stratigraphic traps. Faulted salt domes in the Frio and Anahuac Formations are present in the Houston embayment of Texas and in south Loui-siana. In the Frio Formation, stratigraphic traps are found in fluvial, deltaic, barrier-bar, shelf, and strandplain systems.
The USGS Tertiary Assessment Team defined a single, Upper Jurassic-Cretaceous-Tertiary Composite Total Petroleum System (TPS) for the Gulf Coast basin, based on previous studies and geochemical analysis of oils in the Gulf Coast basin. The primary source rocks for oil and gas within Cenozoic petroleum systems, including Frio Formation reservoirs, in the northern, onshore Gulf Coastal region consist of coal and shale rich in organic matter within the Wilcox Group (Paleocene–Eocene), with some contributions from the Sparta Sand of the Claiborne Group (Eocene). The Jurassic Smackover Formation and Cretaceous Eagle Ford Formation also may have contributed substantial petroleum to Cenozoic reservoirs. Modeling studies of thermal maturity by the USGS Tertiary Assessment Team indicate that downdip portions of the basal Wilcox Group reached sufficient thermal maturity to generate hydrocarbons by early Eocene; this early maturation is the result of rapid sediment accumulation in the early Tertiary, combined with the reaction kinetic parameters used in the models. A number of studies indicate that the migra-tion of oil and gas in the Cenozoic Gulf of Mexico basin is primarily vertical, occurring along abundant growth faults associated with sediment deposition or along faults associated with salt domes.
The USGS Tertiary assessment team developed a geologic model based on recurring regional-scale structural and deposi-tional features in Paleogene strata to define assessment units (AUs). Three general areas, as described in the model, are found in each of the Paleogene stratigraphic intervals assessed: “Stable Shelf,” “Expanded Fault,” and “Slope and Basin Floor” zones. On the basis of this model, three AUs for the Frio Formation were defined: (1) the Frio Stable Shelf Oil and Gas AU, containing reservoirs with a mean depth of about 4,800 feet in normally pressured intervals; (2) the Frio Expanded Fault Zone Oil and Gas AU, containing reservoirs with a mean depth of about 9,000 feet in primarily overpressured intervals; and (3) the Frio Slope and Basin Floor Gas AU, which currently has no production but has potential for deep gas resources (>15,000 feet). AUs also were defined for the Hackberry trend, which consists of a slope facies stratigraphically in the middle part of the Frio Formation, and the Anahuac Formation. The Frio Basin Margin AU, an assessment unit extending to the outcrop of the Frio (or basal Miocene), was not quantitatively assessed because of its low potential for production. Two proprietary, commercially available databases containing field and well production information were used in the assessment. Estimates of undiscovered resources for the five AUs were based on a total of 1,734 reservoirs and 586,500 wells producing from the Frio and Anahuac Formations. Estimated total mean values of technically recoverable, undiscovered resources are 172 million barrels of oil (MMBO), 9.4 trillion cubic feet of natural gas (TCFG), and 542 million barrels of natural gas liquids for all of the Frio and Anahuac AUs. Of the five units assessed, the Frio Slope and Basin Floor Gas AU has the greatest potential for undiscovered gas resources, having an estimated mean of 5.6 TCFG. The Hackberry Oil and Gas AU shows the second highest potential for gas of the five units assessed, having an estimated mean of 1.8 TCFG. The largest undiscovered, conventional crude oil resource was estimated for the Frio Slope and Basin Floor Gas AU; the estimated mean for oil in this AU is 110 MMBO.
Geologic Assessment of Undiscovered Oil and Gas Resources—Oligocene Frio and Anahuac Formations, United States Gulf of Mexico Coastal Plain and State Waters
By Sharon M. Swanson, Alexander W. Karlsen, and Brett J. Valentine
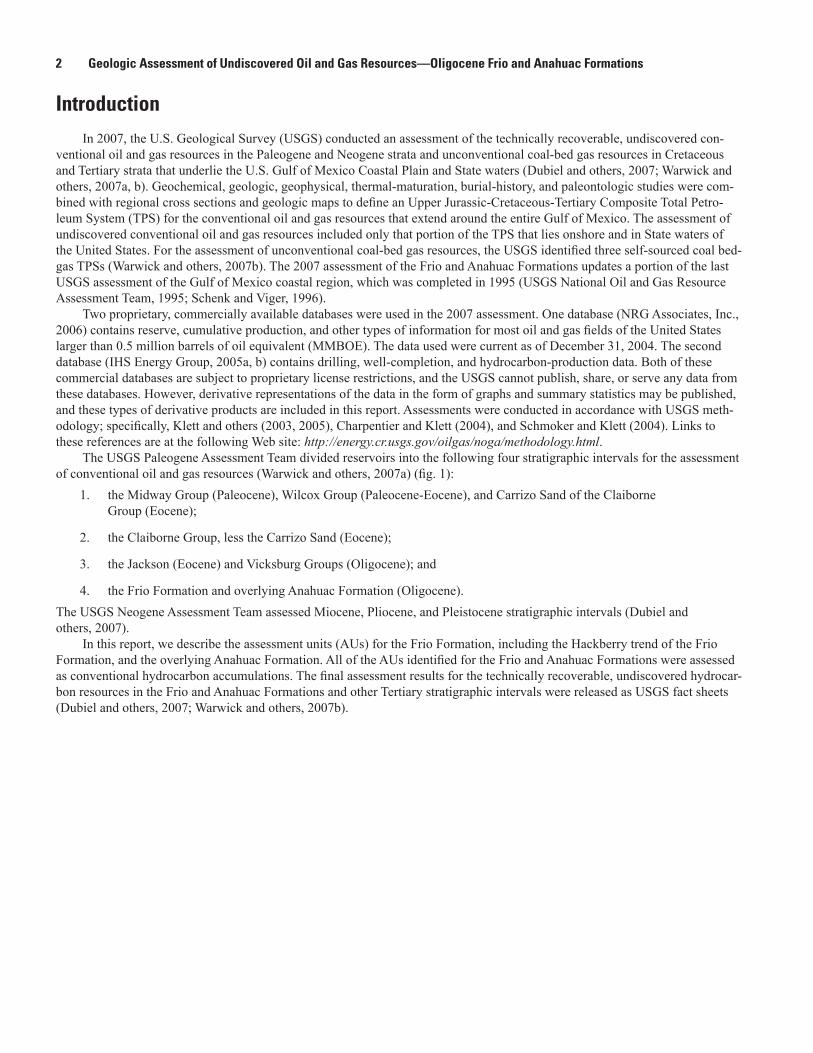
2 Geologic Assessment of Undiscovered Oil and Gas Resources—Oligocene Frio and Anahuac Formations
IntroductionIn 2007, the U.S. Geological Survey (USGS) conducted an assessment of the technically recoverable, undiscovered con-
ventional oil and gas resources in the Paleogene and Neogene strata and unconventional coal-bed gas resources in Cretaceous and Tertiary strata that underlie the U.S. Gulf of Mexico Coastal Plain and State waters (Dubiel and others, 2007; Warwick and others, 2007a, b). Geochemical, geologic, geophysical, thermal-maturation, burial-history, and paleontologic studies were com-bined with regional cross sections and geologic maps to define an Upper Jurassic-Cretaceous-Tertiary Composite Total Petro-leum System (TPS) for the conventional oil and gas resources that extend around the entire Gulf of Mexico. The assessment of undiscovered conventional oil and gas resources included only that portion of the TPS that lies onshore and in State waters of the United States. For the assessment of unconventional coal-bed gas resources, the USGS identified three self-sourced coal bed-gas TPSs (Warwick and others, 2007b). The 2007 assessment of the Frio and Anahuac Formations updates a portion of the last USGS assessment of the Gulf of Mexico coastal region, which was completed in 1995 (USGS National Oil and Gas Resource Assessment Team, 1995; Schenk and Viger, 1996).
Two proprietary, commercially available databases were used in the 2007 assessment. One database (NRG Associates, Inc., 2006) contains reserve, cumulative production, and other types of information for most oil and gas fields of the United States larger than 0.5 million barrels of oil equivalent (MMBOE). The data used were current as of December 31, 2004. The second database (IHS Energy Group, 2005a, b) contains drilling, well-completion, and hydrocarbon-production data. Both of these commercial databases are subject to proprietary license restrictions, and the USGS cannot publish, share, or serve any data from these databases. However, derivative representations of the data in the form of graphs and summary statistics may be published, and these types of derivative products are included in this report. Assessments were conducted in accordance with USGS meth-odology; specifically, Klett and others (2003, 2005), Charpentier and Klett (2004), and Schmoker and Klett (2004). Links to these references are at the following Web site: http://energy.cr.usgs.gov/oilgas/noga/methodology.html.
The USGS Paleogene Assessment Team divided reservoirs into the following four stratigraphic intervals for the assessment of conventional oil and gas resources (Warwick and others, 2007a) (fig. 1):
1. the Midway Group (Paleocene), Wilcox Group (Paleocene-Eocene), and Carrizo Sand of the Claiborne Group (Eocene);
2. the Claiborne Group, less the Carrizo Sand (Eocene);
3. the Jackson (Eocene) and Vicksburg Groups (Oligocene); and
4. the Frio Formation and overlying Anahuac Formation (Oligocene). The USGS Neogene Assessment Team assessed Miocene, Pliocene, and Pleistocene stratigraphic intervals (Dubiel and others, 2007).
In this report, we describe the assessment units (AUs) for the Frio Formation, including the Hackberry trend of the Frio Formation, and the overlying Anahuac Formation. All of the AUs identified for the Frio and Anahuac Formations were assessed as conventional hydrocarbon accumulations. The final assessment results for the technically recoverable, undiscovered hydrocar-bon resources in the Frio and Anahuac Formations and other Tertiary stratigraphic intervals were released as USGS fact sheets (Dubiel and others, 2007; Warwick and others, 2007b).
Introduction 3
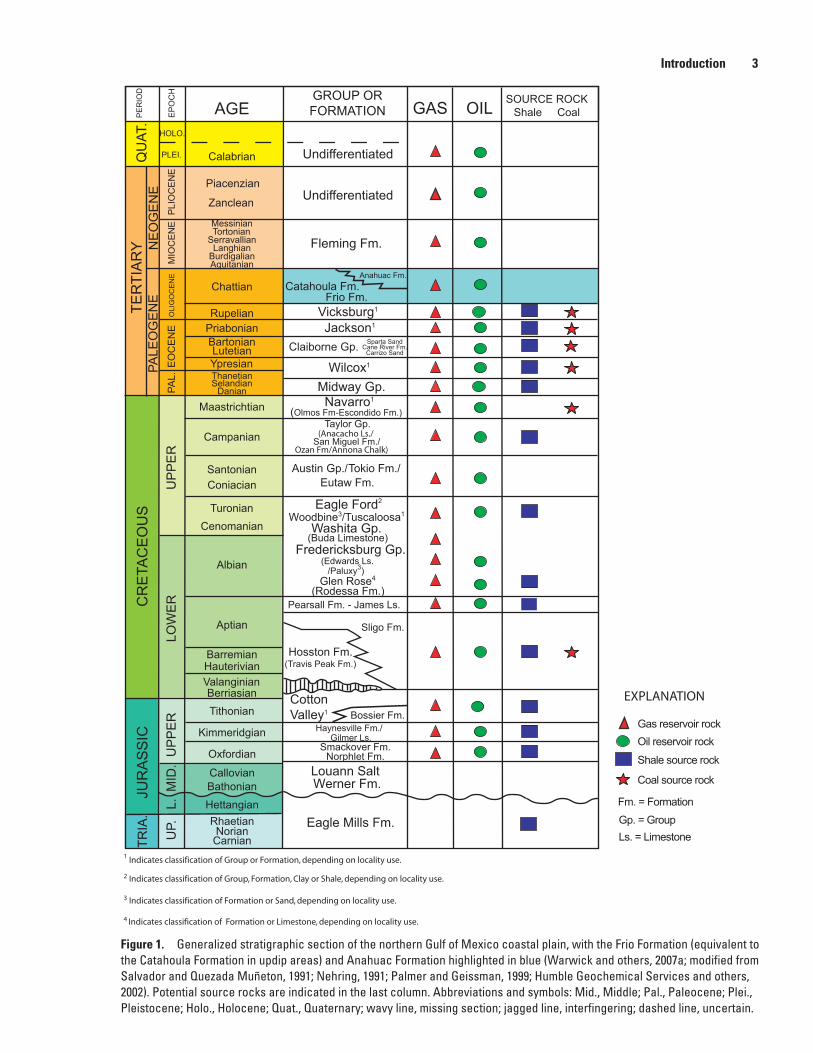
Figure 1. Generalized stratigraphic section of the northern Gulf of Mexico coastal plain, with the Frio Formation (equivalent to the Catahoula Formation in updip areas) and Anahuac Formation highlighted in blue (Warwick and others, 2007a; modified from Salvador and Quezada Muñeton, 1991; Nehring, 1991; Palmer and Geissman, 1999; Humble Geochemical Services and others, 2002). Potential source rocks are indicated in the last column. Abbreviations and symbols: Mid., Middle; Pal., Paleocene; Plei., Pleistocene; Holo., Holocene; Quat., Quaternary; wavy line, missing section; jagged line, interfingering; dashed line, uncertain.
QU
AT.
TER
TIA
RY
CR
ETA
CE
OU
SJU
RA
SS
ICTR
IA.
GAS OILSOURCE ROCK
Shale Coal
Undifferentiated
Undifferentiated
HOLO.
PLEI.
Fleming Fm.
Anahuac Fm.
Frio Fm.Catahoula Fm.
Vicksburg1 Jackson1
Claiborne Gp.
Wilcox1
Midway Gp.Navarro1
Taylor Gp.
Austin Gp./Tokio Fm./
Eagle Ford2
(Buda Limestone)Washita Gp.
Fredericksburg Gp.
Glen Rose4
Pearsall Fm. - James Ls.
Sligo Fm.
Hosston Fm.(Travis Peak Fm.)
CottonValley1 Bossier Fm.
Haynesville Fm./Gilmer Ls.
Smackover Fm.Norphlet Fm.
Louann Salt
Eagle Mills Fm.
Werner Fm.
San Miguel Fm./
(Olmos Fm-Escondido Fm.)
(Edwards Ls./Paluxy3)
(Rodessa Fm.)
Eutaw Fm.
Woodbine3/Tuscaloosa1
Ozan Fm/Annona Chalk)
GROUP ORFORMATIONAGEE
PO
CH
PE
RIO
D
(Anacacho Ls./
Carrizo SandCane River Fm.
Sparta Sand
Chattian
Piacenzian
Calabrian
Zanclean
AquitanianBurdigalianLanghian
SerravallianTortonianMessinian
DanianSelandian
Rupelian
Thanetian
CarnianNorian
Rhaetian
YpresianLutetian
Campanian
SantonianConiacian
TuronianCenomanian
Albian
Aptian
Hauterivian
PriabonianBartonian
Maastrichtian
Barremian
ValanginianBerriasianTithonian
Kimmeridgian
Oxfordian
CallovianBathonianHettangian
UP
PE
RU
PP
ER
LOW
ER
UP.
MID
.L.
NE
OG
EN
EPA
LEO
GE
NE
EO
CE
NE
PAL.
OLI
GO
CE
NE
MIO
CE
NE
PLI
OC
EN
E
1 Indicates classification of Group or Formation, depending on locality use.
2 Indicates classification of Group, Formation, Clay or Shale, depending on locality use.
3 Indicates classification of Formation or Sand, depending on locality use.
4 Indicates classification of Formation or Limestone, depending on locality use.
Gas reservoir rockOil reservoir rock
Shale source rock
Coal source rock
Fm. = FormationGp. = GroupLs. = Limestone
EXPLANATION

4 Geologic Assessment of Undiscovered Oil and Gas Resources—Oligocene Frio and Anahuac Formations
Geologic Setting of Frio and Anahuac Formations
Stratigraphy
The Frio Formation is composed of a series of deltaic and marginal-marine sandstones and shales that are the downdip equivalent of the continental Catahoula Formation (Galloway and others, 1982, 1991; figs. 1 and 2). The Chickasawhay and lower part of the Paynes Hammock Formations of southeast Mississippi, southwest Alabama, and the west Florida panhandle are shallow-water carbonate shelf limestone, marl, and mixed siliciclastic-calciclastic equivalents of the subsurface Frio and Cata-houla Formations of Texas and Louisiana (Galloway and others, 1991; Salvador and Quezada Muñeton, 1991) (fig. 2). Based on data from published cross sections (Dodge and Posey, 1981; Bebout and Gutierrez, 1982, 1983), the Frio Formation (which includes the Anahuac Formation in the cross sections) ranges in thickness from less than 1,000 feet (ft) in southern Louisiana to close to 9,000 ft in coastal areas of Texas. The Frio is underlain by the Oligocene Vicksburg Formation, which is thickest and best developed within the Rio Grande embayment in south Texas (Galloway and others, 1982).
Although the Frio Formation has been informally divided into upper, middle, and lower units based on paleontological zones in previous studies (Galloway and others, 1982; Galloway, 1986; John and others, 1992 b, c, d), formal formation mem-bers have not been designated. In the subsurface, the Frio and Anahuac Formations of Texas and Louisiana are subdivided into paleontological zones based on the occurrence of benthic foraminifera (table 1). In addition, a thin, mud-rich unit called the Frio Clay is mapped at outcrop in south Texas and is believed to correlate in part to both the Vicksburg and the lowest Catahoula-Frio of the deep subsurface (Galloway and others, 1982) (fig. 2).
In southeast Texas and southwest Louisiana, a transgressive, deepwater shale and sandstone unit referred to as the “Hack-berry” occurs in the middle part of the Frio Formation (Bornhauser, 1960; Paine, 1968, 1971; Benson, 1971; Berg and Powers, 1980; Ewing and Reed, 1984; Galloway and others, 1991, 2000; Cossey and Jacobs, 1992) (figs. 2 and 3). The name “Hack-berry” was introduced by Garrett (1938) to designate a specific forminiferal assemblage within the greater Frio interval, but it has also been referred to as a facies, trend, sequence, member, or formation in the literature (Bornhauser, 1960; Ewing and Reed, 1984; Galloway and others, 1991; Cossey and Jacobs, 1992). USGS nomenclature does not recognize the Hackberry trend as a member of the Frio Formation. In this report, we refer to the sequence of shale and sandstone units as the “Hackberry trend.”
The Frio is regionally overlain by the Anahuac Formation, a transgressive marine shale containing sandstone, carbon-ate bank, and carbonate reef deposits. The Anahuac Formation occurs in the subsurface of Texas, Louisiana, and southwestern Mississippi (Galloway and others, 1982; Galloway and others, 1991) (fig. 2). Early studies suggested that the Anahuac was in either the upper Oligocene (Nehring, 1991; Galloway and others, 1991; Goddard and others, 2005) or in the Oligocene–Miocene (Krutak and Beron, 1990; Galloway and others, 2000). More recently, Goddard and others (2005) placed the Anahuac Formation at the top of the Oligocene, on the basis of the occurrence of foraminiferal biofacies in south Louisiana and previous studies of foraminiferal biofacies (Paine, 1956; Warren, 1957; Lafayette Geological Society, 1962; Harrison and Anderson, 1966; Tipsword and others, 1966; Smith, 1990; DiMarco and Shipp, 1991; Bread and others, 1999). In a study of sequence stratigraphic bound-aries and microfossil biozones in the south Texas Gulf Coast, Hammes and others (2007) placed the Anahuac Formation in the Upper Oligocene. Hernandez-Mendoza and others (2008) also placed the Anahuac Formation in the Upper Oligocene in a study of chronostratigraphic surfaces and paleogeographic settings in the Burgos Basin and adjacent south Texas. On the basis of these recent studies (Goddard and others, 2005; Hammes and others, 2007; Hernandez-Mendoza and others, 2008), we have referred to the Anahuac Formation as Upper Oligocene in age in this report.
Depositional Systems
Frio FormationThe Frio Formation is one of the major Tertiary progradational wedges of the Texas Gulf coastal plain (Galloway and oth-
ers, 1982). During the Oligocene, massive sediment influx from sources in Mexico and the southwestern United States occurred as a result of uplift and erosion that started in Mexico and migrated along the western margin of the Gulf Coast basin (Galloway and others, 1982, 2000). Explosive volcanism and caldera formation in Mexico combined with regional uplift to create an influx of recycled sedimentary rocks, volcaniclastics, and reworked ash into the western and central Gulf of Mexico (Galloway, 1977).
Four sediment-dispersal axes along the Gulf margin along the northwest to central Gulf margin were active during the Oli-gocene: the Norma, Norias, Houston, and central Mississippi deltas (Galloway and others, 1982, 2000; Galloway, 1986) (fig. 4). Of these deltas, the sand-rich, wave-dominated Norias delta was the largest. Figure 5 is a cross section of fluvial and deltaic sediments in the Norias delta area of south Texas (modified from Galloway and others, 1982). To the south, the Norias delta merged laterally with the smaller, sand-rich, wave-dominated Norma delta (Galloway and others, 2000). The fluvial system that supplied the Norias delta was a single river that carried relatively coarse-grained sediments (Galloway and others, 1982).

Geologic Setting of Frio and Anahuac Formations 5
In contrast, the fluvial system that supplied the Houston delta system consisted of several rivers that carried a mixed load of sand, silt, and clay (Galloway and others, 1982). In the late Oligocene, the Houston delta retrograded from the shelf margin, and the central Mississippi delta shrank markedly in area (Galloway and others, 2000).
The main clastic input into the Gulf of Mexico basin shifted to the west in Texas and western Louisiana during Oligocene time (Galloway and others, 1991), and local small rivers with limited clastic transporting ability existed in the northeast Gulf of Mexico region (Liu and others, 1997). The presence of a small delta in Mississippi and Alabama, which may be correlative to the Frio, has been suggested in previous studies (May, 1974; Johnson, 1982; J.L. Coleman, U.S. Geological Survey, written commun., 2010).
Hackberry Trend of the Frio FormationEarly studies on the Hackberry trend of southwestern Louisiana identified two major units: (1) an upper, predominantly
shale section ranging in thickness from less than 100 ft to more than 3,000 ft, containing a deep water microfaunal assemblage, and (2) a lower, predominantly sandstone section that ranges up to 700 ft in thickness (Paine, 1968) (fig. 3). Numerous abrupt local changes in lithologic character make correlations within the Hackberry difficult (Paine, 1968). Paine (1971) established that the lower Hackberry sandstones were turbidites and that the lower Hackberry sandstone had two depositional patterns: an updip, north-south channel pattern, and a downdip, blanket-type sandstone pattern (basin floor fan) (Paine, 1971) (figs. 6 and 7).
Shale and sandstone of the Hackberry trend form a seaward-thickening wedge, which pinches out to the north along the “Hartburg flexure” (figs. 6 and 7). The “Hartburg flexure” is defined as a zone of growth faulting that developed during the Oligocene and that may have represented the contemporaneous shelf margin and limited the updip extent of deep-water shale
QU
AT.
TER
TIA
RY
Undifferentiated
Undifferentiated
HOLOC.
PLEIS.
Goliad Fm.Lagarto Fm.Fleming Fm.
Oakville Sandstone
Catahoula/Frio Fms.
Vicksburg Gp.
Jackson Gp.
Claiborne Gp.
Wilcox Gp.
Midway Gp.
Rio Grande embaymentSan Marcos archEast Texas basin
(Texas)
AGE
EP
OC
H
PE
RIO
D Southeast TexasSouth Louisiana
and offshore(Texas & Louisiana)
Southeast MississippiSouthwest Alabama
West Florida panhandleand offshore
Fleming Fm.
Catahoula/Frio Fms.
Paynes Hammock Fm.Chickasawhay Fm.
Pascagoula Fm.Hattiesburg/Pensacola Fms.
Catahoula Fm.
Undifferentiated Undifferentiated
Undifferentiated Undifferentiated
Carrizo SandCane River Fm.Sparta Sand
Carrizo SandCane River Fm.Sparta Sand
Jackson Gp. Jackson Gp.
Vicksburg Gp. Vicksburg Gp.
Claiborne Gp. Claiborne Gp.
Wilcox Gp. Wilcox Gp.
Midway Gp. Midway Gp.
Chattian
Piacenzian
Calabrian
Zanclean
AquitanianBurdigalianLanghian
SerravallianTortonianMessinian
DanianSelandian
Rupelian
ThanetianYpresian
Lutetian
Priabonian
Bartonian
NE
OG
EN
EPA
LEO
GE
NE
EO
CE
NE
PAL.
OLI
GO
CE
NE
MIO
CE
NE
PLI
OC
EN
E
Anahuac Fm. Anahuac Fm.
Hackberry trend
Frio Clay
Figure 2. Stratigraphic section of the Tertiary and younger strata in the Northern Gulf of Mexico coastal plain showing nomenclature for geographic regions, with the Frio Formation (equivalent to the Catahoula Formation in updip areas) and Anahuac Formation highlighted in blue (modified from Salvador and Quezada Muñeton, 1991; Warwick and others, 2007a). Abbreviations and symbols: Pal., Paleocene; Pleis., Pleistocene; Holoc., Holocene; Quat., Quaternary; jagged line, interfingering; dashed line, uncertain.
6 Geologic Assessment of Undiscovered Oil and Gas Resources—Oligocene Frio and Anahuac Formations
Frio
(incl
udes
Cat
ahou
la, C
hick
asaw
hay
and
Pay
nes
Ham
moc
k; re
fer t
o fig
. 2)
Anah
uac
Olig
ocen
e
Upp
erM
iddl
e
Hac
kber
ry
Low
er
Vick
sbur
g
Mio
cene
PALE
OG
EN
EN
EO
GE
NE
TER
TIA
RY
Upp
erLo
wer
Flem
ing/
Cat
ahou
la
Lenticulina (47) jeffersonensis (Pope and others, 1992) Discorbis (Ewing and Reed, 1984) Discorbis gravelli (New Orleans Geological Society, 1983; Heterostegina sp. ( Het lime) (Goddard and others, 2005; Pope and others, 1992; Ew ing and Reed, 1984) Cibicides jeffersonensis (Pope and others, 1992) Bolivina perca ( Goddard and others, 2005; Pope and others, 1992) Marginulina Zone (Desselle, 1992; Ewing and Reed, 1984; Goddard and others, 2005) Marginulina idiomorpha (Desselle, 1992; Goddard and others, 2005; Pope and others, 1992) Marginulina vaginata (Desselle, 1992; Goddard and others, 2005; Pope and others, 1992)
Marginulina howei (Desselle, 1992; Pope and others, 1992)
Camerina A sp. (Paine and others, 1968; Pope and others, 1992; Goddard and others, 2005) Miogypinoides(A) complanata ( Pope and others, 1992) Miogypsina (Goddard and others, 2005) Cibicides hazzardi (Ewing and Reed, 1984; Paine and others, 1968; Galloway and others, 1991; Pope and others, 1992; Goddard and others, 2005) * ** Marginulina texana (Ewing and Reed, 1984)
Marginulina texana (Paine and others, 1968; New Orleans Geological Society, 1983;
Pope and others, 1992)
Ammobaculites nummus (Ewing and Reed, 1984) Bolivina mexicana (New Orleans Geological Society, 1983 ; Ewing and Reed, 1984; Pope and others, 1992) Gyroidina scalata (Ewing and Reed, 1984 ) Nonion struma (Ewing and Reed, 1984; Goddard and others, 2005)
Nonion struma (Galloway and others, 1991; Pope and others, 1992; Goddard and others, 2005) * Nodosaria blanpiedi Discorbis D sp. Textularia selegi (Pope and others, 1992) Textularia mississippiensis (Ewing and Reed, 1984; Galloway, 1986 ; Pope and others, 1992) Anomalina bilateralis (Galloway, 1986)
(Paine and others, 1968; Ewing and Reed, 1984; Galloway, 1986;Galloway and others, 1991; Goddard and others, 2005; New OrleansGeological Society, 1983; Pope and others, 1992; Warren, 1957)*
(Paine and others, 1968; Pope and others, 1992)
System Series/Epoch Selected Biostratigraphic Horizons for Frio FormationFmSub-
System
Pope and others, 1992)
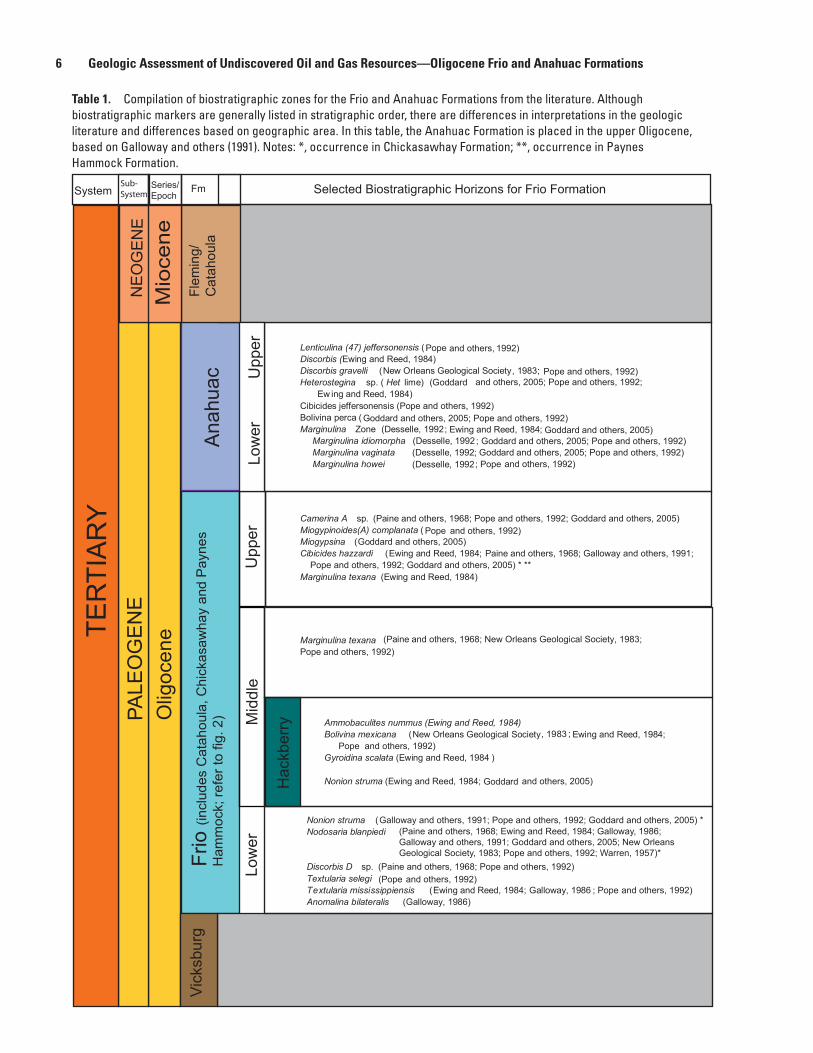
Table 1. Compilation of biostratigraphic zones for the Frio and Anahuac Formations from the literature. Although biostratigraphic markers are generally listed in stratigraphic order, there are differences in interpretations in the geologic literature and differences based on geographic area. In this table, the Anahuac Formation is placed in the upper Oligocene, based on Galloway and others (1991). Notes: *, occurrence in Chickasawhay Formation; **, occurrence in Paynes Hammock Formation.

Geologic Setting of Frio and Anahuac Formations 7
deposition (Bornhauser, 1960; Berg and Powers, 1980; Ewing and Reed, 1984). In most of the Hackberry trend, the lower Hack-berry consists of sand-rich channel-filling units that were eroded as much as 800 ft into the contemporaneous Frio barrier system (Ewing and Reed, 1984). The Hackberry channel-fill sands were deposited in a submarine canyon-fan setting (Paine, 1968, 1971; Berg and Powers, 1980; Ewing and Reed, 1984; Eubanks, 1987; Cossey and Jacobs, 1992; Galloway and others, 2000). Updip areas are described as an area of slope failure involving slide blocks, and downdip areas consist of channels where thick, turbidite sands were deposited (Cossey and Jacobs, 1992) (fig. 7). Shelf-margin slides may have been caused by a combination of salt withdrawal and a generally unstable, muddy shelf edge (Cossey and Jacobs, 1992).
Anahuac FormationThe Frio Formation is overlain by the Anahuac Formation, a transgressive marine shale, in Texas and Louisiana (Galloway
and others, 2000). The Anahuac Formation onlaps the regressive Frio Formation in downdip areas, and it is overlain by the progradational sandstones of the lower Miocene (Galloway and others, 1982, 1991). In the Rio Grande embayment, the updip extent of the Anahuac marine incursion was limited by the influx of coarse sediment, commonly called the Heterostegina and Marginulina sands (Galloway and others, 1982) (table 1). Progradations of the Miocene Oakville Sandstone (south Texas) and equivalent lower part of the Fleming Formation (east Texas) terminated the Anahuac transgression (Galloway and others, 1982) (fig. 2).
LibertyCounty
ChambersCounty
CameronParish
OrangeCounty
Je�ersonCounty
N
Shale
Sandstone
Carbonate
EXPLANATION
A1-A5 = Foraminifera marker horizons
Upper
Middle
Lower
Frio
Fm
Vicksburg Fm
Hackberry
Ammobaculites nummus
Bolivina mexicana
Marginulina texana
Textularia mississippiensis
Textularia warreni
Loxostoma ‘B’ delicata
Discorbis
Heterostegina
Marginulina
Cibicides hazzardi
A1
A2
A3
Nonion struma
Nodosaria blanpiedi
Gyroidina scalataA4
Hackberry
enecoiM
A5
Anahuac Fm
EPO
CH
enecogilO
AGE LITHOLOGY FORAMS
General area ofstratigraphic section
Port Acres �eld
Port Arthur �eld
Bobcat Run South �eld
North Sabine Lake �eld
Texa
sLo
uisia
na
Gulf of Mexico
0 63
0 94.5 Kilometers
Miles
Figure 3. Schematic diagram of the Hackberry trend of the Frio Formation and related strata, Jefferson County area, Texas, and diagnostic foraminifera (modified from Ewing and Reed, 1984). Generalized locations of the Port Arthur, Port Acres, Bobcat Run South, and North Sabine Lake fields are included (Ewing and Reed, 1984; Eubanks, 1987; Zamboras, 1998).

8 Geologic Assessment of Undiscovered Oil and Gas Resources—Oligocene Frio and Anahuac Formations
Bas
e fr
om
U.S
. Geo
log
ical
Su
rvey
Stat
e b
ase
map
, 1:2
,000
,000
Alb
ers
Equ
al-A
rea
Co
nic
pro
ject
ion
Stan
dar
d p
aral
lels
29.
5oN
an
d 4
5.5o
N, c
enta
l mer
idia
n 9
6o00
’W
100°
00’W
98°0
0’W
96°0
0’W
94°0
0’W
92°0
0’W
90°0
0’W
32°0
0’N
30°0
0’N
28°0
0’N
26°0
0’N
'!
EXP
LAN
ATI
ON
060
120
30M
iles
090
180
45Ki
lom
eter
s
!!!
'
'
!!
Gu
eyd
an fl
uvi
al
syst
em
Texas
Mexico
Buna
str
and-
plai
n/
barr
ier s
yste
m
Hac
kber
ry
tren
d
Basi
ns a
nd u
plif
ts
Dep
osit
iona
l sys
tem
s
Hig
h se
dim
ent i
nput
Med
ium
to lo
w s
edim
ent i
nput
Late
Olig
ocen
e sh
elf m
argi
n
Salt
diap
irs a
nd m
assi
fs
Basi
n
Upl
ift
Shor
e-zo
ne
Fluv
ial-d
omin
ated
del
ta
Silic
icla
stic
she
lf
Wav
e-do
min
ated
del
ta
Carb
onat
e sh
elf
Mix
-load
dom
inat
ed �
uvia
l
Prog
rada
tiona
l apr
on
CentralMississippi delta
San Marcos arch
Houston delta
Hou
ston
em
baym
ent
Noria
s del
ta
Burg
osba
sin
Nor
ma
delta
Rio
Gra
nde
emba
ymen
t
Volcanic-sourced sedimentsSa
bine
upl
ift
Sout
h Lo
uisi
ana
Salt
Bas
in
Bed-
load
dom
inat
ed �
uvia
l
Stat
e/in
tern
atio
nal b
ound
ary
Figu
re 4
. Pr
inci
pal s
edim
ent s
ourc
es, b
asin
s an
d up
lift,
and
depo
sitio
nal s
yste
ms
in th
e no
rther
n Gu
lf of
Mex
ico
durin
g th
e la
te O
ligoc
ene
(mod
ified
from
Gal
low
ay a
nd
othe
rs, 2
000)
. Sal
t dia
pirs
and
mas
sifs
als
o ar
e sh
own
(mod
ified
from
Ew
ing
and
Lope
z, 19
91; L
opez
, 199
5; M
artin
, 198
0).

Geologic Setting of Frio and Anahuac Formations 9
Fluvial (aggradational)
Lower delta plain and delta margin (progradational and aggradational)
Delta front (dominantly progradational)
Delta flank and stacked destructional bar (aggradational)
Intraslope basin
Prodelta and upper slope mudstone
EXPLANATION
erux
elf
gru
bskc
iV
Oil m
aturatio
n w
ind
ow
Edge of Vicksburg p
rograd
ational p
latform
0
2000 ft 600 m
Frio flexure
Base of Miocene
30 Kilometers0
20 Miles0
Upper FrioMiddle FrioLower Frio
Top of overpressure (0.7 psi/ft)
WEBB
FRIO
BEEDIMMIT
HIDALGO
ZAVALA
LA SALLE
UVALDE
NUECES
BRAZORIA
ZAPATA
MEDINA
MATAGORDA
LIVEOAK
KLEBERG
GOLIAD
ATASCOSA
BEXAR
DE WITT
CALHOUN
WILSON
MCMULLEN
WHARTONLAVACA
VICTORIAKARNES
JACKSON
REFUGIO
JIMW
ELLS
GONZALES
SANPATRICIO
F O R TB E N D
KENEDY
STARR
JIMHOGG
BROOKS
0 10 20 30 40 Miles
0 25 50 75 100MEXICO
TEXAS
A
A’
A A’
DUVAL
Kilometers
Approximate top and base of hydrocarbon liquid window
Figure 5. Stratigraphic dip section through the Gueydan fluvial system and Norias delta system in south Texas (modified from Galloway and others, 1982). The cross section is part of a study of several hundred wells, which were used in the preparation of facies maps that formed the basis for further interpretation of depositional systems (Galloway and others, 1982). Overpressure is defined as 0.7 pound per square inch per foot (Galloway, 1984).

10 Geologic Assessment of Undiscovered Oil and Gas Resources—Oligocene Frio and Anahuac Formations
Basin floor fan
Hackberry slope system
Basinal turbidite
Submarine canyon
NORTH
SOUTH
Houston delta system Buna barrier system
Approximate location of “Hartburg flexure” zone
= Direction of sediment transport
Slope channel
Figure 6. Paleogeographic reconstruction of Buna and Hackberry depositional environments in southeastern Texas (modified from Tyler, 1987).
Figure 7. Generalized depositional environments of the Hackberry trend and production fields within western Calcasieu Parish (modified from Cossey and Jacobs, 1992), with approximate location of “Hartburg flexure” (as described by Eubanks, 1987).
0
N
Salt domes and ridges
Slumped fault blocks
Sandy channel-fill
Sandy fault-block fill
Hackberry hydrocarbon fields
Hackberry shelf
5 MIles
Hackberry shelf
Slumped faultblocks
FillFill
36o00’
36o10’
36o20’
93o40’ 93o30’ 93o20’
Calcasieu Parish
Cameron Parish
Hackberry play
Louisiana
Texas
Gulf of Mexico
Enlarged area
State line
Slumped faultblocks
Pre-Hackberry sediments
EXPLANATION
Approximate location of “Hartburg flexure”

Geologic Setting of Frio and Anahuac Formations 11
Anahuac Formation strata of southwestern Louisiana and Texas are nearly identical and consist of light- to dark-greenish-gray calcareous shale that is interbedded with thin beds of locally calcareous sandstone and limestones (John and others, 1992a). Anahuac sediments become more calcareous from west to east (John and others, 1992a). Carbonate rocks are present in the eastern Gulf of Mexico, where clastic influx was minimal (Galloway and others, 2000). Limestones and calcareous clastics dominate in Anahuac rocks of the eastern part of Louisiana, whereas the western and central parts of Louisiana consist mostly of shales and sandstones (Krutak and Beron, 1990). Petrographic analyses in carbonates from above and below the Heterostegina Zone (table 1) indicate the presence of hermatypic framework and binding organisms that built reefal or algal-mound accumula-tions along a late Oligocene to early Miocene shelf edge in nearshore waters of southeastern Louisiana and western Mississippi (Krutak and Beron, 1990, 1993). At the climax of the late Oligocene transgressive flooding, Heterostegina carbonate buildups in the Anahuac Formation occurred as far west as the Houston salt basin and Rio Grande embayment (Galloway and others, 2000; Treviño and others, 2003).
John and others (1992a) identified three depositional systems of the Anahuac Formation in south-central and southwestern Louisiana, based on relative amounts of sandstone and shale within the section and the character of these sandstones: proxi-mal deltaic, distal deltaic, and slope environments (fig. 8). Goddard and others (2005) report that the Anahuac has an average thickness of 750 ft in localities of southern Louisiana and that the uppermost Heterostegina strata contain calcareous sandstone and limestone beds. These sedimentary features suggest that deposition occurred in an inner-shelf, shallow-marine depositional environment (Goddard and others, 2005). Interbedded shales and calcareous sandstones underlying the Heterostegina zone are typical of middle-shelf (intermediate open-marine) environments (Tipsword and others, 1966; Goddard and others, 2005). Progradational distal delta-front sandstones, shore-face, and shelf sandstones of the Anahuac Formation also are present in the Mustang Island and Matagorda Island areas in Texas (Desselle, 1997a, b) (fig. 8).
91°0'W92°0'W93°0'W94°0'W95°0'W96°0'W97°0'W98°0'W
30°0
'N29
°0'N
28°0
'N27
°0'N
26°0
'N
0 80 16040 Kilometers
0 60 12030 Miles
Frio barrier/strandplain and slope sandstone2
Frio-Anahuac deltaic/slope sandstone1
Frio deltaic sandstone2
Frio fluvial/deltaic sandstone2
Proximal Frio deltaic sandstone2
Frio delta-flank shoreline sandstone2
Distal Frio deltaic sandstone2
Frio-Anahuac progradational shoreface and shelf sandstone4
Frio-Anahuac progradational distal delta-front sandstone4
Updip Frio barrier/strandplain sandstone2,3
Frio fluvial/coastal-plain sandstone2
Downdip Frio barrier/strandplain sandstone2,3
Mexico
Louisiana
Gulf
of
Mexico
Texas
Vicksburg
fault
zone
EXPLANATION
San Marcos arch
Louisana Gulf Coast
Hackberry trend
Rio Grande embayment
Mustang Island and Matagorda Island area
Houston embayment
Figure 8. Generalized locations of hydrocarbon plays (including depositional environments) for the Frio and Anahuac Formations, as reported in the literature. Footnotes: 1John and others (1992a, b, c, d); 2Kosters and others (1989); 3Galloway and others (1983); 4Desselle (1997a, b).

12 Geologic Assessment of Undiscovered Oil and Gas Resources—Oligocene Frio and Anahuac Formations
Structural Features
During the Tertiary, large quantities of sand and mud were deposited along the margins of the Gulf of Mexico, and these sediments accumulated in a series of wedges that thicken and dip gulfward (Bebout and others, 1978). As a result of rapid sedi-ment loading, large growth-fault systems formed near the downdip edge of each sediment wedge within the area of maximum deposition (fig. 9) (Galloway and others, 1982). Bebout and others (1978) suggested that deeper, thick Jurassic salt was mobi-lized into a series of ridges and troughs.
Winker (1982) related growth faulting and rapid subsidence of Cenozoic shelf margins in the northwestern Gulf to large-scale, deep-seated gravity sliding of the continental slope. In this model, shelf-margin deltas were described as a function of sediment supply rather than sea-level fluctuation (Winker, 1982). Brown and others (2004) described deposition during relative lowstands of sea level as the main initiator of growth faulting in the Frio Formation. In their interpretation, lowstand depocen-ters resulted in gravity stresses that were sufficient to trigger the collapse of major sections of the outer continental shelf so that upper slope strata failed and moved basinward. Brown and others (2004) suggested that a series of subbasins developed as a result of this process, each with the potential of forming petroleum reservoirs (fig. 10). In a study of the shallow Frio Formation between the Houston and Norias deltas of the south Texas Gulf Coast, Ogiesoba and Hammes (2012) suggested that the shallow Frio Formation collapsed during a basinwide sea level fall that occurred between approximately 27.5 and 25.3 Ma, at approxi-mately the same time that the Hackberry collapse occurred in the Mississippi delta.
In Texas, three major structural provinces are defined for the Frio (fig. 4): (1) the Houston embayment, characterized by salt diapirism and associated faulting (Galloway and others, 1982); (2) the San Marcos arch and the area southward towards the Rio Grande embayment, where underlying salt mostly is absent and long, linear belts of growth faults and associated shale ridges and shale diapirs are dominant (Galloway and others, 1982; Bruce, 1973); and (3) the Rio Grande embayment, where large, but more discontinuous, belts of growth faults and deep-seated shale ridges and massifs are present (Galloway and others, 1982).
A major deltaic progradation in south Texas and northern Mexico in the early Oligocene created the Vicksburg fault zone (Stanley, 1970; Ewing, 1991a, b), a fault zone (about 20 miles (mi) wide) characterized by vertical displacement of the underly-ing section (Galloway and others, 1982) (figs. 9 and 11). The Vicksburg fault zone, or flexure, forms the updip limit of signifi-cant structural deformation of the Frio Formation (Loucks, 1978; Galloway and others, 1982). On the basis of a study of 1,100 well logs, Combes (1993) indicated that the Vicksburg fault zone extends from the Rio Grande embayment in south Texas to western Louisiana. The Frio fault zone, which is downdip of the Vicksburg fault zone, is a broad, deep listric system that con-sists of 5 to 10 major normal faults spaced 5 to 10 kilometers (km) apart (3 to 6 mi apart), with intervening rollover anticlines (Ewing, 1991a).
High-resolution cross sections by Galloway and others (1994) in south Texas, which are based on closely spaced well logs in addition to regional seismic data, demonstrate that the thickening and displacement of Frio sediments are significantly greater in the Frio fault zone than in the Vicksburg fault zone (fig. 11). Thickening and vertical displacement of the Frio in the Frio fault zone is evident in cross sections constructed by Dodge and Posey (1981). Moreover, Radovich and Moon (2007), in a study of a seismic line composite spanning from onshore to deep water, demonstrated that Oligocene sediments greatly expanded and filled the accommodation space created by slip along growth faults.
Upper Jurassic-Cretaceous-Tertiary Composite Total Petroleum System
Total Petroleum System Model
The assessment of undiscovered, technically recoverable conventional oil and gas resources and continuous coal-bed gas resources in Paleogene and Neogene strata underlying the U.S. Gulf of Mexico Coastal Plain and State waters was conducted by using a TPS model. A TPS consists of all genetically related petroleum generated by a pod or closely related pods of mature source rocks (Schmoker and Klett, 2004). A TPS also includes all of the important elements of a hydrocarbon fluid system needed to develop oil and gas accumulations, including source and reservoir rocks, hydrocarbon generation, migration, traps, seals, and discovered and undiscovered hydrocarbon accumulations (Klett and others, 2004). An assessment unit (AU) is a map-pable volume of rock within a TPS that encompasses discovered and undiscovered fields that share similar geologic character-istics and economics (Klett and others, 2004). The type of undiscovered hydrocarbon accumulations, discrete (conventional) or continuous-type (unconventional), determines the methodology to be used in a USGS assessment (Schmoker, 2005). All of the AUs identified for the Frio and Anahuac Formations were assessed as conventional hydrocarbon accumulations.

Upper Jurassic-Cretaceous-Tertiary Composite Total Petroleum System 13
Mile
sSe
a Le
vel
0 2 4 6 8 10
Mo
stly
ove
rpre
ssu
red
sh
ale
Jurr
asic
Salt
Low
er C
reta
ceo
us
and
Ju
rass
ic
Up
per
Ju
rass
ic
Slig
ore
ef
Low
erC
reta
ceo
us
Up
per
Cre
tace
ou
s
Pale
oce
ne-
Low
er E
oce
ne
(Wilc
ox) St
uar
t C
ity
reef
Pale
ocen
e an
d Lo
wer
Eoce
ne (W
ilcox
)
Mid
dle
Eoce
ne
Neo
gen
eO
ligo
cen
e
Up
per
Eo
cen
eM
idd
le E
oce
ne
U. E
oce
ne
Mio
cen
eU
pp
er O
ligo
ene
(Fri
o)
Up
per
O
ligo
cen
e(F
rio
)
Top
of b
asem
ent
Low
erM
ioce
ne
Up
per
Mio
cen
ePl
ioce
ne
and
Qu
ater
nar
y
Mid
-Mio
.
WILCOXFA
ULT
ZONE
Vick
sbur
gfa
ult
zone
Frio
faul
tzo
ne
?
Nor
thw
est
Sout
heas
t
DD
’’
0 0
1020
Kilo
met
ers
EXPL
AN
ATI
ON
Faul
t; ar
row
indi
cate
s re
lativ
e m
ovem
ent
Form
atio
n/st
ratig
raph
ic b
ound
ary;
da
shed
whe
re in
ferr
ed
Rio
Gra
nde
emba
ymen
t
Gul
f of
Mex
ico
TEX
AS
D
D‘
D“
Exte
nt
of A
nah
uac
Oil
and
Gas
AU
Exte
nt
of F
rio
Exp
and
ed F
ault
Zo
ne
Oil
and
Gas
AU
Exte
nt
of F
rio
Sta
ble
Sh
elf O
il an
d G
as A
U
D’
10 M
Iles
An
ahu
ac
Low
er O
ligo
cen
e(V
icks
bu
rg)
Frio
Figu
re 9
. Sc
hem
atic
cro
ss s
ectio
n th
ough
cen
tral T
exas
from
the
early
Cre
tace
ous
shel
f mar
gin
to th
e pr
esen
t she
lf m
argi
n, s
how
ing
grow
th fa
ults
, th
e Vi
cksb
urg
and
Frio
faul
t zon
es (m
odifi
ed fr
om E
win
g, 1
991a
, b),
and
the
exte
nt o
f ass
essm
ent u
nits
(AU)
(ref
er to
“As
sess
men
t Uni
ts”
sect
ion
for
disc
ussi
on).
Frio
and
Ana
huac
For
mat
ions
are
hig
hlig
hted
in g
reen
and
yel
low
, res
pect
ivel
y. F
ault
zone
s ar
e ba
sed
on E
win
g an
d ot
hers
(199
0). U
pdip
Fr
io (g
reen
) inc
lude
s th
e up
dip
Vick
sbur
g Gr
oup.

14 Geologic Assessment of Undiscovered Oil and Gas Resources—Oligocene Frio and Anahuac Formations
Figure 10. Simplified schematic cross section showing formation of successive growth-faulted subbasins, modified from Brown and others (2004). In their model, each subbasin is filled with genetically similar but diachronous depositional systems. The rotation of hanging-wall blocks mobilized deep-water muds (red arrows), which forced the muds basinward and upward to form shale ridges. Brown and others (2004) reported that these subbasins have been prolific petroleum targets for decades and are the focus of prospecting for deep gas.
56
4321
Sequ
ence
s
Landward Active Delta Plain Basinward
2 MILES
ft
00
200m
2 KILOMETERS
Approximate Scale
1000
EXPLANATION? ?
Transgressive systems tract
Highstand systems tract
Lowstand systems tract–prograding wedge
Lowstand systems tract–toe-of-slope
Lowstand systems tract–basin-floor fan or incised slope fan
Lowstand systems tract–prior to sequence 1
Mobilized deepwater sediments
Lowstand systems tract--slope fan
Lowstand systems tract–incised-valley fill
SYSTEM TRACTS
?
Toe-of-slope fans
Lowstand basin-floorfan and channel fill
Growth faultMovement of sediments
Growth fault extent unknown
Lowstand prograding delta wedges and toe-of-slope fans (shingled turbidites)
Highstand and lowstand prograding delta-front facies
Lowstand slope fan and channel fill
Distributary channel fill–Lowstand and highstand delta systems Lowstand incised-valley channel fill
OTHER SYMBOLS

Upper Jurassic-Cretaceous-Tertiary Composite Total Petroleum System 15
Vic
ksb
urg
Fa
ult
Zo
ne
?
Frio
Fau
lt Z
on
e
Frio
an
d V
icks
bu
rg F
orm
atio
ns
AA
’
Top
of F
rio
/V
icks
bu
rg
seq
uen
ce
bo
un
dar
y
Top
of J
acks
on
se
qu
ence
bo
un
dar
y
Extr
abas
inal
fluvi
al s
yste
m
Stre
am-p
lain
sys
tem
Del
ta s
yste
m
Sho
rezo
ne
syst
em
Shel
f an
d o
ffla
psl
op
e sy
stem
s
Gen
etic
str
atig
rap
hic
seq
uen
ce b
ou
nd
arie
s
Figu
re 1
1.
Cros
s se
ctio
n of
the
Frio
For
mat
ion
show
ing
thic
keni
ng a
nd v
ertic
al d
ispl
acem
ent i
n th
e Vi
cksb
urg
and
Frio
faul
t zon
es in
sou
th T
exas
(mod
ified
fro
m G
allo
way
and
oth
ers,
199
4; p
ositi
onin
g of
Vic
ksbu
rg a
nd F
rio F
ault
zone
s ba
sed
on E
win
g an
d ot
hers
, 199
0). C
ross
sec
tions
by
Gallo
way
and
oth
ers
(199
4) a
re b
ased
on
clos
ely
spac
ed w
ell l
ogs
and
regi
onal
sei
smic
dat
a.
16 Geologic Assessment of Undiscovered Oil and Gas Resources—Oligocene Frio and Anahuac Formations
Source Rocks
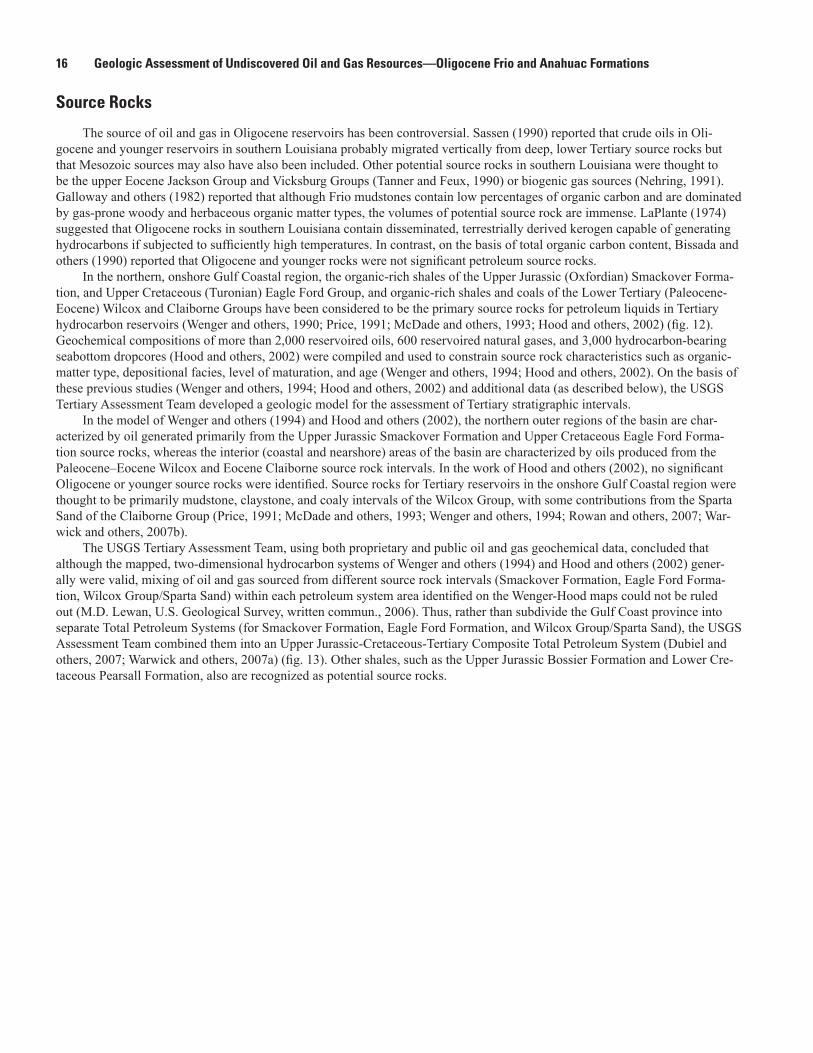
The source of oil and gas in Oligocene reservoirs has been controversial. Sassen (1990) reported that crude oils in Oli-gocene and younger reservoirs in southern Louisiana probably migrated vertically from deep, lower Tertiary source rocks but that Mesozoic sources may also have also been included. Other potential source rocks in southern Louisiana were thought to be the upper Eocene Jackson Group and Vicksburg Groups (Tanner and Feux, 1990) or biogenic gas sources (Nehring, 1991). Galloway and others (1982) reported that although Frio mudstones contain low percentages of organic carbon and are dominated by gas-prone woody and herbaceous organic matter types, the volumes of potential source rock are immense. LaPlante (1974) suggested that Oligocene rocks in southern Louisiana contain disseminated, terrestrially derived kerogen capable of generating hydrocarbons if subjected to sufficiently high temperatures. In contrast, on the basis of total organic carbon content, Bissada and others (1990) reported that Oligocene and younger rocks were not significant petroleum source rocks.
In the northern, onshore Gulf Coastal region, the organic-rich shales of the Upper Jurassic (Oxfordian) Smackover Forma-tion, and Upper Cretaceous (Turonian) Eagle Ford Group, and organic-rich shales and coals of the Lower Tertiary (Paleocene-Eocene) Wilcox and Claiborne Groups have been considered to be the primary source rocks for petroleum liquids in Tertiary hydrocarbon reservoirs (Wenger and others, 1990; Price, 1991; McDade and others, 1993; Hood and others, 2002) (fig. 12). Geochemical compositions of more than 2,000 reservoired oils, 600 reservoired natural gases, and 3,000 hydrocarbon-bearing seabottom dropcores (Hood and others, 2002) were compiled and used to constrain source rock characteristics such as organic-matter type, depositional facies, level of maturation, and age (Wenger and others, 1994; Hood and others, 2002). On the basis of these previous studies (Wenger and others, 1994; Hood and others, 2002) and additional data (as described below), the USGS Tertiary Assessment Team developed a geologic model for the assessment of Tertiary stratigraphic intervals.
In the model of Wenger and others (1994) and Hood and others (2002), the northern outer regions of the basin are char-acterized by oil generated primarily from the Upper Jurassic Smackover Formation and Upper Cretaceous Eagle Ford Forma-tion source rocks, whereas the interior (coastal and nearshore) areas of the basin are characterized by oils produced from the Paleocene–Eocene Wilcox and Eocene Claiborne source rock intervals. In the work of Hood and others (2002), no significant Oligocene or younger source rocks were identified. Source rocks for Tertiary reservoirs in the onshore Gulf Coastal region were thought to be primarily mudstone, claystone, and coaly intervals of the Wilcox Group, with some contributions from the Sparta Sand of the Claiborne Group (Price, 1991; McDade and others, 1993; Wenger and others, 1994; Rowan and others, 2007; War-wick and others, 2007b).
The USGS Tertiary Assessment Team, using both proprietary and public oil and gas geochemical data, concluded that although the mapped, two-dimensional hydrocarbon systems of Wenger and others (1994) and Hood and others (2002) gener-ally were valid, mixing of oil and gas sourced from different source rock intervals (Smackover Formation, Eagle Ford Forma-tion, Wilcox Group/Sparta Sand) within each petroleum system area identified on the Wenger-Hood maps could not be ruled out (M.D. Lewan, U.S. Geological Survey, written commun., 2006). Thus, rather than subdivide the Gulf Coast province into separate Total Petroleum Systems (for Smackover Formation, Eagle Ford Formation, and Wilcox Group/Sparta Sand), the USGS Assessment Team combined them into an Upper Jurassic-Cretaceous-Tertiary Composite Total Petroleum System (Dubiel and others, 2007; Warwick and others, 2007a) (fig. 13). Other shales, such as the Upper Jurassic Bossier Formation and Lower Cre-taceous Pearsall Formation, also are recognized as potential source rocks.

Upper Jurassic-Cretaceous-Tertiary Composite Total Petroleum System 17
Figure 12. Map showing interpretation of the extent of oils and gases sourced from source rock intervals, based on oil geochemistry characteristics of source rock extracts (adapted from Wenger and others, 1994; Hood and others, 2002). The map indicates the source rock age and depositional environments (marine, intermediate, terrestrial, lacustrine) for the predominant oil type produced in a given area. “Intermediate” denotes a depositional environment intermediate between marine and terrestrial environments. Upper Jurassic (Oxfordian) includes Smackover Formation source rocks, Uppermost Jurassic (Tithonian) includes Bossier Formation source rocks, Lower Cretaceous (centered on Aptian) includes the Pearsall Formation, Upper Cretaceous (centered on Turonian) includes Eagle Ford Group source rocks, and Lower Tertiary (centered on Paleocene and Eocene) includes Wilcox Group and Claiborne Group (Sparta Sand) source rocks.
2
2
8
8
6
1
1
8
3
4
3
7
0
7
1+2
0
0
1+6
1+3
1+3
3+7
3+7 3+71+3
8+9
1+2
6+8
7+9 8+9
Source rock age and depositional environment for predominant oil type:
3 + 7
0 90 18 045 Miles
0 17 0 34 085 Kilometers
30°N
35°N
85°W90°W95°W100°W
6 + 8
7 + 9
8 + 9
1 + 2 1 + 3 1 + 6
0 = Not designated
8+9
1 = Lower Tertiary (centered on Eocene) marine and intermediate
2 = Lower Tertiary (centered on Eocene), terrestrial3 = Upper Cretaceous (centered on Turonian), low-sulfur marine
4 = Upper Cretaceous (centered on Turonian) and Lower Cretaceous (centered on Aptian) moderate-sulfur, calcareous
6 = Uppermost Jurassic (centered on Tithonian) moderate- to high-sulfur marine
7 = Upper Jurassic or Lower Cretaceous? marine
8 = Upper Jurassic (Oxfordian) carbonate, elevated-salinity
9 = Triassic (Eagle Mills) lacustrine
EXPLANATION

18 Geologic Assessment of Undiscovered Oil and Gas Resources—Oligocene Frio and Anahuac Formations
011
022
055
Mile
s
016
032
080
Kilo
met
ers
100o 0’
W98
o 0’W
96o 0’
W94
o 0’W
92o 0’
W90
o 0’W
88o 0’
W86
o 0’W
36o 0’
N
34o 0’
N
32o 0’
N
30o 0’
N
28o 0’
N
26o 0’
N
EXPL
AN
ATIO
N
Gul
f of M
exic
o TP
S
Regi
on 6
pro
vinc
es
Stat
es
A
B
C
Figu
re 1
3.
Uppe
r Jur
assi
c-Cr
etac
eous
-Ter
tiary
Com
posi
te T
otal
Pet
role
um S
yste
m (T
PS) f
or th
e Gu
lf of
Mex
ico
basi
n, w
ithin
are
as a
sses
sed
by th
e US
GS fo
r Ter
tiary
stra
tigra
phic
inte
rval
s (m
odifi
ed fr
om W
arw
ick
and
othe
rs, 2
007a
). Th
e le
tters
A–C
refe
r to
the
follo
win
g no
tes
on h
ow th
e TP
S bo
unda
ry li
ne w
as d
raw
n: A
incl
udes
bot
h M
aver
ick
and
Sabi
nas
basi
ns, w
hich
hav
e Gu
lf of
Mex
ico
basi
n so
urce
and
rese
rvoi
r roc
k (E
guilu
z de
Antu
ñano
, 200
1; S
cott,
200
3); B
coi
ncid
es w
ith th
e Up
per-
Low
er C
reta
ceou
s ou
tcro
p bo
unda
ry (S
chru
ben
and
othe
rs, 1
998)
; thi
s lin
e m
ay b
e so
mew
hat a
rbitr
ary
as th
e ar
ea m
ay in
clud
e so
me
Inte
rior P
latfo
rm P
aleo
zoic
-der
ived
oil
that
has
mig
rate
d in
to C
reta
ceou
s re
serv
oirs
and
is n
ot p
art o
f the
Gul
f of M
exic
o TP
S;
C, M
issi
ssip
pi e
mba
ymen
t, in
clud
es T
ertia
ry a
nd C
reta
ceou
s co
al b
eds
as p
oten
tial s
ourc
es o
f bio
geni
c ga
s, a
lthou
gh th
ere
is n
o kn
own
hydr
ocar
bon
prod
uctio
n fro
m th
is a
rea.
The
TPS
ou
tline
in th
is a
rea
is b
ased
on
outc
rop
exte
nts
in F
renc
h an
d Sc
henk
(200
5).

Upper Jurassic-Cretaceous-Tertiary Composite Total Petroleum System 19
Maturation of the Wilcox Group
Because source rocks for Tertiary reservoirs in the onshore Gulf Coastal region are thought to be primarily mudstone, claystone, and coaly intervals of the Wilcox Group, the following discussion focuses on the Wilcox, summarizing work by Rowan and others (2007). For the Tertiary Assessment, regional thermal maturity data were obtained from the literature, and new samples were collected and analyzed from the Wilcox Group to improve definitions of source rock maturity and distribu-tion (Warwick, 2006; Rowan and others, 2007). Total organic carbon (TOC) data obtained from more than 1,000 outcrop and drill-hole samples indicated that the non-coaly Wilcox samples (< 10 percent TOC) average about 1.4 percent TOC (Rowan and others, 2007; Warwick and others, 2007a). Wilcox vitrinite reflectance (Ro) values based on about 450 samples range from about 0.3 percent updip near the outcrop to more than 2.4 percent at depths greater than 25,000 ft in south Texas (Rowan and oth-ers, 2007; Warwick and others, 2007a). Locally, Ro values exceed 4.0 percent in south Texas (Dow and others, 1988), possibly because of updip fluid migration along faults. Regional trends in the Ro data suggest that gradients of Wilcox maturity versus depth are not as steep in the northeastern part of the basin (Louisiana and Mississippi) as they are in the southwest (Texas), thereby implying a general increase in Wilcox maturity towards the south (Rowan and others, 2007). These Ro data were used to calibrate burial-history models, which constrain the oil and gas generating capacity of Wilcox source rocks in the northern part of Gulf of Mexico basin (Rowan and others, 2007; Warwick and others, 2007a).
Rowan and others (2007) reconstructed the thermal maturation history of the Paleocene–Eocene Wilcox Group based on burial history models of 53 wells in the Texas coastal plain (figs. 14 A–E). In their study, the Wilcox Group was modeled as a single unit, without subdivision into source-rock and non-source-rock intervals. Generation of oil from Type III kerogen within the Wilcox Group was modeled by using hydrous pyrolysis reaction kinetic parameters (M.D. Lewan, U.S. Geological Survey, written commun., 2006). Gas generation from Type III kerogen was represented by using calculated Ro values, in accordance with the approach described in Roberts and others (2004). The models were calibrated with bottomhole temperature (BHT) and %Ro data for the Wilcox Group. Ro data from near-coastal sites were selected to minimize the possible effects of uplift and ero-sion, then composited to give a regional Ro-depth trend (Rowan and others, 2007).
Results of the modeling study indicated that downdip portions of the basal Wilcox reached sufficient thermal maturity to generate hydrocarbons by early Eocene (≈50 Ma) (Rowan and others, 2007) (figs. 14 A–E). This relatively early maturation is explained by rapid sediment accumulation in the early Tertiary combined with the reaction kinetic parameters used in the models. Thermal maturation increased through time with increasing burial depth and temperature, gradually moving the matura-tion front updip. At present day, hydrocarbon generation is complete in the downdip Wilcox within the Gulf Coastal Plain and State waters but is ongoing in the updip portions of the formation (Rowan and others, 2007). In addition, oil has cracked to gas (Rowan and others, 2007).
Gas washing also may have occurred in the Frio and Anahuac Formations. As described by Tissot and Welte (1984), gaseous and very light hydrocarbons can migrate out of the overpressured zone more easily than heavier hydrocarbons and nonhydrocarbons, resulting in lighter hydrocarbons on their way upward extracting heavier compounds and carrying them along. Gas washing also has been described as gas influx into an oil field that strips soluble components and leaves heavier oil behind (Krooss and others, 1991; Blanc and Connan, 1994).

20 Geologic Assessment of Undiscovered Oil and Gas Resources—Oligocene Frio and Anahuac Formations
4
3
2
1
ft km
Dept
h be
low
sea
leve
l
10,000
15,000
5000
0
Time (Ma)02040 3060 1050
Model Units
VicksburgJackson
Claiborne
Wilcox
PleistocenePlioceneU. Miocene
L. MioceneM. Miocene
Ro = 0.5%
TR = 99%
TR = 50%
TR = 1%
Frio
Well 3-10
5
4
3
1
2
6
7 Well 3-12
Time (Ma)02040 3060 1050
ft km
10,000
15,000
20,000
24,000
5000
0Model Units
VicksburgJackson
Claiborne
Wilcox
PleistocenePlioceneU. Miocene
L. MioceneM. Miocene
Ro = 0.5%
TR = 99%
TR = 50%
TR = 1%
Frio
Ro = 2.0%
Well 10-10
Time (Ma)02040 3060 1050
5
4
6
15,000
20,000
ft km
3
1
2
0
5000
10,000
Model Units
VicksburgJackson
Claiborne
Wilcox
PleistocenePlioceneU. Miocene
L. MioceneM. Miocene
Frio
Ro = 0.5%TR = 1%
TR = 50%TR = 99%
Ro = 2.0%
Time (Ma)02040 3060 1050
4
15,000
ft km
3
1
2
0
5000
10,000
Model Units
Vicksburg
Jackson
Claiborne
Wilcox
(L. Miocene)
Frio
Ro = 0.5%TR = 1%
TR = 50%
TR = 99%
WELL 21-13
A B
C D
Dept
h be
low
sea
leve
l
Dept
h be
low
sea
leve
lDe
pth
belo
w s
ea le
vel
Figure 14. Tertiary burial-history curves for four wells where Ro and bottomhole temperature (BHT) data were available (from Rowan and others, 2007). The green shaded area represents the oil window for the Wilcox, defined by transformation ratios. The onset, peak, and end of oil generation in the Wilcox are represented by 1-, 50-, and 99-percent transformation ratio (TR) curves, respectively. The 0.5- and 2.0-percent Ro contours, respectively, represent the onset and end of gas generation from Type III kerogen. A, Well 3-10. B, Well 3-12. C, Well 10-10. D, well 21-13. E, Well locations.

Upper Jurassic-Cretaceous-Tertiary Composite Total Petroleum System 21
Migration
Both lateral and vertical migration pathways have been suggested for hydrocarbon accumulations in the Gulf Coast (fig. 15). A number of studies indicated that migration of oil and gas in the Cenozoic Gulf of Mexico basin primarily is vertical, occurring along abundant growth faults associated with sediment deposition or along faults associated with salt domes (Dow, 1984; Sassen, 1990; Nehring, 1991; Price, 1991; Schenk and Viger, 1996). There are several lines of evidence that support vertical migration from deeply buried source rocks. Because deep Oligocene shales in southwestern Louisiana are characterized by low TOC values and are thermally immature for oil generation, even at a total depth of about 15,718 ft (4,791 m) (Bayliss and Hart, 1981), they are not likely to be the source rocks for Oligocene to Pleistocene reservoirs in this region (Sassen, 1990). Crude oils in the south Louisiana salt dome basin (fig. 4) usually are found in structural traps associated with salt domes. Verti-cal migration from more deeply buried and thermally mature source rocks best explains their origin (Sassen, 1990), and vertical migration could have started along fractures in deep, overpressured shales and continued along fault conduits in the shallower hydropressured zone (Curtis, 1989; Hanor and Sassen, 1990). Echols and others (1994) suggested that vertical migration of hydrocarbons in northeast and central Louisiana, and in southwest Mississippi, may have been accomplished primarily though fracture systems. In areas to the south and west of this area, salt tectonics and related normal faulting may have played signifi-cant roles (Echols and others, 1994). On the basis of production, geochemical, and geologic evidence, Echols and others (1994) argued against long-range lateral migration as a method for moving large quantities of hydrocarbons into Tertiary reservoirs in east-central Louisiana and southwest Mississippi.
E
10-10
Well
3-12
3-10
21-13
0 50 10025 Miles
0 50 10025 Kilometers
Lower Cretaceous s
helf edge
100°W 98°W 96W° 94W°
30°N
26°N
28°N
EXPLANATION
Figure 14.—Continued

22 Geologic Assessment of Undiscovered Oil and Gas Resources—Oligocene Frio and Anahuac Formations
However, there also is evidence supporting lateral migration pathways. For example, because the Wilcox in southwestern Mississippi and north-central Louisiana lacks source potential and is thermally immature, Sassen and others (1988) suggested that the best explanation for emplacement of Wilcox crude oils in this area is by long-range lateral migration from thermally mature source rocks downdip. Maximum migration distances from mature source rocks to updip reservoirs could be as much as 150 km (Sassen, 1990). Dip-oriented intervals of thick sandstone largely unbroken by faulting could have served as conduits for long-range oil migration (Sassen, 1990). Wescott and Hood (1994) also invoked long-range lateral migration of hydrocarbons to charge reservoirs in the East Texas salt basin. Although impermeable barriers, such as evaporites, carbonates, and shales, may have helped to trap crude oil within limited volumes of reservoir rock and retard dispersal into adjacent stratigraphic units, these types of barriers have not always barred vertical migration (Sassen and Moore, 1988).
0 50 100 Kilometers
SL
1
2
3
4
5
6
7
Dept
h (k
m)
A A’N S
Lower Cretaceous
Upper CretaceousJurassic
Smackover
Eagle FordMidway
Wilcox
Sparta
Eocene Oligocene
Miocene
Pliocene–Pleistocene
±A
A’
LOUISIANA MISSISSIPPI
TE
XA
S
0 50 Miles
0 50 Kilometers GULF OF MEXICO
ARKANSAS
EXPLANATION
Salt
Fault
Effective source rocks
Oil migration
Gas migration
Figure 15. Cross section showing general model for onshore source rocks and migration pathways (M.D. Lewan, U.S. Geological Survey, written commun., 2006; modified from Sassen, 1990). SL, sea level.

Reservoir Rocks 23
Reservoir Rocks
Frio Formation
Exploration for hydrocarbons within the Frio Formation has reached a mature to supermature stage (Nehring, 1991). Four major Frio trends in the Gulf of Mexico basin have many similarities in depositional environment, reservoir characteristics, and trap types (Nehring, 1991). In this report, “trends” refers to production trends, which are defined by a number of factors impor-tant for petroleum accumulation, including reservoir, trap, seal, and source (Nehring, 1991). The south Texas-Burgos basin Frio trend consists of fluvial depositional environments updip and deltaic environments downdip (fig. 8). Reservoir quality varies greatly in this area (Nehring, 1991; see “Porosity and Permeability” section in this report). Trapping of hydrocarbons largely is structural and is a result of regional growth faulting and shale ridges (refer to “Traps and Seals” section). The Frio trend in the San Marcos arch area, which separates major Frio deltaic depocenters in south Texas (Norias and Norma deltas) from the Houston embayment, consists of an updip stream-plain environment and a downdip strandplain/barrier-island environment (Nehring, 1991). Reservoir quality is moderate to good in this area, with porosities of 20 to 26 percent and permeabilities of 25 to 2,500 md (Nehring, 1991). Trapping largely is structural, determined by growth faults and shale ridges. The Houston embay-ment Frio trend encompasses the second major Frio depocenter, which consists of a fluvial deltaic system with sediments that originated in the southern Rocky Mountains (Nehring, 1991). Reservoir quality generally is good to excellent in this depocenter (porosities of 16 to 36 percent; permeabilities of 50 to 3,000 md), and trapping largely is controlled by growth faults and salt structures (Nehring, 1991). The south Louisiana Frio trend contains a range of depositional environments, including strandplain, barrier bar, and Hackberry trend submarine channel sands in southwestern Louisiana (Nehring, 1991). Fluvial-deltaic sediments derived from the ancestral Mississippi River are to the east. The south Louisiana Frio trend is the deepest of all Frio trends, with reservoir depths that range from about 5,250 to 16,800 ft (Nehring, 1991). Reservoir quality is good to excellent, with porosities ranging from 20 to 35 percent and permeabilities ranging from 50 to 2,500 md.
Nehring (1991) reported that the Frio Formation, including the Anahuac Formation, is the largest producer of hydrocarbons from the Paleogene in the Gulf of Mexico. In the following discussion, the term “play” is used to classify reservoirs into geo-logically similar groups, to allow for easy comparison of reservoir characteristics and major producing trends (refer to Kosters and others, 1989). According to Nehring (1991), the largest Frio trend is a gas and liquid petroleum play in south Texas and in the Burgos basin of Mexico. Another large oil and gas trend in the Frio is in the Houston embayment (Nehring, 1991). The “Frio Fluvial/Deltaic Sandstone along the Vicksburg Fault Zone, Texas Gulf Coast” play is reported to be the largest onshore gas play of the Texas Gulf Coast (11.8 trillion cubic feet of gas (TCFG); Kosters and others, 1989) (fig. 8). As reported by Kosters and others (1989), this play is very mature, densely drilled, and probably more than 90 percent depleted. The second largest gas play, as reported by Kosters and others (1989), is the “Downdip Frio Barrier/Strandplain Sandstone Play on the San Marcos Arch, Texas Gulf Coast” (9.4 TCFG). This play is reported to be mature in terms of production, with excellent reservoir quality. The “Deltaic Sandstones in the Houston Embayment, TX Gulf Coast” play (6.5 TCFG) is described as another extremely mature play with typically good reservoir quality (Kosters and others, 1989).
Structure contour and isopach maps (figs. 16 A and B) generated from published data (Dodge and Posey, 1981; Bebout and Gutierrez, 1982, 1983) indicate that the depth to the top of the Frio Formation (including the Anahuac Formation) ranges from a minimum of less than 1,000 ft in updip areas to a maximum of about 18,000 ft in southern Louisiana. The thickness of the Frio (including the Anahuac formation) ranges from less than 1,000 ft in southern Louisiana to about 9,000 ft in south Texas. Data from NRG Associates, Inc. (2006), used in this assessment consists of 1,661 Frio reservoirs, not including the Hackberry trend. The depth to the top of reservoirs for the Frio Formation (not including the Hackberry trend) averages about 7,300 ft; thickness of reservoirs averages 47 ft, porosity averages 27 percent, and permeability averages 685 md (based on data from NRG Associ-ates, Inc., 2006). Although there are no producing fields (greater than 0.5 MMBOE) within the deep, downdip areas of the Frio (based on data current as of 2004 in NRG Associates, Inc., 2006), data from the IHS Energy Group (2005a, b) indicate the pres-ence of productive intervals within these areas.
Hackberry Trend of the Frio Formation
The Oligocene Hackberry trend (fig. 3) has been described as potentially one of the most productive exploration targets in southeast Texas (Ewing and Reed, 1984). However, it also is known as a particularly difficult play to understand, having pro-duced an abundance of dry holes (Cossey and Jacobs, 1992). As described in the “Depositional Systems” section of this paper, the Hackberry trend is thought to have been deposited in a slope environment. The trend consists of an irregular, updip slide scar; a rotational slide zone up to 4 mi (6.5 km) wide; and a downdip region more than 20 mi wide, where meandering subma-rine channels deposited thick turbiditic sands (Cossey and Jacobs; 1992) (fig. 7).
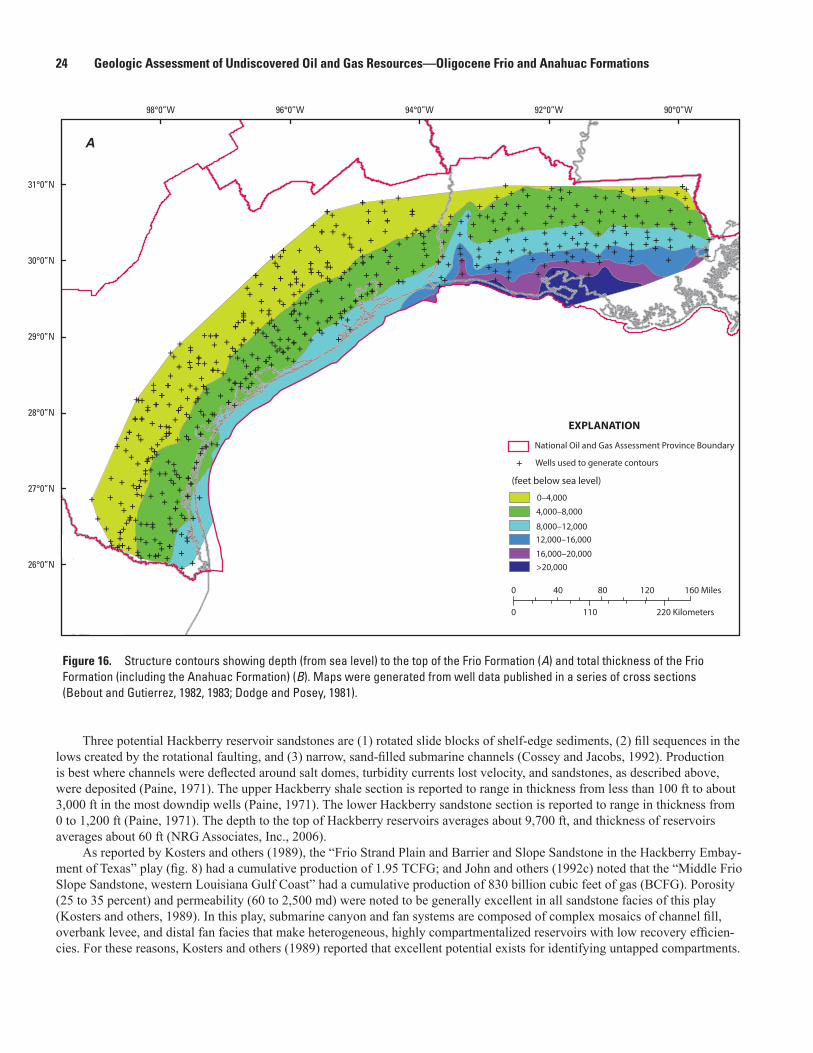
24 Geologic Assessment of Undiscovered Oil and Gas Resources—Oligocene Frio and Anahuac Formations
Three potential Hackberry reservoir sandstones are (1) rotated slide blocks of shelf-edge sediments, (2) fill sequences in the lows created by the rotational faulting, and (3) narrow, sand-filled submarine channels (Cossey and Jacobs, 1992). Production is best where channels were deflected around salt domes, turbidity currents lost velocity, and sandstones, as described above, were deposited (Paine, 1971). The upper Hackberry shale section is reported to range in thickness from less than 100 ft to about 3,000 ft in the most downdip wells (Paine, 1971). The lower Hackberry sandstone section is reported to range in thickness from 0 to 1,200 ft (Paine, 1971). The depth to the top of Hackberry reservoirs averages about 9,700 ft, and thickness of reservoirs averages about 60 ft (NRG Associates, Inc., 2006).
As reported by Kosters and others (1989), the “Frio Strand Plain and Barrier and Slope Sandstone in the Hackberry Embay-ment of Texas” play (fig. 8) had a cumulative production of 1.95 TCFG; and John and others (1992c) noted that the “Middle Frio Slope Sandstone, western Louisiana Gulf Coast” had a cumulative production of 830 billion cubic feet of gas (BCFG). Porosity (25 to 35 percent) and permeability (60 to 2,500 md) were noted to be generally excellent in all sandstone facies of this play (Kosters and others, 1989). In this play, submarine canyon and fan systems are composed of complex mosaics of channel fill, overbank levee, and distal fan facies that make heterogeneous, highly compartmentalized reservoirs with low recovery efficien-cies. For these reasons, Kosters and others (1989) reported that excellent potential exists for identifying untapped compartments.
E
E
EE
E
EE
E
E
E
E
E
E
E
E
E
E
E
E
E
E
E
E
E
E
E
E
E
EE
E
E
E
E
E
E
E
E
E
E
E
E
E
E
E
E
E
E
E
EE
E
E
E
E E
E
E
E
E
E
E
E
E
E
E
E
E
E
E
E
E
EE
EE
E
E
E
E
E
E
E
E
E
E
E
E
E
E
E
E
E
E
E
E
E
E
E
E
EE
E
E
E
E
E
E
E
E
E
E
E
E
E
E
E
E
E
E
E
E
E
E
E
E
E
E
E
E
E
E
E
E
E
E
E
E
E
E
E
E
E
E
E
E
E
EE
E
E
E
E
E
E
E
E
E
E
E
E
E
E
E
E
EE
E
E
EE
E
EE
EE
E
E
E
E
E
E
E
E
E
E
E
E
E
E
E
E
E
E
E
E
E
E
E
E
E
E
E
E
E
E
E
E
EE
E
E
E
E
EE
E
E
E
E
E
EE
E
E
E
E
E
E
E
E
E
E
E
EE
E
E
EE
E
E
E
E
E
E
E
E
E
EE
E
E
E
E
E
E
E
E
EE
E
E
E
E
E
E
E
E
E
E
E
E
E
E
E
E
E
E
E
E
E
E
EE
E
E
E
E
E
E
E
E
E
E
E
E
E
E
E
E
E
E
E
E
E
E
E
E
E E
E
EE
E
E
E
E
E
E
E
E
E
E
E
E
E
E
E
E
E
EE
E
E
E
E
E
E
E
E
E
E
E
E
E
E
E
EE
E
E
E
E
E
E
E
E
EE
E
E
E
E
E
E
EE
EE
E
E
E
E
E
E
E
E
E
E
E
E
E
E
E
E
E
E
E
E
E
E
E
E
E
E
E
E
E
E
E
E
E
E
E
E
EE
E
EE
E
E
E
E
E
E
E
E
E
E
E
EE
EEE
E
E
E
EEE
EE
E
EEE
E
E
E
E
E
E
E
E
E
E
EE
E
E
EE
EE
E
E
E
E
EE
E
E
E
E
EE
EE
EE
E
E
E
EEE
E
E
E
E
EE
E
EEE
EE
E
E
E
E
E
EE
E
E
E
E
E
EE
E
E
E
E
E
EE
E
E
E
E
E
E
E
EE
EE
E
EE
EEE
E
E
E
EE
EEEE
E
E
EE
EEE
EE
E
E
E
EE
E
EE
EE
E
E
E
E
E
E
E
E
E
EE
National Oil and Gas Assessment Province Boundary
Wells used to generate contours
(feet below sea level)
0–4,000
4,000–8,000
8,000–12,00012,000–16,000
16,000–20,000>20,000
EXPLANATION
0 40 80 120 160 Miles
0 110 220 Kilometers
26°0”N
27°0”N
28°0”N
29°0”N
30°0”N
31°0”N
98°0”W 96°0”W 94°0”W 92°0”W 90°0”W
A
Figure 16. Structure contours showing depth (from sea level) to the top of the Frio Formation (A) and total thickness of the Frio Formation (including the Anahuac Formation) (B). Maps were generated from well data published in a series of cross sections (Bebout and Gutierrez, 1982, 1983; Dodge and Posey, 1981).

Reservoir Rocks 25
Anahuac Formation
John and others (1992a) reported that the Anahuac play in southern Louisiana includes 73 major gas reservoirs in 43 fields (fig. 8). Plays identified by John and others (1992a) are based on depositional systems including proximal deltaic sandstones, distal deltaic sandstones, and slope sandstone subplays. The slope sandstone was identified as the largest subplay, having a cumulative production of 1.4 TCFG from 55 reservoirs in 34 fields, or 77 percent of total Anahuac production (John and others, 1992a). Structures of the slope sandstone subplay include faulted anticlines, rollover anticlines, and faulted salt domes (John and others, 1992a). Nehring (1991) reported that the only major Anahuac trend was a gas and liquid petroleum play in south Loui-siana and that most of the remaining Anahuac production was a gas and liquid petroleum trend in south Texas and the Burgos basin (Nehring, 1991).
Desselle (1997a, b) described the Frio-Anahuac progradational distal delta-front sandstone play of the Mustang Island area and the Frio-Anahuac progradational shoreface and shelf sandstone play of the Mustang Island and Matagorda Island areas (fig. 8). Each of these plays is in Texas State offshore waters. Production of the Frio-Anahuac progradational distal delta-front sandstone play ranges from the middle Frio to the lower Anahuac Formation, and the largest volume of hydrocarbons occurs in the lower Anahuac Marginulina sandstones (Desselle, 1997a). This is a minimally explored gas play, with boundar-ies limited by prohibitive drilling depths, in addition to low porosities and permeabilities along the western boundary of the play (Desselle, 1997a). The Frio-Anahuac progradational shoreface and shelf sandstone play is gas-prone with subordinate oil
E
EE
E
EE
E
E
E
E
E
E
E
E
E
E
E
E
E
E
E
E
E
E
E
E
E
EE
E
E
E
E
E
E
E
E
E
E
E
E
E
E
E
E
E
E
E
EE
E
E
E
E E
E
E
E
E
E
E
E
E
E
E
E
E
E
E
E
E
EE
EE
E
E
E
E
E
E
E
E
E
E
E
E
E
E
E
E
E
E
E
E
E
E
E
E
EE
E
E
E
E
E
E
E
E
E
E
E
E
E
E
E
E
E
E
E
E
E
E
E
E
E
E
E
E
E
E
E
E
E
E
E
E
E
E
E
E
E
E
E
E
EE
E
E
E
E
E
E
E
E
E
E
E
E
E
E
E
E
EE
E
E
EE
E
EE
EE
E
E
E
E
E
E
E
E
E
E
E
E
E
E
E
E
E
E
E
E
E
E
E
E
E
E
E
E
E
E
E
EE
E
E
E
EE
E
E
E
E
E
EE
E
E
E
E
E
E
E
E
E
E
E
EE
E
E
EE
E
E
E
E
E
E
E
E
E
EE
E
E
E
E
E
E
E
EE
EE
E
E
E
E
E
E
E
E
E
E
E
E
E
E
E
E
E
E
E
E
E
E
E
E
E
E
E
E
E
E
E
E
E
E
E
E
E
E
E
EE
E
EE
E
E
E
E
E
E
EE
E
E
EE
E
E
E
EE
EE
E
E
E
E
E
EE
E
E
E
E
E
E
E
E
EE
E
E
E
EE
E
E
EE
E
E
E
E
E
E
E
EE
E
E
E
E
E
EE
E
E
EE
EE
E
E
E
E
E
E
EE
E
E
E
E
E
E
E
E
E
E
E
E
E
E
E
E
EE
E
EE
E
E
E
E
E
EE
E
EE
E
EE
E
EE
E
E
E
E
E
E
E
EE
E
0
0 110 220 Kilometers
75 150 Miles
National Oil and Gas Assessment Province Boundary
(thickness in feet)
Wells used to generate Frio-Anahuac isopach
0–2,000
2,000–4,0004,000–6,0006,000–8,000>8,000
EXPLANATION
26°0”N
28°0”N
30°0”N
98°0”W 96°0”W 94°0”W 92°0”W 90°0”W
B
Figure 16.—Continued

26 Geologic Assessment of Undiscovered Oil and Gas Resources—Oligocene Frio and Anahuac Formations
production (Desselle, 1997b). Most of the oil is from updip sandstone reservoirs that are confined to the lower Anahuac Mar-ginulina sandstone (Desselle, 1997b). Most reservoirs in this play produce dry gas from overpressured reservoirs (Desselle, 1997b), with overpressured systems defined as fluid pressures that exceed the normal hydrostatic pressure of 0.465 pound per square inch (psi) (Jackson, 1997). The uppermost reservoirs consist of thin, strike-aligned retrogradational sandstones of the lower Anahuac (Desselle, 1997b). Based on data from NRG Associates, Inc. (2006), the depth to the top of Anahuac reservoirs averages about 8,300 ft, and the thickness of Anahuac reservoirs averages about 100 ft.
Reservoirs in Relation to Shelf Margin Deltas
Studies of the occurrence of reservoirs in relation to shelf-margin deltas, for the Frio and other large plays in the Gulf of Mexico, are abundant in the literature (Winker, 1982; Ewing and Vincent, 1997; Edwards, 2000, 2002, 2006; Galloway, 2002; Meckel, 2003; Brown and others, 2004, 2005, 2006; Hammes, Loucks, and others, 2007). Foundered shelf edges (FSEs), as described by Ewing and Vincent (1997), are thought to have resulted from the sudden movement of the shelf edge to a more landward point, owing to large-scale slumping, sliding, and erosion. In this model, the deep-water environments of the FSEs are described as promising targets for future exploration. Winker (1982) reported that many downdip Tertiary formations, including the Frio, are characterized by large growth faults with high expansion ratios in deltaic sequences and that hydraulic isolation of shallow-water sandstones by large fault offsets may have led to the formation of overpressured gas reservoirs. Edwards (2000) suggested that high rates of sedimentation and subsidence in the Gulf Coast Basin occasionally were overwhelmed by the col-lapse of the shelf margin, such as occurred in the mid-Frio Hackberry trend. In this interpretation, the emplacement of slumped blocks into the collapsed area potentially resulted in the formation of unique reservoirs and traps (Edwards, 2000). Meckel (2003) suggested that the deltas that crossed the shelf, as a result either of progradation or of low sea level stands, produced distinctive depocenters that are important exploration targets because they consist of downdip sands that typically are encased in highstand deep-water shales. Previous work (Brown and others, 2004, 2005, 2006; Hammes, Loucks, and others, 2007; Hammes, Zheng, and others, 2007; Ambrose and others, 2010) shows that growth-faulted subbasins in the Frio Formation are major exploration targets along the south and central Texas Gulf Coast (fig. 10) and that Frio slope- and basin-floor-fan systems are underexplored (Hammes, Zheng, and others, 2007).
Porosity and Permeability
Frio Formation
Loucks and others (1984) reported that the Frio Formation displays the best deep-reservoir quality in the Lower Tertiary section, based on plots of mean sandstone porosity versus depth (maximum depth close to 20,000 ft) from 156 wells along the onshore Texas Gulf Coast. This reservoir quality, however, is restricted to the middle and upper Texas Gulf Coast (Loucks and others, 1984). Sandstones within certain areas of the middle and upper Texas Gulf Coast, with depths of greater than 15,000 ft, have permeability values greater than 1,000 md (Loucks and others, 1984). In contrast, in south Texas, although a number of permeabilities of about 10 md are recorded at depths of 15,000 ft, most permeability values are less than a few millidarcies (Loucks and others, 1984).
The increase in reservoir quality from the lower to upper Texas Gulf Coast corresponds to changes in rock composition, intensity of diagenesis, and geothermal gradient (Loucks and others, 1984). Along the lower Texas Gulf Coast (south Texas), reservoir quality is poor, and Frio sandstones are low in quartz and rich in volcanic and carbonate rock fragments. Along the upper Texas Gulf Coast (southeast Texas), where reservoir quality is good, Frio sandstones are rich in quartz, lower in volcanic rock fragments, and lacking in carbonate rock fragments (Loucks and others, 1984). The abundance of chemically and mechani-cally unstable volcanic and carbonate rock fragments along the lower Texas Gulf Coast favors diagenetic processes that destroy porosity (Loucks and others, 1984).
Reservoir quality is related to the occurrence of primary and secondary porosity. Previous studies indicated that primary porosity in the Frio predominates in the shallow subsurface, and secondary dissolution porosity is dominant in the deeper subsurface (deeper than 10,000 ft) (Loucks and others, 1984). Secondary dissolution pores become dominant at depth because of the initiation of quartz cementation at these depths; quartz cement is precipitated in the primary pores, leaving the secondary pores open (Loucks, 2005). The most permeable sandstones are the ones having the best preserved primary intergranular pore network, and as the relative amount of secondary pores increases within a pore network, the associated permeability is reduced dramatically (Loucks, 2005). Processes that initiate brittle fractures during diagenesis also are important factors in quartz cemen-tation (Makowitz and others, 2006). Understanding each of these factors is important in predicting reservoir quality, particularly in sandstones where abundant feldspars and volcanic rock fragments are expected (Loucks, 2005).

Traps and Seals 27
Based on data from NRG Associates, Inc. (2006), the average porosity of Frio reservoirs (not including Hackberry trend reservoirs) is 27 percent, and the average permeability is 685 md. The average porosity in the Hackberry trend is 31 percent, and the average permeability is 820 md (based on data from NRG Associates, Inc., 2006). In the Anahuac of south Louisiana, Nehring (1991) reported that porosities are very good (25 to 35 percent), but permeabilities are found to vary widely (10 to 2,000 md). Based on data from NRG Associates, Inc. (2006), the average porosity of Anahuac reservoirs is 30 percent, and the average permeability is 1,042 md.
Traps and Seals
Frio Formation
Traps in the Frio Formation are structural, stratigraphic, or a combination of structural and stratigraphic (Kosters and oth-ers, 1989; John and others, 1992 b, c, d; NRG Associates, Inc., 2006). Where there are major growth faults in downdip areas of the Frio, traps largely are structural, and faulted rollover anticlines are dominant (Kosters and others, 1989; John and others, 1992 b, c, d; NRG Associates, Inc., 2006) (fig. 17). Rollover anticlines are particularly common within fluvial-deltaic sandstones of the Vicksburg fault zone (Galloway and others, 1983; Jirik, 1990; McRae and Holtz, 1994, 1995; Hopkins, 1998; Pendleton and Hardage, 1998). In the south Texas Burgos basin and San Marcos arch areas (fig. 4), structural traps are dominated by growth faults and shale ridges (Nehring, 1991). In the Houston embayment and in southern Louisiana, trapping is controlled by growth faults (faulted, rollover anticlines) and salt structures (Nehring, 1991; New Orleans Geological Society, 1995; NRG Associates, Inc., 2006).
Combination traps involving faulted, rollover anticlines and stratigraphic traps in fluvial, deltaic, barrier-bar, shelf, or strandplain systems also are common (based on data from NRG Associates, Inc., 2006). Stratigraphic traps are common in fluvial systems updip from the major growth faults (Nehring, 1991), and shales provide the seals (Galloway and others, 1982, 1983, 2000). For example, the middle Frio gas-producing reservoirs of the Seeligson field, Texas, consist of stacked fluvial channel-fill and crevasse splay sandstone deposits about 10 to 40 ft thick, encased in floodplain mudstones (Jirik, 1990) (fig. 18). Previous studies suggested that reservoir heterogeneity is an important factor in fluvial and deltaic sandstones of the Vicksburg fault zone (Jirik, 1990; McRae and Holtz, 1994, 1995; Knox and McRae, 1995), and in inner-shelf and barrier/strandplain sandstones in south Texas and the San Marcos arch (Ricoy and others, 1992; Knox, 1994). These studies indicated potential for incompletely drained and untapped reservoirs. Previous work also suggested that use of 3-D seismic techniques to image com-plex fluvial sand bodies in the Vicksburg fault zone may lead to identification of untapped reservoirs (Pendleton and Hardage, 1998). Frio shales provide seals in south Texas and in the San Marcos arch area; Frio and Anahuac shales provide seals in the Houston embayment and southern Louisiana (Galloway and others, 1982, 1983, 2000).
Figure 17. Schematic cross section of reservoirs of the Tom O’Connor field, Refugio County, Texas (from Galloway and others, 1983). Closure results from rollover caused by displacement along an updip growth fault. Vertical upbuilding and stacking of barrier sands in the San Marcos arch produced thick aggradational sequences of multiple stacked reservoirs, typical of many of the Frio fields.
7,000 Feet
2,000 Meters
0
0
00
60 m 200 ft
Gas-bearing sandOil-bearing sand
Water-bearing sandShale
Fault
Water encroachment
EXPLANATION
W E
0 70 14035 Miles
0 100 20050 Kilometers
Tom O’Connor field
Texas
Mexico
LA
Gulf
of
Mexico
EXPLANATION
30°0’N
29°0’N
28°0’N
27°0’N
26°0’N
97°0’W 96°0’W 95°0’W 94°0’W
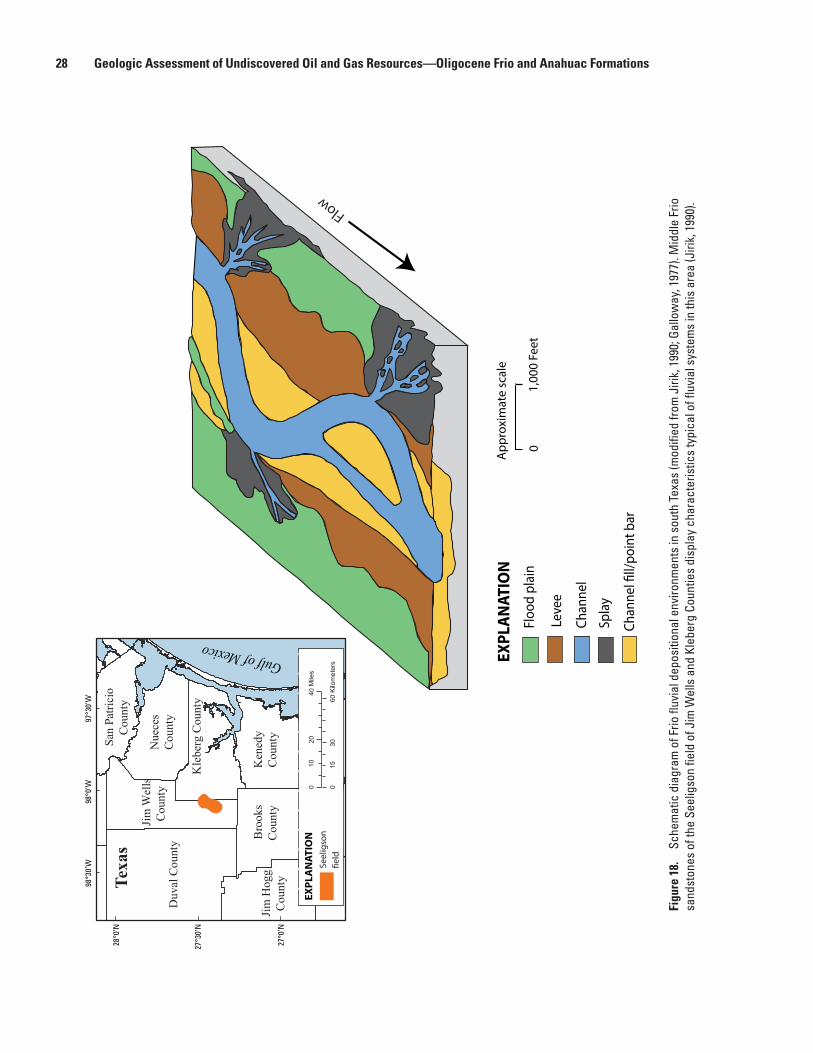
28 Geologic Assessment of Undiscovered Oil and Gas Resources—Oligocene Frio and Anahuac Formations
01,
000
Feet
App
roxi
mat
e sc
ale
Chan
nel
EXPL
ANAT
ION
Floo
d pl
ain
Leve
e
Spla
y
Chan
nel �
ll/po
int b
ar
Seel
igso
n
field
020
4010
Mile
s
030
6015
Kilo
met
ers
Jim
Wel
ls
Coun
tyN
uece
s Co
unty
Kle
berg
Cou
nty
Ken
edy
Coun
tyB
rook
s Co
unty
Jim
Hog
gCo
unty
Duv
al C
ount
y
San
Patri
cio
Coun
tyTe
xas
EXPL
AN
ATIO
N
Flow
Gulf of Mexico
28°0
’N
27°3
0’N
27°0
’N
98°3
0’W
98°0
’W97
°30’
W
Figu
re 1
8.
Sche
mat
ic d
iagr
am o
f Frio
fluv
ial d
epos
ition
al e
nviro
nmen
ts in
sou
th T
exas
(mod
ified
from
Jiri
k, 1
990;
Gal
low
ay, 1
977)
. Mid
dle
Frio
sa
ndst
ones
of t
he S
eelig
son
field
of J
im W
ells
and
Kle
berg
Cou
ntie
s di
spla
y ch
arac
teris
tics
typi
cal o
f flu
vial
sys
tem
s in
this
are
a (J
irik,
199
0).
Resource Assessment 29
Hackberry Trend of the Frio Formation
As described earlier, the setting of the updip Hackberry is an area of slope failure involving slide blocks; and the setting of the downdip play is channels where thick, turbidite sands were deposited (Berg and Powers, 1980; Cossey and Jacobs, 1992) (fig. 7). The first fields of the Hackberry trend were discovered in structural/stratigraphic traps on the updip flanks of salt domes, where channels were forced to meander around paleobathymetric highs (Cossey and Jacobs, 1992). Based on data from NRG Associates (2006), traps in the Hackberry trend are structural (faulted rollover anticline, salt diapir) or combination (faulted rollover anticline with deltaic-channel fill). Previous studies indicate that traps formed in faulted anticlines or on the flanks of diapiric uplifts (Kosters and others, 1989). Abrupt stratigraphic pinchouts characteristic of submarine canyon facies also are important traps, and interbedded shelf and upper-slope mudstone facies form effective seals (Kosters and others, 1989).
The Port Arthur and Port Acres fields are within and on the southern flanks of the Port Arthur channel (Ewing and Reed, 1984) in southeast Texas (fig. 3). The Port Acres field is a classic example of a primary stratigraphic trap (updip pinch-out) within the uppermost lower Hackberry sandstone (Halbouty and Barber, 1961; Ewing and Reed, 1984). The Port Arthur field, located a few miles east of Port Acres field, is a combination structural-stratigraphic trap, and the stratigraphic traps are within submarine fan depositional systems (Ewing and Reed, 1984). Production is from locally deposited lower Hackberry sandstones on an anticlinal closure that developed on the downthrown side of a regional growth fault (Halbouty and Barber, 1961; Ewing and Reed, 1984). Structural traps also are found in the Bobcat Run South field of southeast Texas (fig. 3), including upthrown closures along northeast-southwest trending fault patterns (Zamboras, 1998). In the North Sabine Lake field of southwest Loui-siana (fig. 3), the primary trapping mechanism is stratigraphic, where it appears that many small sand lenses have coalesced to form a single large reservoir (Eubanks, 1987). Eubanks (1987) suggested that lower Hackberry sands were deposited in preexist-ing submarine canyons perpendicular to the “Hartburg flexure” (fig. 7) and that the sands were positioned between the regional pre-Hackberry unconformity and a semiregional unconformity higher in the stratigraphic section (lower Hackberry). The semire-gional unconformity consists of a 3- to 5-ft-thick silt layer, which truncates some of the sand lenses beneath it and is a major factor in trapping hydrocarbons in the North Sabine Lake field (Eubanks, 1987).
Anahuac Formation
In the Anahuac, traps are structural or combination, including faulted rollover anticlines and salt-diapir-related traps (based on data from NRG Associates, Inc., 2006). In the Anahuac distal deltaic sandstone play, the gas fields of southwest Louisiana contain a number of closures against a major east-west trending growth fault (John and others, 1992a) (fig. 8). In the Anahuac slope sandstone play, the largest of the Anahuac plays described by John and others (1992a), traps include complexly faulted anticlinal structures, rollover anticlines against faults, and faulted structures extending from piercement salt domes.
Resource Assessment
Geologic Model Used to Define Paleogene Assessment Units
The USGS Paleogene assessment team developed a geologic model to define AUs (fig. 19) on the basis of recurring regional-scale structural and depositional features in Paleogene strata, developed from the concepts of Ewing (1991a) and illustrated by Coker and others (2003) and Radovich and others (2007). Other studies that were important in development of the model include Winker (1982), Galloway and others (1982), Ewing (1990, 1991b); Galloway and others (2000), and Galloway (2005).
During progradation, deposition occurred in three general areas of the Gulf Coast basin, which we refer to as “Stable Shelf,” “Expanded Fault,” and “Slope and Basin Floor” environments or zones (fig. 19). The “Stable Shelf Zone” occurs in the landward (updip) parts of the basin, where growth faulting either is absent or minimal. The Frio interval is the exception to this model, containing a large portion of the Vicksburg fault zone that has normally pressured reservoirs (refer to discussion in “Frio Stable Shelf Oil and Gas AU” section). For all stratigraphic intervals assessed in the Paleogene, the “Expanded Fault Zone” con-tains growth faults that formed at or near the paleo-shelf edge of the underlying unit. Sediments in the “Expanded Fault Zone” have undergone extreme vertical displacement and thickening (that is, expansion) as a result of the growth faulting. For all stratigraphic intervals assessed in the Paleogene, the “Slope and Basin Floor Zone” consists of environments formed basinward (downdip) of the paleo-shelf edge, where growth faulting was minimal and sediments were not vertically displaced or thickened to a great extent. As would be expected from the cyclical nature of these progradational systems for the stratigraphic intervals assessed, there is overlap between “Stable Shelf,” “Expanded Fault,” and “Slope and Basin Floor Zones” through time. Each of the AUs, as conceptually defined in the geologic model, is described in more detail in the following paragraphs.

30 Geologic Assessment of Undiscovered Oil and Gas Resources—Oligocene Frio and Anahuac Formations
Updip Downdip
Stable ShelfExpandedFault Zone
Slope andBasin Floor
None to minimum expansion
Maximum expansion
Minimum to moderate expansion
STABLE
SHELF
EDGE
40-50 MILES
SALT PILLOWSUBMARINE FAN LOBE
SLUMP
PONDEDTURBIDITES
SLUMPSCAR
SLUMPSCAR
LOW STANDDELTA
HIGH STANDDELTABURIED SALT DIAPIR AND
WITHDRAWAL BASIN
ONLAPPINGGRAVITYFLOWDEPOSITS
SLOPEFAN CHANNEL
SLUMPBLOCKS
SLOPEAPRON
SLOPE
SUBMARINE
FAN
SUBMARINE
FAN
SALT-CORED RIDGE
SLUMP
TOE
BASIN FLOORTOE
SHELFEDGE
HEAD
SHALLOWGLIDE
PLANESYSTEM
HIGHSTAND
DELTA
INCISED
CHANNELS
LOWSTAND
DELTA
GROWTHFAULT
REWORKED
SHELF/DELTA
SANDS
40 - 50 MILES
MUDDYSHELF
SAND BYPASSZONE
8,00
0 -
1
0,00
0 FT
STABLE SHELF
EXPANDED FAULTZONE
SLOPE AND BASINFLOOR
Stable Shelf
Expanded Fault Zone
Slope and Basin Floor
A
B
Figure 19. Geologic model used to define the assessment units. A, Diagram showing stable shelf, expanded fault, and slope and basin floor zones. B, Generalized diagram with structural and depositional systems associated with each zone. (Modified from Edwards, 1991; P.C. Hackley, U.S. Geological Survey, written commun., 2006.)

Resource Assessment 31
Stable Shelf Assessment Units.—The “Stable Shelf” AUs of the Paleogene stratigraphic intervals assessed primarily are composed of fluvial and deltaic highstand and transgressive systems tracts (fig. 19). Reservoirs generally are at shallower drill-ing depths than those of the “Expanded Fault” and “Slope and Basin Floor” AUs. Stratigraphic vertical expansion is minor for most of the stratigraphic intervals assessed, and reservoir intervals are thin compared to those in the “Expanded Fault” AUs. Exploration in the “Stable Shelf” AUs is very mature, and production of oil and gas is from reservoirs having normal tempera-ture and pressure depth gradients. Based on regional thermal maturation modeling studies (Rowan and others, 2007), “Stable Shelf” AUs in Paleogene strata generally are thermally immature, suggesting that oil and gas reservoired in these areas migrated from deeper, mature source rocks downdip. This interpretation is supported by studies of geochemical data collected by the U.S. Geological Survey (M.D. Lewan, U.S. Geological Survey, written commun., 2006).
Expanded Fault Zone Assessment Units.—The “Expanded Fault Zone” AUs of the assessed Paleogene intervals display greater reservoir thickness and vertical displacement resulting from syndepositional growth faulting, compared to the “Stable Shelf Zone” AUs (fig. 19). The “Expanded Fault Zone” AUs mostly comprise deltaic and marine highstand and lowstand systems tracts. Drilling depths to reservoirs generally are greater than for the stable shelf AUs. Reservoir intervals range from thin to thick, and hydrocarbon exploration and production trends are characterized as mature to frontier. Reservoir pressures and temperature range from normal to high, owing to the onset of overpressured conditions at depth. Based on production data (IHS Energy Group, 2005a; NRG Associates, 2006) and thermal maturation modeling studies (Rowan and others, 2007), Paleogene strata in the “Expanded Fault Zone” AUs generally are mature to overmature with respect to oil and gas generation. In the “Expanded Fault Zone” AU for the Frio Formation (including the overlying Anahuac Formation), both oil and gas have been produced to a significant degree (Nehring, 1991).
The updip margin of the “Expanded Fault Zone” AU for the Frio Formation was defined on the basis of the occurrence of the Frio fault zone in Texas (Ewing and others, 1990, Ewing, 1991a, 1991b), the location of unstable (growth-faulted) shelf margins in Louisiana (Paine and others, 1968; John and others, 1992 b, c, d), and the occurrence of reservoirs in overpressured stratigraphic intervals (refer to discussion in “Frio Expanded Fault Zone Oil and Gas AU”).
Slope and Basin Floor Assessment Units.—The “Slope and Basin Floor” AUs of Paleogene intervals assessed have minimum to moderate fault-related expansion for the most landward part of the AU and mostly comprise deltaic and marine distal highstand and lowstand systems tracts. Reservoir intervals are thin to moderate as compared to the “Stable Shelf” and “Expanded Fault Zone” AUs (fig. 19). The USGS Paleogene Assessment Team defined the “Slope and Basin Floor” AUs as frontier to hypothetical hydrocarbon production areas, owing to the lack of drilling and production data from these areas. Reservoirs are expected to be overpressured, with associated high temperatures. Based on thermal maturation modeling studies (Rowan and others, 2007), Paleogene strata in the “Slope and Basin Floor” expansion AUs generally are overmature, suggesting that gas would be the dominant reservoired hydrocarbon in the slope and basin floor AUs.
Assessment Units
Six AUs were defined for the Frio (fig. 20); three of these units were based on the geologic model described in the previ-ous section: the Frio Stable Shelf Oil and Gas AU, the Frio Expanded Fault Zone Oil and Gas AU, and the Frio Slope and Basin Floor Gas AU (fig. 20A). The fourth AU is the Hackberry Oil and Gas AU, which is based on the occurrence of reservoirs in the Hackberry trend. The fifth AU is the Frio Basin Margin AU. This unit was not quantitatively assessed, owing to the lack of potential for production in updip areas near the updip extent of Oligocene rocks. The sixth AU, the Anahuac Oil and Gas AU (fig. 20B), is based on occurrence of reservoirs in the Anahuac Formation.
An events chart (fig. 21) shows the elements of the geologic model that describe the assessment units for the Frio and Anahuac reservoirs of the Upper Jurassic-Cretaceous-Tertiary Composite Total Petroleum System. Source rocks, reservoir rocks, traps and seals, and migration patterns have been discussed in previous sections of this report. The “critical moment” is defined as the point in time that best depicts the generation-migration-accumulation of most hydrocarbons in a petroleum system (Magoon and Dow, 1994).
Boundaries Used to Define Assessment UnitsGeologic features and political boundaries were used to define AUs for the Frio and Anahuac Formations (figs. 20 and
22). For all Paleogene stratigraphic intervals assessed by the USGS Paleogene Assessment Team, a geologic model based on the degree of growth faulting, trap styles, and other related features was a primary consideration in determining AU boundaries (refer to “Geologic Model” section). Each of the boundaries used to define AUs is described in the following paragraphs and in previous publications (Swanson and others, 2007; Swanson and Karlsen, 2008, 2009).

32 Geologic Assessment of Undiscovered Oil and Gas Resources—Oligocene Frio and Anahuac Formations
090
180
Mile
s45
011
022
0 K
ilom
eter
s55
Frio
Bas
inM
argi
nA
U
Frio
Sta
ble
She
lfO
ilan
dG
asA
U
Frio
Exp
ande
dFa
ultZ
one
Oil
and
Gas
AU
Frio
Slo
pean
dB
asin
Floo
rGas
AU
Hac
kber
ryO
ilan
dG
asA
U
Mis
siss
ippi
Lou
isia
na
Ark
ansa
s
Texa
s
Ala
bam
a
Mex
ico
Estim
ated
upd
ip e
xten
t of O
ligoc
ene
rock
s
EXPL
AN
ATIO
N
32°0
’N
30°0
’N
28°0
’N
26°0
’N
98°0
’W96
°0’W
94°0
’W92
°0’W
90°0
’W88
°0’W
86°0
’W
A
Figu
re 2
0.
Asse
ssm
ent u
nits
(AUs
) for
the
Frio
For
mat
ion.
A, T
he F
rio S
tabl
e Sh
elf O
il an
d Ga
s AU
, Frio
Exp
ande
d Fa
ult Z
one
Oil a
nd G
as A
U, F
rio S
lope
and
Bas
in F
loor
Ga
s AU
, Hac
kber
ry O
il an
d Ga
s AU
, and
Frio
Bas
in M
argi
n AU
. B, t
he A
nahu
ac O
il an
d Ga
s AU
. Bou
ndar
ies
alon
g co
ast f
ollo
w S
tate
/Fed
eral
Out
er C
ontin
enta
l She
lf (O
CS)
boun
darie
s (U
.S. G
eolo
gica
l Sur
vey,
200
4).

Resource Assessment 33
080
160
Mile
s40
011
022
0 K
ilom
eter
s55
Anah
uac
Oil
and
Gas
AU
Mis
siss
ippi
Ark
ansa
s
Texa
s
Ala
bam
a
Mex
ico
Lou
isia
na EXP
LAN
ATI
ON
96°0
’W92
°0’W
88°0
’W
32°0
’N
26°0
’N
B
Figu
re 2
0.—
Cont
inue
d
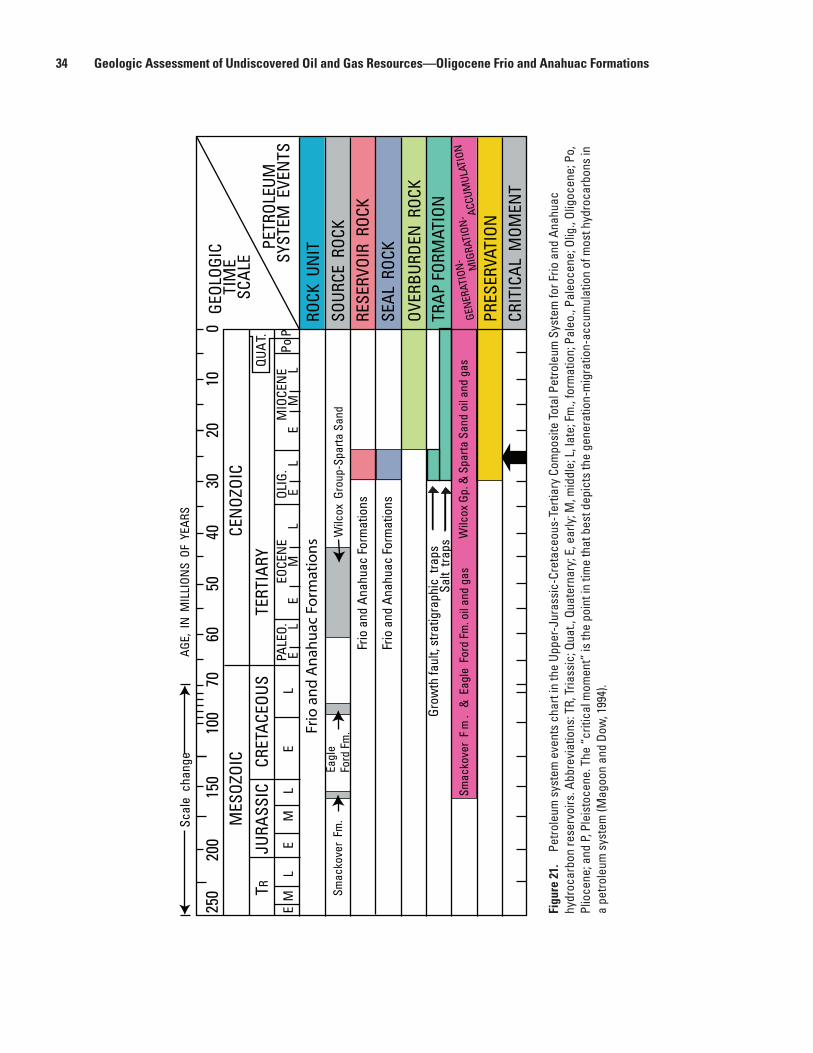
34 Geologic Assessment of Undiscovered Oil and Gas Resources—Oligocene Frio and Anahuac Formations
GEOL
OGIC
TIM
ESC
ALE
PETR
OLEU
MSY
STEM
EVE
NTS
ROCK
UN
ITSO
URCE
ROC
KRE
SERV
OIR
ROCK
SEAL
ROC
K
OVER
BURD
EN R
OCK
CRIT
ICAL
MOM
ENT
GEN
ERAT
ION
-M
IGRA
TION
- ACCU
MUL
ATIO
N
010
2030
4050
6070
100
150
200
250
MES
OZOI
CCE
NOZ
OIC
CRET
ACEO
USTE
RTIA
RYJU
RASS
ICTR
AGE,
IN
MIL
LION
S OF
YEA
RS
PALE
O.EO
CEN
EOL
IG.
QUA
T.
MIO
CEN
EE
LE
LL
EM
LE
MPo
PE
LE
LM
EL
M
Scal
e ch
ange
Frio
and
Ana
huac
For
mat
ions
Wilc
ox G
roup
-Spa
rta S
and
Eagl
e Fo
rd F
m.
Smac
kove
r Fm
.
Frio
and
Ana
huac
For
mat
ions
Smac
kove
r F
m.
& E
agle
For
d Fm
. oil
and
gas
Grow
th fa
ult,
stra
tigra
phic
tra
psSa
lt tra
ps
Frio
an
d A
nah
uac
Fo
rmat
ion
s Wilc
ox G
p. &
Spa
rta S
and
oil a
nd g
as
PRES
ERVA
TION
TRAP
FOR
MAT
ION
Figu
re 2
1.
Petro
leum
sys
tem
eve
nts
char
t in
the
Uppe
r-Ju
rass
ic-C
reta
ceou
s-Te
rtiar
y Co
mpo
site
Tot
al P
etro
leum
Sys
tem
for F
rio a
nd A
nahu
ac
hydr
ocar
bon
rese
rvoi
rs. A
bbre
viat
ions
: TR,
Tria
ssic
; Qua
t., Q
uate
rnar
y; E
, ear
ly; M
, mid
dle;
L, l
ate;
Fm
., fo
rmat
ion;
Pal
eo.,
Pale
ocen
e; O
lig.,
Olig
ocen
e; P
o,
Plio
cene
; and
P, P
leis
toce
ne. T
he “
criti
cal m
omen
t” is
the
poin
t in
time
that
bes
t dep
icts
the
gene
ratio
n-m
igra
tion-
accu
mul
atio
n of
mos
t hyd
roca
rbon
s in
a
petro
leum
sys
tem
(Mag
oon
and
Dow
, 199
4).

Resource Assessment 35
011
022
0 M
iles
55
015
030
0 K
ilom
eter
s75
Hou
ston
Emba
ymen
tSab
ine
Up
lift
Rio
Gra
nd
eEm
bay
men
t
San Marc
osArc
h
Shal
ed
iap
irs
Texa
s
Loui
sian
aM
issi
ssip
pi
Flor
ida
Georgia
Ala
bam
a
Arka
nsas
Okl
ahom
a
Stat
e/Fe
der
al O
CS
Wat
er B
ou
nd
ary
Salt
wat
er/f
resh
wat
er in
terf
ace
(>10
,000
mg
/L d
isso
lv ed
so
lids
do
wn
dip
of i
solin
e)
Late
Olig
oce
ne
shel
f mar
gin
Esti
mat
ed u
pd
ip e
xten
t o
f Olig
oce
ne
rock
s
Low
er C
reta
ceo
us
shel
f mar
gin
Salt
dia
pir
s (o
nsh
ore
on
ly)
USG
S O
il an
d G
as P
rovi
nce
Bo
un
dar
y
Up
dip
lim
it of
Fri
o u
nst
able
sh
elf
East
Tex
as
Bas
in P
rovi
nce
Wes
tern
Gu
lfPr
ovin
ce
LA-M
S Sa
lt
Bas
ins
Prov
ince
Ten
ness
ee
EXPL
AN
ATIO
N
96°0
’W92
°0’W
88°0
’W
34°0
’N
30°0
’N
26°0
’N
Figu
re 2
2.
Boun
darie
s an
d ar
eas
used
to d
efin
e as
sess
men
t uni
ts fo
r the
Frio
and
Ana
huac
For
mat
ions
. The
est
imat
ed u
pdip
ext
ent o
f Olig
ocen
e ro
cks
is b
ased
on
Schr
uben
and
oth
ers
(199
8), K
ing
and
Beik
man
(197
4); t
he L
ower
Cre
tace
ous
shel
f mar
gin
is fr
om E
win
g an
d Lo
pez (
1991
), ba
sin
is d
ownd
ip o
f thi
s lin
e; th
e sa
ltwat
er/
fresh
wat
er in
terfa
ce (d
isso
lved
sol
id c
once
ntra
tions
gre
ater
than
10,
000
mill
igra
ms
per l
iter a
re d
ownd
ip o
f thi
s lin
e) is
from
Pet
tijoh
n (1
996)
; sal
t dia
pirs
are
from
Lop
ez
(199
5), E
win
g an
d Lo
pez (
1991
), an
d M
artin
(198
0); U
SGS
Oil a
nd G
as P
rovi
nce
Boun
darie
s ar
e fro
m U
SGS
(199
6); a
nd th
e up
dip
exte
nt o
f the
Frio
uns
tabl
e sh
elf e
dge
is
base
d on
the
loca
tion
of th
e Fr
io fa
ult z
one
(Ew
ing,
198
6, 1
991b
; Ew
ing
and
othe
rs, 1
990)
and
uns
tabl
e sh
elf a
reas
des
crib
ed in
oth
er re
ports
(Pai
ne a
nd o
ther
s, 1
968;
Joh
n an
d ot
hers
, 199
2 b,
c, d
). Sa
lt di
apirs
and
mas
sifs
in o
ffsho
re a
reas
are
not
dis
play
ed.

36 Geologic Assessment of Undiscovered Oil and Gas Resources—Oligocene Frio and Anahuac Formations
Limit of Thermally Mature Source RocksAs discussed in the “Source Rock” section, the Tertiary assessment team concluded that the source rocks for Tertiary
reservoirs in the onshore Gulf Coastal region are primarily mudstone, claystone, and coaly intervals of the Wilcox Group, with contributions from the Sparta Sand of the Claiborne Group (Rowan and others, 2007; Warwick and others, 2007a). The Lower Cretaceous shelf margin (Ewing and Lopez, 1991) was used as one of the boundaries to delimit AUs (fig. 22) because it marks the updip limit of Wilcox Group or Sparta Sand shales that are thermally mature (Rowan and others, 2007). For example, the Lower Cretaceous shelf margin was used as a limiting boundary for the Frio Stable Shelf Oil and Gas AU in parts of Texas and for the Frio Expanded Fault Zone Oil and Gas AU in parts of Louisiana.
Limit of Potential for Biogenic GasThe 10,000-milligram-per-liter (mg/L) total dissolved solids (TDS) isoline (Pettijohn, 1996) also was used as a defining
boundary for AUs in the Frio Formation, to indicate the updip limits of potential for production of biogenic gas (fig. 22). Previ-ous studies indicated the presence of biogenic gas accumulations in the Frio Formation of southwestern Mississippi and south-eastern Louisiana (Champlin, 1995; Goddard and Zimmerman, 2003). Because isotopic data for coal gas samples collected from recent Wilcox coalbed gas exploration wells in Louisiana suggest that coal gases are produced primarily by the bacterial reduc-tion of CO2 in a saline aquifer system (Warwick, 2004; Warwick and others, 2008), we have hypothesized that microbes produc-ing biogenic gas in the Frio Formation would have required saline aquifer systems. The U.S. Environmental Protection Agency standard for an underground source of drinking water (<10,000 mg/L TDS) (U.S. Environmental Protection Agency, 2002) was used to represent the saltwater/freshwater interface. In one part of Louisiana and Mississippi, the Frio Stable Shelf Oil and Gas AU was extended updip of the 10,000-mg/L TDS isoline to include producing wells and indicate the potential for lateral migra-tion of biogenic gases in this area.
Updip Extent of Oligocene RocksThe updip extent of Oligocene rocks was used to indicate the updip limit of potential for production in the Frio and Ana-
huac Formations. Because the Oligocene is not visible in outcrop in central and eastern Texas and western Louisiana (Schruben and others, 1998; based on King and Beikman, 1974) (fig. 22), the contact between the Miocene and Eocene Jackson Group was used to estimate the updip extent of Oligocene rocks in these areas. In south Texas, where Miocene outcrops are limited in extent, the updip limit of Oligocene rocks was based on either the contact between the Eocene Jackson Group and the Miocene or the outcrop of the Eocene Jackson Group alone. In most areas of Mississippi and Alabama, the contact between the Oligocene and Miocene was used to estimate the updip extent of Oligocene rocks. In parts of Alabama, the contact between the Miocene and Eocene Jackson Group was used to estimate the updip extent of Oligocene rocks. In parts of central and eastern Louisiana, where Holocene sediments are extensive, the updip extent of the Oligocene was estimated on the basis of limited outcrops show-ing the contact between the Miocene and Eocene Jackson Group. AUs having boundaries defined by the updip extent of Oligo-cene rock units include the Frio Basin Margin AU and Frio Stable Shelf Oil and Gas AU.
State/Federal Water BoundariesThe offshore State/Federal water boundary or USGS petroleum region and/or province boundaries (U.S. Geological Survey,
1996) also were used to define the limits of all of the AUs for the Frio and Anahuac Formations: Frio Stable Shelf Oil and Gas AU (fig. 23), Frio Expanded Fault Zone Oil and Gas AU (fig. 26), Hackberry Oil and Gas AU (fig. 30), Frio Slope and Basin Floor Gas AU (fig. 33), and Anahuac Oil and Gas AU (fig. 34).
Frio Basin Margin Assessment UnitThe Frio Basin Margin AU was defined to indicate the full extent of Oligocene rocks updip of the Frio Stable Shelf Oil and
Gas AU (fig. 20). Because there is no known production in the Frio Basin Margin AU (based on data from NRG Associates, Inc., 2006), it was not quantitatively assessed. The updip limit of the Frio Basin Margin AU is defined by the updip extent of Oligo-cene rocks. The downdip boundary of the Frio Basin Margin AU indicates the downdip limit of nonproductive areas, as defined by (1) the 10,000-mg/L TDS isoline, which indicates the probable updip limit for production of biogenic methane; (2) the Lower Cretaceous shelf margin, which marks the updip limit of Wilcox Group or Sparta Sand shales that are thermally mature (Rowan and others, 2007); and (3) areas of known production within the Frio Stable Shelf Oil and Gas AU (figs. 22 and 23).

Resource Assessment 37
Frio Stable Shelf Oil and Gas Assessment Unit The Frio Stable Shelf Oil and Gas AU (fig. 23) is a mature to supermature exploration area. Although there has been exten-
sive drilling for hydrocarbons throughout the unit, producing reservoirs are particularly numerous in mid and south Texas (based on data from NRG Associates, Inc., 2006).
Based on data from NRG Associates, Inc. (2006), the average depth to the top of reservoirs in this AU is 4,834 ft, and the average thickness of reservoirs is 34 ft. Frio reservoir porosity has an average value of 28 percent, and average permeability is about 740 md. In general, fields in the Frio Stable Shelf Oil and Gas AU are normally pressured. Reservoir pressures average 2,127 psi and temperatures (including both reservoir and bottomhole temperatures) average 156 °F (based on data from NRG Associates, Inc.; 2006).
Growth faults are minimal in much of the Frio Stable Shelf Oil and Gas AU (fig. 23). However, the Vicksburg fault zone is present in a band that parallels the Texas coast (Coleman and Galloway, 1991; Ewing, 1991a; Combes, 1993), and a large part of this fault zone was included within the Frio Stable Shelf Oil and Gas AU, for the following reasons. Although there is vertical expansion of the Frio within the Vicksburg fault zone, it is not as great as that in the Frio fault zone farther downdip. Cross sec-tions by Galloway and others (1994) (fig. 11), which are based on closely spaced well logs and regional seismic data, indicate extreme vertical expansion of the Frio within the Frio fault zone and significantly less expansion in the Vicksburg fault zone. The part of the Vicksburg fault zone that contains overpressured reservoirs, in south Texas, was not included in the Frio Stable Shelf Oil and Gas AU. Depositional systems in the Frio Stable Shelf Oil and Gas AU consist of fluvial, deltaic, delta mouth and barrier bars, and shelf environments (Galloway and others, 1982, 1983, 2000).
In most parts of the Frio Stable Shelf Oil and Gas AU, the updip margin follows the 10,000-mg/L TDS isoline (fig. 23), which is an indicator of the potential updip limit of biogenic methane. The updip limit of Oligocene rocks was used to delimit the updip boundary of the AU in south Texas, owing to the presence of oil and gas fields near the saltwater/freshwater interface. The Lower Cretaceous shelf margin marks the updip limit of Wilcox Group or Sparta Sand shales that are thermally mature (Rowan and others, 2007), and it was also used as an updip boundary for the AU in areas where the 10,000-mg/L TDS isoline is not defined and the potential for biogenic gas is poorly understood. In eastern Louisiana and southern Mississippi, the AU was extended updip of the Lower Cretaceous shelf margin because there is potential for biogenic gas in saline portions of the Frio (downdip of the 10,000-mg/L TDS isoline). In southwestern Mississippi, the AU boundary extends beyond (north of) the 10,000-mg/L TDS isoline to account for known production and lateral migration of biogenic gas in the area.
The downdip boundary of the Frio Stable Shelf Oil and Gas AU was determined on the basis of the updip extent of the Frio fault zone in Texas (Ewing, 1986; 1991a, b; Ewing and others, 1990) and the updip boundary of unstable shelf areas in Louisi-ana, as reported in previous studies (Paine and others, 1968; John and others, 1992b, c, d) (figs. 22 and 23). The downdip boundary of the Frio Stable Shelf Oil and Gas AU also generally marks the limit of known Frio production in normally pressured zones.
The Frio Stable Shelf Oil and Gas AU is a very mature area for both oil and gas production, having 197 oil accumulations and 239 gas accumulations that exceed the minimum accumulation size of 0.5 MMBOE (based on data from NRG Associates, Inc., 2006). Plots of (1) accumulation discovery year versus cumulative grown oil and (2) accumulation discovery year versus cumulative grown gas volume demonstrate the degree of maturity for oil and gas production in this AU (fig. 24). Cumulative grown oil volumes rose sharply in the early years of production but reached a plateau in the late 1960s that has continued to the present. Cumulative grown gas curves rose sharply until the early 1950s, followed by a much more gradual rise in production to the present. The trends in these plots indicate that production in the AU is very mature for both oil and gas.
In the USGS assessment process (Klett and others, 2003), oil and gas production data for discovered fields (NRG Associ-ates, Inc., 2006) were used to estimate the median oil and gas accumulation sizes, maximum oil and gas accumulations sizes, and number of undiscovered fields within a given AU. Figures 25A and B contains plots of field sizes for discovered oil and gas accumulations versus discovery year within the Frio Stable Shelf Oil and Gas AU; estimated field sizes for undiscovered fields also are plotted. All estimates (median, maximum, and number of accumulations) are included in appendix 1.
The median size of discovered oil accumulations in the Frio Stable Shelf Oil and Gas AU (fig. 25A) for the first third of production is 8.8 million barrels of oil (MMBO), for the second third of production is 2 MMBO, and for the third third of pro-duction is 1 MMBO. Because this is a mature AU for oil production and the geology of the area does not suggest any major new discoveries for oil, we estimated the median size of undiscovered oil accumulations to be 0.9 MMBO, which is slightly lower than that of the third third of production (1.0 MMBO). Previous studies indicated that a high degree of compartmentalization exists in reservoirs of fluvial and deltaic depositional systems (Jirik, 1990; McRae and Holtz, 1994, 1995; Knox and McRae, 1995), and some of these studies suggested that untapped compartments remain (Pendleton and Hardage, 1998). However, dis-coveries of untapped compartments are not expected to make significant changes in production trends.
On the basis of plots of accumulation discovery year versus grown oil accumulation size (fig. 25A), we estimated the mode and maximum of the number of undiscovered oil accumulations (greater than the minimum accumulation size of 0.5 MMBOE). We estimated a mode of 3 undiscovered accumulations, primarily because only three to four discoveries were made in the last

38 Geologic Assessment of Undiscovered Oil and Gas Resources—Oligocene Frio and Anahuac Formations
Frio
Stab
leS
helf
Oil
and
Gas
AU
Low
erC
reta
ceou
ssh
elfm
argi
n
Vic
ksb
urg
Fau
lt Z
on
e - p
ort
ion
co
nta
inin
g p
rim
arily
no
rmal
ly p
ress
ure
d re
serv
oir
s
Salt
wat
er/f
resh
wat
er in
terf
ace
(>10
,000
mg
/L d
isso
lved
so
lids
do
wn
dip
of l
ine)
Texa
s
Lou
isia
na
Mis
siss
ippi
Ala
bam
a
Ark
ansa
s
Mex
ico
Esti
mat
ed u
pd
ip e
xten
t o
f Olig
oce
ne
rock
s
EXP
LAN
ATI
ON
96°0
’W92
°0’W
88°0
’W
32°0
’N
26°0
’N
080
160
Mile
s40
011
022
0 K
ilom
eter
s55
Figu
re 2
3.
The
Frio
Sta
ble
Shel
f Oil
and
Gas
Asse
ssm
ent U
nit (
AU),
with
bou
ndar
ies
used
to d
efin
e th
e as
sess
men
t uni
t. Th
e es
timat
ed u
pdip
ext
ent o
f Ol
igoc
ene
rock
s is
bas
ed o
n Sc
hrub
en a
nd o
ther
s (1
998)
, and
Kin
g an
d Be
ikm
an (1
974)
; the
Low
er C
reta
ceou
s sh
elf m
argi
n is
mod
ified
from
Ew
ing
and
Lope
z (1
991)
; and
the
saltw
ater
/fres
hwat
er in
terfa
ce (d
isso
lved
sol
id c
once
ntra
tions
gre
ater
than
10,
000
mill
igra
ms
per l
iter a
re d
ownd
ip o
f lin
e) is
from
Pet
tijoh
n (1
996)
. The
Vic
ksbu
rg fa
ult z
one
is b
ased
prim
arily
on
Ewin
g an
d ot
hers
(199
0); h
owev
er, a
dditi
onal
repo
rts s
ugge
st th
at th
e fa
ult z
one
exte
nds
as fa
r eas
t as
the
Texa
s-Lo
uisi
ana
bord
er (C
olem
an a
nd G
allo
way
, 199
0; C
ombe
s, 1
993)
. Par
ts o
f the
Vic
ksbu
rg fa
ult z
one
in s
outh
Tex
as c
onta
inin
g ov
erpr
essu
red
rese
rvoi
rs a
re
not i
nclu
ded
with
in th
e Fr
io S
tabl
e Sh
elf O
il an
d Ga
s As
sess
men
t Uni
t.

Resource Assessment 39
Frio Stable Shelf Oil and Gas, Assessment Unit 50470135
0
500
1,000
1,500
2,000
2,500
3,000
3,500
4,000
4,500
5,000
1895 1905 1915 1925 1935 1945 1955 1965 1975 1985 1995 2005
ACCUMULATION-DISCOVERY YEAR
Frio Stable Shelf Oil and Gas, Assessment Unit 50470135
0
2,000
4,000
6,000
8,000
10,000
12,000
14,000
16,000
1895 1905 1915 1925 1935 1945 1955 1965 1975 1985 1995 2005
ACCUMULATION-DISCOVERY YEAR
A
B
CU
MU
LATI
VE
GR
OW
N G
AS
VO
LUM
E (B
CFG
)C
UM
ULA
TIV
E G
RO
WN
OIL
VO
LUM
E (M
MB
O)
Figure 24. Plots of (A) accumulation discovery year versus cumulative grown oil and (B) accumulation discovery year versus cumulative grown gas volume (T.R. Klett, U.S. Geological Survey, written commun., 2007; generated with data from NRG Associates, Inc., 2006) demonstrate the degree of maturity for oil and gas production in the Frio Stable Shelf Oil and Gas Assessment Unit. Abbreviations: MMBO, million barrels of oil; BCFG, billion cubic feet of gas.

40 Geologic Assessment of Undiscovered Oil and Gas Resources—Oligocene Frio and Anahuac Formations
0
1
10
100
1 ,000
10 ,000
1895 1905 1915 1925 1935 1945 1955 1965 1975 1985 1995 2005
A C C U M U LA TIO N -D IS C O V E R Y YE A R
GR
OW
N O
IL-A
CC
UM
ULA
TIO
N S
IZE
(MM
BO)
1st third 2nd third 3rd third
0.5 MMBO cutoff
1
10
100
1 ,000
10 ,000
1895 1905 1915 1925 1935 1945 1955 1965 1975 1985 1995 2005
A C C U M U LA TIO N -D IS C O V E R Y YE A R
GR
OW
N G
AS-A
CC
UM
ULA
TIO
N S
IZE
(BC
FG)
N = 12 N = 38N = 21
3 BCFG cutoff
1st third 3rd third2nd third
Medians of discovered reservoirs for each third of productionEstimated median forundiscovered reservoirs
Estimated maximumfor undiscovered reservoirs
EXPLANATION
Frio Stable Shelf Oil and Gas AU
Oil accumulationsA
B Gas accumulations
Medians of discovered reservoirs for each third of productionEstimated median forundiscovered reservoirs
Estimated maximumfor undiscovered reservoirs
EXPLANATION
N = 66 N = 66 N = 65
Figure 25. Oil (A) and gas (B) accumulation sizes versus discovery years for discovered fields within the Frio Stable Shelf Oil and Gas Assessment Unit (AU) (T.R. Klett, U.S. Geological Survey, written commun., 2007; generated with data from NRG Associates, Inc., 2006) showing how the estimates of field sizes for undiscovered fields were determined. Production data are divided into 1st, 2nd, and 3rd thirds of production, each third having an equal (or near equal) number of discovered fields (N). Estimates of the median and maximum accumulation sizes for undiscovered fields (yellow and orange triangles) are plotted outside of the graph. Solid line connects median values. Abbreviations: MMBO, million barrels of oil; BCFG, billion cubic feet of gas.

Resource Assessment 41
two decades. Given the geology of the AU, we do not expect this trend to change significantly. To include the possibility of discovery of additional reservoirs (or compartments), we estimated a maximum of 10 undiscovered oil accumulations, which is more than the number of discovered oil accumulations in the last 20 years.
The median size of discovered gas accumulations in the Frio Stable Shelf Oil and Gas AU for the first third of production is 24.3 BCFG, for the second third of production is 8.4 BCFG, and for the third third of production is 6.8 BCFG (fig. 25B). As stated above, trends in gas production in the Frio Stable Shelf Oil and Gas AU have been nearly level in the last few decades (fig. 24B). Because we expect this trend to continue, we estimated the median size of undiscovered gas accumulations to be 6 BCFG, which is slightly lower than the third third of production (6.8 BCFG). We estimated the mode of the number of gas accumulations to be 20, which similar to the trend observed in the last two decades (fig. 25). The maximum number of undiscov-ered gas accumulations was estimated to be 60, to allow for the possibility of additional, deeper gas deposits being discovered.
Frio Expanded Fault Zone Oil and Gas Assessment Unit The Frio Expanded Fault Zone AU (fig. 26) is a mature exploration area, and drilling densities are high—particularly
in the more shallow areas (based on data from IHS Energy Group, 2005a, b, and NRG Associates, Inc., 2006). In Texas, the updip boundary of the AU was based on (1) the updip extent of the Frio fault zone (fig. 9), a growth fault system occupying a belt about 64 km wide and having great potential for overpressured resources (Ewing, 1986, 1991a, 1991b; Ewing and others, 1990); and (2) the updip limit of production in Frio well intervals in the overpressured zone (based on data from the IHS Energy Group, 2005a; Wallace and others, 1978, 1981). The part of the Vicksburg fault zone containing overpressured reservoirs, in south Texas, was included within the Frio Expanded Fault Zone Oil and Gas AU. In Louisiana, the updip boundary was based on the presence of known production in the overpressured zone and unstable shelf areas (Paine and others, 1968; John and others, 1992b, c, d). The eastern boundary of the Frio Expanded Fault Zone AU is truncated at the Lower Cretaceous shelf margin.
The downdip boundary for this AU is the late Oligocene shelf margin at maximum progradation (Galloway and oth-ers, 2000). The shelf margin marks the downdip limit of siliciclastic shelf, carbonate shelf, and deltaic depositional systems (Galloway and others, 2000).
Depositional systems in this AU include barrier-island, strandplain, deltaic, and shelf environments (Galloway and others, 1982, 1983, 2000; John and others, 1992b, c, d). The Frio Expanded Fault Zone Oil and Gas AU is characterized by maximum vertical thickening due to growth faulting (refer to discussion in “Geologic Model” section). Reservoirs in the Frio Expanded Fault Zone Oil and Gas AU are thicker (average thickness of 56 ft) than those in the Frio Stable Shelf Oil and Gas AU (aver-age thickness of 34 ft) (based on data from NRG Associates, Inc., 2006). Structure contour maps generated from published data (Dodge and Posey, 1981; Bebout and Gutierrez, 1982, 1983) indicate that the depth to the top of the Frio in the AU ranges from a minimum of about 5,000 ft in south Texas to a maximum of nearly 16,000 ft in southern Louisiana.
The average depth to the top of reservoirs in this AU is 9,050 ft. Porosity averages 27 percent, and permeability averages 636 md. In general, fields in the Frio Expanded Fault Zone Oil and Gas AU are overpressured. Average reservoir pressures are 5,116 psi, and average temperatures (including both reservoir and bottomhole temperatures) are 226 °F (based on data from NRG Associates, Inc., 2006).
The Frio Expanded Fault Zone Oil and Gas AU is a mature area for oil and gas production, having 159 discovered oil accumulations and 388 discovered gas accumulations that exceed the minimum accumulation size of 0.5 MMBOE (based on data from NRG Associates, Inc., 2006). Plots of accumulation discovery year versus cumulative grown oil volumes (fig. 27A) show a sharp rise in the early years of production, followed by a flattening of the cumulative grown oil curve beginning in the mid-1960s and continuing to the present. Based on this plot, oil production is very mature in the AU. Similar plots for gas show that cumulative grown gas volumes rose sharply until the mid 1960s and then changed to a much more gradual rise that has continued to the present (fig. 27B). The production curves suggest that gas production is not quite as mature as oil production in the AU. The expanded fault zone has potential for undiscovered deep gas accumulations, as suggested by plots of reservoir discovery year versus reservoir depth (fig. 28).
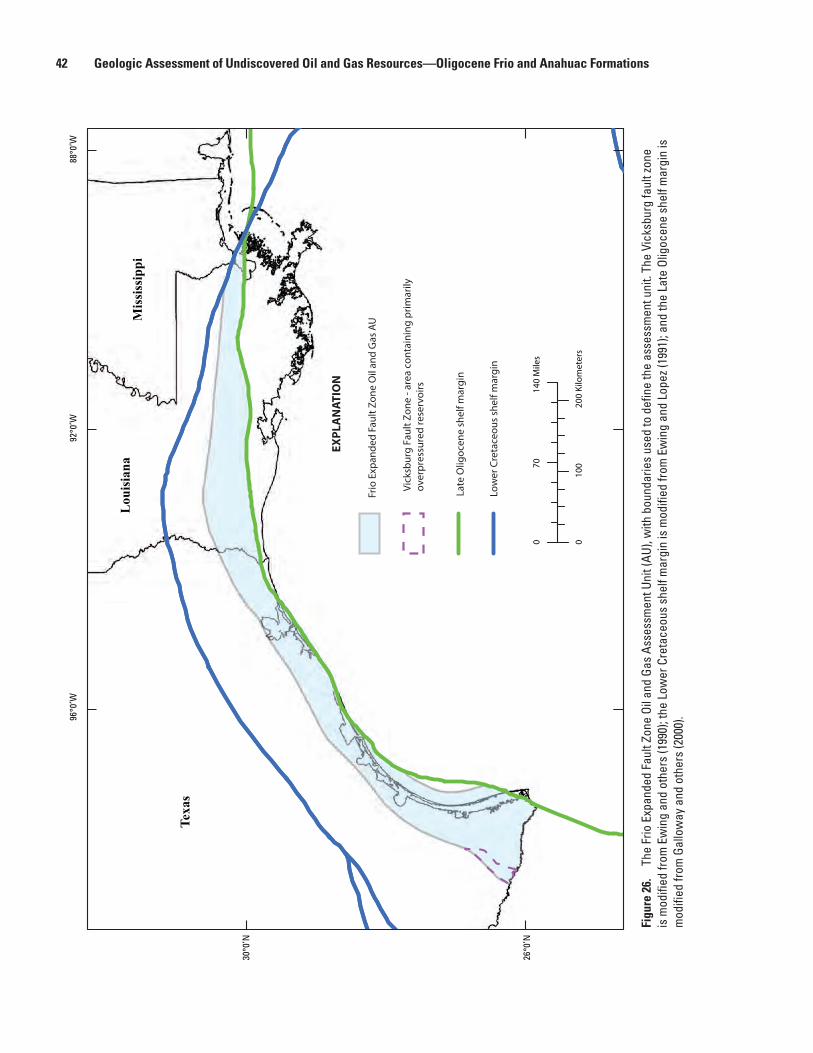
42 Geologic Assessment of Undiscovered Oil and Gas Resources—Oligocene Frio and Anahuac Formations
Figu
re 2
6.
The
Frio
Exp
ande
d Fa
ult Z
one
Oil a
nd G
as A
sses
smen
t Uni
t (AU
), w
ith b
ound
arie
s us
ed to
def
ine
the
asse
ssm
ent u
nit.
The
Vick
sbur
g fa
ult z
one
is m
odifi
ed fr
om E
win
g an
d ot
hers
(199
0); t
he L
ower
Cre
tace
ous
shel
f mar
gin
is m
odifi
ed fr
om E
win
g an
d Lo
pez (
1991
); an
d th
e La
te O
ligoc
ene
shel
f mar
gin
is
mod
ified
from
Gal
low
ay a
nd o
ther
s (2
000)
.
Late
Olig
ocen
e sh
elf m
argi
n
Vick
sbur
g Fa
ult Z
one
- are
a co
ntai
ning
prim
arily
ov
erpr
essu
red
rese
rvoi
rs
EXPL
AN
ATIO
N
Frio
Exp
ande
d Fa
ult Z
one
Oil
and
Gas
AU
Low
er C
reta
ceou
s sh
elf m
argi
n
140
Mile
s0
70
200
Kilo
met
ers
010
0
Texa
s
Lou
isia
naM
issi
ssip
pi
30°0
’N
26°0
’N
96°0
’W92
°0’W
88°0
’W

Resource Assessment 43
Frio Expanded Fault Zone Oil and Gas, Assessment Unit 50470136
0
500
1,000
1,500
2,000
2,500
3,000
1895 1905 1915 1925 1935 1945 1955 1965 1975 1985 1995 2005
ACCUMULATION-DISCOVERY YEAR
CU
MU
LATI
VE
GR
OW
N O
IL V
OLU
ME
(MM
BO
)
Frio Expanded Fault Zone Oil and Gas, Assessment Unit 50470136
0
5,000
10,000
15,000
20,000
25,000
30,000
35,000
1895 1905 1915 1925 1935 1945 1955 1965 1975 1985 1995 2005
ACCUMULATION-DISCOVERY YEAR
A
B
CU
MU
LATI
VE
GR
OW
N G
AS
VO
LUM
E (B
CFG
)
Figure 27. Plots of (A) accumulation discovery year versus cumulative grown oil volume and (B) accumulation discovery year versus cumulative grown gas volume (T.R. Klett, U.S. Geological Survey, written commun., 2007; generated with data from NRG Associates, Inc., 2006) demonstrate the degree of maturity for oil and gas production in the Frio Expanded Fault Zone Oil and Gas Assessment Unit. Abbreviations: MMBO, million barrels of oil; BCFG, billion cubic feet of gas.

44 Geologic Assessment of Undiscovered Oil and Gas Resources—Oligocene Frio and Anahuac Formations
The median size of discovered oil accumulations in the Frio Expanded Fault Zone Oil and Gas AU for the first third of production is 10.1 MMBO, for the second third of production is 2.2 MMBO, and for the third third of production is 1.3 MMBO (fig. 29A). Because oil production is very mature in this AU, and the geology of the area does not suggest that there are major new undiscovered oil accumulations, we estimated the median size of undiscovered oil accumulations to be 1.1 MMBO, an amount slightly lower than that of the third third of production (1.3 MMBO). This estimate is based on the potential for undis-covered oil in untapped compartments of barrier island, strand plain, deltaic, and shelf environments in the AU.
Owing to the few number of discoveries of oil accumulations in this AU in the last 15 years, we estimated a mode of 8 for the number of undiscovered oil accumulations (fig. 29A). On the basis of the same production data, 20 was estimated as the maximum number of undiscovered oil accumulations.
The median size of discovered gas accumulations in the Frio Expanded Fault Zone Oil and Gas AU for the first third of production is 55.6 BCFG, for the second third of production is 19.8 BCFG, and for the third third of production is 16.2 BCFG (fig. 29B). As discussed earlier, trends in gas production in the Frio Expanded Fault Zone Oil and Gas AU have been rising slightly in the last few decades, probably as a result of production from deeper gas accumulations. Because we expect this trend in production of deeper gas deposits to continue, we estimated the median size of undiscovered gas accumulations to be 15 BCFG, which is slightly lower than the median size of the third third of discovered gas accumulations (16.2 BCFG). We esti-mated the maximum size of gas accumulations to be 200 BCFG, based on the size of gas discoveries in the last few decades.
We estimated the mode of the number of gas accumulations to be 50, based on an assumption that the rate of discoveries in the last two decades would continue at about the same level (fig. 29B). The maximum number of undiscovered gas accumula-tions was estimated to be 130, to allow for potential additional discoveries of deeper gas accumulations.
Frio Expanded Fault Zone Oil and Gas, Assessment Unit 50470136
0
2,000
4,000
6,000
8,000
10,000
12,000
14,000
16,000
18,0001895 1905 1915 1925 1935 1945 1955 1965 1975 1985 1995 2005
RESERVOIR-DISCOVERY YEAR
RES
ERVO
IR D
EPTH
, GA
S A
CC
UM
ULA
TIO
NS
(feet
)
Figure 28. Plots of reservoir discovery year versus reservoir depth for gas for the Frio Expanded Fault Zone Oil and Gas Assessment Unit (T.R. Klett, U.S. Geological Survey, written commun., 2007; generated with data from NRG Associates, Inc., 2006).

Resource Assessment 45
Frio Expanded Fault Zone Oil and Gas AU
Oil accumulations
Gas accumulations
0
1
10
100
1 ,000
1895 1905 1915 1925 1935 1945 1955 1965 1975 1985 1995 2005
ACCUM ULATION-DISCOVERY YEAR
GR
OW
N O
IL-A
CC
UM
ULA
TIO
N S
IZE
(M
MB
O)
1st third 2nd third 3rd third
0.5 MMBO cutoff
1
10
100
1 ,000
10 ,000
1895 1905 1915 1925 1935 1945 1955 1965 1975 1985 1995 2005
ACCUM ULATION-DISCOVERY YEAR
GR
OW
N G
AS
-AC
CU
MU
LAT
ION
SIZ
E
(BC
FG
)
N = 129 N = 130 N = 129
3 BCFG cutoff
1st third 2nd third 3rd thirdMedians of discovered reservoirs for each third of productionEstimated median forundiscovered reservoirs
Estimated maximumfor undiscovered reservoirs
EXPLANATION
A
B
Medians of discovered reservoirs for each third of productionEstimated median forundiscovered reservoirs
Estimated maximumfor undiscovered reservoirs
EXPLANATION
N = 53 N = 53 N = 53
Figure 29. Oil (A) and gas (B) accumulation size versus discovery years for discovered fields within the Frio Expanded Fault Zone Oil and Gas Assessment Unit (AU) (T.R. Klett, U.S. Geological Survey, written commun., 2007; generated with data from NRG Associates, Inc., 2006), showing how the estimates of field sizes for undiscovered fields were determined. Production data are divided into 1st, 2nd, and 3rd thirds of production, each third having an equal (or near equal) number of discovered fields (N). Estimates of the median and maximum accumulation sizes for undiscovered fields (yellow and orange triangles) are plotted outside of the graph. Solid line connects median values. Abbreviations: MMBO, million barrels of oil; BCFG, billion cubic feet of gas.
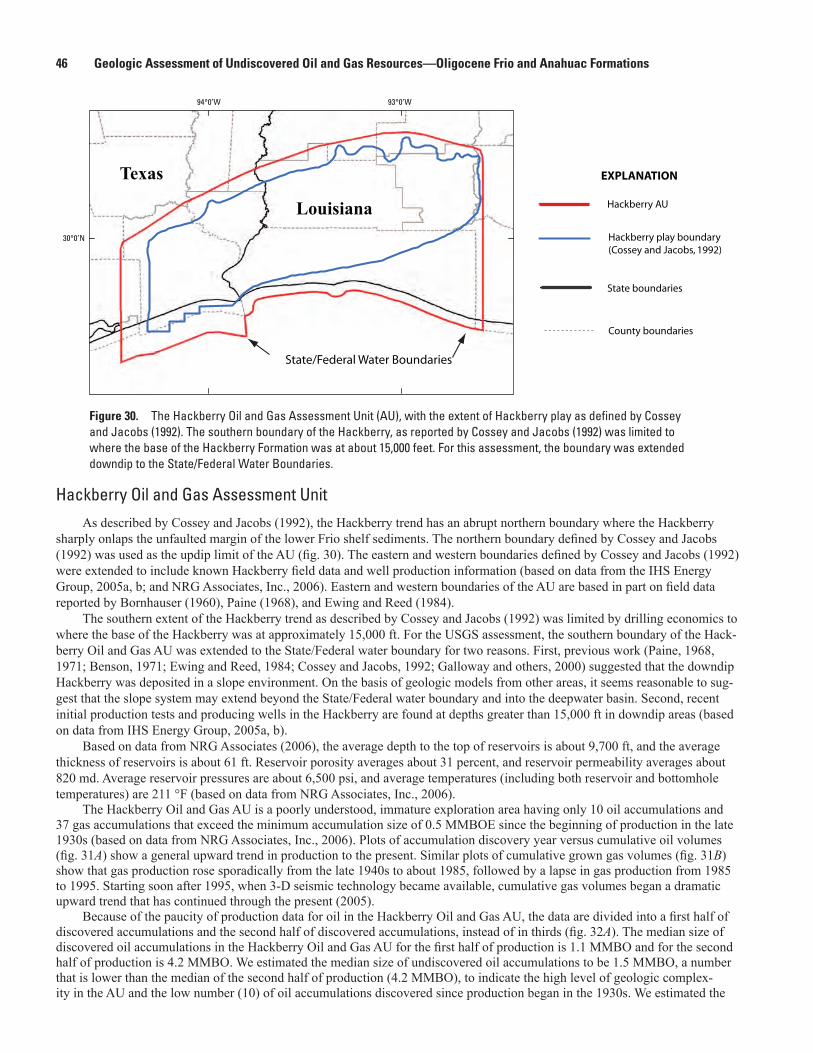
46 Geologic Assessment of Undiscovered Oil and Gas Resources—Oligocene Frio and Anahuac Formations
Hackberry Oil and Gas Assessment Unit As described by Cossey and Jacobs (1992), the Hackberry trend has an abrupt northern boundary where the Hackberry
sharply onlaps the unfaulted margin of the lower Frio shelf sediments. The northern boundary defined by Cossey and Jacobs (1992) was used as the updip limit of the AU (fig. 30). The eastern and western boundaries defined by Cossey and Jacobs (1992) were extended to include known Hackberry field data and well production information (based on data from the IHS Energy Group, 2005a, b; and NRG Associates, Inc., 2006). Eastern and western boundaries of the AU are based in part on field data reported by Bornhauser (1960), Paine (1968), and Ewing and Reed (1984).
The southern extent of the Hackberry trend as described by Cossey and Jacobs (1992) was limited by drilling economics to where the base of the Hackberry was at approximately 15,000 ft. For the USGS assessment, the southern boundary of the Hack-berry Oil and Gas AU was extended to the State/Federal water boundary for two reasons. First, previous work (Paine, 1968, 1971; Benson, 1971; Ewing and Reed, 1984; Cossey and Jacobs, 1992; Galloway and others, 2000) suggested that the downdip Hackberry was deposited in a slope environment. On the basis of geologic models from other areas, it seems reasonable to sug-gest that the slope system may extend beyond the State/Federal water boundary and into the deepwater basin. Second, recent initial production tests and producing wells in the Hackberry are found at depths greater than 15,000 ft in downdip areas (based on data from IHS Energy Group, 2005a, b).
Based on data from NRG Associates (2006), the average depth to the top of reservoirs is about 9,700 ft, and the average thickness of reservoirs is about 61 ft. Reservoir porosity averages about 31 percent, and reservoir permeability averages about 820 md. Average reservoir pressures are about 6,500 psi, and average temperatures (including both reservoir and bottomhole temperatures) are 211 °F (based on data from NRG Associates, Inc., 2006).
The Hackberry Oil and Gas AU is a poorly understood, immature exploration area having only 10 oil accumulations and 37 gas accumulations that exceed the minimum accumulation size of 0.5 MMBOE since the beginning of production in the late 1930s (based on data from NRG Associates, Inc., 2006). Plots of accumulation discovery year versus cumulative oil volumes (fig. 31A) show a general upward trend in production to the present. Similar plots of cumulative grown gas volumes (fig. 31B) show that gas production rose sporadically from the late 1940s to about 1985, followed by a lapse in gas production from 1985 to 1995. Starting soon after 1995, when 3-D seismic technology became available, cumulative gas volumes began a dramatic upward trend that has continued through the present (2005).
Because of the paucity of production data for oil in the Hackberry Oil and Gas AU, the data are divided into a first half of discovered accumulations and the second half of discovered accumulations, instead of in thirds (fig. 32A). The median size of discovered oil accumulations in the Hackberry Oil and Gas AU for the first half of production is 1.1 MMBO and for the second half of production is 4.2 MMBO. We estimated the median size of undiscovered oil accumulations to be 1.5 MMBO, a number that is lower than the median of the second half of production (4.2 MMBO), to indicate the high level of geologic complex-ity in the AU and the low number (10) of oil accumulations discovered since production began in the 1930s. We estimated the
Hackberry AU
Hackberry play boundary (Cossey and Jacobs, 1992)
State boundaries
County boundaries
State/Federal Water Boundaries
Louisiana
Texas EXPLANATION
94°0’W 93°0’W
30°0’N
Figure 30. The Hackberry Oil and Gas Assessment Unit (AU), with the extent of Hackberry play as defined by Cossey and Jacobs (1992). The southern boundary of the Hackberry, as reported by Cossey and Jacobs (1992) was limited to where the base of the Hackberry Formation was at about 15,000 feet. For this assessment, the boundary was extended downdip to the State/Federal Water Boundaries.
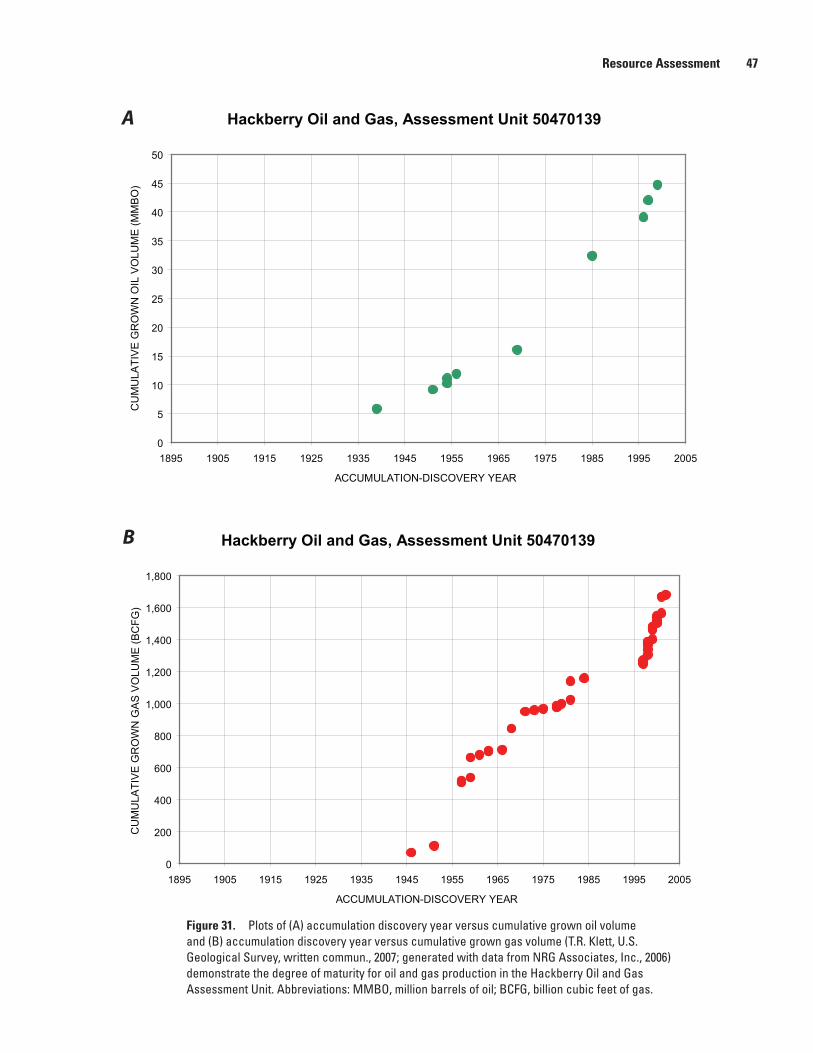
Resource Assessment 47
Hackberry Oil and Gas, Assessment Unit 50470139
0
200
400
600
800
1,000
1,200
1,400
1,600
1,800
1895 1905 1915 1925 1935 1945 1955 1965 1975 1985 1995 2005
ACCUMULATION-DISCOVERY YEAR
CU
MU
LATI
VE
GR
OW
N G
AS
VO
LUM
E (B
CFG
)Hackberry Oil and Gas, Assessment Unit 50470139
0
5
10
15
20
25
30
35
40
45
50
1895 1905 1915 1925 1935 1945 1955 1965 1975 1985 1995 2005
ACCUMULATION-DISCOVERY YEAR
CU
MU
LATI
VE
GR
OW
N O
IL V
OLU
ME
(MM
BO
)A
B
Figure 31. Plots of (A) accumulation discovery year versus cumulative grown oil volume and (B) accumulation discovery year versus cumulative grown gas volume (T.R. Klett, U.S. Geological Survey, written commun., 2007; generated with data from NRG Associates, Inc., 2006) demonstrate the degree of maturity for oil and gas production in the Hackberry Oil and Gas Assessment Unit. Abbreviations: MMBO, million barrels of oil; BCFG, billion cubic feet of gas.

48 Geologic Assessment of Undiscovered Oil and Gas Resources—Oligocene Frio and Anahuac Formations
Figure 32. Oil (A) and gas (B) accumulation sizes versus discovery years for discovered fields within the Hackberry Oil and Gas Assessment Unit (AU) (T.R. Klett, U.S. Geological Survey, written commun., 2007; generated with data from NRG Associates, Inc., 2006), showing how the estimates of field sizes for undiscovered fields were determined. Production data are divided into 1st and 2nd halves of production for oil accumulation (because there were not enough data for 3 thirds); data are divided into 1st, 2nd, and 3rd thirds for gas accumulations. Each third has an equal (or near equal) number of discovered fields (N). Estimates of the median and maximum accumulation sizes for undiscovered fields (yellow and orange triangles) are plotted outside of the graph. Solid line connects median values. Abbreviations: MMBO, million barrels of oil; BCFG, billion cubic feet of gas.
Hackberry O il and Gas AU
1
10
100
1 ,000
1895 1905 1915 1925 1935 1945 1955 1965 1975 1985 1995 2005
ACCUM ULATION-DISCOVERY YEAR
GR
OW
N G
AS
-AC
CU
MU
LAT
ION
SIZ
E (
BC
FG
)
N = 12 N = 13 N = 12
3 BCFG cutoff
1st third 2nd third
3rd third
Medians of discovered reservoirs for each third of productionEstimated median forundiscovered reservoirs
Estimated maximumfor undiscovered reservoirs
EXPLANATION
Oil accumulation sizes
Gas accumulation sizes
0
1
10
100
1895 1905 1915 1925 1935 1945 1955 1965 1975 1985 1995 2005
ACCUM ULATION-DISCOVERY YEAR
GR
OW
N O
IL-A
CC
UM
ULA
TIO
N S
IZE
(M
MB
O)
0.5 MMBO cutoff
1st half 2nd half
Medians of discovered reservoirs for each third of productionEstimated median forundiscovered reservoirs
Estimated maximumfor undiscovered reservoirs
EXPLANATION
A
B
N = 5 N = 5

Resource Assessment 49
maximum size of undiscovered oil accumulations to be 20 MMBO, to acknowledge the possibility of large undiscovered oil accumulations, based on the highest accumulation sizes in the past (fig. 32A). Because there are only 10 discovered oil accumu-lations in the Hackberry Oil and Gas AU, for the number of undiscovered oil accumulations, we estimated a mode of 5 and a maximum of 30.
The median size of discovered gas accumulations in the Hackberry Oil and Gas AU for the first third of production is 32 BCFG, for the second third of production is 24.1 BCFG, and for the third third of production is 16.7 BCFG (fig. 32B). As stated above, trends in cumulative gas production in the Hackberry Oil and Gas AU rose dramatically after 1995, probably as a result of 3-D seismic technology. We estimated the median size of undiscovered gas accumulations to be 15 BCFG, which is slightly lower than the median size of the third third of discovered gas accumulations (16.7 BCFG), to indicate a continuing potential for undiscovered deep gas accumulations. On the basis of plots of accumulation discovery year versus gas accumula-tion size, we estimated the maximum size of gas accumulations to be 400 BCFG, given the maximum accumulation size of gas over the production history of the area (fig. 32B). We estimated the mode of the number of gas accumulations to be 50, primar-ily based on the rate of discoveries of gas accumulations in the Hackberry AU from 1995 to the present and on the continuing potential for undiscovered deep gas accumulations. The maximum number of undiscovered gas accumulations was estimated to be 150, to indicate the potential for a large number of reservoirs in this poorly understood production area.
Frio Slope and Basin Floor Gas Assessment Unit The updip boundary of the Frio Slope and Basin Floor Gas AU (fig. 33) is the late Oligocene shelf margin (Galloway and
others, 2000), and the downdip boundary is the State/Federal water boundary. Well data are sparse in this AU, which does not contain any discovered hydrocarbon reservoirs greater than the minimum cutoff of 0.5 MMBOE (based on data in NRG Associ-ates, Inc., 2006). Only general estimates of depth and thickness of the Frio are possible. Based on structure contour and isopach maps generated from published data (Bebout and Gutierrez, 1982, 1983; Dodge and Posey, 1981), depth (from sea level) to the top of the Frio in this AU ranges from about 8,000 ft in Texas to approximately 18,000 ft in southern Louisiana, and the thick-ness of the Frio ranges from about 2,000 ft in the eastern part of southern Louisiana to about 9,000 ft in central Texas and south Texas.
The Hackberry trend, a slope facies depositional system (see “Depositional Systems” section), was used as an analog to estimate the numbers and sizes of undiscovered hydrocarbon accumulations in the Frio Slope and Basin Floor AU. Because the downdip boundary for the Frio Slope and Basin Floor Gas AU is the State/Federal water boundary, the AU is very narrow or absent in areas along the coast of Texas where the Frio is thickest (about 9,000 ft thick). The AU is much greater in areal extent in southern Louisiana, but a lack of well data makes it difficult to estimate thickness of the Frio in this area. Because previous studies suggest a limited clastic influx in the eastern part of the Gulf during the Oligocene (Liu and others, 1997; Galloway and others, 2000), we estimated the Frio to be thinner in southern Louisiana (particularly the eastern part of southern Louisiana) than in areas of Texas (where thicknesses probably reach 9,000 ft). On the basis of the Hackberry analog, we would expect sands of the slope and basin floor systems for the Frio to be primarily downdip of the State/Federal water boundaries. The presence of sands in offshore areas is verified in a report by the U.S. Minerals Management Service (Bascle and others, 2001), where the Middle Oligocene Fan 1 Play is described as having a deep-sea fan depositional style, with sediments deposited basinward of the shelf edges associated with the Middle Oligocene. However, because the AU is delimited by the State/Federal water bound-aries, the total amount of slope sands and slope fan sands within the AU are expected to be very limited. For all of the reasons described above, the estimates for the number and sizes of undiscovered reservoirs in the Frio Slope and Basin Floor AU are relatively low in comparison to the slope and basin floor AUs of the other Tertiary stratigraphic intervals assessed (Dubiel and others, 2007). The greatest size and numbers of undiscovered accumulations are estimated for gas accumulations, owing to the depths to the top of the Frio in the AU (depths up to about 18,000 ft) and modeled thermal maturities at these depths.
Because the area of the Frio Slope and Basin Floor AU is about 3 times that of the Hackberry Oil and Gas AU, estimates of undiscovered hydrocarbon resources reflect the potential for discovery of larger numbers and volumes of gas accumulations compared to the Hackberry AU. The estimates also take into account the decreased sediment load in southern Louisiana com-pared to deltas in the Rio Grande and Houston embayments. Given all of these factors, the median size of undiscovered gas accumulations was estimated to be 18 BCFG, a number slightly higher than the median size (15 BCFG) estimated for the Hack-berry Oil and Gas AU. The mode of the number of undiscovered gas accumulations was estimated to be 70, a number greater than the mode of 50 estimated for the Hackberry AU.
Area and thickness of the Frio Formation were among the factors considered in the estimation of the number (mode of 20) and size (median of 2) of undiscovered oil accumulations for the Frio Slope and Basin Floor AU. The potential for undiscov-ered oil accumulations was estimated to be low, particularly compared to the amount and volume of discovered and estimated undiscovered oil accumulations in the Frio Expanded Fault Zone Oil and Gas AU. The estimates for the Frio Slope and Basin Floor AU were based on knowledge that the Frio Formation in this AU is in the gas window, as indicated by thermal maturation studies (Rowan and others, 2007). Most of the liquid hydrocarbons that may originally have been in Frio slope and basin floor reservoirs have most likely cracked to gas, resulting in fewer and smaller oil accumulations than expected based solely on trap size and depth.
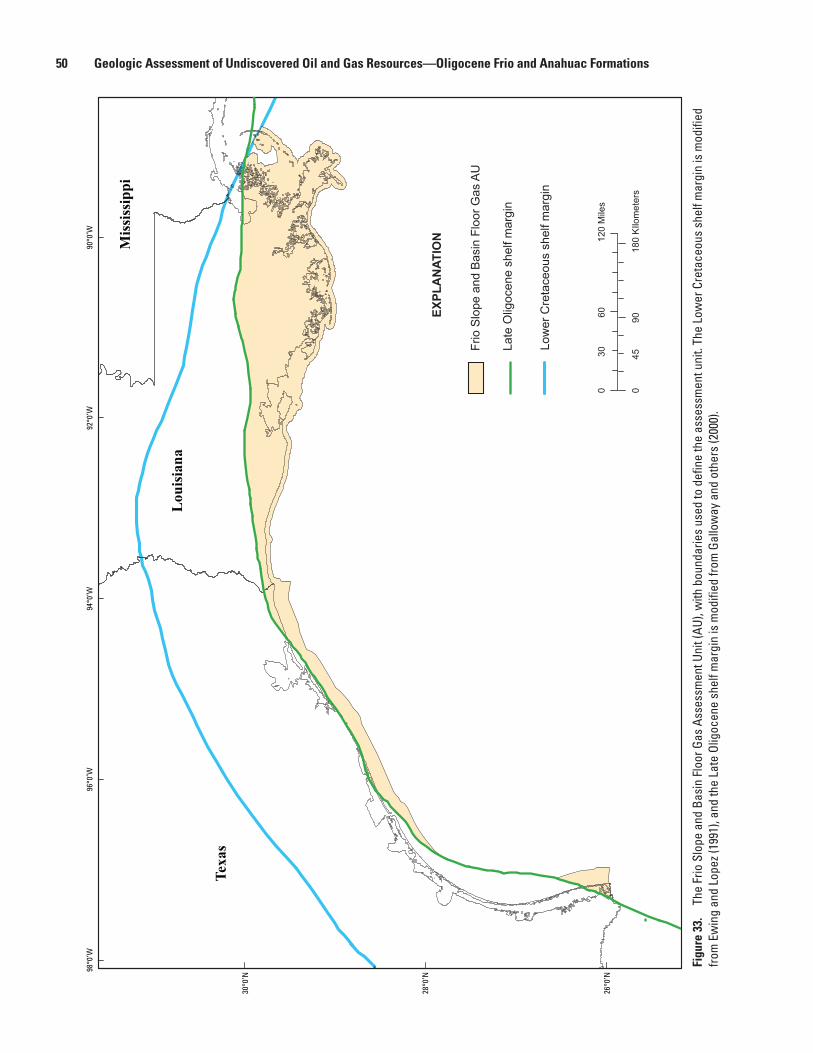
50 Geologic Assessment of Undiscovered Oil and Gas Resources—Oligocene Frio and Anahuac Formations
Figu
re 3
3.
The
Frio
Slo
pe a
nd B
asin
Flo
or G
as A
sses
smen
t Uni
t (AU
), w
ith b
ound
arie
s us
ed to
def
ine
the
asse
ssm
ent u
nit.
The
Low
er C
reta
ceou
s sh
elf m
argi
n is
mod
ified
fro
m E
win
g an
d Lo
pez (
1991
), an
d th
e La
te O
ligoc
ene
shel
f mar
gin
is m
odifi
ed fr
om G
allo
way
and
oth
ers
(200
0).
060
120
Mile
s30
090
180
KIlo
met
ers
45
Late
Olig
ocen
e sh
elf m
argi
n
Texa
s
Lou
isia
na
Mis
siss
ippi
EXPL
AN
ATIO
N
Low
er C
reta
ceou
s sh
elf m
argi
n
Frio
Slo
pe a
nd B
asin
Flo
or G
as A
U
98°0
’W96
°0’W
94°0
’W92
°0’W
90°0
’W
30°0
’N
28°0
’N
26°0
’N
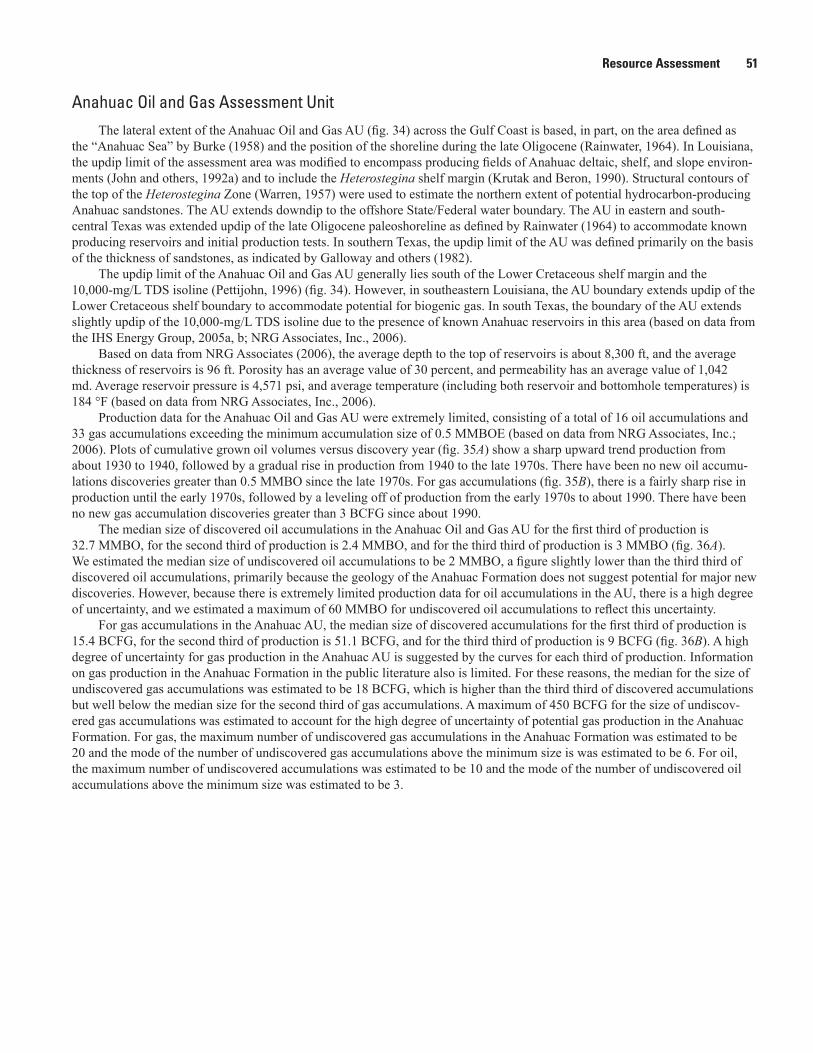
Resource Assessment 51
Anahuac Oil and Gas Assessment UnitThe lateral extent of the Anahuac Oil and Gas AU (fig. 34) across the Gulf Coast is based, in part, on the area defined as
the “Anahuac Sea” by Burke (1958) and the position of the shoreline during the late Oligocene (Rainwater, 1964). In Louisiana, the updip limit of the assessment area was modified to encompass producing fields of Anahuac deltaic, shelf, and slope environ-ments (John and others, 1992a) and to include the Heterostegina shelf margin (Krutak and Beron, 1990). Structural contours of the top of the Heterostegina Zone (Warren, 1957) were used to estimate the northern extent of potential hydrocarbon-producing Anahuac sandstones. The AU extends downdip to the offshore State/Federal water boundary. The AU in eastern and south-central Texas was extended updip of the late Oligocene paleoshoreline as defined by Rainwater (1964) to accommodate known producing reservoirs and initial production tests. In southern Texas, the updip limit of the AU was defined primarily on the basis of the thickness of sandstones, as indicated by Galloway and others (1982).
The updip limit of the Anahuac Oil and Gas AU generally lies south of the Lower Cretaceous shelf margin and the 10,000-mg/L TDS isoline (Pettijohn, 1996) (fig. 34). However, in southeastern Louisiana, the AU boundary extends updip of the Lower Cretaceous shelf boundary to accommodate potential for biogenic gas. In south Texas, the boundary of the AU extends slightly updip of the 10,000-mg/L TDS isoline due to the presence of known Anahuac reservoirs in this area (based on data from the IHS Energy Group, 2005a, b; NRG Associates, Inc., 2006).
Based on data from NRG Associates (2006), the average depth to the top of reservoirs is about 8,300 ft, and the average thickness of reservoirs is 96 ft. Porosity has an average value of 30 percent, and permeability has an average value of 1,042 md. Average reservoir pressure is 4,571 psi, and average temperature (including both reservoir and bottomhole temperatures) is 184 °F (based on data from NRG Associates, Inc., 2006).
Production data for the Anahuac Oil and Gas AU were extremely limited, consisting of a total of 16 oil accumulations and 33 gas accumulations exceeding the minimum accumulation size of 0.5 MMBOE (based on data from NRG Associates, Inc.; 2006). Plots of cumulative grown oil volumes versus discovery year (fig. 35A) show a sharp upward trend production from about 1930 to 1940, followed by a gradual rise in production from 1940 to the late 1970s. There have been no new oil accumu-lations discoveries greater than 0.5 MMBO since the late 1970s. For gas accumulations (fig. 35B), there is a fairly sharp rise in production until the early 1970s, followed by a leveling off of production from the early 1970s to about 1990. There have been no new gas accumulation discoveries greater than 3 BCFG since about 1990.
The median size of discovered oil accumulations in the Anahuac Oil and Gas AU for the first third of production is 32.7 MMBO, for the second third of production is 2.4 MMBO, and for the third third of production is 3 MMBO (fig. 36A). We estimated the median size of undiscovered oil accumulations to be 2 MMBO, a figure slightly lower than the third third of discovered oil accumulations, primarily because the geology of the Anahuac Formation does not suggest potential for major new discoveries. However, because there is extremely limited production data for oil accumulations in the AU, there is a high degree of uncertainty, and we estimated a maximum of 60 MMBO for undiscovered oil accumulations to reflect this uncertainty.
For gas accumulations in the Anahuac AU, the median size of discovered accumulations for the first third of production is 15.4 BCFG, for the second third of production is 51.1 BCFG, and for the third third of production is 9 BCFG (fig. 36B). A high degree of uncertainty for gas production in the Anahuac AU is suggested by the curves for each third of production. Information on gas production in the Anahuac Formation in the public literature also is limited. For these reasons, the median for the size of undiscovered gas accumulations was estimated to be 18 BCFG, which is higher than the third third of discovered accumulations but well below the median size for the second third of gas accumulations. A maximum of 450 BCFG for the size of undiscov-ered gas accumulations was estimated to account for the high degree of uncertainty of potential gas production in the Anahuac Formation. For gas, the maximum number of undiscovered gas accumulations in the Anahuac Formation was estimated to be 20 and the mode of the number of undiscovered gas accumulations above the minimum size is was estimated to be 6. For oil, the maximum number of undiscovered accumulations was estimated to be 10 and the mode of the number of undiscovered oil accumulations above the minimum size was estimated to be 3.
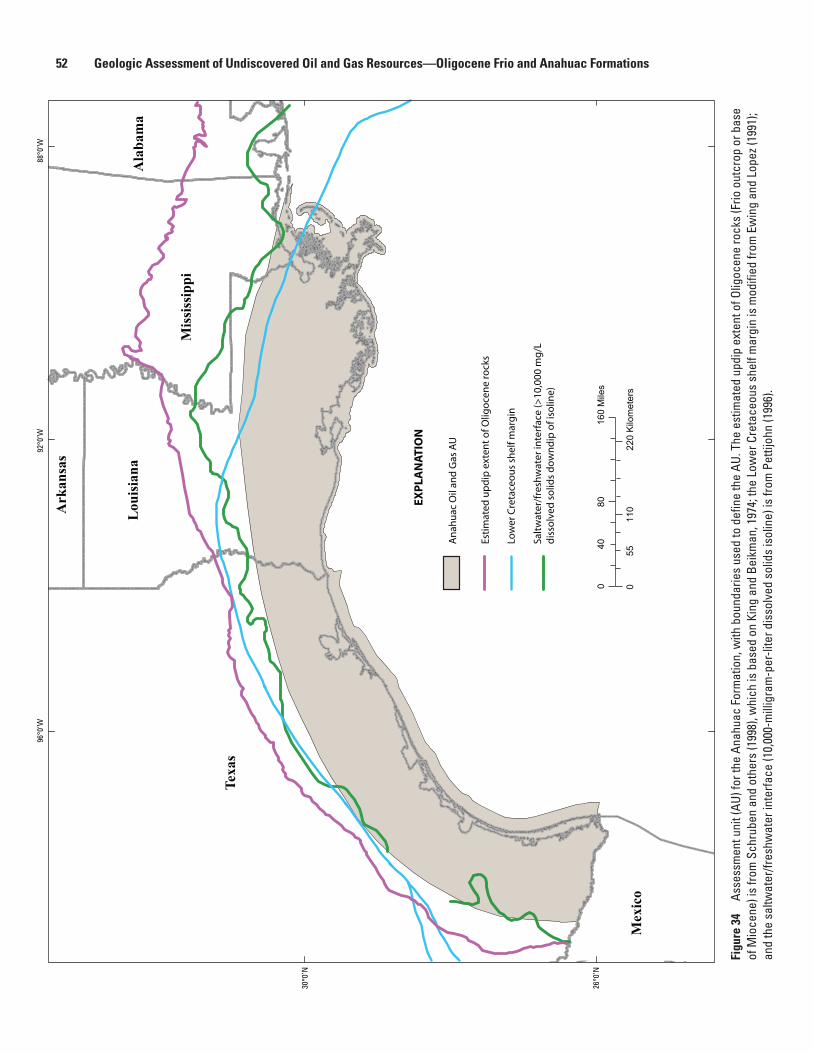
52 Geologic Assessment of Undiscovered Oil and Gas Resources—Oligocene Frio and Anahuac Formations
Figu
re 3
4 As
sess
men
t uni
t (AU
) for
the
Anah
uac
Form
atio
n, w
ith b
ound
arie
s us
ed to
def
ine
the
AU. T
he e
stim
ated
upd
ip e
xten
t of O
ligoc
ene
rock
s (F
rio o
utcr
op o
r bas
e of
Mio
cene
) is
from
Sch
rube
n an
d ot
hers
(199
8), w
hich
is b
ased
on
King
and
Bei
kman
, 197
4; th
e Lo
wer
Cre
tace
ous
shel
f mar
gin
is m
odifi
ed fr
om E
win
g an
d Lo
pez (
1991
); an
d th
e sa
ltwat
er/fr
eshw
ater
inte
rface
(10,
000-
mill
igra
m-p
er-li
ter d
isso
lved
sol
ids
isol
ine)
is fr
om P
ettij
ohn
(199
6).
080
160
Mile
s40
011
022
0 K
ilom
eter
s55
Salt
wat
er/f
resh
wat
er in
terf
ace
(>10
,000
mg
/Ld
isso
lved
so
lids
do
wn
dip
of i
solin
e)
Mis
siss
ippi
Ark
ansa
s
Texa
s
Ala
bam
a
Mex
ico
Lou
isia
na
Esti
mat
ed u
pd
ip e
xten
t o
f Olig
oce
ne
rock
s
Low
er C
reta
ceo
us
shel
f mar
gin
An
ahu
ac O
il an
d G
as A
U
EXP
LAN
ATI
ON
96°0
’W92
°0’W
88°0
’W
30°0
’N
26°0
’N

Resource Assessment 53
Figure 35. Plots of (A) accumulation discovery year versus cumulative grown oil and (B) accumulation discovery year versus cumulative grown gas volume (T.R. Klett, U.S. Geological Survey, written commun., 2007; generated with data from NRG Associates, Inc., 2006) demonstrate the degree of maturity for oil and gas production in the Anahuac Oil and Gas Assessment Unit. Abbreviations: MMBO, million barrels of oil; BCFG, billion cubic feet of gas.
A
B
Anahuac Oil and Gas, Assessment Unit 50470138
0
50
100
150
200
250
300
350
1895 1905 1915 1925 1935 1945 1955 1965 1975 1985 1995 2005
ACCUMULATION-DISCOVERY YEAR
CU
MU
LATI
VE
GR
OW
N O
IL V
OLU
ME
(MM
BO
)
Anahuac Oil and Gas, Assessment Unit 50470138
0
500
1,000
1,500
2,000
2,500
3,000
1895 1905 1915 1925 1935 1945 1955 1965 1975 1985 1995 2005
ACCUMULATION-DISCOVERY YEAR
CU
MU
LATI
VE
GR
OW
N G
AS
VO
LUM
E (B
CFG
)

54 Geologic Assessment of Undiscovered Oil and Gas Resources—Oligocene Frio and Anahuac Formations
Figure 36. Oil (A) and gas (B) accumulation sizes versus discovery years for discovered fields within the Anahuac Oil and Gas Assessment Unit (AU) (T.R. Klett, U.S. Geological Survey, written commun., 2007; generated with data from NRG Associates, Inc., 2006), showing how the estimates of field sizes for undiscovered fields were determined. Production data are divided into 1st, 2nd, and 3rd thirds of production, each third having an equal (or near equal) number of discovered fields (N). Estimates of the median and maximum accumulation sizes for undiscovered fields (yellow and orange triangles) are plotted outside of the graph. Solid line connects median values. Abbreviations: MMBO, million barrels of oil; BCFG, billion cubic feet of gas.
1
10
100
1 ,000
1895 1905 1915 1925 1935 1945 1955 1965 1975 1985 1995 2005
ACCUM ULATION-DISCOVERY YEAR
GR
OW
N G
AS
-AC
CU
MU
LAT
ION
SIZ
E (
BC
FG
)
N = 11 N = 11 N = 11
3 BCFG cutoff
1st third 2nd third 3rd third
Medians of discovered reservoirs for each third of productionEstimated median forundiscovered reservoirs
Estimated maximumfor undiscovered reservoirs
EXPLANATION
Anahuac O il and Gas AU
0
1
10
100
1 ,000
1895 1905 1915 1925 1935 1945 1955 1965 1975 1985 1995 2005
ACCUM ULATION-DISCOVERY YEAR
GR
OW
N O
IL-A
CC
UM
ULA
TIO
N S
IZE
(M
MB
O)
0.5 MMBO cutoff
1st third 2nd third 3rd third
Anahuac Oil and Gas AU
Oil accumulation sizes
Gas accumulation sizes
A
B
Medians of discovered reservoirs for each third of productionEstimated median forundiscovered reservoirs
Estimated maximumfor undiscovered reservoirs
EXPLANATION
N = 5 N = 6 N = 5

Assessment Results 55
Assessment ResultsTable 2 is a summary of the assessment results for the four AUs in the Frio Formation and the one AU in the Anahuac
Formation by resource type (crude oil, natural gas, natural gas liquids) (Dubiel and others, 2007). The total estimated means for undiscovered conventional oil resources, gas resources, and natural gas liquids are 172 million barrels of oil (MMBO), 9,384 billion cubic feet of gas (BCFG), and 542 million barrels of natural gas liquids (MMBNGL), respectively.
The total estimated mean for undiscovered conventional gas resources in all of the Frio and Anahuac AUs is 9,384 BCFG, ranging from 18,166 BCFG (F5) to 2,609 BCFG (F95), where F5 represents a 1 in 20 chance and F95 represents a 19 in 20 chance of the occurrence of at least the amount specified. This resource includes both nonassociated gas in gas fields and associ-ated gas in oil fields. Only 594 BCFG of the total mean estimated resource value (9,384 BCFG) represents associated gas in oil fields. Of the five units assessed, the Frio Slope and Basin Floor Gas AU shows the greatest potential for undiscovered gas resources, having an estimated mean of 5,589 BCFG, and ranging from 11,153 BCFG (F5) to 1,355 (F95). The Hackberry Oil and Gas AU shows the second highest potential for gas of the five units assessed, having an estimated mean of 1,807 BCFG, and ranging from 3,365 BCFG (F5) to 556 BCFG (F95).
The total estimated means for undiscovered conventional oil resources in all of the Frio and Anahuac AUs is 172 MMBO, ranging from 352 MMBO (F5) to 43 MMBO (F95). The largest undiscovered conventional crude oil resource was estimated for the Frio Slope and Basin Floor Gas AU, having an estimated mean of 110 MMBO, and ranging from 220 MMBO (F5) to 28 (F95).
The total estimated means for undiscovered natural gas liquids is 542 MMBNGL, ranging from 1,124 MMBNGL (F5) to 135 MMBNGL (F95).
Table 2. Summary of the assessment results for the Frio Formation (four assessment units) and the Anahuac Formation (one assessment unit) by resource type (crude oil, natural gas, natural gas liquids) (Dubiel and others, 2007).
Total Petroleum Systems (TPS)
and Assessment Units (AU)
Field Type
Total Undiscovered Resources
Oil (MMBO) Gas (BCFG) NGL (MMBNGL)
F95 F50 F5 Mean F95 F50 F5 Mean F95 F50 F5 Mean
Upper Jurassic-Cretaceous-Tertiary Composite, TPS 504701
Frio Stable Shelf Oil and Gas, AU 50470135
Oil 2 5 11 5 7 22 52 25 0 0 1 0
Gas 88 227 437 241 2 5 11 6
Total 2 5 11 5 95 249 489 266 2 5 12 6Frio Expanded
Fault Zone Oil and Gas, AU 50470136
Oil 4 14 30 16 24 82 186 90 1 2 5 2
Gas 509 1,265 2,292 1,321 13 34 68 36
Total 4 14 30 16 533 1,347 2,478 1,411 14 36 73 38Frio Slope and
Basin Floor Gas, AU 50470137
Oil 28 102 220 110 84 320 756 358 2 9 24 11
Gas 1,271 4,829 10,397 5,231 81 322 757 358
Total 28 102 220 110 1,355 5,149 11,153 5,589 83 331 781 369Anahuac Oil
and Gas, AU 50470138
Oil 3 13 39 16 8 33 103 41 0 1 2 1
Gas 62 240 578 270 2 7 17 8
Total 3 13 39 16 70 273 681 311 2 8 19 9Hackberry Oil
and Gas, AU 50470139
Oil 6 22 52 25 17 69 178 80 0 2 6 2
Gas 539 1,632 3,187 1,727 34 109 233 118Total 6 22 52 25 556 1,701 3,365 1,807 34 111 239 120
Total for all Frio and Anahuac AU’s
Oil 43 156 352 172 140 526 1,275 594 3 14 38 16
Gas 0 0 0 0 2,469 8,193 16,891 8,790 132 477 1,086 526Grand Total 43 156 352 172 2,609 8,719 18,166 9,384 135 491 1,124 542

56 Geologic Assessment of Undiscovered Oil and Gas Resources—Oligocene Frio and Anahuac Formations
Conclusions
1. The USGS Tertiary Assessment Team, using both proprietary and public oil and gas geochemical data, concluded that although the mapped, two-dimensional hydrocarbon systems of Wenger and others (1994) and Hood and others (2002) generally were valid, mixing of oil and gas sourced from different source rock intervals (Smackover, Eagle Ford, Wilcox/Sparta) within each petroleum system area identified on the Wenger-Hood maps could not be ruled out (M.D. Lewan, U.S. Geological Survey, written commun., 2006; Warwick and others, 2007a). A single, Upper Jurassic-Cretaceous-Tertiary Composite Total Petroleum System (TPS) for the Gulf Coast basin therefore was defined by the USGS Tertiary Assessment Team.
2. A geologic model based on recurring structural and depositional features in Paleogene strata was developed by the USGS Tertiary Assessment Team to define assessment units (AUs). In the model, the “Stable Shelf Zone” occurs in the landward (updip) parts of the basin, where growth faulting is absent or minimal. For the Frio Formation, we chose to include most of the Vicksburg fault zone in south Texas in the “Stable Shelf Zone” because sediments in this area of growth faults are not as thickened or vertically displaced as those found downdip in the Frio fault zone and reservoirs are normally pressured. Reservoir intervals in the “Stable Shelf Zone” are thinner than those in the “Expanded Fault Zone.” For the Frio Formation, the average thickness of discovered reservoirs in the “Stable Shelf Zone” is 34 ft, and the average depth of discovered reservoirs is 4,834 ft (based on data from NRG Associates, 2006).
3. The “Expanded Fault Zone” of the geologic model contains growth faults that formed at the dominant shelf edge of the underlying unit. Sediments in the “Expanded Fault Zone” display extreme vertical displacement and thickening, and reservoirs are commonly overpressured. For the Frio, the updip margin of the “Expanded Fault Zone” was defined on basis of the updip boundary of the Frio fault zone in Texas, the occurrence of unstable shelf margins in Louisiana, and the presence of Frio reservoirs in overpressured stratigraphic intervals. The Frio “Expanded Fault Zone” also includes part of the Vicksburg fault zone, in south Texas, that contains overpressured reservoirs. The average thickness of dis-covered reservoirs in the Frio “Expanded Fault Zone” is 56 ft, and the average depth of discovered reservoirs is 9,050 ft (based on data from NRG Associates, 2006).
4. The “Slope and Basin Floor Zone” of the geologic model consists of environments that formed basinward (downdip) of the shelf edge, where growth faulting was minimal and sediments were not displaced to the same degree as those in the “Expanded Fault Zone.” Reservoirs in the “Slope and Basin Floor Zone” are expected to be overpressured, with associ-ated high temperatures. The updip boundary of the “Slope and Basin Floor Zone” for the Frio is the late Oligocene shelf margin; the downdip boundary is composed of the State/Federal water boundaries for Texas and Louisiana. There are no production data for the Frio in the “Slope and Basin Floor Zone” (based on the minimum field size of 0.5 MMBOE in data from NRG Associates, 2006).
5. Five AUs were defined for the Frio Formation; three of the AUs were based on the geologic model, as described above: the Frio Stable Shelf Oil and Gas AU, the Frio Expanded Fault Zone Oil and Gas AU, and the Frio Slope and Basin Floor Gas AU. The fourth AU, the Hackberry Oil and Gas AU, was based on the occurrence of reservoirs in the Hack-berry trend, a slope facies in the middle part of the Frio Formation. The fifth AU, the Frio Basin Margin AU, was not quantitatively assessed because of the lack of data indicating potential for production in updip areas near the outcrop of the Frio, defined as the updip boundary of the Miocene outcrop. A sixth AU, the Anahuac Oil and Gas AU, was based on the occurrence of the Anahuac Formation, which is a transgressive marine shale overlying the Frio that contains deltaic and carbonate sediments.
6. Results of the assessment indicate that the total estimated means for undiscovered conventional oil resources, gas resources, and natural gas liquids, for all five units quantitatively assessed, are 172 MMBO, 9,384 BCFG, and 542 MMBNGL, respectively. Of the five units assessed for the Frio and Anahuac Formations, the Frio Slope and Basin Floor Gas AU shows the greatest potential for undiscovered gas resources, having an estimated mean of 5,589 BCFG and ranging from 11,153 BCFG (F5) to 1,355 BCFG (F95). The Hackberry Oil and Gas AU shows the second highest potential for gas of the five units assessed, having an estimated mean of 1,807 BCFG and ranging from 3,365 BCFG (F5) to 556 BCFG (F95).

References Cited 57
AcknowledgmentsThe authors would like to thank all members of the USGS Tertiary Assessment Team for providing their geologic and tech-
nical expertise throughout the assessment process (L.H. Biewick, R.R. Charpentier, J.L. Coleman, S.M. Condon, R.F. Dubiel, P.C. Hackley, D.O. Hayba, M.A. Keller, T.R. Klett, M.D. Lewan, P.H. Nelson, O. Pearson, J.K. Pitman, R.M. Pollastro, J.L. Ridgley, E.L. Rowan, C.J. Schenk, and P.D. Warwick). The overall guidance and expertise of Peter Warwick, Russell Dubiel, and Jim Coleman were especially appreciated. Ron Charpentier, Tim Klett, Rich Pollastro, and Chris Schenk provided invaluable background related to assessment methodologies. Liz Rowan, Janet Pitman, and Mike Lewan provided information essential for understanding the thermal maturity of source rocks and migration pathways for the Gulf Coast Tertiary petroleum systems. Technical reviews of the paper by Bob Milici, Paul Hackley, and Jim Coleman were greatly appreciated.
References Cited
Ambrose, W.A., Johnson, B., Hammes, U., and Johnstone, D., 2010, Sequence stratigraphic framework and depositional history of Oligocene Frio slope-fan, lowstand prograding wedge, and shallow-marine transgressive-regressive deposits in the Lavaca Bay area, Texas: Gulf Coast Association of Geological Societies Transactions, v. 60, p. 29–38.
Bascle, B.J., Nixon, L.D., and Ross, K.M., 2001, Atlas of Gulf of Mexico gas and oil sands as of January 1, 1999: U.S. Depart-ment of the Interior, Minerals Management Service, Gulf of Mexico OCS Regional Office, Office of Resource Evaluation, OCS Report, MMS 2001–086, 342 p., accessed February 6, 2013, at http://www.boem.gov.
Bayliss, G.S., and Hart, G.F., 1981, Organic geochemistry of the Sweet Lake geopressured test well, in Bebout, D.G., and Bach-man, A.L., eds., Fifth Conference on Geopressured-Geothermal Energy, U.S. Gulf Coast, Proceedings: U.S. Department of Energy, p. 303–310.
Bebout, D.G., Loucks, R.G., and Gregory, A.R., 1978, Frio sandstone reservoirs in the deep subsurface along the Texas Gulf Coast: Texas University Bureau of Economic Geology, Report of Investigations 91, 92 p.
Bebout, D.G., and Gutierrez, D.R., 1982, Regional cross sections, Louisiana Gulf Coast, western part: Louisiana Geological Survey Folio Series, no. 5, p. 1–11.
Bebout, D.G., and Gutierrez, D.R., 1983, Regional cross sections, Louisiana Gulf Coast, eastern part: Louisiana Geological Survey Folio Series, no. 6, p. 1–10.
Benson, P.H., 1971, Geology of Oligocene Hackberry trend, Gillis English Bayou-Manchester area, Calcasieu Parish, Louisiana: Gulf Coast Association of Geological Societies Transactions, v. 21, p. 1–14.
Berg, R.R., and Powers, B.K., 1980, Morphology of turbidite-channel reservoirs, lower Hackberry (Oligocene), southeast Texas: Gulf Coast Association of Geological Societies Transactions, v. 30, p. 41–48.
Bissada, K.K., Katz, B.J., Barnicle, S.C., and Schunk, D.J., 1990, On the origin of hydrocarbons in the Gulf of Mexico basin—A reappraisal, in Schumacher, D., and Perkins, B.F., eds., Gulf Coast oils and gases—Their characteristics, origin, distribution, and exploration and production significance: Society of Economic Paleontologists and Mineralogists Foundation, Gulf Coast Section, 10th Annual Research Conference Proceedings, Austin, Tex., p. 163–171.
Blanc, P., and Connan, J., 1994, Preservation, degradation, and destruction of trapped oil, in Magoon, L.B., and Dow, W.G., eds., 1994, The petroleum system—From source to trap: American Association of Petroleum Geologists Memoir 60, chap. 14, p. 237–247.
Bornhauser, Max, 1960, Depositional and structural history of Northeast Hartburg field, Newton County, Texas: American Asso-ciation of Petroleum Geologists Bulletin, v. 44, no. 4, p. 458–470.
Bread, S.Q., Callendar, A.D., and Nault, M.J., 1999, Foraminiferal biofacies, local zonation and paleobathymetry of the Hack-berry sequence (Middle Oligocene Frio) of southwestern Louisiana: Gulf Coast Association of Geological Societies Transac-tions, v. 49, p. 122–131.
Brown, L.F., Loucks, R.G., Trevino, R.H., and Hammes, U., 2004, Understanding growth-faulted, intraslope subbasins by apply-ing sequence-stratigraphic principles—Examples from the south Texas Oligocene Frio Formation: American Association of Petroleum Geologists Bulletin, v. 88, no. 11, p. 1501–1522.

58 Geologic Assessment of Undiscovered Oil and Gas Resources—Oligocene Frio and Anahuac Formations
Brown, L.F., Loucks, R.G., and Treviño, R.H., 2005, Site-specific sequence-stratigraphic section benchmark charts are key to regional chronostratigraphic systems tract analysis in growth-faulted basins: American Association of Petroleum Geologists Bulletin, v. 89, no. 6, p. 715–724.
Brown, L.F., Loucks, R.G., Treviño, R.H., and Hammes, U., 2006, Understanding growth-faulted, intraslope subbasins by apply-ing sequence-stratigraphic principles—Examples from the south Texas Oligocene Frio Formation; Reply: American Associa-tion of Petroleum Geologists Bulletin, v. 90, no. 5, p. 799–805.
Bruce, C.H., 1973, Pressured shale and sediment deformation—Mechanism for development of regional contemporaneous faults: American Association of Petroleum Geologists Bulletin, v. 57, no. 5, p. 878–886.
Burke, R.A., 1958, Summary of oil occurrence in Anahuac and Frio formations of Texas and Louisiana: American Association of Petroleum Geologists Bulletin, v. 42, no. 12, p. 2935–2950.
Champlin, S.D., 1995, The petroleum geology of Independence Field (Frio), Wilkinson and Amite Counties, southwestern Mis-sissippi: Mississippi Office of Geology, Department of Environmental Quality, Open-File Report 40, 36 p.
Charpentier, R.R., and Klett, T.R., 2004, A Monte Carlo simulation method for the assessment of undiscovered, conventional oil and gas, chap. 21 of USGS Southwestern Wyoming Province Assessment Team, eds., Petroleum systems and geologic assessment of oil and gas in the Southwestern Wyoming Province, Wyoming, Colorado, and Utah: U.S. Geological Survey Digital Data Series DDS–69–D, Version 1.0, 8 p. CD-ROM, accessed February 6, 2013, at http://pubs.usgs.gov/dds/dds-069/dds-069-d/reports.html.
Coker, M.A., Cuevas Leree, J.A., Martinex Sierra, R., Hernandez Mendoza, J.J., and Goodoff, L.R., 2003, Burgos Basin play analysis reveals Frio-Vicksburg exploration focus areas, in Rosen, N.C., ed., Structure and stratigraphy of south Texas and northeast Mexico, applications to exploration: South Texas Geological Society Seminar proceedings volume, p. 222–250.
Coleman, J., and Galloway, W.E., 1990, Petroleum geology of the Vicksburg Formation, Texas: Gulf Coast Association of Geo-logical Societies Transactions, v. 40, p. 119–130.
Combes, J.M., 1993, The Vicksburg Formation of Texas—Depositional systems distribution, sequence stratigraphy, and petro-leum geology: American Association of Petroleum Geologists Bulletin, v. 77, no. 11, p. 1942–1970.
Cossey, P.J., and Jacobs, R.E., 1992, Oligocene Hackberry Formation of southwest Louisiana—Sequence stratigraphy, sedimen-tology, and hydrocarbon potential: American Association of Petroleum Geologists Bulletin, v. 76, no. 5, p. 589–606.
Curtis, D.M., 1989, Source of oils in Gulf Coast Cenozoic reservoirs [abs]: American Association of Petroleum Geologists Bul-letin, v. 73, issue 9, p. 1181.
Desselle, B.A., 1992, Taxonomy and paleoecology of the Marginulina Zone, Cameron and Calcasieu Parishes: Gulf Coast Asso-ciation of Geological Societies Transactions, v. 42, p. 793–800.
Desselle, B.A., 1997a, OL P.2. Frio-Anahuac progradational distal delta-front sandstone—Mustang Island area, in Seni, S.J., Hentz, T.F., Kaiser, W.R., and Wermund, E.G., Jr., eds., Atlas of Northern Gulf of Mexico gas and oil reservoirs, Volume 1—Miocene and older reservoirs: University of Texas at Austin, Bureau of Economic Geology; Gas Research Insti-tute; U.S. Department of Energy; and U.S. Department of the Interior, p. 15–16.
Desselle, B.A., 1997b, OL P.2. Frio-Anahuac progradational shoreface and shelf sandstone—Mustang Island and Matagorda Island areas, in Seni, S.J., Hentz, T.F., Kaiser, W.R., and Wermund, E.G., Jr., eds., Atlas of Northern Gulf of Mexico gas and oil reservoirs, Volume 1—Miocene and older reservoirs: University of Texas at Austin, Bureau of Economic Geology; Gas Research Institute; U.S. Department of Energy; and U.S. Department of the Interior, p. 17–19.
DiMarco, M.J., and Shipp, R.C., 1991, Stratigraphic characteristics and sandstone distribution of the Hackberry Depositional system (mid Oligocene), S.E. Texas and S.W. Louisiana, a sand-rich slope-fan complex: Gulf Coast Association of Geological Societies Transactions, v. 41, p. 187–190.
Dodge, M.M., and Posey, J.S., 1981, Structural cross sections, Tertiary Formations, Texas Gulf Coast: University of Texas at Austin, Bureau of Economic Geology, 33 maps, 6 p.
Dow, W.G., 1984, Oil source beds and oil prospect definition in the Upper Tertiary of the Gulf Coast: Gulf Coast Association of Geological Societies Transactions, v. 34, p. 329–339.
Dow, W.G., Mukhopadhyay, P.K., and Jackson, T., 1988, Source rock potential and maturation of deep Wilcox from south-central Texas [abs.]: American Association of Petroleum Geologists Bulletin, v. 72, no. 2, p. 179.

References Cited 59
Dubiel, R.F., Pitman, J.K., Pearson, O.N., Warwick, P.D., Karlsen, A.W., Coleman, J.L., Hackley, P.C., Hayba, D.O., Swanson, S.M., Charpentier, R.R., Cook, T.A., Klett, T.R., Pollastro, R.M., and Schenk, C.J., 2007, Assessment of undiscov-ered oil and gas resources in Tertiary strata of the Gulf Coast, 2007: U.S. Geological Survey Fact Sheet 2007–3066, 4 p.
Echols, J.B., Zimmerman, R.K., and Goddard, D.A., 1994, An integrated geochemical and geological approach for determin-ing hydrocarbon generation-migration patterns—Central Gulf Coast Basin: Gulf Coast Association of Geological Societies Transactions, v. 44, p. 193–203.
Edwards, M.B., 2000, Origin and significance of retrograde failed shelf margins—Tertiary Northern Gulf Coast Basin: Gulf Coast Association of Geological Societies Transactions, v. 50, p. 81–93.
Edwards, M.B., 2002, The case for the regressive systems tract with examples from the Tertiary and Pleistocene of the Northern Gulf Coast Basin: Gulf Coast Association of Geological Societies Transactions, v. 52, p. 243–255.
Edwards, M.B., 2006, Understanding growth-faulted, intraslope subbasins by applying sequence-stratigraphic principles—Examples from the south Texas Oligocene Frio Formation; Discussion: American Association of Petroleum Geologists, v. 90, no. 5, p. 787–798.
Eguiluz de Antuñano, S., 2001, Geologic evolution and gas resources of the Sabinas Basin in northeastern Mexico, in Bartolini, C., Buffler, R.T., and Cantú-Chapa, A., eds., The western Gulf of Mexico Basin—Tectonics, sedimentary basins, and petroleum systems: American Association of Petroleum Geologists Memoir 75, p. 241–270.
Eubanks, L.G., 1987, North Sabine Lake Field—Complex deposition and reservoir morphology of lower Hackberry (Oligo-cene), southwest Louisiana: American Association of Petroleum Geologists Bulletin, v. 71, no. 10, p. 1162–1170.
Ewing, T.E., 1986, Structural styles of the Wilcox and Frio growth-fault trends in Texas—Constraints on geopressured reser-voirs: University of Texas at Austin, Bureau of Economic Geology, Report of Investigations 154, p. 1–86.
Ewing, T.E., compiler, and contributions by Budnik, R.T., Ames, J.T., Ridner, D.M., and Dillon, R.L., 1990, Tectonic map of Texas: University of Texas at Austin, Bureau of Economic Geology Publication SM0001, scale 1:750,000, 4 sheets.
Ewing, T.E., 1991a, Structural framework, in Salvador, A., ed., The Geology of North America, The Gulf of Mexico Basin: Geo-logical Society of America, v. J, p. 31–52.
Ewing, T.E., 1991b, The tectonic framework of Texas—Text to accompany “The tectonic map of Texas”: University of Texas at Austin, Bureau of Economic Geology Publication SM0001, 36 p.
Ewing, T.E., and Reed, R.S., 1984, Depositional systems and structural controls of Hackberry sandstone reservoirs in southeast Texas: University of Texas at Austin, Bureau of Economic Geology, Geological Circular 84–7, 44 p.
Ewing, T.E., and Lopez, R.F., 1991, Principal structural features, Gulf of Mexico basin, in Salvador, A., ed., The Gulf of Mexico Basin: Boulder, Colo., Geological Society of America, The Geology of North America, v. J, plate 2, 1 sheet.
Ewing, T.E., and Vincent, F.S., 1997, Foundered shelf edges—Examples from the Yegua and Frio, Texas and Louisiana: Gulf Coast Association of Geological Societies Transactions, v. 47, p. 149–157.
French, C.D., and Schenk, C.J., 2005, Map showing the geology, oil and gas fields, and geologic provinces of the Gulf of Mexico Region: U.S. Geological Survey Open-File Report 97–470–L, 1 sheet, CD-ROM, accessed February 6, 2013, at http://pubs.usgs.gov/of/1997/ofr-97-470/OF97-470L/.
Galloway, W.E., 1977, Catahoula Formation of the Texas coastal plain—Depositional systems, composition, structural devel-opment, ground-water flow history, and uranium distribution: University of Texas at Austin, Bureau of Economic Geology, Report of Investigations 87, 59 p.
Galloway, W.E., 1984, Hydrogeologic regimes of sandstone diagenesis, in Clastic diagenesis, Part 1—Concepts and principles: American Association of Petroleum Geologists Special Volume M 37, p. 3–13.
Galloway, W.E., 1986, Depositional and structural framework of the distal Frio Formation, Texas coastal zone and shelf: Univer-sity of Texas at Austin, Bureau of Economic Geology, Geological Circular 86–8, 16 p.
Galloway, W.E., 2002, Cenozoic deep-water reservoir systems of the Northern Gulf of Mexico Basin: Gulf Coast Association of Geological Societies Transactions, v. 52, p. 301–308.
Galloway, W.E., 2005, Gulf of Mexico basin depositional record of Cenozoic North American drainage basin evolution: Special Publication of the International Association of Sedimentologists, no. 35, p. 409–423.

60 Geologic Assessment of Undiscovered Oil and Gas Resources—Oligocene Frio and Anahuac Formations
Galloway, W.E., Bebout, D.G., Fisher, W.L., Dunlap, J.B., Jr., Cabrera-Castro, R., Lugo-Rivera, J.E., and Scott, T.M., 1991, Cenozoic, in Salvador, A., ed., The Gulf of Mexico Basin: Boulder, Colo., Geological Society of America, The Geology of North America, v. J, p. 245–324.
Galloway, W.E., Ewing, T.E., Garrett, C.M., Tyler, N., and Bebout, D.G., 1983, Atlas of major Texas oil reservoirs: University of Texas at Austin, Bureau of Economic Geology, p. 22–29, 33–35.
Galloway, W.E., Ganey-Curry, P.E., Li, X., and Buffler, R.T., 2000, Cenozoic depositional history of the Gulf of Mexico basin: American Association of Petroleum Geologists Bulletin, v. 84, no. 11, p. 1743–1774.
Galloway, W.E., Hobday, D.K., and Magar, K., 1982, Frio Formation of Texas Gulf Coastal Plain—Depositional systems, structural framework, and hydrocarbon distribution: American Association of Petroleum Geologists Bulletin, v. 66, no. 6, p. 649–688.
Galloway, W.E., Liu, X., Travis-Neuberger, D., and Xue, L., 1994, Reference high-resolution correlation cross sections, Paleo-gene section, Texas Coastal Plain: University of Texas at Austin, Bureau of Economic Geology, 5 pl., 19 p.
Garrett, J.B., 1938, The Hackberry assemblage—An interesting foraminiferal fauna of post-Vicksburg age from deep wells in the Gulf Coast: Journal of Paleontology, v. 12, p. 309–317.
Goddard, D.A., and Zimmerman, R.K., 2003, Shallow Miocene and Oligocene gas potential—Southeastern Louisiana’s Florida Parishes: Gulf Coast Association of Geological Societies Transactions, v. 53, p. 287–301.
Goddard, D.A., Zimmerman, R.K., and Meeks, C.M., 2005, Remaining hydrocarbon potential in Oligocene reservoirs of mature fields, West Baton Rouge Parish, Louisiana: Gulf Coast Association of Geological Societies Transactions, v. 55, p. 251–267.
Halbouty, M.T., and Barber, T.D., 1961, Port Acres and Port Arthur fields, Jefferson County, Texas: Gulf Coast Association of Geological Societies Transactions, v. 11, p. 225–234.
Hammes, U., Loucks, R.G., Brown, L.F., Jr., Treviño, R.H., Montoya, P., and Remington, R.L., 2007, Reservoir geology, struc-tural architecture, and sequence stratigraphy of a growth-faulted subbasin—Oligocene Lower Frio Formation, Red Fish Bay Area, South Texas Gulf Coast: University of Texas at Austin, Bureau of Economic Geology, Report of Investigations 272, 28 p.
Hammes, U., Zeng, H., Loucks, R., and Brown, F., Jr., 2007, All fill, no spill—Slope-fan sand bodies in growth-faulted subba-sins, Oligocene Frio Formation, South Texas Gulf Coast: Gulf Coast Association of Geological Societies Transactions, v. 57, p. 361–371.
Hanor, J.S., and Sassen, R., 1990, Evidence for large-scale vertical and lateral migration of formation waters, dissolved salt, and crude oil in the Louisiana Gulf Coast, in Schumacher, D., and Perkins, B.F., eds. Gulf Coast oils and gases—Their character-istics, origin, distribution, and exploration and production significance: Society of Economic Paleontologists and Mineralo-gists Foundation, Gulf Coast Section, 9th Annual Research Conference, Proceedings, Austin, Tex.: p. 283–296.
Harrison, F.W., and Anderson, R.A., 1966, A sub-regional report of the Camerina zone in southwest Louisiana: Gulf Coast Asso-ciation of Geological Societies Transactions, v.16, p. 7–12.
Hernandez-Mendoza, J.J., Hentz, T.F., DeAngelo, M.V., Wawrzyniec, T.F., Sakurai, S., Talukdar, S.C., and Holtz, M.H., 2008, Miocene chronostratigraphy, paleogeography, and play framework of the Burgos Basin, southern Gulf of Mexico: American Association of Petroleum Geologists Bulletin, v. 92, no. 11, p. 1501–1535.
Hood, K.C., Wenger, L.M., Gross, O.P., and Harrison, S.C., 2002, Hydrocarbon systems analysis of the northern Gulf of Mex-ico—Delineation of hydrocarbon migration pathways using seeps and seismic imaging, in Schumacher, D., and LeSchack, L.A., eds., Surface exploration case histories—Applications of geochemistry, magnetics, and remote sensing: American Asso-ciation of Petroleum Geologists Studies in Geology, no. 48, and Society of Exploration Geophysicists Geophysical References Series, no. 11, p. 25–40.
Hopkins, O.R., 1998, Fifty year old Frio/Vicksburg Cage Ranch Field in Brooks County, Texas is rejuvenated with 3D: Gulf Coast Association of Geological Societies Special Publication, 3-D Seismic Case Histories from the Gulf Coast Basin, p. 37–59.
Humble Geochemical Services, Geochemical and Environmental Research Group, BEICIP, Inc., and Brame Geosciences, 2002, Petroleum systems of the Gulf of Mexico—Prediction of hydrocarbon charge, GOM source rock and oil as asphaltene kinetics in Temispack 2D basin modeling: Proposal 2002, 16 p.
IHS Energy Group, 2005a [includes data current as of December 2005], PI/Dwights Plus US production data: Database available from IHS Energy Group, 15 Inverness Way East, D205, Englewood, CO 80112.
References Cited 61
IHS Energy Group, 2005b [includes data current as of December 2005], PI/Dwights Plus US well data: Database available from IHS Energy Group, 15 Inverness Way East, D205, Englewood, CO 80112.
Jackson, J.A., ed., 1997, Glossary of geology (4th ed.): Alexandria, Va., American Geological Institute, 769 p.
Jirik, L.A., 1990, Reservoir heterogeneity in middle Frio fluvial sandstones—Case studies in Seeligson Field, Jim Wells County, Texas: Gulf Coast Association of Geological Societies Transactions, v. 40, p. 335–351.
John, C.J., Jones, B.L., Pope, D.E., and Silva, M.E., 1992a, AN-1. Anahuac Sandstone—Louisiana Gulf Coast, in Bebout, D.G., White, W.A., Garrett, C.M., Jr., and Hentz, T.F., eds., Atlas of major central and eastern Gulf Coast gas reservoirs: University of Texas at Austin, Bureau of Economic Geology, p. 25–27.
John, C.J., Jones, B.L., Pope, D.E., and Silva, M.E, 1992b, FR-12. Upper Frio Sandstone—Louisiana Gulf Coast, in Bebout, D.G., White, W.A., Garrett, C.M., Jr., and Hentz, T.F., eds., Atlas of major central and eastern Gulf Coast gas reservoirs: University of Texas at Austin, Bureau of Economic Geology, p.28–30.
John, C.J., Jones, B.L., Pope, D.E., and Silva, M.E, 1992c, FR-10. Middle Frio Sandstone—Louisiana Gulf Coast, in Bebout, D.G., White, W.A., Garrett, C.M., Jr., and Hentz, T.F., eds., Atlas of major central and eastern Gulf Coast gas reservoirs: University of Texas at Austin, Bureau of Economic Geology, p. 31–33.
John, C.J., Jones, B.L., Pope, D.E., and Silva, M.E, 1992d, FR-11. Lower Frio Sandstone—Louisiana Gulf Coast, in Bebout, D.G., White, W.A., Garrett, C.M., Jr., and Hentz, T.F., eds., Atlas of major central and eastern Gulf Coast gas reservoirs: University of Texas at Austin, Bureau of Economic Geology, p. 34–35.
Johnson, W.H., 1982, The Waynesboro sand: Mississippi Geology, v. 2, no. 4, p. 1–8.
King, P.B., and Beikman, H.M., 1974, Geologic map of the United States (exclusive of Alaska and Hawaii): U.S. Geological Survey, 1 map on 2 sheets, Scale 1:2,500,000.
Klett, T.R., Schmoker, J.W., and Charpentier, R.R., 2003, U.S. Geological Survey input-data form and operational procedure for the assessment of conventional petroleum accumulations: U.S. Geological Survey Digital Data Series DDS–69–B, version 1.0, 10 p., accessed February 6, 2013, at http://pubs.usgs.gov/dds/dds-069/dds-069-b/OPEN_FIRST/CHAPTERS_PAGE.pdf.
Klett, T.R., Schmoker, J.W., Charpentier, R.R., Ahlbrandt, T.S., and Ulmishek, G.F., 2004, Glossary— Total Petroleum Sys-tem and assessment of coalbed gas in the Powder River Basin Province, Wyoming and Montana: U.S. Geological Survey Digital Data Series DDS–69–C, chap. 9, p. 1–2, accessed February 6, 2013, at http://pubs.usgs.gov/dds/dds-069/dds-069-c/chapters.html.
Klett, T. R., Schmoker, J.W., and Charpentier, R.R., 2005, U.S. Geological Survey input-data form and operational procedure for the assessment of conventional petroleum accumulations, in USGS Southwestern Wyoming Province Assessment Team, compilers, Petroleum systems and geologic assessment of oil and gas in the Southwestern Wyoming Province, Wyoming, Colorado and Utah: U.S. Geological Survey Digital Data Series DDS–69–D, chap. 20, 7 p., accessed February 6, 2013, at http://pubs.usgs.gov/dds/dds-069/dds-069-d/reports.html.
Knox, P.R., 1994, Architecture, internal heterogeneity, and resulting drainage efficiency of Upper Oligocene Frio Formation inner-shelf sandstone reservoirs in West Fulton Beach Field, Aransas County, Texas: Gulf Coast Association of Geological Societies Transactions, v. 44, p. 337–345.
Knox, P.R., and McRae, L.E., 1995, Application of sequence stratigraphy to the prioritization of incremental growth opportuni-ties in mature reservoirs—An example from Frio fluvial-deltaic sandstones, T-C-B field, south Texas: Gulf Coast Association of Geological Societies Transactions, v. 45, p. 341–350.
Kosters, E.C., Bebout, D.G., Seni, S.J., Garrett, C.M., Jr., Brown, L.F., Jr., Hamlin, H.S., Dutton, S.P., Ruppel, S.C., Finley, R.J. (project director), and Tyler, N., 1989, Atlas of major Texas gas reservoirs: University of Texas at Austin, Bureau of Economic Geology; and Gas Research Institute, 161 p.
Krooss, B.M., Brothers, L., and Engel, M.H., 1991, Geochromatography in petroleum migration—A review: Geological Society of London, Special Publications 1991, v. 59, p. 149–163.
Krutak, P.R. and Beron, P., Jr., 1990, Heterostegina Zone—A shallow Anahuac (late Oligocene–early Miocene) oil frontier in southern Louisiana and Mississippi: Gulf Coast Association of Geological Societies Transactions, v. 40, p. 397–409.
Krutak, P.R., and Beron, P., Jr., 1993, Heterostegina zone carbonates, southeastern Louisiana-offshore Mississippi— Petrography, seismic stratigraphy, hydrocarbon potential: Gulf Coast Association of Geological Societies Transactions, v. 43, p. 183–194.

62 Geologic Assessment of Undiscovered Oil and Gas Resources—Oligocene Frio and Anahuac Formations
Lafayette Geological Society Study Group, 1962, The Camerina and Cibicides hazzardi stratigraphic intervals of southwest Louisiana: Gulf Coast Association of Geological Societies Transactions, v.12, p. 47–61.
LaPlante, R.E., 1974, Hydrocarbon generation in Gulf Coast Tertiary sediments: American Association of Petroleum Geologists Bulletin, v. 58, no.7, p. 1281–1289.
Liu, Q., Buffler, R.T., and Galloway, W.E., 1997, Seismic expression and depositional environments of a Late Oligocene/Earliest Miocene carbonate unit, offshore Mississippi and Alabama: Gulf Coast Association of Geological Societies Transactions, v. 47, p. 291–297.
Lopez, J.A., 1995, Salt tectonism of the United States Gulf Coast Basin: New Orleans Geological Society, map (2d ed.), produced by AMOCO Production Company.
Loucks, R.G., 1978, Sandstone distribution and potential for geopressured geothermal energy production in the Vicksburg For-mation along the Texas Gulf Coast: Gulf Coast Association of Geological Societies Transactions, v. 28, p. 239–271.
Loucks, R.G., 2005, Revisiting the importance of secondary dissolution pores in Tertiary sandstones along the Texas Gulf Coast: Gulf Coast Association of Geological Societies Transactions, v. 55, p. 447–455.
Loucks, R.G., Dodge, M.M., and Galloway, W.E., 1984, Regional controls on diagenesis and reservoir quality in Lower Tertiary sandstones along the Texas Gulf Coast, in Clastic diagenesis, Part 1—Concepts and principles: American Association of Petroleum Geologists Special Volume M 37, v. A059, p. 15–45.
Magoon, L.B., and Dow, W.G., The petroleum system, in Magoon, L.B., and Dow, W.G., eds., 1994, The petroleum system—From source to trap: American Association of Petroleum Geologists Memoir 60, p. 3–24.
Makowitz, A., Lander, R.H., and Milliken, K.L., 2006, Diagenetic modeling to assess the relative timing of quartz cementation and brittle grain processes during compaction: American Association of Petroleum Geologists Bulletin, v. 90, no. 6, p. 873–885.
Martin, R.G., 1980, Distribution of salt structures, Gulf of Mexico: U.S. Geological Survey Miscellaneous Field Studies Map MF–1213, 2 sheets.
May, J.H., ed., 1974, Wayne County geology and mineral resources: Mississippi Geological, Economic, and Topographic Survey Bulletin 117, 293 p.
McDade, E.C., Sassen, R., Wenger, L., and Cole, G.A., 1993, Identification of organic-rich lower Tertiary shales as petroleum source rocks, south Louisiana: Gulf Coast Association of Geological Societies Transactions, v. 43, p. 257–267.
McRae, L.E., and Holtz, M.H., 1994, Integrated reservoir characterization of mature oil reservoirs—An example from Oligo-cene Frio fluvial-deltaic sandstones, Rincon Field, South Texas: Gulf Coast Association of Geological Societies Transactions, v. 44, p. 487–498.
McRae, L.E., and Holtz, M.H., 1995, Strategies for optimizing incremental recovery from mature reservoirs in Oligocene Frio fluvial-deltaic sandstones, Rincon Field, South Texas: Gulf Coast Association of Geological Societies Transactions, v. 45, p. 423–433.
Meckel, L.D., 2003, Shelf margin deltas—The key to BIG reserves, in Shelf Margin Deltas and Linked Down Slope Petroleum Systems—Global Significance and Future Exploration Potential, 23d Annual Gulf Coast Section of the Society of Economic Paleontologists and Mineralogists Foundation Bob F. Perkins Research Conference, December 7–10, 2003: p. 167–204.
Nehring, R., 1991, Oil and gas resources, in Salvador, A., ed., The Gulf of Mexico Basin: Boulder, Colo., Geological Society of America, The Geology of North America, v. J, p. 445–494.
New Orleans Geological Society, 1995, Case histories in south Louisiana salt dome geology, chap. 6 of Exploration and exploi-tation of coastal salt basin diapiric structures in Lower Pliocene through Eocene trends—Geology and techniques: p. 163–173.
NRG Associates, Inc., 2006 [includes data current as of December 31, 2004], The significant oil and gas fields of the United States: Database available from NRG Associates, Inc., P.O. Box 1655, Colorado Springs, CO 80901.
Ogiesoba, O., and Hammes, U., 2012, Seismic interpretation of mass-transport deposits within the upper Oligocene Frio Forma-tion, south Texas Gulf Coast: American Association of Petroleum Geologists Bulletin, v. 96, no. 5, p. 845–868.
Paine, W.R., 1956, The Nonion struma “Lower Frio” wedges of Acadia Parish: Gulf Coast Association of Geological Societies Transactions, v. 6, p. 153–160.

References Cited 63
Paine, W.R., 1968, Stratigraphy and sedimentation of subsurface Hackberry wedge and associated beds of southwestern Louisi-ana: American Association of Petroleum Geologists Bulletin, v. 52, no. 2, p. 322–342.
Paine, W.R., 1971, Petrology and sedimentation of the Hackberry sequence of southwest Louisiana: Gulf Coast Association of Geological Societies Transactions, v. 21, p. 37–55.
Paine, W.R., Spillers, J.P., Waters, K.M., Andrews, D.I., Baysinger, E.M., Borland, A.M., Cotton, J., Cristina, S.T., Jr., Hall, J.P., Jr., Kimmey, B.W., McDougall, J.E., Meyerhoff, A.A., Munchrath, M.A., Paffett, D.L., Raspberry, F.L., Rockwood, D.N., Roederer, E.P., Jr., Stipe, J.C., and Woodbury, H.O., (Lafayette and New Orleans Geological Societies), 1968, Geology of natural gas in south Louisiana, in Meyerhoff, A.A., ed., Natural gases of North America—Pt. 1, Natural gases in rocks of Cenozoic age: American Association of Petroleum Geologists Memoir 9, v. 1, p. 376–434.
Palmer, A.R., and Geissman, J., compilers, 1999, 1999 geologic time scale: Geological Society of America, product code CTS004, 1 p., accessed February 6, 2013, at http://www.geosociety.org/science/timescale/timescl.pdf.
Pendleton, V.M., and Hardage, B.A., 1998, 3-D seismic imaging of a thin, vertically isolated fluvial depositional system reser-voir in Seeligson Field, South Texas: Gulf Coast Association of Geological Societies Special Publication, 3-D Seismic Case Histories from the Gulf Coast Basin, p. 269–281.
Pettijohn, R.A., 1996, Geochemistry of ground water in the Gulf Coast aquifer systems, south-central United States: U.S. Geo-logical Survey Water-Resources Investigations Report 96–4107, 158 p.
Price, L.C., 1991, On the origin of the Gulf Coast Neogene oils: Gulf Coast Association of Geological Societies Transactions, v. 41, p. 524–541.
Radovich, B.J., and Moon, J., 2007, Deep imaging of the Paleogene, Miocene structure and stratigraphy of the western Gulf of Mexico using 2D pre-stack depth migration of mega-regional onshore to deep water, long-offset seismic data, in Kennan, L., Pindell, J., and Rosen, N.C., eds., 27th Annual Gulf Coast Section of the Society of Economic Paleontologists and Mineralo-gists Foundation Bob F. Perkins Research Conference, December 2–5, Houston, Tex.: CD-ROM, p. 307–322.
Rainwater, E.H., 1964, Transgressions and regressions in the Gulf Coast Tertiary: Gulf Coast Association of Geological Societ-ies Transactions, v. 14, p. 217–230.
Ricoy, J.U., Yeh, J.S., and Jajor, R.P., 1992, Evaluation of reserve-growth potential in barrier/strandplain compartmentalized res-ervoirs of the Frio Formation, Lavaca Bay Field, South Texas: Gulf Coast Association of Geological Societies Transactions, v. 42, p. 343–348.
Roberts, L.N.R., Lewan, M.D., and Finn, T.M., 2004, Timing of oil and gas generation of petroleum systems in the Southwestern Wyoming Province: The Mountain Geologist, v. 41, p. 87–118.
Rowan, E.L., Pitman, J.K., and Warwick, P.D., 2007, Thermal maturation history of the Wilcox Group (Paleocene–Eocene), Texas: Results of regional-scale multi-1D modeling, in Kennan, L., Pindell, J., and Rosen, N.C., eds., 27th Annual Gulf Coast Section of the Society of Economic Paleontologists and Mineralogists Foundation Bob F. Perkins Research Conference, December 2–5, Houston, Tex.: CD-ROM, p. 714–743.
Salvador, A., and Quezada Muñeton, J.M., 1991, Stratigraphic correlation chart; Gulf of Mexico Basin, in Salvador, A., ed., The Gulf of Mexico Basin: Boulder, Colo., Geological Society of America, The Geology of North America, v. J, plate 5, 1 sheet.
Sassen, R., 1990, Lower Tertiary and Upper Cretaceous source rocks in Louisiana and Mississippi—Implications to Gulf of Mexico crude oil: American Association of Petroleum Geologists Bulletin, v. 74, no. 6, p. 857–878.
Sassen, R., and Moore, C.H., 1988, Framework of hydrocarbon generation and destruction in eastern Smackover trend: Ameri-can Association of Petroleum Geologists Bulletin, v. 72, no. 6, p. 649–663.
Sassen, R., Tye, R.S., Chinn, E.W., and Lemoine, R.C., 1988, Origin of crude oil in the Wilcox trend of Louisiana and Missis-sippi—Evidence of long-range migration: Gulf Coast Association of Geological Societies Transactions, v. 38, p. 27–34.
Schenk, C.J., and Viger, R.J., 1996, Western Gulf Province (047), in Gautier, D.L., Dolton, G.L., Takahashi, K.I., and Varnes, K.L., eds., 1995 National assessment of United States oil and gas resources—Results, methodology, and supporting data: U.S. Geological Survey Digital Data Series DDS–30, version 2, 44 p., accessed February 6, 2013, at http://energy.cr.usgs.gov/regional_studies/gulf_coast/gc-pubs_data.html.

64 Geologic Assessment of Undiscovered Oil and Gas Resources—Oligocene Frio and Anahuac Formations
Schmoker, J.W., and Klett, T.R., 2004, U.S. Geological Survey assessment concepts for conventional petroleum accumulations, chap. 19 of USGS Southwestern Wyoming Province Assessment Team, eds., Petroleum systems and geologic assessment of oil and gas in the Southwestern Wyoming Province, Wyoming, Colorado, and Utah: U.S. Geological Survey Digital Data Series DDS–69–D, version 1.0, 9 p., CD-ROM, accessed February 6, 2013, at http://pubs.usgs.gov/dds/dds-069/dds-069-d/reports.html.
Schmoker, J.W., 2005, U.S. Geological Survey assessment concepts for continuous petroleum accumulations, chap. 13 of USGS Southwestern Wyoming Province Assessment Team, eds., Petroleum systems and geologic assessment of oil and gas in the Southwestern Wyoming Province, Wyoming, Colorado, and Utah: U.S. Geological Survey Digital Data Series DDS–69–D, version 1.0., 10 p., CD-ROM, accessed August 13, 2009, at http://pubs.usgs.gov/dds/dds-069/dds-069-d/reports.html.
Schruben, P.G., Arndt, R.E., and Bawiek, W.J., compilers, with display software by Russell A. Ambroziak, 1998, Geology of the conterminous United States at 1:2,500,000 scale—A digital representation of the 1974 P.B. King and H.M. Beikman map: U.S. Geological Survey Digital Data Series DDS–11, release 2, CD-ROM, accessed August 13, 2009, at http://pubs.usgs.gov/dds/dds11/.
Scott, R.J., 2003, The Maverick Basin—New technology, new success, in Rosen, N.C., ed., Structure and stratigraphy of south Texas and northeast Mexico, applications to exploration: Society of Economic Paleontologists and Mineralogists, Gulf Coast Section Foundation, and South Texas Geological Society, Houston, Tex., April 11, 2003: CD-ROM, p. 84–121.
Smith, N.E., 1990, The Camerina “A”–Miogypsinoides “A” depositional patterns for southwest Louisiana: Gulf Coast Associa-tion of Geological Societies Transactions, v. 40, p. 797–805.
Stanley, T.B., Jr., 1970, Vicksburg fault zone, Texas—Geology of giant petroleum fields: American Association of Petroleum Geologists Memoir 14, p. 301–308.
Swanson, S.S., Karlsen, A.W., and Warwick, P.D., 2007, USGS assessment of undiscovered oil and gas resources for the Oli-gocene Frio and Anahuac Formations, U.S. Gulf of Mexico Coastal Plain and State waters—Review of Assessment Units, in Kennan, L., Pindell, J., and Rosen, N.C., eds., 27th Annual Gulf Coast Section of the Society of Economic Paleontologists and Mineralogists Foundation Bob F. Perkins Research Conference, December 2–5, Houston, Tex.: CD-ROM, p. 341–375.
Swanson, S.M., and Karlsen, A.W., 2008, Assessment of undiscovered oil and gas resources in the Oligocene Frio and Anahuac Formations, onshore Gulf of Mexico Basin, U.S.A. [abs.]: Houston Geological Society, Assessment of Undiscovered Oil & Gas Resources of the Gulf Coast Region, Petroleum Systems of Undiscovered Oil and Gas Resources in Tertiary and Creta-ceous–Tertiary of the Gulf Coast Region, U.S. Geological Survey Gulf Coast Tertiary Assessment Team, 1 p.
Swanson, S.M., and Karlsen, A.W., 2009, USGS assessment of undiscovered oil and gas resources for the Oligocene Frio and Anahuac Formations, onshore Gulf of Mexico basin, USA [adapted from a poster presented at the American Associa-tion of Petroleum Geologists (AAPG) annual convention and exhibition, San Antonio, Tex., April 22, 2008]: Tulsa, Okla., AAPG Search and Discovery article 10178, 44 p., available only online at http://www.searchanddiscovery.com/ (accessed February 6, 2013).
Tanner, J.A., and Fuex, A.N., 1990, Chemical and isotopic evidence of the origin of hydrocarbons and source potential of rocks from the Vicksburg and Jackson Formations of Slick Ranch area, Starr County, Texas, in Schumacher, D., and Perkins, B.F., eds., Gulf Coast oils and gases—Their characteristics, origin, distribution, and exploration and production significance: Society of Economic Paleontologists and Mineralogists Foundation, Gulf Coast Section, 10th Annual Research Conference Austin, Tex., Proceedings, p. 79–97.
Tipsword, H.L., Setzer, F.M., and Smith, F.L., 1966, Interpretation of depositional environment in Gulf Coast petroleum explora-tion from paleoecology and related stratigraphy: Gulf Coast Association of Geological Societies Transactions, v. 16, p. 119–130.
Tissot, B.P., and Welte, D.H., 1984, Petroleum formation and occurrence (2d ed.): Berlin, Springer-Verlag, 697 p.
Treviño, R.H., Loucks, R.G., Brown, L.F., Remington, R.L., 2003, General geology of the Mid-Tertiary Block 889 field area, offshore Mustang Island, Texas: Gulf Coast Association of Geological Societies Transactions, v. 53, p. 808–819.
Tyler, N., 1987, Reexploration of submarine canyon and fan reservoirs at Port Arthur (Hackberry) field, Jefferson County, Texas, in Tyler, N., Light, M.P.R., and Ambrose, W.A., Coordination of geological and engineering research in support of the Gulf Coast co-production program: University of Texas at Austin, Bureau of Economic Geology, annual report prepared for the Gas Research Institute under contract no. 5084–212–0924, p. 1–30.

References Cited 65
U.S. Environmental Protection Agency, 2002, Evaluation of impacts to underground sources of drinking water by hydraulic fracturing of coalbed methane reservoirs: U.S. Environmental Protection Agency, Ground Water Protection Division, v. 1, p. I11–I74.
U.S. Geological Survey National Oil and Gas Resource Assessment Team, 1995, 1995 National assessment of United States oil and gas resources: U.S. Geological Survey Circular 1118, 20 p., accessed February 6, 2013, at http://pubs.usgs.gov/circ/1995/circ1118/execsum.html.
U.S. Geological Survey, 1996, 1995 National Oil and Gas Assessment province boundaries: Denver, Colo., USGS Central Energy Team, downloadable GIS data, accessed February 6, 2013, at http://energy.cr.usgs.gov/oilgas/noga/data.html.
Wallace, R.H., Jr., Kraemer, T.F., Taylor, R.E., and Wesselman, J.B., 1979, Assessment of geopressured-geothermal resources in the Northern Gulf of Mexico Basin, in Muffler, L.J.P., ed., Assessment of geothermal resources of the United States—1978: U.S. Geological Survey Circular 790, p. 132–155.
Wallace, R.H., Wesselman, R.B., and Kraemer, T.F., 1981, Occurrence of geopressure in the northern Gulf of Mexico Basin: U.S. Geological Survey, Gulf Coast Hydroscience Center, NSTL Station, Mississippi, 1 map sheet.
Warren, A.D., 1957, The Anahuac and Frio sediments in Louisiana: Gulf Coast Association of Geological Societies Transactions, v. 7, p. 221–237.
Warwick, P.D., 2004, Bacterial reduction of CO2—The primary origin of low rank coal gas in the northern Gulf of Mexico coastal plain, USA [abs.]: Society for Organic Petrology, 21st Annual Meeting, September 26–October 1, 2004, Sydney, New South Wales, Australia: Program and Abstracts, v. 21, p. 202–203.
Warwick, P.D., 2006, Thermal maturity of the Wilcox Group (Paleocene–Eocene)—A key to the Cenozoic petroleum systems of the northern Gulf of Mexico basin, USA: Society for Organic Petrology, 23d Annual Meeting, Beijing, China, Program and Abstracts, v. 23, p. 271–272.
Warwick, P.D., Breland, F.C., Jr., and Hackley, P.C., 2008, Biogenic origin of coalbed gas in the northern Gulf of Mexico Coastal Plain, U.S.A.: International Journal of Coal Geology, v. 76, issues 1–2, Microbes, Methanogenesis, and Microbial Gas in Coal, p. 119–137.
Warwick, P.D., Coleman, J.L., Hackley, P.C., Hayba, D.O., Karlsen, A.W., Rowan, E.L., and Swanson, S.M., 2007a, USGS assessment of undiscovered oil and gas resources in Cenozoic strata of the U.S. Gulf of Mexico Coastal Plain and State Waters, in Kennan, L., Pindell, J., and Rosen, N.C., eds., 27th Annual Gulf Coast Section of the Society of Economic Paleon-tologists and Mineralogists Foundation Bob F. Perkins Research Conference, December 2–5, 2007, Houston, Tex.: CD-ROM, p. 2–44.
Warwick, P.D., Charpentier, R.R., Cook, T.A., Klett, T.R., Pollastro, R.M., and Schenk, C.J., 2007b, Assessment of undiscovered oil and gas resources in Cretaceous–Tertiary coal beds of the Gulf Coast Region: U.S. Geological Survey Fact Sheet 2007–3039, 2 p., accessed February 6, 2013, at http://pubs.usgs.gov/fs/2007/3039/.
Wenger, L.M., Sassen, R., and Schumacher, D., 1990, Molecular characteristics of Smackover, Tuscaloosa and Wilcox-reservoired oils in the eastern Gulf Coast, in Schumacher, D., and Perkins, B.F., eds., Gulf Coast oils and gases—Their characteristics, origin, distribution, and exploration and production significance: Society of Economic Paleontologists and Mineralogists Foundation, Gulf Coast Section, 9th Annual Research Conference, Austin, Tex., Proceedings: p. 37–57.
Wenger, L.M., Goodoff, L.R., Gross, O.P., Harrison, S.C., and Hood, K.C., 1994, Northern Gulf of Mexico—An integrated approach to source, maturation, and migration, in Scheidermann, N., Cruz, P., and Sanchez, R., eds., Geologic Aspects of Petroleum Systems—First Joint AAPG-AMGP Hedberg Research Conference: 5 p.
Wescott, W.A., and Hood, W.C., 1994, Hydrocarbon generation and migration routes in the East Texas basin: American Associa-tion of Petroleum Geologists Bulletin, v. 78, no. 2, p. 287–307.
Winker, C.D., 1982, Cenozoic shelf margins, Northwestern Gulf of Mexico: Gulf Coast Association of Geological Societies Transactions, v. 32, p. 427–448.
Zamboras, R.L, 1998, Bobcat Run South Field, Orange County, Texas—Oligocene Frio Formation Hackberry sand discovery utilizing 3-D seismic data: Gulf Coast Association of Geological Societies Special Publication, 3-D Seismic Case Histories from the Gulf Coast Basin, p. 15–26.

66 Geologic Assessment of Undiscovered Oil and Gas Resources—Oligocene Frio and Anahuac Formations
Appendix 1. Input data for the Frio and Anahuac Assessment Units
Downloadable file of data is available online at http://pubs.usgs.gov/of/2013/1257/.

For additional information regarding this publication, contact: DirectorUSGS Eastern Energy Resources Science Center12201 Sunrise Valley DriveNational Center, MS 913Reston, VA 20192Phone: (703) 648-6470email: [email protected]
Or visit the USGS Eastern Energy Resources Science Center Web site at:http://energy.usgs.gov
Prepared by:USGS Science Publishing Network,Raleigh and Columbus Publishing Service Centers

Swanson and others—
Geologic Assessment of Undiscovered Oil and Gas Resources—
Oligocene Frio and Anahuac Formations—
Open-File Report 2013–1257
ISSN 2331-1258 (online)http://dx.doi.org/10.3113/ofr20131257