geological characteristics and problems in and …
TRANSCRIPT

SPECIAL ISSUE OF SOILS AND FOUNDATIONS 15-28, Jan. 1996
Japanese Geotechnical Society
GEOLOGICAL CHARACTERISTICS AND PROBLEMS IN AND AROUND
OSAKA BASIN AS A BASIS FOR ASSESSMENT OF SEISMIC HAZARDS
KOICHI NAKAGAWAD, KIYOJI SHION0ii), NAOTO INOUEiii) and MASATO SANOiv)
ABSTRACT
A number of civil engineering structures in a large area Kobe-Hanshin and Awaji in southwest Kinki, southwest Japan, were seriously damaged by the 1995 Hyogoken-Nambu earthquake. Geological studies were made to reveal both geological and geotechnical characteristics in and around the Osaka sedimentary basin. A geological map of the Osaka Plain and the surrounding area was compiled for the geotechnical engineering use.
A Bouguer gravity anomaly map is presented with additional gravity measurements for an evaluation of the subsurface geologic structure. Data on the depth of the basement rocks was collected from information on deep drilling for the geologic survey or hot springs, reflection seismic exploration and surface geological survey. A configuration map of the basement rock forming the bottom of the Osaka basin was also compiled from the depth data collected and an analysis of the correlation between the depth and the Bouguer anomaly was attempted to outline the relief image.
In order to assess the contribution of underground structure with faults to the distribution of structural damage, the focusing process of seismic wave was examined by using the ray theory applied to model the Uemachi Fault zone, which is located in a dense urban region in the Osaka area. As a result, the efficiency of the focusing based on a common underground structure with fault was substantiated qualitatively.
Key words: basement structure, focusing, geology of Osaka Basin, gravity anomaly, Hyogo-ken Nambu earthquake, underground structure, velocity structure (IGC: D7/E8)
INTRODUCTION
The 1995 Hyogoken-Nambu earthquake with the Japan Meteorological Agency, JMA, magnitude of 7.2 struck the Kobe-Hanshin area and Awaji Island, and seri-ously damaged a great number of civil engineering struc-tures and other facilities. Geological factors, in general, control much structural damage, resulted from subsoil behavior during an earthquake. As a significant feature of the distribution characteristics of the damage, it can be pointed out that the most seriously damaged struc-tures were concentrated in soft ground such as fill areas, especially reclaimed fills and/ or near an active fault zone
(Nakagawa et al. , 1995a). Figure 1 represents the distribu-tion of active faults, seismic intensity of JMA scale seven, locations of soil liquefaction and seriously affect-ed zones in and around the Osaka area.
Highly urban zones in the Kobe and Hanshin areas, for which the subsurface profile is characterized by the
soft ground formed in the younger structural basin commonly seen in most large cities in Japan, were hit di-rectly and destroyed totally by the earthquake. A number of civil engineering structures were especially damaged by soil liquefaction and lateral displacement at the fill
ponds, valleys and river channels as well as in man-made lands along the coastal zone (Mitamura et al., 1995). In addition, severe structural damage due to strong ground motion was observed in the narrow zone along known ac-tive faults such as the Nojima Fault, Yokooyama Fault, Ashiya Fault, Koyo Fault, Arima-Takatsuki Tectonic Line etc. and their extensions or along unknown buried faults (e.g., Seo, 1995; Hirano and Hada, 1995 and so on). There are some geological or geotechnical publica-tions describing those areas which comprise the damaged area (e.g., Kasama and Kishimoto, 1974; Kobe Municipal Office, 1980; Huzita and Kasama, 1983; Nakaseko et al., 1984; Kansai Br. of Japanese Society of Soil Mechanics and Foundation Engineering, JSSMFE
i) Professor, Faculty of Science, Osaka City University, Sugimoto 3-3-138, Sumiyoshi-ku, Osaka 558.
ii) Associate Professor, ditto.
iii) Graduate student, ditto.
iv) Research Engineer, Department of Geology, Osaka Office, Suncoh Consultant Co. Ltd., Nishinakajima 6-6-1, Yodogawa-ku, Osaka 532. Manuscript was received for review on October 17, 1995.Written discussions on this paper should be submitted before August 1, 1996, to the Japanese Geotechnical Society, Sugayama Bldg. 4F, Kanda Awaji-cho 2-23, Chiyoda-ku, Tokyo 101, Japan. Upon request the closing date may be extended one month.
15

16 NAKAGAWA ET AL.
and Kansai Geotechnical Consultants Association, 1987; The Research Group for Active Faults in Japan, 1991; Kansai Br. of JSSMFE et al., 1992; Itihara, 1993; Adachi et al., 1994; etc.). The amount of soil/rock boring data, however, is not adequate to able to define and identifyeach laver in the younger sedimentary cover. Very little in-〓rmation on the deep geological structure is available in
this area as the present fine.In the Kansai Area, the Research Committee on the Ap-
plication and Technology for Under-ground Space which selected Professor Kenzo Toki of Kyoto University as its chairman was established. Many types of geological and
geotechnical information have been collected and a com-prehensive data base of the subsurface geological infor-mation for the Kansai Area has been prepared (Kansai Br. of JSSMFE et al., 1992, Kansai Br. of Japanese Soci-ety of Soil Givil Engineerings JSCE, 1993). The commit-tee completed its original purpose in 1993. The adminis-tration of the data base has been taken over by a new committee, Geo-Database Information Committee in Kansai (GeoDICK) which selected Mr. Tomomitu Fujii of Kinki regional construction Bureau, Japanese Minis-try of Construction as the chairman and Professor Toshi-hisa Adachi of Kyoto University as the head of the ge-otechnical research section which has been investigating some geological/ geotechnical characteristics of the Kan-sai subsurface profile related to the disasters. Such sub-
surface information is a basic input required for careful land-use planning of an urban area.
In addition, the Committee on Earthquake Observa-tion and Research in the Kansai Area (CEORKA) which selected Prof. K. Toki as its chairman has also been or-
ganized by many members of public corporations, local government bodies, universities and so on. Many valua-ble data for the present earthquake were obtained by means of the wide network measuring system established with the aim of studying the so-called real time seismolo-
gy (Toki et al., 1995; Irikura et al., 1995; etc.). Many in-formation facts mentioned above can be utilized to evalu-ate important factors that influence earthquake hazard in highly urban areas in Japan. In the present study, the geo-logic structure of the Osaka sedimentary basin was inves-tigated based or geotechnical considerations.
GEOLOGICAL SETTING
General Geology Under the Large Cities in JapanMost of the cities in Japan have suffered from large
earthquakes along the inland active faults or the tectonic
plate boundary. Even when the magnitude is not so great, an earthquake occurring immediately under a city may result in very serious damage. Many geological sur-veys and geophysical explorations are required to reveal the geology, distribution of buried active faults and dy-
Fig. 1. Distribution map of active fault, seismic intensity of JMA scale 7, liquefaction and so on. Legend; A: zone of intensity VII in JMA scale, B: liquefied lateral displacement locations, C: zone of seriously damaged structures compared with surrounding area, D: active fault, E:
epicenter of the 1995 Hyogoken-Nambu earthquake. 1: Baba Fault, 2: Minoo Fault, 3: Satsukiyama Fault, 4: Jyumantsuji Fault, 5: Nakayama Fault, 6: Najio Fault, 7: Rokko Fault, 8: Arino-Ougo Fault, 9: Yamada Fault, 10: Yubunedani Fault, 11: Ibayama Fault, 12: Kogoyama Fault, 13: Kashiodani Fault, 14: Egeyama Fault, 15: Sakamoto Fault, 16: Konoyama Fault, 17: Uchihata Fault, 18: Wakagashi Fault, 19: Kusumoto Fault, 20: Higashiura Fault, 21: Asano Fault, 22: Ikunami Fault, 23: Shizuki Fault

GEOLOGICAL CHARACTERISTICS ON SEISMIC HAZARDS 17
namic material properties of subsurface materials under several main cities in Japan. Since many big cities in Japan have been developed on lowland which is under-lain by thick alluvial deposits, geotechnical properties of the subsoils are essentially similar. In or around each of these alluvial plains many active faults exist and often large earthquake occur along them such as last January in Kobe.
Not only some cities of Japan but also those of the other countries on the island arc or on the lowland set up at orogenic belt which can be represented by the Circum Pacific Rim are situated on such subsoils which have very similar geological setting. These areas have experienced large earthquakes associated with thrusting, strike-slip or normal faulting on the tectonic plate boundary, and large earthquakes along the active faults in the inland region as illustrated in Fig. 2.
Widespread distribution of alluvial deposits in inland areas is thought to result from Quaternary crustal move-ment as well as the recent worldwide sea level change. The tectonic movements have resulted in the formation of sedimentary basins at many locations on the Japanese island arc since the Neogene period. Accordingly, the sedimentary cover including alluvial beds has been sub-
jected to deformation by basement movements. In other words, the Pleistocene overlain by thick Holocene deposits has accumulated in the sedimentary basin which has been formed as a result of neo-tectonic movement and has been divided into smaller blocks by active faults. The Holocene deposits consist mainly of the sediments deposited during sea level rise, which corresponds to the event called the Frandrian transgression, 7000 to 4000 years ago.
The large alluvial plains associated with the thick alluvi-um have generally been formed in the tectonic sedimenta-ry basin which has existed in a regional neo-tectonic belt since Pliocene or Pleistocene time. Accordingly, the sub-surface materials in many of the Japanese big cities have the same or similar geological and geotechnical character-istics. The Holocene alluvial deposits are partially com-posed of very soft material with a high water content, which are susceptible to a large decrease in bulk volume and also easily subjected to heavy damage from an earth-quake. Serious seismic damage problems may be associ-
ated with these deposits because of their low shear strength and high compressibility. From the view point of earthquake engineering, geo-technically important fac-tors include geomorphological features, subsurface geo-logical structure, configuration of basement rock existing at depth, distribution of active faults, sensitive soil, loose sand, fill, surface groundwater and so on.
As a loose saturated sandy layer existing near the
ground surface is susceptible to liquefaction and a com-pressive clayey layer is susceptible to land subsidence by overburden pressure, appropriate measurements of
ground water level play a very important role in evaluat-ing the seismic stability of the subsoil profile. Eventually,
the Holocene alluvial plains underlying the major Japanese cities have involved both seismically more ac-tive fields and seismically weaker passive fields as shown in Fig. 3.
Fig. 2. Schematic diagram showing a typical ground section for cities in the alluvial plain in Japan considering earthquake hazard
Fig. 3. Plate boundaries around the Japanese archipelago. Contour line indicate the depth (km) of the Wadati-Benioff zone (seismic
plane): ST: Sagami Trough, T: Tsuruga Bay, I: Ise Bay, ★:
Epicenter of the 1995 Hyogoken-Nambu earthquake

18 NAKAGAWA ET AL.
Geology of Osaka Plain and Surrounding AreaAwaji and Kobe-Hanshin provinces are located nearby
the west vertex of the so-called "Kinki Triangle", de-fined by Huzita (1962) to be a triangle composed of three vertices, the northern one corresponding to Tsuruga Bay, facing the Sea of Japan, the southwestern one to Awaji Is-land and the southeastern one to Ise Bay, facing the Pacific Ocean. The Kinki Triangle block is tectonically lo-cated between the Southwest Japan block, affected by the subducting slab of the Philippine Sea Plate and the Cen-tral-Northeast Japan block affected by the subducting slab of the Pacific Plate. Accordingly, this triangular region is forced to deform in a very complex manner as is shown in Fig. 4. The Kinki Triangle is also characterized as one of the most highly dense zones of active faults with-in the Japanese Islands and consists of some subsiding, uplifting or tilting blocks bounded by numerous active faults, which run mainly in the NE-SW, N-S, and ENE-WSW directions (Huzita et al., 1973).
The present crustal stress conditions in this region are of the uniform stress field with E-W trending compres-sion stress axis, which has been determined from the fo-cal solution of many micro-earthquakes or the technique of stress release by means of over-coring of the basement rocks. The tectonic stress in the field like this region may therefore produce the strike-slip faults in the NE-SW direction, reverse faults or thrust in the N-S direction and normal faults in the E-W and so on.
The Osaka Basin topographically is a typical sedimen-tary basin, in which an alluvial plain facing Osaka Bay on the west is widely developed, and the edge is bounded by uplifting mountain ranges, which are Mts. Rokko, Hokusetsu, Ikoma, Kongo, Izumi-Katsuragi and Awaji Island. Their boundaries correspond to one of the three fault types mentioned above. In the lowland area a thick soil deposit has been accumulated since late Tertiary time covers the basement rocks which are composed of some
granitic rocks or pre-Tertiary formations. These base-ment rocks are widely exposed in the surrounding moun-
tainous regions. The geological map of this area is shown in Fig. 5. The map was drawn by compiling many investi-
gations such as Geographical Survey Institute (1966), Huzita (1966), Sano (1980), Huzita and Kasama (1982), Geographical Survey Institute (1983), Huzita and Kasa-
ma (1983), Calamity Science Institute (1984), Huzita and Maeda (1984), Huzita and Maeda (1985), Itihara et al.,
(1986), Kansai Br. of JSSMFE and Kansai geotechnical Consultants (1987), Mizuno et al., (1990), Itihara (1993), The Research Group for Active Faults of Japan (1991), Takahashi et al., (1992), Iwasaki et al., (1992), Itihara
(1993), Iwabuchi (1995), Kansai Br. of JSSMFE (1995).The Osaka Group and the upper Pleistocene lie below
the lowland area. Distinctive landform features of ter-races and hills, where the Osaka Group and the upper Pleistocene are exposed sporadically, have been devel-oped between the lowland and the mountainous region.
These geological structures and morphological fea-tures have resulted mainly from the latest Cenozoic crustal movements, which have a strong relationship to the process of the present Hanshin Awaji Great earth-quake disaster. The basement rocks consist of mainly the Ryoke granitic rocks and partially of Paleozoic, Mesozoic and Miocene sedimentary rocks and some vol-canic rocks. The sedimentary cover overlying the base-ment rock consist of the Osaka Group, the upper Pleisto-cene and Holocene alluvial deposits. The Osaka Group is divided into three sub-groups, which are the lower, mid-dle and upper sub-groups. The stratigraphic features and Ethology are shown in Table 1. The geologic column
(OD-1) at the type locality of Osaka Group is shown in Fig. 6. The borehole location is south of the Yodo River and near the coast of Osaka Bay in Osaka City (Fig. 6). The bottom of the borehole with 900 m in depth did not reach the basement rock. The OD-2 drill hole 650 m deep at the Uemachi uplift, which is thought to have been lift-ing up since middle Pleistocene, did reach the basement.
Data on the depth to the buried basement rocks have been revealed by means of geophysical exploration and drilling of a hot spring (Nakagawa, 1990; Itihara, 1991).
Some buried active faults under the alluvial plain have been identified by seismic reflection technique in Osaka Bay (Iwasaki et al. 1994) and the inland area (Yoshikawa et al., 1987 a; Yoshikawa et al., 1987 b; Nakagawa et al., 1994; Kawasaki et al., 1994).
Seismic Wave Velocities in the Osaka Sedimentary BasinRecently several types of geophysical exploration have
been performed in the Osaka Plain by measuring gravity, reflected or refracted seismic wave, ground micro-tremor, magneto-telluric surreys, etc. The Bouguer gravi-ty anomaly in the Osaka Plain will be described in the next section.
Some seismic reflection explorations were performed in the northern part across the Uemachi Fault, which runs under the center of Osaka City with approximate strike of N-S direction (Yamamoto et al. , 1992; Nakaga-wa et al., 1993). A mass dropping method was applied to
generate the P-wave, and a large power S-vibrator was also used to generate the S-wave. The following results were obtained. The throw of the fault is about 700 meters. The depth of the basement on the west side of the fault is about 1500 meters, which coincides with the result of drilling for a hot spring. The velocity of P-wave
Fig. 4. Cross-section of the underground structure across the Kinki
Area, Southwest Japan

GEOLOGICAL CHARACTERISTICS ON SEISMIC HAZARDS 19
changes from 1500 m/ sec near the ground surface to 2400 m/ sec near the bottom of the sedimentary cover. The velocity of S-wave changes from 300 to 1000 m/ sec with depth. Figure 7 shows the depth profile of the S-wave reflection. The P-wave profile was interpreted as shown in Fig. 8. Letters A, B and C in the figure cor-
respond of the upper Pleistocene, the upper and middle
sub-groups, and the lower sub-group of the Osaka group
respectively. Figure 9 shows the relationship between
wave velocity and the depth.As compressional wave transmitted in saturated sub-
surface layer has a rather low damping characteristic, the
A
B
Fig. 5. Geological Map of the Osaka Plain and geological profile across Osaka Bay. The lithology and stratigraphy are described in Table 1. The
name of the Fault is shown in Fig. 1. The location of the profile is shown on the geological map. The intersection of two lines showing profile
location corresponds to the epicenter of the 1995 Hyogoken-Nambu earthquake. Note that the vertical scale is expanded to three times the
horizontal scale

20 NAKAGAWA ET AL.
Table 1. Stratigraphy in and around Osaka area
Fig. 6. Schematic geological column diagram for the Osaka group
based on actual drilling location, OD-1. The location is indicated
in Fig. 16. No attached to letter Ma is the name of marine clay
layer in ascending order
Fig. 7. S-wave reflection profile across the Uemachi Fault along the
Yodo River (Nakagawa et al. 1993)
Fig. 8. P-wave reflection profile and interpretation crossing the Uemachi Fault along the Yodo River (Yamamoto et al., 1992), V, and Vs represent compressional and shear velocities in km/sec, re-spectively
Fig. 9. Relationship between seismic wave velocities and the depth
from the reflection survey at the Yodo River

GEOLOGICAL CHARACTERISTICS ON SEISMIC HAZARDS 21
attenuation of amplitude along the path length is smaller, which results in the acquisition of a high resolu-tion image for the profile. Shear wave velocity structure below the ground surface is very important to analyze the dynamic response during an earthquake. Unfortunately, it is very difficult to perform the S-wave exploration to a large depth because a high powered S-wave generator is very expensive at the present time. Accordingly, some es-timate regarding the distribution of S-wave velocity in-situ is required. To that end, we can utilize the P-wave velocities obtained from the velocity analysis of P-wave reflective exploration, which can be performed relatively easily. Figure 10 represents the relationship between the P-wave velocity and S-wave velocity which were collected from the results of different measurements such as the seismic reflection methods mentioned above, inversion methods from dispersion of Rayleigh wave induced by microtremor(Horike, 1985; Aoki et al., 1990) and P-S logging (Iwasaki, 1988) using the suspension technique
(Kitsunezaki, 1980). The solid straight line and broken curved line in Fig. 10 are regression lines calculated from the plot by means of least square method as follows;
(a)
(b)
where 17, and V, are shear wave velocity and compres-sional wave velocity represented in km/ sec, respectively.
BASEMENT STRUCTURE OF THE OSAKASEDIMENTARY BASIN
One significant feature of the Hanshin-Awaji great earthquake disaster as mentioned above is that most of the damage to structures was concentrated in soft subsoil such as fill deposits, especially reclaimed fills and/ or near
an active fault zone. Considering the zonal distribution characteristics of structural damage and ground failure due to this earthquake, the extensive collection of addi-tional information about the underground structure is necessary to alleviate the problem.
The Bouguer anomaly in and around the Osaka area has been compiled by Nakagawa et al. (1991). In addi-tion, gravity around the Kobe and Hanshin areas was measured after the earthquake occurred. The gravity data at 4800 points was used to analyze the underground structure in the Osaka sedimentary basin, which is mainly comprised of Mesozoic granitic basement and
post Miocene sedimentary layers covering the basement. Figure 11 shows the Bouguer anomaly in and around the Osaka Plain. In this gravity analysis the data collected and published by Professor Ryuuiti Shichi of Nagoya Univ. (Shichi and Yamamoto, 1994) is partially included.
Basement configuration plays an important role in the concentration, dispersion and transmission of seismic rays. Figure 12 shows the relationship between the depth of basement and observed gravity anomaly. Accordingly, the basement structure of the Osaka sedimentary basin was estimated from the Bouguer anomaly. In general, regional gravity effects should be removed from the meas-ured gravity values to know the relationship between the Bouguer anomaly and the depth of basements, it is possi-ble to directly interpolate the depth of basement from the Bouguer anomaly by deducting the regional effect.
In order to find the regional gravity effect in Osaka and the Hanshin area, the following relationship is assumed:
(1)
where GB is the Bouguer anomaly. X and Y are distances
from the origin (135•‹30'E, 34•‹40'N) measured eastwards
Fig. 10. Relationship between shear wave and compression wave
velocities in the Osaka sedimentary basin obtained from different
methods of measurement. Circle and triangle designate data from
seismic reflection exploration at Yodo River, bar is from Vp in
reflection and Vs in inversion of Rayleigh wave due to tremor and
dot is averaged from P-S logging. See the text for equations corre-
sponding to the solid and broken lines in this figure
Fig. 11. The Bouguer Anomaly in Hanshin and Osaka area.
Numerical values in figure show the anomaly with contour interval
of 1 mgal

22 NAKAGAWA ET AL.
and southwards, respectively, while Z is the depth of the 5ement rocks.The constants from A to L were determined by the
least square method using the data (X, Y, Z, GB) at 22 points where the depth of the basement rocks were known or the basement rocks were outcropped. Values of constants are given in Table 2. The residual Bouguer anomaly (after the regional gravity effect has been re-moved from the observed anomaly using eq. (1)) shows a linear relationship with the depth of basement rocks as shown in Fig. 13. Eventually, the following relationship between the depth of basement Z and the corrected Bouguer anomaly GB was obtained:
where R 2 is the correlation coefficient.
The configuration of basement rock in the Osaka
sedimentary basin is shown in Fig. 14 by means of con-
tour lines. The relief image is shown in Fig. 15. There is a
high possibility of the existence of faults in the zones
where anomaly contour lines are concentrated.
The present result based on Bouguel anomaly observa-
tion is consisted with information on the depth of base-
Fig. 12. Relationship between depth to top of basement rock and the
Bouguer Anomaly before removing the regional gravity effect
Fig. 13. Relationship between the depth to the top of basement rock
and the Bouguer Anomaly after removing the regional gravity
effect
Fig. 14. Configuration of top surface of basement rock in the Osaka
sedimentary basin. Numerical values in figure show the depth of
basement rock with contour interval of 0.1 km
Fig. 15. Relief picture of the imaged configuration of top surface of
basement rock in the Osaka sedimentary basin
Table 2. Value of constants A•`L for the equation giving the regional effects of the Bouguer anomaly in the Osaka Basin and the surrounding
area

GEOLOGICAL CHARACTERISTICS ON SEISMIC HAZARDS 23
ment rocks in both Hanshin and Osaka areas approximat-ed from some kind of geological surveys. Furthermore, the subsurface structure must be examined in detail by ap-
plying Talwani's method to the residual Bouguer anoma-ly (Talwani et al., 1959).
CONCENTRATIONS OF SEISMIC RAY DUE TOHORIZONTALLY HETEROGENEOUSSUBSURFACE STRUCTURE
Structure Model Composed of Homogeneous Layers with Curved Interfaces
As previously mentioned, many man made structures were damaged especially by liquefaction and associated
lateral displacement of filled ponds, valleys and river
channels as well as in man-made lands along the coastal
zone. Severe structural damage due to strong ground mo-
tions was also observed in the narrow zone along known
active faults and their extensions or along unknown bu-
ried faults. Even in the Osaka area 30-50 km east of the
epicenter, many engineering structures were damaged by
soil liquefaction and lateral displacement in reclaimed
filled river channels and irrigation ponds in inland areas,
especially along the old Yodo River. Further serious
damage to many engineering structures due to strong
ground motions was observed in the narrow zone along active faults as well as in reclaimed land along the coastal
zone as shown in Fig. 16. The damage seems to be very
Fig. 16. Distribution of damage to man-made structures in the Osaka area. A: Residential blocks where damage to man made structures was ob-served together with non-extensive subsurface failures. B: Blocks where extensive damage to man made structures was observed together with subsurface failures due to liquefaction, lateral displacement or slope instability. C: Active fault. D: Old coast line in 1885. E: Old coast line in the 1680s. F: Reclaimed river channel. G: Topographic contour line. H: Zone where damage was relatively larger than those in the adjacent area. Based on surveys by the Osaka City University Investigation Team on the Hanshin Great earthquake disaster.

24 NAKAGAWA ET AL.
much linked to the focusing of seismic waves. The paths
and amplitudes of seismic waves were examined on a ve-
locity structure model composed of four homogeneous
layers with curved interfaces defined by referring to the
result of the seismic reflection survey. Fig. 8 in the previ-
ous section shows an interpretation of the reflection
profile across the Uemachi Fault along the Yodo River. As the Uemachi Fault is about 45 km east from the
epicenter and trends nearly in the north-south direction,
it is reasonable to consider that seismic waves come from
the west in a direction perpendicular to the trend of the
fault. In order to examine the focusing of seismic rays, a
two-dimensional structure model composed of four
homogeneous layers is assumed with curved interfaces
referring to the seismic reflection profile mentioned
above. In order to examine the propagation of seismic
waves, both shapes of sedimentary layers and propaga-tion velocities in the layers must be determined with the
high accuracy. The shape of the interface particularly
〓ys an important role in the propagation of seismicwaves. It is difficult however to detect the detailed struc-
ture in the vicinity of the fault zone with the present tech-nical level of seismic reflection experiments. Therefore referring to the deformation of the upper part of sedimen-
tary layers, interfaces are simply approximated using an error function erf (ii) as follows:
where
Table 3 gives values of P and S wave velocity inhomogeneous layers and parameters defining functions
〓x) for three interface.
Ray Tracing in a Model Composed of Homogeneous Lay-ers with Curved Interfaces
It is sufficient to consider the effect of refraction at the interface in the present model since a seismic ray goes
straight within a layer of a constant velocity and changes its direction at the interface. Let ni be a unit vector
parallel to the ray within the j-th layer. When a ray is transmitted from the j-th layer of velocity v./ into the
(j + 1)-th layer of velocity vj+1 through an interface, ac-cording to Cerveny et al. (1977)'s formulation, the rela-tion between a vector nj for the incident wave and ni+i for the transmitted wave is expressed by
where Mj= vi+i/ vj, /Vj is a unit vector normal to the j-th interface and directed toward the (j + 1)-th layer, and
It is noted that Ai is always positive because Ni is directed
toward the (j + 1)-th layer.
Figures 17(1) and (2) give examples of ray fields for P
and S waves, respectively. They show that seismic rays
tend to focus at the vicinity of the fault zone in the subsid-
ed block regardless of the directions of incident waves
although the focusing site depends on the incident angle.
Considering the distance from the epicenter, it may be as-
sumed that seismic waves are incident on the basement
rocks at about 40•‹ from the west. Ray fields around the
Uemachi Fault are approximated by Fig. 17(1) (c) for P
waves and by Fig. 17(2) (c) for S waves. These figures
represent that seismic rays focus strongly in a narrow
zone just west of the fault zone to cause intense ground
motions. The result shows good agreement with the distri-
bution of damages. In addition, it can be seen from the
figures that arrivals of seismic rays are very limited in a
wide zone above the fault zone, indicating weak ground
(a)
(b)
(c)
(1)
(a)
(b)
(c)
(2)
Table 3. Model of underground structure across the Uemachi Fault
Fig. 17. Refraction pattern of seismic rays for P (1) and S (2) waves
incident at equal intervals on the bottom of the model of homogeneous layers separated by curved interfaces. Parameters of
velocity structure are given in (a). (a): Incident angle (5=0'; (b):
δ=-30°;(c):δ=300

GEOLOGICAL CHARACTERISTICS ON SEISMIC HAZARDS 25
motions. This explains partly observations that damage
is slight in the Uemachi Uplift east of the fault, although
this slight damage is mainly due to the effect of the good
subsoil conditions; the sedimentary layers in the
Uemachi Uplift are thin and stiff relative to those in the
western subsided block.
It is probable that the focusing of seismic waves also ex-
plains relatively high damage in the area south of the
Itami Fault. The effect of focusing however fails to ex-
plain damage in the zone south of the Nobata Fault be-
cause the zone lies in the uplifted block.
Quantitative Estimation of Ray Density and Amplitude
In order to evaluate the effect of focusing quantitative-
ly, the amplitude of SH wave incident on the basement
rock was calculated as plane waves considering only two
effects of the transmission coefficient at the interface and
the geometrical displacement, based on Cerveny et al.
(1977)'s ray method. When SH waves are incident at an
angle Įj on an interface from a medium of density p; and
velocity ƒÀj and are transmitted at an angle Of into a medi-
um of density pi+i and velocity M+ 1, the transmission
coefficient R; is calculated by
The total effect of transmission coefficient becomes
where m is the number of interfaces. The effect of geo-
metrical spreading is evaluated by
where O is the angle of incidence on the j-th interface, 0; is the angle of transmission. The factor F representing the change in a cross-sectional area of a ray tube is ap-
proximated by
where A x represents the difference of x-coordinates of
the points where two neighboring rays impinge at the bot-
tom of the model and A x' represent the difference of x-
coordinates of the points where two rays arrive at the
ground surface, and 6 gives an angle of incidence on the
surface.
Figure 18 represents one example of these calculations.
Figure 18(a) shows the refraction pattern of S waves inci-
dent on the basement from the west at angle of 40•‹.
Figure 18(b) shows the density of rays arriving at the sur-
face. The density is approximated by the number of rays
in 75 small intervals among 4000 rays of SH waves which
arrive at the surface within a horizontal distance from 0
m to 4000 m. It is emphasized in Fig. 8(b) again that an
extremely high concentration of rays occurs at the nar-
row zone just west of the fault zone but the arrival is
limited in a wide zone above the fault zone.
The amplitude of SH wave at the ground surface is esti-
mated by computing Q and L for 4000 rays of SH waves
(c)
(b)
(a)
arriving within a horizontal range from 0 m to 4000 m. As Q and L give the same values in the area where inter-faces are parallel to each other on both sides of the fault zone, the amplitude of each ray is normalized by that of the ray through horizontal layers in both sides of the fault zone. Figure 18(c) gives the normalized amplitude for each individual ray at the surface on a log scale. It should be noted that we discuss here only the effect of focusing of seismic rays but we do not consider the am-
plification due to the multiple-reflection in the calcula-tion of the amplitude. It is expected based on Fig. 18(c) that the amplitude increases by over one order of magni-tude at the very narrow focusing location just west of the fault zone and decreases by about one tenth in a wide zone above the fault zone. The above calculation however seems to overestimate ground motions when we consider an assumption of the ray theory that the wave length is considerably smaller than any characteristic
quantity of length dimension such as radius of curvature of the interface and thickness of the layer. Because the wave length, say ten meters long even for 10 Hz wave, is not negligible in the present model, we should consider that contrast of the amplitude is not so extremely large as Fig. 18(c) shows. Further as shown in Fig. 18(a), it is very
Fig. 18. Quantitative estimate- of focus of seismic rays for SH waves
incident at an angle of 40•‹ on the bottom of the model: (a)
Refraction pattern of seismic rays. (b) Density of rays
approximated by numbers of rays in 75 small intervals among 4000
rays which arrive at the surface within a horizontal distance from
0 m to 4000 m; (c) Normalized amplitude of 4000 rays at the
surface on a log scale
26 NAKAGAWA ET AL.
(a)
(b)
(c)
(d)
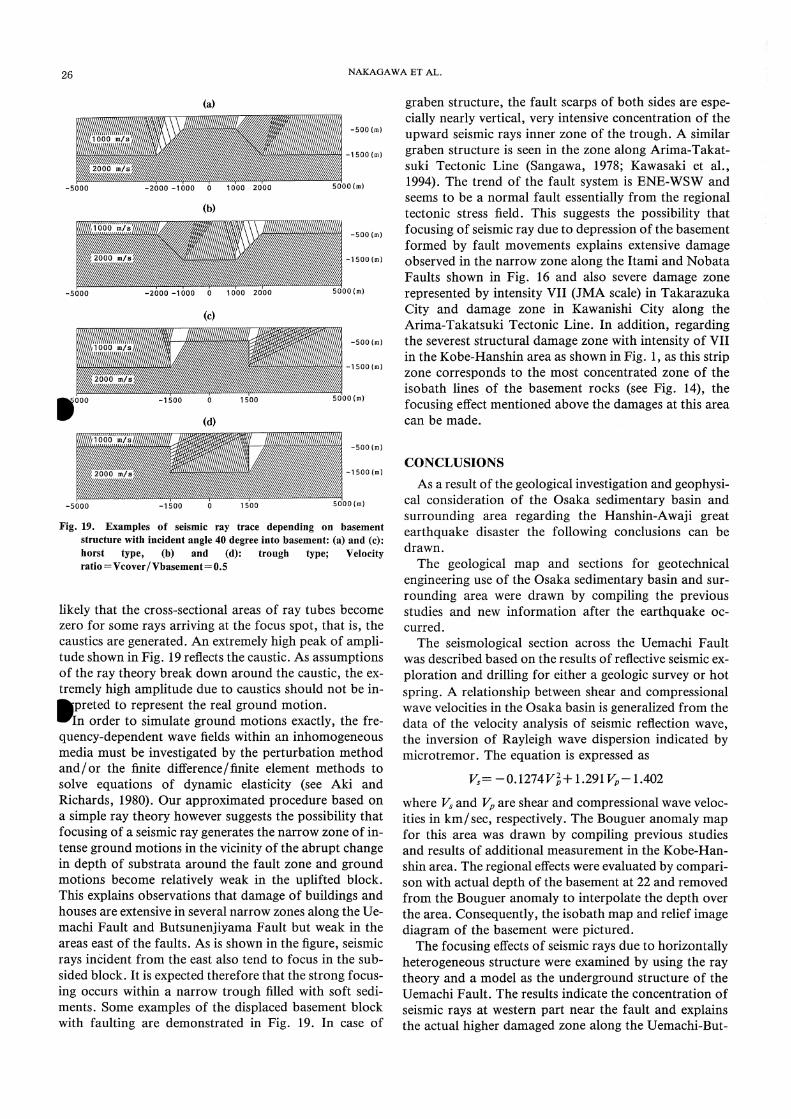
likely that the cross-sectional areas of ray tubes become
zero for some rays arriving at the focus spot, that is, the
caustics are generated. An extremely high peak of ampli-
tude shown in Fig. 19 reflects the caustic. As assumptions
of the ray theory break down around the caustic, the ex-
tremely high amplitude due to caustics should not be in-
〓preted to represent the real ground motion.
In order to simulate ground motions exactly, the fre-
quency-dependent wave fields within an inhomogeneous media must be investigated by the perturbation method and/ or the finite difference /finite element methods to solve equations of dynamic elasticity (see Aki and Richards, 1980). Our approximated procedure based on a simple ray theory however suggests the possibility that focusing of a seismic ray generates the narrow zone of in-tense ground motions in the vicinity of the abrupt change in depth of substrata around the fault zone and ground motions become relatively weak in the uplifted block. This explains observations that damage of buildings and houses are extensive in several narrow zones along the Ue-machi Fault and Butsunenjiyama Fault but weak in the areas east of the faults. As is shown in the figure, seismic rays incident from the east also tend to focus in the sub-sided block. It is expected therefore that the strong focus-ing occurs within a narrow trough filled with soft sedi-ments. Some examples of the displaced basement block with faulting are demonstrated in Fig. 19. In case of
graben structure, the fault scarps of both sides are espe-cially nearly vertical, very intensive concentration of the upward seismic rays inner zone of the trough. A similar
graben structure is seen in the zone along Arima-Takat-suki Tectonic Line (Sangawa, 1978; Kawasaki et al., 1994). The trend of the fault system is ENE-WSW and seems to be a normal fault essentially from the regional tectonic stress field. This suggests the possibility that focusing of seismic ray due to depression of the basement formed by fault movements explains extensive damage observed in the narrow zone along the Itami and Nobata Faults shown in Fig. 16 and also severe damage zone represented by intensity VII (JMA scale) in Takarazuka City and damage zone in Kawanishi City along the Arima-Takatsuki Tectonic Line. In addition, regarding the severest structural damage zone with intensity of VII in the Kobe-Hanshin area as shown in Fig. 1, as this strip zone corresponds to the most concentrated zone of the isobath lines of the basement rocks (see Fig. 14), the focusing effect mentioned above the damages at this area can be made.
CONCLUSIONS
As a result of the geological investigation and geophysi-cal consideration of the Osaka sedimentary basin and surrounding area regarding the Hanshin-Awaji great earthquake disaster the following conclusions can be drawn.
The geological map and sections for geotechnical engineering use of the Osaka sedimentary basin and sur-rounding area were drawn by compiling the previous studies and new information after the earthquake oc-curred.
The seismological section across the Uemachi Fault was described based on the results of reflective seismic ex-
ploration and drilling for either a geologic survey or hot spring. A relationship between shear and compressional wave velocities in the Osaka basin is generalized from the data of the velocity analysis of seismic reflection wave, the inversion of Rayleigh wave dispersion indicated by microtremor. The equation is expressed as
where V, and V, are shear and compressional wave veloc-ities in km/ sec, respectively. The Bouguer anomaly map for this area was drawn by compiling previous studies and results of additional measurement in the Kobe-Han-shin area. The regional effects were evaluated by compari-son with actual depth of the basement at 22 and removed from the Bouguer anomaly to interpolate the depth over the area. Consequently, the isobath map and relief image diagram of the basement were pictured.
The focusing effects of seismic rays due to horizontally heterogeneous structure were examined by using the ray theory and a model as the underground structure of the Uemachi Fault. The results indicate the concentration of seismic rays at western part near the fault and explains the actual higher damaged zone along the Uemachi-But-
Fig. 19. Examples of seismic ray trace depending on basement structure with incident angle 40 degree into basement: (a) and (c): horst type, (b) and (d): trough type; Velocity ratio = Vcover/ Vbasement = 0.5
GEOLOGICAL CHARACTERISTICS ON SEISMIC HAZARDS 27
sunenjiyama Fault. In addition, the underground struc-ture showing depression of seaward basement block at the heavy damaged zone with intensity VII in Kobe-Han-shin area is suggested to be one of the important causes of serious structural damage.
ACKNOWLEDGMENTS
We wish to thank members of the Osaka City Univer-
sity investigation team on the Hanshin Great earthquake disaster, particularly, Drs. S. Masumoto, M. Mitamura, Miss. N. Kitada, Mrs. K. Ryoki and S. Senda for many helpful discussions and considerable assistance and we also wish to thank Dr. R. Shichi of Nagoya University for his help to use in part the database on the gravity. The authors are also grateful to the reviewer of this paper for helpful suggestions.
REFERENCES
1) Adachi T., Nakagawa K., Suwa S. and Yamamoto K. (1994): "Un-derground structure and geological characteristics on deep grounds in Kansai Area," in "Application and technology on the under-
ground space in Kansai Area", Kansai Br., Japan Soc. Civil Eng., pp. 35-66 (in Japanese).
2) Aki, K. and Richards, P. G. (1980): Quantitative Seismology II, W. H. Freeman and Co., San Francisco.
3) Aoki, Y., Ozaki, M., Tsujimoto, A., Horike, M. and Takeuchi, Y.
(1990): "Estimation of S-wave velocity structure in the Osaka Plain," Proc. Kinki Br., Arch. Inst. Japan, pp. 341-344 (in Japanese).
4) Calamity Science Institute (1984): Geological Survey of the Subma-rine Strata at the Kansai International Airport in Osaka Bay, Cen-tral Japan, Calamity Science Institute (in Japanese).
5) Cerveny, V., Molotkov, I. A. and Psencik, I. (1977): Ray Method in Seismology, Univerzita Karlova,- Praha.
6) Geographical Survey Institute (1966): "Land-use map (Tochi-jokenzu)," Part of Kobe Area (in Japanese).
7) Geographical Survey Institute (1983): "Land-use map (Tochijokenzu)," Part of Northwestern Osaka (in Japanese).
8) Hirano, M. and Hada, S. (1995): "Fault activity and displacement in western Kobe City caused by Hyogoken-Nambu earthquake," The Proceedings of Symposium on the Great Hanshin Awaji Earth-quake and its Geo-environments, The Committee of Environmen-tal Geology, Geological Society of Japan, pp. 74-84 (in Japanese with English abstract).
9) Horike, M. (1985): "Inversion of phase velocity of long-period microtremors to the s-wave velocity structure down to the base-ment in urbanized area," Jour. Phys. Earth., Vol. 33, pp. 59-96.
10) Huzita, K. (1962): "Tectonic development of the median zone
(Setouti) of southwest Japan, since the miocene," Jour. Geosci., Osaka City Univ., Vol. 6, pp. 103-144.
11) Huzita, K. (1966): Tectonic Significance of Osaka Bay, on Papers in honor of Professor Susumu Matsushita upon his retirement, pp. 133-141 (in Japanese).
12) Huzita, K. and Maeda, Y. (1971): "Itami terrace with special refer-ence to the Late Pleistocene transgression in Japan," Jour. Geosci., Osaka City Univ., Vol. 14, pp. 53-70.
13) Huzita, K., Kishimoto, Y. and Shiono, K. (1973): "Neotectonics and seismicity in the Kinki area, Southwest Japan," Jour. Geosci., Osaka City Univ., Vol. 16, pp. 93-124.
14) Huzita, K. and Kasama, T. (1982): Geology of the Osaka-Sei-hokubu District, Quadrangle Series, Scale 1:50,000, Geol. Survey, Japan (in Japanese with English abstract).
15) Huzita, K. and Kasama, T. (1983): Geology of the Kobe District,
Quadrangle Series, Scale 1:50,000, Geol. Survey, Japan (in
Japanese with English abstract).16) Huzita, K. and Maeda, Y. (1984): Geology of the Suma district,
Quadrangle Series, scale 1:50,000, Geol. Surv. Japan, (in Japanese with English abstract).
17) Huzita, K. and Maeda, Y. (1985): Geology of the Osaka-Seinambu district, Quadrangle Series,scale 1:50,000, Geol. Surv. Japan (in Japanese with English abstract).
18) Irikura, K. and Y. Fukushima (1995): "Attenuation characteristics of peak amplitude in the Hyogoken-Nambu earthquake deter-mined by near-field strong motion modeling, Preliminary results," Jour. Natural Disas. Sci., Vol. 16(3), pp. 47-58.
19) Itihara, M., Ichikawa, K. and Yamada, N. (1986): "Geology of the Kishiwada district," With Geological Sheet Map at 1:50,000, Geol. Surv. Japan (in Japanese with English abstract).
20) Itihara, M. (1991): "Quaternary geological map of Osaka and sur-rounding area," Urban Kubota, No. 30 (in Japanese).
21) Itihara, M. (1993): "The Osaka Group," edited by M. Itihara, Sogensha Co. Ltd. (in Japanese with English abstract).
22) Iwabuchi, Y., Kasuga, S., Uchida, A., Kokuta, S., Okino, K., Shimura, E. and Nagata, S. (1995): "Faults and seafloor deforma-tion near the source region of 1995 Hyogoken-Nambu earth-
quake," The Proceedings of Symposium on The Great Hanshin-Awaji Earthquake and its Geo-environments, The Committee of Environmental Geology, Geological Society of Japan, pp. 85-90
(in Japanese with English abstract).23) Iwasaki, Y. (1988): "In-situ seismic velocity and its relationship
with soil characteristics in Osaka Bay," Earthquake Engineering and Soil Dynamics II, Geotech. Special Pub. No. 20, ASCE, pp. 290-304.
24) Iwasaki, Y., Kagawa, T., Sawada, S., Matsuyama, N., Ohshima, K., Ikawa, T. and Onishi, M. (1994): "Basement structure by air-gun reflection survey in Osaka Bay, Southwest Japan," ZISIN (Jour. Seism. Soc. Japan), Vol. 46, pp. 395-403 (in Japanese with English abstract).
25) Iwasaki, Y., Matsuyama, N., Kagawa, T. and Sawada, S. (1992): "Geological structure and developing process of Osaka Basin ," Symposium on the Geologic structure and the state of the arts on soil characteristics of the Kansai Ground, pp. 119-126 (in Jap-anese).
26) Jackson, P. S. (1970): "The focusing of earthquakes," Bull. Seism. Soc. Am., Vol. 61, pp. 685-695.
27) Kansai Br., JSCE (1994): "Application and technology on the un-derground space in the Kansai Area," Text of the technical course, Kansai Br., JSCE (in Japanese).
28) Kansai Br., JSSMFE and Kansai Geotech. Consultants Assoc. (1987): The Ground of Osaka (Revised edition), Kansai Br., JSSMFE (in Japanese).
29) Kansai Br., JSSMFE and Committee on application and technolo-
gy on the underground space in the Kansai Area (1992): The Ground of Kansai (Kansai Jiban), Kansai Br., JSSMFE (in Japanese).
30) Kansai Br., JSSMFE (ed) (1995): The submarine strata (Kaitei Jiban) Kansai Br., JSSMFE (in Japanese).
31) Kasama T., Kishimoto (1974): Kobe and the Earthquake, Kobe Municipal Office, (in Japanese).
32) Kawasaki, S., Toda, S., Nakagawa K. and Kobayashi, Y. (1994): "Seismic reflection exploration in the eastern part of the Arima-
Takatsuki Tectonic Line, Kinki District, Central Japan," ZISIN
(Jour. Seism. Soc. Japan), Vol. 47, pp. 173-182 (in Japanese with English abstract).
33) Kitsunezaki, C. (1980): "A new method for shear wave logging," Geophysics, Vol. 45, pp. 1489-1506.
34) Kobe Municipal Office (1980): The Ground of Kobe, Kobe Municipal Office (in Japanese).
35) Mitamura, M. and Osaka City University Investigation Team of the Hanshin Great Earthquake Disaster (1995): "Ground failures due to the 1995 Hyogo-ken Nambu earthquake and artificial altera-tion of topography," The Proc. Symp. on the Great Hanshin-Awa-ji Earthquake and its Geo-environments, The Committee of En-vironmental Geology, Geological Society of Japan, pp. 209-214 (in
28 NAKAGAWA ET AL.
Japanese with English abstract).36) Mizuno, K., Hattori, H., Sangawa, A. and Takahashi, Y. (1990):
"Geology of the Akashi district ." With Geological Sheet Map at 1:50,000, Geol. Surv. Japan (in Japanese with English abstract).
37) Nakagawa, K. (1990): "Ground survey at large depth in Kansai Area, Southwest Japan.—In special reference to Osaka Ground," Proc., Symp., Ground characteristics at the depths in Kansai Area, Kansai Br., JSSMFE, pp. 63-88 (in Japanese).
38) Nakagawa, K., Mitamura, M., Harada, T., Shirakata, K. and Yokota, H. (1993): "Shear-wave vibroseis survey of deep struc-tures in Osaka basin," Proc. 88-th SEGJ Conf., Soc. Expl. Geophys. Japan, pp. 418-423 (in Japanese).
39) Nakagawa, K., Mitamura, M., Uda, H., Uno, K., Toda S., Kawasaki S. and Yokota H. (1994): "Seismic reflection survey on north part of Ikoma Fault, east end of Osaka Plain," Proc. 90th SEGJ Conf., pp. 201-205 (in Japanese with English abstract).
40) Nakagawa, K. and Osaka City University Investigation Team on the Hanshin Great Earthquake Disaster (1995a): "Earthquake
ground failure in and arround Osaka area and the subsurface struc-ture," Proc. of Urgent Joint Meeting on the Great Hanshin Eear-thquake, Japan Soc. Geol., Japan Soc. Eng. Geol., Fault Res. Data Center and OCU. Invest. Team on Great Hanshin Earthq.
pp. 92-108 (in Japanese).〓) Nakagawa, K. and Osaka City University Investigation Team on
the Hanshin Great Earthquake Disaster (1995b): "A relation be-tween earthquake ground failure and structure," Proc. Symp., on the Great Hanshin-Awaji Earthquake and its Geo-environments, the Committee of Environmental Geology, Geological Society of Japan, pp. 233-238 (in Japanese with English abstract).
42) Nakagawa, K., Ryouki, K., Muto, N., Nishimura, S. and Ito, K.
(1991): "Gravity anomaly map and inferred basement structure in Osaka Plain, Central Kinki, Southwest Japan," Jour. Geosci. Osa-ka City Univ., Vol. 34, pp. 103-117.
43) Nakaseko, K., Takemura, K., Nishiwaki, N., Nakagawa, Y. and Yamauchi, M. (1984): "Stratigraphy of the submarine strata at the Kansai International Airport in Osaka Bay off Senshu, Central Japan," Geological survey of the submarine strata at the Kansai International Airport in Osaka Bay, Central Japan, Rept., Calami-ty Sci. Inst., pp. 191-198 (in Japanese).
44) Sangawa, A. (1978): "Fault topography and Quaternary faulting along the middle and eastern parts of the Arima-Takatsuki Tecton-ic Line, Kinki district, Central Japan," Geographical Review of
Japan, 51-10, pp. 760-775 (in Japanese with English abstract).
45) Sano, M. (1980): "Geological structure of the Northern Nara Ba-
sin," Guidebook on Land-developments and geotechnical prob-
lems of the region from Nara to Kyoto Region, Kansai Br., Japan
Soc. Engin. Geol., pp. 13-25 (in Japanese).
46) Seo, M. (1995): "Damage to ground along the Arima-Takatsuki
Tectonic Line," Proc., Urgent Joint Meeting on Hanshin Great
Earthquake Disaster. Japan Soc., Geol., Japan Soc. Eng. Geol.,
Kansai Geotech. Cons. Assoc., Fault Res. Data center and Osaka
City Univ. on Invest. Team, Hanshin Great Earthq., pp. 56-61.
47) Shichi, R. and Yamamoto, A. (1994): "A gravity database of
Southwestern Japan compiled at Nagoya University," Rept. Geol.
Survey, Japan, No. 280, pp. 1-28 (in Japanese with English ab-
stract).
48) Takahashi, Y., Sangawa, A., Mizuno, K. and Hattori, H. (1992):
"Geology of the Sumoto district," With Geological Sheet Map at
1:50,000, Geol. Surv. Japan (in Japanese with English abstract).
49) Talwani, M., Worzel, J. L. and Landisman, M. (1959): "Rapid
gravity computation for two dimensional bodies with application
to the Mendosino submarine fracture zone," Jour. Geophys. Res.,
Vol. 64, pp. 49-59.
50) The Research Group for Active Faults of Japan (1991): Active
Faults in Japan. Sheet Maps and Inventories (Revised Edition),
Univ. of Tokyo Press, Tokyo (in Japanese with English Summary).
51) Toki, K., Irikura, K. and Kagawa, T. (1995): "Strong motion
records in the source area of the Hyogoken-nambu earthquake,
January 17,1995, Japan," Jour. Natural Disas. Sci., 16(2), pp. 23-
30.
52) Yamamoto, E., Nakagawa, K., Mitamura, M., Toda, S., Nishida,
T., Terada, Y., Uda, H., and Yokota, H. (1992): "Seismic reflec-
tion method at the Central Osaka Plain—Yodo River
(Juso•`Kunijima) Line-," Proc. 1992's Annual Meeting, Kansai
Branch, Japan Soc. Eng. Geol., pp. 185-188 (in Japanese).
53) Yoshikawa, S., Iwasaki, Y., Ikawa, T., Kuroda, T. and Yokota,
H. (1987): "Reflection seismic survey of the Median Tectonic Line
in Wakayama Prefecture, Japan," Proc., 77th SEGJ Conf., pp.
46-49 (in Japanese with English abstract).
54) Yoshikawa, S., Machida, Y., Teramoto, M., Yokota, H., Nagao,
H. and Kagiwara, M., (1987): "Reflection seismic survey in Osaka
City," Proc. 77th SEGJ Conf., pp. 114-119 (in Japanese with Eng-
lish abstract).